Abstract
We are witnessing the emergence of new big data processing architectures due to the convergence of the Internet of Things (IoTs), edge computing and cloud computing. Existing big data processing architectures are underpinned by the transfer of raw data streams to the cloud computing environment for processing and analysis. This operation is expensive and fails to meet the real-time processing needs of IoT applications. In this article, we present and evaluate a novel big data processing architecture named RedEdge (i.e., data reduction on the edge) that incorporates mechanism to facilitate the processing of big data streams near the source of the data. The RedEdge model leverages mobile IoT-termed mobile edge devices as primary data processing platforms. However, in the case of the unavailability of computational and battery power resources, it offloads data streams in nearer mobile edge devices or to the cloud. We evaluate the RedEdge architecture and the related mechanism within a real-world experiment setting involving 12 mobile users. The experimental evaluation reveals that the RedEdge model has the capability to reduce big data stream by up to 92.86% without compromising energy and memory consumption on mobile edge devices.
1. Introduction
Cloud computing systems provide highly virtualized computing, networking, and storage services on top of massively parallel distributed systems [1,2,3]. However, clouds were initially introduced as utility computing models to fulfill the processing requirements of enterprise applications [1]. The voluminous and high speed data streams in IoT-based big data systems increase the network traffic of the cloud, which challenges the big data management capabilities [4]. Recent literature provides some evidence whereby different data reduction methods enable big reduction in clouds [5]. These data reduction methods are mainly based on: (1) network theory-based methods, whereby graph mapping and optimization algorithms reduce high dimensional big data streams into low dimensional datasets [6,7]; (2) compression algorithms are applied in order to reduce the volume of network traffic [8,9]; (3) data deduplication methods eliminate redundant and duplicated data [10,11]; (4) feature extraction and data filtration methods are applied in order to reduce the data streams at early stages [12,13]; and (5) data mining and machine learning techniques help with data reduction at early stages of big data through preprocessing [14,15] and prediction. Existing methods are applied for big data reduction in the context of clouds. However, there exists an opportunity to reduce big data streams even before entering the cloud.
Considering IoT-cloud communication models and the big data generated by mobile edge devices and applications, the cloud-centric big data processing results in increased latency and incremental data transfer cost. In addition, it increases the in-network data movement inside the cloud [16,17,18]. Recently, mobile edge cloud computing (MECC) emerged as a solution to enable the extension of centralized cloud services to the edge of the network through edge servers [19,20,21,22,23]. These edge servers reside at one-hop communication distances from mobile edge devices (see Figure 1); hence, they can meet the real-time needs of IoT applications. However, the decision of data processing in different layers across MECC depends on many factors, such as the capability of devices in MECC, the availability of these devices, the application profile (e.g., real time) and the data analytic tasks employed by the application. Hence, moving data processing from the cloud to MECC is not a trivial task.
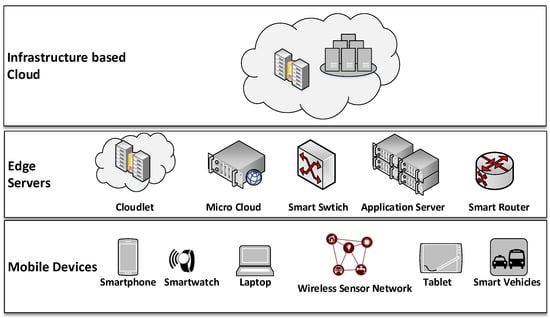
Figure 1.
The mobile edge cloud computing (MECC) architecture.
Based on the computational capabilities of mobile edge devices [24,25], we envision a novel data processing architecture called RedEdge i.e., the term is derived from the process of data reduction on the edge) [26]. The RedEdge model employs the mobile edge devices as a data reduction platform. In the case of the unavailability of computational and battery power resources at one mobile edge device, nearby mobile edge devices within the MECC environment are used to offload the data stream and processing. The RedEdge transforms MECC into a mobile edge collaborative platform. In the case of resource unavailability on mobile edge devices, the MECC system offloads data streams to the cloud.
This article contributes a novel big data processing architecture for MECC systems. The RedEdge architecture employs a novel big data reduction technique whereby the data stream-mining algorithm processes and uncovers knowledge patterns and stores the resultant data using local storage in mobile edge devices and synchronizing with cloud data stores. To this end, we propose a middle-ware architecture that utilizes the computational power from MECC systems and embeds three layers of data reduction in existing big data systems. The first layer reduces the data stream strictly in the same mobile edge device whereby the data sources reside. The second layer reduces the data stream by forming an ad hoc network of closer mobile edge devices and enabling collaborative data processing among connected devices. The third layer harnesses the cloud resources in order to reduce the data streams. To assess the performance of the RedEdge architecture, we conducted a real-world experimental study by recruiting 12 graduate students from the University of Malaya, Malaysia, and ran the experiments for 15 days. The experimental evaluation was performed in terms of memory consumption, battery power utilization, latency and reduced bandwidth utilization.
The rest of the article is organized as follows. Related works are presented in Section 2, followed by the problem statement in Section 3 and the RedEdge architecture in Section 4. Section 5 presents the formal modelling and analysis of the RedEdge architecture. The experimental evaluation and a discussion of the overall results are given in Section 6. Finally, the article concludes with Section 7.
2. Related Work
Traditionally, big data reduction is performed after storing data streams in large-scale clusters and data centres or clouds. A variety of methods is applied for data reduction; however, this mainly involves methodologies relevant to network theory, compression, data deduplication, dimension reduction, data preprocessing and data mining and machine learning.
Network theory-based methods convert unstructured, high dimensional and complex data streams into low dimensional structured data [6,7,27,28]. They extract topological structures from data streams and map them on to graph data structures. These methods further perform graph processing techniques to establish and optimize the relationships among mapped data. The optimized structures are represented as free-scale networks, small-world networks and random networks. The network theory-based methods are useful for data reduction; however, they require laborious efforts and high computational resources in order to find highly optimized datasets.
The compression-based data reduction helps with reducing the overall volume of big data that could be easily handled during in-network data movement in clusters and data centres [8,9,29,30]. However, these methods involve computational overhead of decompression. Despite preserving the original datasets, the compression-based method could not improve the quality of big data for data analytics. A few common compression-based big data reduction methods include gZip, parallel compression, anamorphic stretch transform, sketching, compression sensing, spatio-temporal compression and adaptive compression.
Big data storage in cloud data centres is performed in highly duplicated settings whereby multiple copies of the same datasets are stored in different storage servers in the same rack of servers or different servers across the clusters [10,11,31,32]. The data duplication is performed to meet the service level agreements (SLAs) for high availability; however, this costs extra storage spaces and computational power for data processing. Therefore, big data systems need to perform cluster level and node level data deduplication in order to eliminate redundant datasets and improve the quality of data for big data analytic algorithms.
Big data reduction during data preprocessing is the right method for early reduction [12,33,34,35]. The early data processing helps with reducing the data storage cost, as well as the computational cost that may be incurred at later stages. Existing literature discusses a variety of big data preprocessing methods, such as semantic analysis of big datasets using linked data structures and ontologies, data filtration using URL filtration methods, low memory pre-filters for streaming data and 2D peak detection methods. Although a few works adopted existing conventional methods, there exists a research gap to find new data preprocessing methods for big data reduction.
High dimensionality in big datasets arises due to the emergence of thousands or millions of attributes, and it is the norm rather than the exception in the case of big datasets. Researchers adopted dimension reduction methods in order to deal with the curse of high dimensionality [36,37,38,39,40,41]. The dimension reduction methods process the high dimensional unstructured big datasets and convert them into low dimensional structured datasets. Researchers proposed a few dimension reduction methods such as dynamic quantum clustering, BIGQuic, the map-reduce implementation of k-means clustering algorithms, online feature selection, tensor networks and optimization, feature hashing, critical feature dimension reduction approaches and incremental partial least square methods. Although feasible for big data reduction, the dimension reduction methods require a massive amount of computational resources.
Data mining and machine learning algorithms are another variant of big data reduction methods [14,42,43]. These methods process the data streams by performing supervised, unsupervised, semi-supervised and deep learning models. The data mining and machine learning methods are quite useful due to early knowledge discovery from big data streams. The methods are useful for real-time big data analytics where multiple learning models at different levels of big data systems filter the data streams and uncover the knowledge patterns in parallel.
The literature review reveals that existing big data reduction methods work as cloud-centric approaches [5]. However, our RedEdge architecture adopts the IoT device-centric approach for big data reduction. The RedEdge provides support for the deployment of data mining and machine learning-based big data reduction schemes. The architecture extends the capabilities of our previous work presented in [26,44]. This article presents a detailed discussion on the big data reduction strategy. In addition, the article presents formal verification and validation of the overall functionalities using Petri nets. Moreover, a thorough experimental evaluation of RedEdge architecture is presented in this article.
3. The Case for a Multi-Layer Far-Edge Computing Architecture for Big Data Reduction
Let us consider the five-layer IoT reference architecture of fog computing systems introduced by Cisco (see Figure 2) [23,45]. The physical layer at the lowest level facilitates data acquisition from mobile edge devices using onboard and offboard sensory and non-sensory data sources. The communication layer at the second level enables connectivity and data transfer from mobile edge devices to fog servers. The data aggregation layer provides functionality to aggregate data streams from connecting devices and performs data filtration operations in order to transfer useful raw data streams in clouds. The analytics layer ensures the availability of data analysis services through cloud service providers. Finally, the application layer provides functionalities to interact with IoT applications.
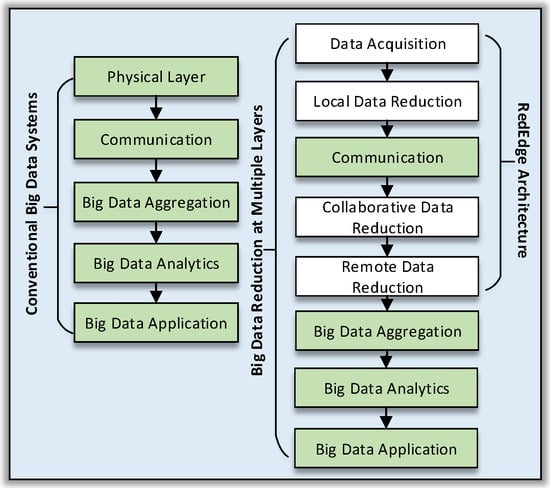
Figure 2.
IoT reference architecture. RedEdge, data reduction on the edge.
Existing reference architectures have multiple issues at each layer [20,46]. The mobile edge devices perform data collection operations and transfer raw data streams in edge servers. This data collection strategy increases the cost of data communication among mobile edge devices and fog servers. Secondly, fog servers are bounded by physical locations; therefore, mobile edge devices need to be in proximity to benefit from cloud services. Thirdly, big data processing and analytic components are provided through centralized services, hence increasing the computational burden in clouds. Fourthly, the IoT applications are built on top of clouds; therefore, fog computing architectures involve high coupling among application components at different layers. In addition, this requires persistent Internet connections to benefit from IoT applications.
Considering these limitation, we propose a new middleware architecture for IoT-based big data applications. The architecture reduces big data streams by enabling maximum resource provisioning near the data sources. The architecture is designed to perform early analytic operations over data streams in order to aggregate knowledge patterns in place of raw data streams.
The RedEdge architecture embeds three layers of data analytics for big data reduction. At the first layer, mobile edge devices perform data analytic operations for local data reduction using onboard computational resources. However, in the case of resource scarcity, the nearby mobile edge devices form an ad hoc network. The mobile edge devices other than source devices provide services for collaborative data reduction and perform required analytic operations on offloaded data streams. In this case, if there is no nearby mobile edge device or the required resources are not available at connected mobile edge devices, the data streams are offloaded to clouds, which initiates the required analytic services for remote data reduction. The reduced data streams are then shared with data aggregation servers either in fog edge servers or in cloud data centres.
4. RedEdge: An Architecture for Big Data Processing in MECC Environments
In this section, we present RedEdge, a novel architecture for big data processing in MECC environments. RedEdge enables big data reduction (see Figure 3) at three layers. These three layers are called the local analytics layer (LA) for onboard data reduction employed by the mobile edge device, the collaborative analytics layer (CA) for data reduction within the ad hoc network of mobile edge devices and the cloud-enabled analytics layer (CLA) for data reduction in clouds.
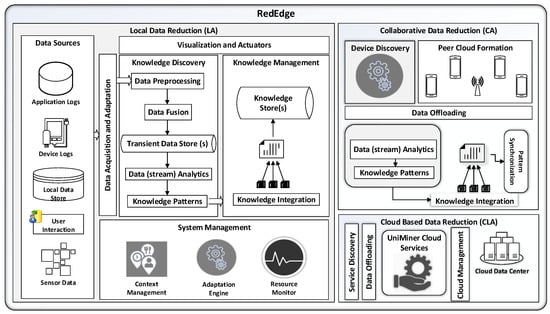
Figure 3.
RedEdge architecture. LA, local analytics layer; CA, collaborative analytics layer; CLA, cloud-enabled analytics layer.
4.1. Components and Operations for LA
At the LA layer, the RedEdge provides five modules for: (1) data acquisition and data adaptation; (2) knowledge discovery; (3) knowledge management; (4) visualization and actuation; and (5) system management.
4.1.1. Data Acquisition and Data Adaptation
The RedEdge applications start execution and run as back-end services in mobile edge devices. Primarily, these applications perform the intelligent data collection depending on the application requirements. The data collection strategy also varies in different applications. For example, some of the applications (like environmental monitoring apps) may collect continuous data streams, and some of the applications may collect situation-based or periodic data collection. The data adaptation strategies help control data rates in RedEdge applications.
4.1.2. Knowledge Discovery
The knowledge discovery module supports the execution of analytic components using onboard computational resources in mobile edge devices. The module provides different algorithms for data preprocessing operations such as noise reduction, outlier analysis, handling missing values and anomaly detection, to name a few. In addition, the data fusion components provide functionalities to fuse data streams from multiple homogeneous and heterogeneous data sources such as onboard and offboard sensors, as well as Internet-enabled social media data streams as used in social IoTs. Moreover, the module provides components for transient storage of fused data streams in mobile edge devices. Furthermore, the module provides a library of different data stream analytic algorithms in order to perform clustering, classification and association rule mining operations.
4.1.3. Knowledge Management
The knowledge patterns generated by the knowledge discovery module differ depending on the data analytics operations of IoT applications. The knowledge management module enables one to integrate the relevant knowledge patterns and to produce a summarized and globalized view of the overall data. The knowledge integration is made in a way that all processed data could be effectively represented, and the resultant data is stored in local data stores using light databases. However, the challenge of tracking the processed and unprocessed data points introduces complexity in the overall data management process. To address this issue, the RedEdge works with the principles of data parallelism where each chunk of raw data is tracked starting from the acquisition until the integration of knowledge patterns. The data parallelization ensures that each data chunk is processed at least one time; however, this approach increases the overall computational complexity.
4.1.4. System Management
The onboard resource dynamics and fast mobility create the issues of tracking mobile edge device locations and onboard available resources. The core functions of the system management module are the adaptation engine, the context monitor and the resource monitor. These functions ensure the robustness of the far-edge computing architecture in different scenarios. The adaptation engine ensures the execution of RedEdge components and data reduction in all three layers. In addition, the resource monitor and context manager periodically monitor available resources (memory, storage), locations (frequently-visited locations) and device-usage behaviour (charging, idle).
4.1.5. Visualization and Actuation
The visualization module ensures the local knowledge availability by enabling on-screen visualization. The studies show that local visualization is very useful for real-time applications. However, due to resource constraints and limited screen size, local knowledge visualization does not support a detailed knowledge view. The topic of visualization needs a detailed and thorough study; therefore, it is not covered further in this article. The actuation component is designed to ensure the interaction of mobile edge devices with external environments, which include remote cloud services and nearby peer mobile edge devices. This module ensures the future extensibility of RedEdge to other devices, systems and communication networks.
4.2. Components and Operations for CA
The discovery of other mobile edge devices and the available communication interfaces are key requirements for the ad hoc network formation of nearby mobile edge devices. The execution of knowledge discovery processes collaboratively and synchronizing resultant knowledge patterns are also challenging during collaborative data processing. The CA layer of RedEdge handles these issues to ensure seamless and collaborative data reduction.
4.2.1. Discovering Mobile Edge Devices and Communication Interfaces
The device discovery module handles two main issues. First, it discovers the mobile edge devices that may provide data processing services to other mobile edge devices. The source device in the network scans all connected communication interfaces and enlists all available mobile edge devices. The adaptation engine in RedEdge maintains and periodically updates a list of mobile edge devices for service utilization. The known devices are given priority over unknown devices. However, the list of known devices is maintained and updated whenever a new device is connected. This approach helps to seamlessly adapt to new and unknown environments for collaborative data reduction. The second main issue handled by RedEdge at this stage is to adapt and switch between different communication interfaces. It ensures seamlessly switching between different communications interfaces while maintaining the proximity of devices. This strategy helps to ensure maximum collaboration considering co-movement between different communication areas (such as Wi-Fi networks, public Internet facilities and home-networks).
4.2.2. Peer to Peer Network Formation
Once the mobile edge devices are found and the information about their communication interfaces is collected, the RedEdge initiates the P2P network formation process. The source device broadcasts the peer request to all proximal mobile edge devices, which collect the information about available onboard computational resources and send this back to the source device. The source device then performs the cost-benefit analysis in order to decide the favourability of data offloading. In the case of favourable data offloading, mobile edge devices offload the data stream to nearby mobile edge devices.
4.2.3. Data Offloading in Mobile Edge Devices
The decision about the favourability of data offloading is quite challenging due to resource dynamics in mobile edge devices and the availability of communication interfaces. Depending on the multi-objective approach of data offloading, the minimal energy consumption, reduced bandwidth utilization cost, performance enhancement and maximum data reduction are considered as the main objectives.
Existing studies show that energy consumption differs between different communication interfaces and the distance among different devices; therefore, the optimal choice of communication interfaces is a key element to decide about the favourability. Keeping in view the recommendations given in [47], RedEdge creates the priority list of communication interfaces and switches accordingly. This approach helps with the maximum energy gain while communicating with proximal devices. The optimal bandwidth utilization is achieved by RedEdge by distributing data streams into small and manageable chunks. In this case, the data chunk size is carefully determined by calculating the energy cost of local computations and communication over proximal networks. The data chunk size is kept as big such that proximal communication becomes favourable when compared with local computations. However, the size must be kept moderate such that the performance of serving mobile edge devices will not be compromised. In addition, the offloading decision depends on the amount of data that needs to be processed in mobile edge devices. In the case of an insufficient amount of data, the data offloading becomes unfavourable and consumes more energy and computational resources when compared with the amount of data reduced using onboard computational resources in mobile edge devices. Considering these objectives and constraints, the RedEdge devises the optimal offloading strategy for collaborative and remote data reduction in MECC systems. Further details about the offloading scheme are presented in [44] for interested readers.
4.2.4. Knowledge Discovery and Pattern Synchronization
Once the offloading is completed, the mobile edge devices execute the components from their knowledge discovery modules. However, this depends on the application design, whether the whole knowledge discovery process is executed at the mobile edge device or partial task execution is performed. In the case of complete execution, the source device offloads raw data streams, and the mobile edge device executes the complete knowledge discovery process from preprocessing to data mining and summarization of patterns. In the case of partial execution, the source device offloads only preprocessed data in order to lower the overall bandwidth utilization in the ad hoc network. However, the mobile edge device executes the rest of the knowledge discovery process, and the resultant patterns are synchronized with the source device. In this case, the source device could not receive the results from the mobile edge device for a specified time period, and the data streams are offloaded to any other available nearer mobile edge device. To lessen the transient storage burden and to reserve the maximum computational power, the garbage collection process is executed by RedEdge, and mobile edge devices delete all processed raw data streams periodically from the Random Access Memory (RAM) and the device’s local storage. Similarly, the source device deletes all processed data streams after receiving the corresponding knowledge patterns.
4.3. Components and Operations for CLA
RedEdge maintains a service repository of available cloud services. The requirements of cloud services vary; therefore, the service repository contains various services for remote data reduction in clouds. The choice of service is solely dependent on the needs of big data systems; however, RedEdge provides an interface to access all available services in the repository. The mobile application offloads the data in the cloud environment with the request for the required cloud services where the cloud service manager automatically runs the requested services and completes the task execution.
RedEdge provides seven types of services, which are designed for data uploading, data preprocessing, data fusion, data mining, pattern summarization, knowledge management and pattern synchronization. The data uploading services help with handling offloaded data streams. The raw data streams are uploaded in transient data stores in clouds. The data preprocessing, data fusion and data mining services are executed in order to process raw data streams and uncover new knowledge patterns. The pattern summarization and knowledge management services are used to integrate and summarize knowledge patterns both uploaded by mobile edge devices and produced by cloud services. The summarized knowledge patterns are stored in permanent data stores inside clouds. The pattern synchronization services transfer the knowledge patterns for data aggregation in big data systems.
5. Formal Modelling, Analysis and Verification
Considering the complexity of operations in the RedEdge architecture, we formally model the propose architecture in order to analyse and verify its operations using high level Petri nets (HLPN) [48], the satisfiability modulo theories library (SMT-Lib) [49] and the Z3solver [50]. The basic introduction to HLPN, SMT-Lib and the Z3 solver is provided by [51,52] to aid the readers’ understanding; therefore, further discussion on the topic is not made in this article.
The massive heterogeneity at all three layers of RedEdge introduces an unlimited amount of use cases and applications that are practically difficult to analyse and generalize in this research work. Therefore, considering the heterogeneity and complexity of operations in the RedEdge architecture, we formally model the propose architecture in order to analyse and verify its operations using high level Petri nets (HLPN) [48], the satisfiability modulo theories library (SMT-Lib) [49] and the Z3 solver [50]. The HLPN modelling approach is used in order to analyse the overall feasibility of RedEdge as a data reduction architecture. This approach has benefits over traditional Petri net models, which are more effective in specific use cases. However, the HLPN modelling approach has benefits in generalizing the data processing operations at each layer. The basic introduction to HLPN, SMT-Lib and the Z3 solver is provided by [51,52] to aid the readers’ understanding; therefore, further discussion on the topic is not made in this article.
Petri nets are used for graphical and mathematical modelling of a system and are applied to a wide range of systems, such as distributed, parallel, concurrent, nondeterministic, stochastic and asynchronous systems. For the formal modelling of RedEdge, we used a variant of the conventional Petri net called high level Petri net (HLPN). The HLPN simulates a system and provides its mathematical properties, which are used to analyse the behaviour of a system.
HLPN is based on a seven-tuple model , where P denotes a set of places, T refers to the set of transitions (such that , F denotes flow relation (such that , maps places P to data types, R denotes a set of rules for transitions and L is a label on F and , which represents the initial marking. provides information about the structure of the net, and provides the static semantics (i.e., information), which does not change throughout the system. In HLPN, places can have tokens of multiple types, which can be a cross product of two or more types. A few mapping examples include , , , and , where P1, P2 and P3 are the places of HLPN.
SMT is used for verifying the satisfiability of formulae over the theories under consideration. SMT-Lib provides a common input platform and benchmarking framework that helps with the evaluation of the systems. The usage of SMT is common in many fields, including deductive software verification. This thesis adopts the Z3 solver with SMT-Lib, which is a theorem prover developed at Microsoft Research. Z3 is an automated satisfiability checker that determines whether the set of formulas are satisfiable in the built-in theories of SMT-Lib. The HLPN model for the RedEdge framework is shown in Figure 4. We identify data types, places and mapping of data types to places. Data types and their mappings are shown in Table 1 and Table 2, respectively. In Figure 4, the rectangular black boxes represent transitions and belong to set T, whereas circles represent places and belong to set P.
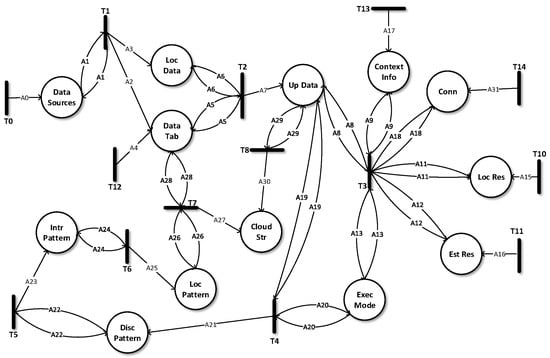
Figure 4.
RedEdge HLPN model.

Table 1.
Data types for RedEdge high level Petri nets (HLPN).

Table 2.
Places and mappings.
For each data collection phase, the information is initialized, and the data collection is started. The time series buffered data stream is created using , the temporary file name () and the system generated data sources’ ID (). RedEdge generates all unique IDs in the system at the time of application deployment. Therefore, these IDs remain constant until the application is installed on a device. When the collected data files reach a maximum threshold (i.e., the file size given by the application developer), the data file is stored on the onboard storage. In addition, a is maintained for each data file (called the data chunk). The shows the current processing status of any data chunk (zero for unprocessed, one for under-processing and −1 for processed). This is done at transition , and the transition is mapped to the following rule (see Equation (1)).
Once the sufficient data are collected, gathers data from and corresponding attributes (, and ) from and updates to “under-processed” (i.e., one). In addition, periodically cleans processed data from and updates accordingly. The data controlling rule at is mapped as follows (see Equation (2)).
After the establishment of the amount and type of data to be processed, collects , Conn, , and related information and executes the , which runs the execution rules and switches between all three execution modes (i.e., LA, CA or CLA). The rule for the selection of the execution mode is mapped at as follows (see Equation (3)).
collects the status, and in the case of LA and CA, data mining tasks are initiated locally. For LA, all data mining tasks are executed using onboard local resources. However, in the case of CA, data mining tasks are offloaded to peer-candidate devices, where each peer-candidate device acts as a standalone data mining platform. In addition, collects and schedules the data mining tasks accordingly. The at is mapped using the following rule (see Equation (4)).
Once the data mining tasks are executed successfully, the is evaluated at and is mapped as follows (see Equation (5)).
After refinement of into , the relevant patterns are summarized and merged at T6 using Equation (6). Depending on the configuration of each application, data patterns are marked as public, private or protected and stored locally at .
synchronizes with cloud data stores (). In addition, the of successfully executed is updated to “processed” (i.e., −1). The synchronization at is mapped using Equation (7). Consequently, whenever the Internet connection is available, neither LA, CA, or CLA is enabled, and there are some unsynchronized data patterns (); then, are synchronized with their respective counterparts in the cloud. However, data patterns need to be stored in different directories on the mobile edge devices to classify synchronized and unsynchronized versions.
Lastly, in the case of CLA, the raw data stream is uploaded to using the following rule (see Equation (8)).
The formal verification of HLPN (using the Z3 solver) determines that RedEdge is completely workable and executes according to specified properties. We also evaluated our RedEdge model using the PIPE+ editor [53], which provides a graphical interface to develop and analyse HLPN for bounded model checking (BMC) (see Figure 5).
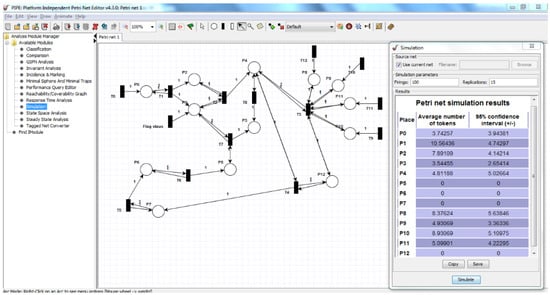
Figure 5.
PIPE+ Editor screenshot of RedEdge.
The traversal paths in HLPN are given in forward and backward incidence matrices generated using PIPE+ (see Table 3 and Table 4).

Table 3.
Forward incidence matrix.

Table 4.
Backward incidence matrix.
The results show that all places in the RedEdge are reachable when moving forward (see Table 3). Similarly, all places, except (Cloud Str), are reachable in reverse order (see Table 4). The (Cloud Str) is made irreversible to eliminate the loop in the data processing cycle.
BMC handles the state space explosion problem by executing a limited number of states. Therefore, BMC is applied over the finite set of transitions (M) using a linear temporal logic (LTL) formula (f) and given the upper bound value “k”. BMC determines an execution path of length “k” that satisfies the LTL formula. For BMC, first of all, a logic formula k is constructed from M, f and k and verified using the constraint solver. If an “f” is satisfied over a path of maximum length “k” in , then k is said to be satisfiable. In existential BMC, it is very hard to find the upper bound for “k”; therefore, the negated safety property is used for validation. The negation safety property determines the safety of the mode as long as f is not satisfiable. The HLPN model was translated to logic formulas and evaluated for its satisfiability. The tokens are distributed in different places in various markings on each state of HLPN. The detailed theory of HLPN mapping according to the SMT context is presented in [54] for interested readers.
In general, during safety (reachability) analysis, PIPE+ generated 3072 states and 38,592 arcs, creating a space explosion problem when and are enabled with one token on each place. The simulation results (see Table 5) show that all places are reachable, and it satisfies the safety property. The minimum thresholds, where all places are reachable, are 36 firings with five replications. Alternately, the maximum threshold is 10,000 firings with 15 replications. The simulation results with minimum and maximum thresholds are presented in terms of the average number of tokens produced at each place and the acceptable margin of error during each execution cycle. Consequently, we establish an argument that RedEdge is completely workable, and all places are reachable using specified rules.

Table 5.
Simulation results of the RedEdge HLPN model.
6. Performance Evaluation of the Proposed Data Reduction Strategy
To validate and demonstrate the effectiveness of the RedEdge architecture and the related data reduction strategy employed by the RedEdge architecture, we have developed and tested an application based on the RedEdge architecture in a real-world application setting. In this section, we present the outcomes of this experimentation in terms of the effectiveness of the big data reduction strategy (including battery power consumption, memory consumption and latency). We compare our results with raw data stream uploading and present the potential savings in battery power and memory overhead that can be achieved by the RedEdge architecture.
6.1. Big Data Reduction in Participatory Sensing Application
In a smart city scenario, participatory sensing applications aid in collecting data streams from citizens and sensing systems deployed on roads, railway tracks, shopping and parking areas and countless other places in the cities. Let us consider an example of a citizen sensing application for a smart city, whereby the city administration wants to improve the quality of leisure time that citizens want to spend in public parks, sporting places and shopping malls. The city government asks the citizens to share information about their physical activities and locations in order to improve public facilities. Conventionally, the applications installed on citizens’ mobile phones collect the sensing information (i.e., readings from accelerometers, GPS, nearer Wi-Fi, etc.) and transfer the raw data streams to the cloud for analysis. We use this scenario in order to evaluate the RedEdge architecture.
6.2. System Development Platform and Real-World Experiment Settings
We selected multiple application development platforms in order to evaluate the performance of the RedEdge architecture. For local data reduction components, we developed data acquisition and adaptation, knowledge discovery, knowledge management and system management modules using Android SDK and Java 8. For collaborative data reduction, we integrated the AllJoyn framework for device discovery, P2P network formation and data offloading. However, the data reduction modules were implemented using Android SDK and Java 8. For cloud-based data reduction, we developed multi-threaded cloud services and deployed it in a cloud environment using Google’s compute engine. We select three classifiers, namely J48, naive Bayes and random forest as the underlying knowledge discovery techniques employed by the participatory sensing application.
The experiments were performed in two phases. In the first phase, we recruited 12 graduate students to collect data streams in order to develop the learning models. In the second phase, we deployed the learning models in the mobile edge devices for activity predictions and input the raw data streams in order to perform the evaluation of RedEdge. The performance evaluation of RedEdge was made in terms of battery power consumption and memory utilization during raw data uploading and data reduction using RedEdge.
6.3. Results of the Real-World Experiment
Mobile edge devices operate in resource-constrained environments; therefore, power consumption and memory utilization during data reduction were the main considerations during the evaluation. We integrated a software-based open source power profiling tool in RedEdge in order to measure the power consumed by application components. Since the nature of streaming data in big data systems varies according to the application requirements, we configured RedEdge accordingly. The accelerometer and GPS receiver collect the data stream at a constant rate (i.e., 100 readings per second for the accelerometer and a GPS reading after every 5 s). However, we generated different sizes of data chunks between time interval of 5 s and 300 s so that we can measure the effect of both volume and velocity on the performance of RedEdge.
Figure 6 shows the power consumption comparison of data uploading strategies. Initially, the raw data streams were uploaded in mobile edge devices, whereby the average battery power consumption for each data chunk remained around 16 mW (milliwatts). However, due to mobility constraints and switching among different networks, sometimes the average power overhead on the mobile edge device increased about 3 mW. The maximum power consumed during raw data uploading in mobile edge devices remained 19 mW. Comparatively during raw data uploading in clouds, the mobile edge device consumed less power, whereby the average consumption remained around 11 mW. However, the RedEdge architecture improves the performance, whereby the cost of uploading knowledge patterns remained around 1.33 mW on average. The experiment revealed that power consumption for knowledge transfer was almost 12-times lower as compared with raw data transfer in mobile edge devices and almost eight-times lower in the case of the comparison with raw data transfer in the cloud.
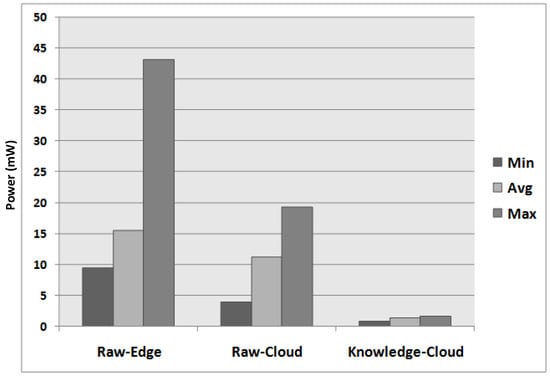
Figure 6.
Power consumption comparison.
Although RedEdge minimized the power consumption for data transfer, there remains an energy overhead of data processing. The results presented in Figure 7 reveals that RedEdge consumed more power while processing data streams in mobile edge devices as compared with data processing using mobile edge devices in ad hoc networks and clouds. The average battery power consumption during data processing in the mobile edge device, the serving mobile edge device and the cloud remained 468 mW, 61 mW and 367 mW, respectively. However, the power consumption does not significantly impact the performance of mobile edge devices. For example, for a 2000-mAh (milliamperes per hour) battery operating with 3.7 volts, the mobile edge device can last for around 16 h in LA mode, 140 h in CA mode and around 20 h in CLA mode. The battery time was calculated using Equation (9). Here, “P” represents the power.
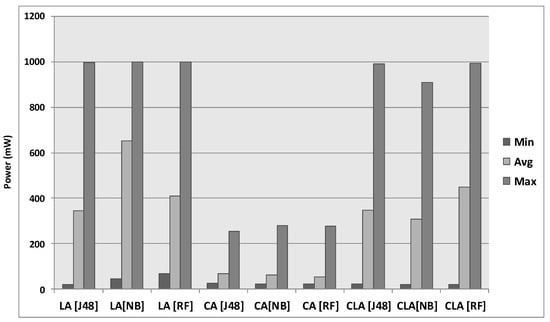
Figure 7.
Power consumption overhead of RedEdge.
Figure 8 shows the memory consumption during raw data uploading and knowledge transfer in mobile edge devices and clouds. The mobile edge devices consumed 29 MB and 27 MB of total memory during raw data transfer in mobile edge devices and clouds, respectively. However, the memory consumption lowered up to 15 MB during knowledge pattern transfer in the cloud. Although we achieved 50% memory gain, RedEdge introduces an overhead of memory consumption for LA, CA and CLA modes. Figure 9 shows the memory overhead of the RedEdge architecture. The results reveal that RedEdge consumed on average 25 MB in LA mode, 27 MB in CA mode and 28 MB in CLA mode. Interestingly, the memory consumption during data processing using RedEdge does not significantly differ from that of raw data uploading in mobile edge devices and clouds. Therefore, the memory consumption overhead of RedEdge does not degrade the performance of mobile edge devices.
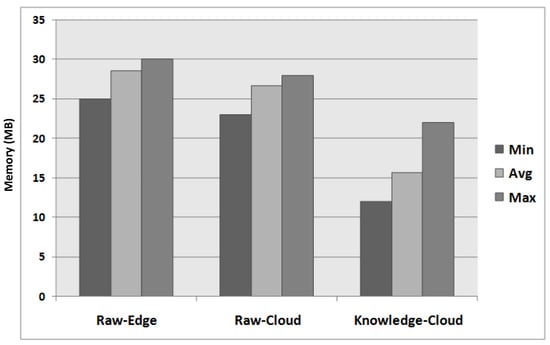
Figure 8.
Memory consumption analysis.
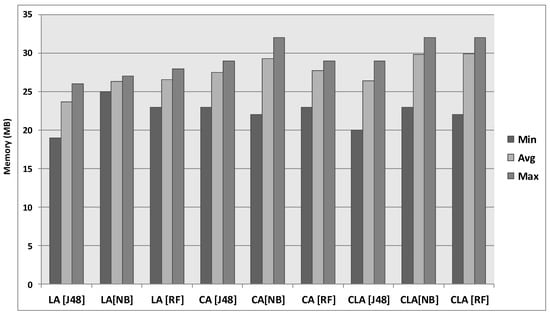
Figure 9.
Memory overhead of RedEdge.
Conventionally, big data systems collect the data streams, perform data indexing and storing operations inside clouds and perform data processing at lateral stages. The process from raw data acquisition to uncovering knowledge patterns involves latency in big data applications. We calculated the latency overhead caused by RedEdge (see Figure 10). The local data reduction in mobile edge devices creates a delay of about 1200 milliseconds (ms). Alternatively, collaborative data reduction introduces an average delay of 2393 ms (about 2.4 s), and remote data reduction brings a latency of 5675 ms (about 5.7 s).
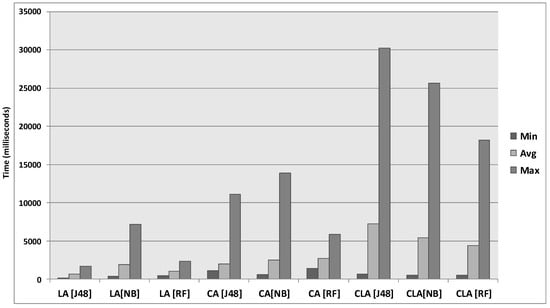
Figure 10.
Latency for data reduction.
The aim of data reduction was achieved in this study. The experimental analysis reveals that out of 4.32 GB of data, acquired and processed using RedEdge, the architecture reduced the raw data stream to 315.98 MB of the knowledge data stream. In total, the reduced data stream accounts for 7.14% of the overall data, which shows the significance of the research. Although there seems to be little battery power consumption (see Figure 7) and memory (see Figure 9) overhead for RedEdge, the achieved benefits out-weigh the incurred cost. The RedEdge architecture introduces the following benefits by enabling early big data reduction:
- The architecture enables controlling the velocity of incoming data streams in big data systems. The data acquisition and adaptation module of RedEdge enable setting the speed of data collection according to the application requirements and provide mechanisms to acquire data streams from multiple data sources.
- The value of big data matters rather than blindly collecting data streams in cloud data centres. The knowledge discovery module of RedEdge enables improving the quality of big data streams. The module provides functionality to convert raw data streams into knowledge patterns, hence improving the quality of collected data streams. For example, in our use case application, the conversion of raw sensor readings into meaningful activities improves the quality of data streams.
- Handling a voluminous amount of big data is quite challenging and requires laborious efforts in order to perform data deduplication, data indexing, storage, retrieval and data cleaning operations for big data analytics. The three-level data reduction facilitates reducing the sheer volume of big data in order to ease the big data management operations. For example, our use-case application reduced the data volume about 13 times as compared with raw data transmission in cloud data centres.
- Conventionally, big data systems do not provide the local view of knowledge patterns near the data sources [55]. The visualization and actuation module of RedEdge ensures local knowledge availability in order to control the data sharing by mobile users.
- The architecture reduced big data streams near the data sources, hence lowering the bandwidth utilization cost. The cost is incurred in terms of data plans consumed by individual users, as well as the bandwidth utilization during in-network data movement in cloud data centres.
- The data reduction near the data sources is highly beneficial in order to reduce the operational cost of big data systems. Governments and enterprises do not need to purchase extra data storage and data processing facilities. Alternatively, the cloud service providers can lower the operational cost due to less storage and processing requirements.
7. Conclusions and Future Work
Data reduction near the data sources is the right alternate solution of conventional methods of data reduction in big data systems. This research shows that data reduction inside mobile edge devices lowers the communication and computational burden in existing IoT-cloud communication models. To this end, the proposed RedEdge architecture contributes by utilizing mobile edge devices as the primary data mining platforms and further reduces the data stream in clouds before big data aggregation. The RedEdge architecture improves the big data systems in terms of volume, velocity and value by reducing 92.68% of the data streams before big data storage. RedEdge indirectly improves the big data management and in-network data movement operations at later stages of big data processing models. In the future, we aim to propose energy- and memory-efficient load balancing methods in order to utilize mobile edge devices as data reduction platforms to reduce the overall latency of sharing big data streams in clouds. In addition, we understand that security and privacy are grave concerns with such approaches [56,57]. Hence, one important direction of this proposed work is to develop novel privacy and security mechanisms that can support distributed big data analytics in mobile edge cloud computing environments.
Acknowledgments
The work presented in this article is supported by the Ministry of Education Malaysia (FRGS FP051-2013A and UMRG RP001F-13ICT). In addition, the authors would like to acknowledge the Bright Spark Unit of University of Malaya for providing incentive support.
Author Contributions
M.H.R. and P.P.J.conceived of and designed the experiments. S.u.R.M. and A.u.R.K designed the mathematical model and simulations. M.H.R. and P.P.J. performed experiments and analysed the data. M.H.R. and P.P.J. wrote the article and M.M.G. supervised the research.
Conflicts of Interest
The authors declare no conflict of interest.
References
- Buyya, R.; Yeo, C.S.; Venugopal, S.; Broberg, J.; Brandic, I. Cloud computing and emerging IT platforms: Vision, hype, and reality for delivering computing as the 5th u0tility. Future Gener. Comput. Syst. 2009, 25, 599–616. [Google Scholar] [CrossRef]
- Rehman, M.H.; Chang, V.; Batool, A.; Wah, T.Y. Big data reduction framework for value creation in sustainable enterprises. Int. J. Inf. Manag. 2016, 36, 917–928. [Google Scholar] [CrossRef]
- Shuja, J.; Gani, A.; Rehman, M.H.; Ahmed, E.; Madani, S.A.; Khan, M.K.; Ko, K. Towards native code offloading based MCC frameworks for multimedia applications: A survey. J. Netw. Comput. Appl. 2016, 75, 335–354. [Google Scholar] [CrossRef]
- Siddiqa, A.; TargioHashem, I.A.; Yaqoob, I.; Marjani, M.; Shamshirband, S.; Gani, A.; Nasaruddin, F. A Survey of big data management: Taxonomy and state-of-the-art. J. Netw. Comput. Appl. 2016, 71, 151–166. [Google Scholar] [CrossRef]
- Rehman, M.H.; Liew, C.S.; Abbas, A.; Jayaraman, P.P.; Wah, T.Y.; Khan, S.U. Big Data Reduction Methods: A Survey. Data Sci. Eng. 2016, 1, 265–284. [Google Scholar] [CrossRef]
- Trovati, M. Reduced topologically real-world networks: A big-data approach. Int. J. Distrib. Syst. Technol. 2015, 6, 13–27. [Google Scholar] [CrossRef]
- Patty, J.W.; Penn, E.M. Analyzing big data: Social choice and measurement. PS Political Sci. Politics 2015, 48, 95–101. [Google Scholar] [CrossRef]
- Yang, C.; Zhang, X.; Zhong, C.; Liu, C.; Pei, J.; Ramamohanarao, K.; Chen, J. A spatiotemporal compression based approach for efficient big data processing on cloud. J. Comput. Syst. Sci. 2014, 80, 1563–1583. [Google Scholar] [CrossRef]
- Wang, W.; Lu, D.; Zhou, X.; Zhang, B.; Mu, J. Statistical wavelet-based anomaly detection in big data with compressive sensing. EURASIP J. Wirel. Commun. Netw. 2013, 2013, 1–6. [Google Scholar] [CrossRef]
- Fu, Y.; Jiang, H.; Xiao, N. A scalable inline cluster deduplication framework for big data protection. In Middleware 2012; Springer: New York, NY, USA, 2012; pp. 354–373. [Google Scholar]
- Dong, W.; Douglis, F.; Li, K.; Patterson, R.H.; Reddy, S.; Shilane, P. Tradeoffs in Scalable Data Routing for Deduplication Clusters. Available online: https://www.usenix.org/legacy/events/fast11/tech/full_papers/Dong.pdf (accessed on 15 August 2017).
- Zerbino, D.R.; Birney, E. Velvet: Algorithms for de novo short read assembly using de Bruijn graphs. Genome Res. 2008, 18, 821–829. [Google Scholar] [CrossRef] [PubMed]
- Lin, M.S.; Chiu, C.Y.; Lee, Y.J.; Pao, H.K. Malicious URL filtering—A big data application. In Proceedings of the IEEE International Conference on Big Data, Silicon Valley, CA, USA, 6–9 October 2013; pp. 589–596. [Google Scholar]
- Leung, C.K.S.; MacKinnon, R.K.; Jiang, F. Reducing the search space for big data mining for interesting patterns from uncertain data. In Proceedings of the IEEE International Conference on Big Data, Washington, DC, USA, 27–30 October 2014; pp. 315–322. [Google Scholar]
- Jiang, P.; Winkley, J.; Zhao, C.; Munnoch, R.; Min, G.; Yang, L.T. An intelligent information forwarder for healthcare big data systems with distributed wearable sensors. IEEE Syst. J. 2016, 10, 1147–1159. [Google Scholar] [CrossRef]
- Akhbar, F.; Chang, V.; Yao, Y.; Muñoz, V.M. Outlook on moving of computing services towards the data sources. Int. J. Inf. Manag. 2016, 36, 645–652. [Google Scholar] [CrossRef]
- Li, C.S.; Darema, F.; Chang, V. Distributed behaviour model orchestration in cognitive Internet of Things solution. Ent. Inf. Sys. 2017. [Google Scholar] [CrossRef]
- Mital, M.; Chang, V.; Choudhary, P.; Pani, A.; Sun, Z. Adoption of cloud based Internet of Things in India: A multiple theory perspective. Int. J. Inf. Manag. 2016. [Google Scholar] [CrossRef]
- Satyanarayanan, M.; Simoens, P.; Xiao, Y.; Pillai, P.; Chen, Z.; Ha, K.; Hu, W.; Amos, B. Edge Analytics in the Internet of Things. IEEE Pervasive Comput. 2015, 14, 24–31. [Google Scholar] [CrossRef]
- Bonomi, F.; Milito, R.; Zhu, J.; Addepalli, S. Fog computing and its role in the Internet of Things. In Proceedings of the MCC Workshop on Mobile Cloud Computing, Helsinki, Finland, 13–17 August 2012; pp. 13–16. [Google Scholar]
- Drolia, U.; Martins, R.P.; Tan, J.; Chheda, A.; Sanghavi, M.; Gandhi, R.; Narasimhan, P. The Case for Mobile Edge-Clouds. In Proceedings of the IEEE 10th International Conference on Ubiquitous Intelligence and Computing and 10th International Conference on Autonomic and Trusted Computing (UIC/ATC), Vietri sul Mare, Italy, 18–21 December 2013; pp. 209–215. [Google Scholar]
- Ha, K.; Satyanarayanan, M. OpenStack++ for Cloudlet Deployment. Available online: http://reports-archive.adm.cs.cmu.edu/cs2015.html (accessed on 10 August 2017).
- Luan, T.H.; Gao, L.; Li, Z.; Xiang, Y.; Sun, L. Fog Computing: Focusing on Mobile Users at the Edge. arXiv, 2015; arXiv:1502.01815. [Google Scholar]
- Rehman, M.H.; Liew, C.S.; Wah, T.Y. Frequent pattern mining in mobile devices: A feasibility study. In Proceedings of the International Conference on Information Technology and Multimedia (ICIMU), Putrajaya, Malaysia, 18–20 November 2014; pp. 351–356. [Google Scholar]
- Rehman, M.H.; Batool, A.; Liew, C.S.; Teh, Y.W.; Khan, A.U.R. Execution Models for Mobile Data Analytics. IT Prof. 2017, 19, 24–30. [Google Scholar] [CrossRef]
- Rehman, M.H.; Liew, C.S.; Wah, T.Y. UniMiner: Towards a unified framework for data mining. In Proceedings of the 4th World Congress on Information and Communication Technologies (WICT), Malacca, Malaysia, 8–10 December 2014; pp. 134–139. [Google Scholar]
- Trovati, M.; Bessis, N. An influence assessment method based on co-occurrence for topologically reduced big data sets. Soft Comput. 2016, 20, 2021–2030. [Google Scholar] [CrossRef]
- Trovati, M.; Asimakopoulou, E.; Bessis, N. An analytical tool to map big data to networks with reduced topologies. In Proceedings of the International Conference on Intelligent Networking and Collaborative Systems (INCoS), Salerno, Italy, 10–12 September 2014; pp. 411–414. [Google Scholar]
- Jalali, B.; Asghari, M.H. The anamorphic stretch transform, putting the squeeze on big data. Opt. Photonics News 2014, 25, 24–31. [Google Scholar] [CrossRef]
- Ackermann, K.; Angus, S.D. A resource efficient big data analysis method for the social sciences: The case of global IP activity. Procedia Comput. Sci. 2014, 29, 2360–2369. [Google Scholar] [CrossRef]
- Zou, H.; Yu, Y.; Tang, W.; Chen, H.W.M. Flexanalytics: A flexible data analytics framework for big data applications with I/O performance improvement. Big Data Res. 2014, 1, 4–13. [Google Scholar] [CrossRef]
- Xia, W.; Jiang, H.; Feng, D.; Hua, Y. SiLo: A Similarity-Locality based Near-Exact Deduplication Scheme with Low RAM Overhead and High Throughput. In Proceedings of the USENIX Annual Technical Conference, Portland, OR, USA, 15–17 June 2011. [Google Scholar]
- Cheng, Y.; Jiang, P.; Peng, Y. Increasing big data front end processing efficiency via locality sensitive Bloom filter for elderly healthcare. In Proceedings of the IEEE Symposium on Computational Intelligence in Big Data (CIBD), Orlando, FL, USA, 9–12 December 2014; pp. 1–8. [Google Scholar]
- Hillman, C.; Ahmad, Y.; Whitehorn, M.; Cobley, A. Near real-time processing of proteomics data using Hadoop. Big Data 2014, 2, 44–49. [Google Scholar] [CrossRef] [PubMed]
- Sugumaran, R.; Burnett, J.; Blinkmann, A. Big 3d spatial data processing using cloud computing environment. In Proceedings of the 1st ACM SIGSPATIAL International Workshop on Analytics for Big Geospatial Data, Redondo Beach, CA, USA, 7–9 November 2012; pp. 20–22. [Google Scholar]
- Hartigan, J.A.; Wong, M.A. Algorithm AS 136: A k-means clustering algorithm. Appl. Stat. 1979, 28, 100–108. [Google Scholar] [CrossRef]
- Hoi, S.C.; Wang, J.; Zhao, P.; Jin, R. Online feature selection for mining big data. In Proceedings of the 1st International Workshop on Big Data, Streams and Heterogeneous Source Mining: Algorithms, Systems, Programming Models and Applications, Beijing, China, 12–16 August 2012; pp. 93–100. [Google Scholar]
- Qiu, J.; Zhang, B. Mammoth Data in the Cloud: Clustering Social Images. In Cloud Computer and Big Data; IoS Press: Amsterdam, The Nederlands, 2013; pp. 231–246. [Google Scholar] [CrossRef]
- Wold, S.; Esbensen, K.; Geladi, P. Principal component analysis. Chemom. Intell. Lab. Syst. 1987, 2, 37–52. [Google Scholar] [CrossRef]
- Cichocki, A. Era of big data processing: A new approach via tensor networks and tensor decompositions. arXiv, 2014; arXiv:1403.2048. [Google Scholar]
- Azar, A.T.; Hassanien, A.E. Dimensionality reduction of medical big data using neural-fuzzy classifier. Soft Comput. 2014, 19, 1115–1127. [Google Scholar] [CrossRef]
- Stateczny, A.; Wlodarczyk-Sielicka, M. Self-organizing artificial neural networks into hydrographic big data reduction process. In Rough Sets and Intelligent Systems Paradigms; Springer: Berlin, Germany, 2014; pp. 335–342. [Google Scholar]
- Rágyanszki, A.; Gerlei, K.Z.; Surányi, A.; Kelemen, A.; Jensen, S.J.K.; Csizmadia, I.G.; Viskolcz, B. Big data reduction by fitting mathematical functions: A search for appropriate functions to fit Ramachandran surfaces. Chem. Phys. Lett. 2015, 625, 91–97. [Google Scholar] [CrossRef]
- Rehman, M.H.; Liew, C.S.; Iqbal, A.; Wah, T.Y.; Jayaraman, P.P. Opportunistic Computation Offloading in Mobile Edge Cloud Computing Environments. In Proceedings of the 17th IEEE International Conference on Mobile Data Management, Porto, Portugal, 13–17 June 2016. [Google Scholar]
- Klas, G.I. Fog Computing and Mobile Edge Cloud Gain Momentum Open Fog Consortium, ETSI MEC and Cloudlets. Available online: http://yucianga.info/wp-content/uploads/2015/11/15-11-22-Fog-computing-and-mobile-edge-cloud-gain-momentum-%E2%80%93-Open-Fog-Consortium-ETSI-MEC-Cloudlets-v1.pdf (accessed on 10 August 2017).
- Lin, B.S.P.; Lin, F.J.; Tung, L.P. The Roles of 5G Mobile Broadband in the Development of IoT, Big Data, Cloud and SDN. Commun. Netw. 2016, 8, 9. [Google Scholar] [CrossRef]
- Ferreira, D.; Dey, A.K.; Kostakos, V. Understanding human-smartphone concerns: A study of battery life. In Pervasive Computing; Springer: Berlin, Germany, 2011; pp. 19–33. [Google Scholar]
- Diaz, M. Petri Nets: Fundamental Models, Verification and Applications; John Wiley & Sons: Hoboken, NJ, USA, 2013. [Google Scholar]
- De Moura, L.; Bjørner, N. Satisfiability modulo theories: An appetizer. In Formal Methods: Foundations and Applications; Springer: Berlin, Germany, 2009; pp. 23–36. [Google Scholar]
- De Moura, L.; Bjorner, N. Z3: An efficient SMT solver. In Proceedings of the International conference on Tools and Algorithms for the Construction and Analysis of Systems, Budapest, Hungary, 29 March–6 April 2008; pp. 337–340. [Google Scholar]
- Othman, M.; Ali, M.; Khan, A.N.; Madani, S.A.; Khan, A.U.R. Pirax: Framework for application piracy control in mobile cloud environment. J. Supercomput. 2014, 68, 753–776. [Google Scholar]
- Abid, S.; Othman, M.; Shah, N.; Ali, M.; Khan, A. 3D-RP: A DHT-based routing protocol for MANETs. Comput. J. 2014, 58, 258–279. [Google Scholar] [CrossRef]
- Bonet, P.; Lladó, C.M.; Puijaner, R.; Knottenbelt, W.J. PIPE v2.5: A Petri Net Tool for Performance Modelling. Available online: http://pubs-dev.doc.ic.ac.uk/pipe-clei/pipe-clei.pdf (accessed on 15 August 2017).
- Liu, S.; Zeng, R.; Sun, Z.; He, X. Bounded Model Checking High Level Petri Nets in PIPE+ Verifier. In Formal Methods and Software Engineering; Springer: Berlin, Germany, 2014; pp. 348–363. [Google Scholar]
- Rehman, M.H.U.; Sun, L.C.; Wah, T.Y.; Khan, M.K. Towards next-generation heterogeneous mobile data stream mining applications: Opportunities, challenges, and future research directions. J. Netw. Comput. Appl. 2017, 79, 1–24. [Google Scholar] [CrossRef]
- Daghighi, B.; Kiah, M.L.M.; Shamshirband, S.; Rehman, M.H.U. Toward secure group communication in wireless mobile environments: Issues, solutions, and challenges. J. Netw. Comput. Appl. 2015, 50, 1–14. [Google Scholar] [CrossRef]
- Daghighi, B.; Kiah, M.L.M.; Iqbal, S.; Rehman, M.H.; Martin, K. Host mobility key management in dynamic secure group communication. Wirel. Netw. 2017. [Google Scholar] [CrossRef]
© 2017 by the authors. Licensee MDPI, Basel, Switzerland. This article is an open access article distributed under the terms and conditions of the Creative Commons Attribution (CC BY) license (http://creativecommons.org/licenses/by/4.0/).