Abstract
The influence of elevated CO2 concentrations on the growth and viability of various microalgae strains was studied. Arthrospira platensis, Chlorella ellipsoidea, Chlorella vulgaris, Gloeotila pulchra, and Elliptochloris subsphaerica were tested. The cultivation of microalgae was carried out at constant CO2 concentrations (0.04, 3, 6, or 9%—sequentially from lower to higher concentrations), under constant (24 h·day−1) illumination with an intensity of 74.3 µmol quanta·m−2·s−1, and a constant temperature of 23.5 ± 0.5 °C. The optical density of the microalgae biomass, pH, and the chemical composition of the culture medium were measured. Microscopy (including the cytochemical microscopic method) was conducted to monitor the state of the microalgae. The highest biomass growth rate (0.37 g·L−1·day−1), among all experiments, was achieved for Chlorella vulgaris at CO2 = 3% and for Chlorella ellipsoidea at CO2 = 6 and 9%. The lowest growth rate (0.12 g·L−1·day−1) was achieved for Arthrospira platensis at CO2 = 3 and 9%. The microscopy results showed the absence or a minimum number of dead cells of the strains under selected conditions. The ability to maintain the viability of cultures up to significant concentrations of CO2 = 9% was due to adaptation (gradual increase in CO2 concentrations in the experiments).
1. Introduction
In recent decades, there has been a steady increase in the share of renewable energy sources (RESs) in the global fuel and energy balance. One of the goals of such a change is to reduce greenhouse gas emissions into the atmosphere, since about 75% of such emissions come from the energy sector [1].
In addition to the increasing use of RESs, various measures are proposed to reduce greenhouse gas emissions from plants and installations of traditional energy on hydrocarbon fuels. There are various ways to capture and store carbon dioxide (CO2), such as pumping gas into underground storage facilities. This method of CO2 utilization has several difficulties, primarily related to the volume of underground storage facilities and financial costs. Another way of CO2 capture is based on the use of highly efficient photosynthetic organisms [2,3,4].
Currently, the biotechnological potential of microalgae and cyanobacteria is attracting increasing attention from researchers, biotechnologists, and ecologists. It is primarily because microalgae and cyanobacteria are promising raw materials to produce biofuels and valuable related products [5]. Microalgae and cyanobacteria are also used to protect the environment, since, in the photosynthesis process, they convert carbon dioxide into valuable biological products and energy, with much greater efficiency than higher plants, while also releasing oxygen. Due to the simple structure and affordable nutrition, microalgae have theoretically higher photosynthesis efficiency compared to terrestrial plants [6,7]. Algae cultivation does not require arable land, and using wastewater as a nutrient medium will reduce the need for water by 90% and fully satisfy the need for nutrients [8,9,10,11]. On the other hand, the observed active flowering of cyanobacteria in the natural environment over recent decades, associated with an increased CO2 content and temperature, requires additional studies, since this can bring substantial impacts on water quality and ecosystem function as whole [12,13]. Additionally, microalgae have a wide range of commercial applications in aquaculture, bioenergy, etc. [14,15].
To achieve economic profitability in obtaining target products from microalgae, a search is underway for both the most productive strains, including genetically modified ones, and the conditions under which this productivity is achieved. In recent years, it has been found that with the joint cultivation of microalgae and bacteria, high growth rates can be achieved [16,17]. Other approaches to finding productive solutions based on consortia of microalgae with other organisms are also being developed. Thus, it is shown that the joint cultivation of microalgae with mycelial fungal spores [18,19], as well as their cultivation on films (the algal biofilm technique method), can significantly speed up the process of biomass collection and reduce costs.
Microalgae plantations or carbon polygons serve as an effective drain of anthropogenic CO2, and the removal of cultivated microalgae biomass for energy needs does not violate the natural conservation of organic matter in the biosphere; therefore, algae technologies have recently been considered among existing strategies for CO2 capture and storage (CCS) [20].
The exhaust gases of thermal power plants are characterized by quite high concentrations of CO2. Therefore, for the effective uptake of CO2 by microalgae, it is necessary to search for and adapt the microalgae to obtain strains resistant to high concentrations of CO2. It is known that the use of gas mixtures with a high CO2 content can increase the specific growth rate of microalgae [21]. At the same time, high concentrations of CO2 can be inhibitory for microalgae growth and CO2 biofixation [22,23]. Thus, in addition to the search for the most resistant strains of microalgae, it is necessary to determine the most optimal conditions for their cultivation, namely, the maximum concentrations of CO2 in gas mixtures at which the high productivity of microalgae is maintained, and, consequently, the biofixation of CO2.
To date, studies have been conducted on various strains of microalgae when exposed to high concentrations of CO2. In their article, Ambreen Aslam et al. [21] studied the features of CO2 absorption and other components in the composition of the flue gases from a coal-fired power plant with a capacity of 4 MW. Preliminary experiments on the cultivation of several highly productive strains of microalgae (e.g., Scenedesmus dimorphus NT8c, Chlorella vulgaris, Limnothrix planctonica) showed that the addition of small amounts of CO2 to the gas–air mixture led to almost triple the productivity of biomass compared to growing only in the air under conditions of limited CO2 content. To improve the viability and tolerance of microalgae to high concentrations of CO2, slow adaptation was required, starting with low CO2 concentrations = 1.1% and 3.3%. The final indicator of the survival of microalgae was their high productivity (in terms of biomass), which is associated with the intensity of CO2 absorption.
The intensity of CO2 absorption obtained in experiments with microalgae directly depends on the choice of strains. In their article, Liyana Yahya et al. [24] assess the ability of microalgae strains Nannochloropsis sp., Tetraselmis sp., and Isochrysis sp. to capture CO2, strains were first grown in the laboratory with 100% CO2, and then on the flue gases of a coal-fired power plant (Malaysia). The best results after the adaptation phase were shown by Isochrysis sp., with a maximum fixation rate (absorption) of 0.35 g·CO2·L−1 of culture liquid per day. According to [21], the microalgae strain Desmodesmus sp. withstood CO2 concentrations of up to 11%, while Spirulina platensis (or Arthrospira platensis) in consortium with other microalgae showed steady growth on a gas–air mixture with a concentration of CO2 up to 15% [25]. Giuseppe Olivieri et al. [26] presented the results of the effect of high concentrations of CO2 on the growth of microalgae Stichococcus bacillaris (ACUF 158/11). It was shown that the concentrations of CO2 higher than in the air (0.035% by volume) improved the productivity of microalgae. The same culture of microalgae, Stichococcus bacillaris, was subjected to bubbling at high concentrations of CO2 in the gas–air mixture (5 and 15%) [27]. In a detailed review of the methods and results of cultivation of a wide range of microalgae [28], Chlorella sp. is indicated as a culture that is grown with high efficiency when bubbling with gas–air mixtures with high concentrations of CO2. Baohua Zhu et al. [29] studied Spirulina strains (LAMB171, LAMB172, and LAMB220) from the Laboratory of Applied Microalgal Biology, Ocean University of China. CO2 concentrations were 2, 5, 10, and 15%, and cultivation lasted 12 days. The best biomass performance and the highest CO2 fixation rate were obtained at CO2 concentrations of 10% for all three strains. The maximum biomass yield was 272.12 mg·L−1 per day for the Spirulina LAMB171 strain. More results about the tolerance of Spirulina to various high CO2 concentrations can be found in [30,31,32,33,34,35].
Studies show that, even within the same culture, the productivity of microalgae can significantly differ. A.M. Lizzul et al. [36] conducted experiments with Chlorella, and an increase in biomass and lipid production was observed with the addition of CO2. Chlorella showed satisfactory growth at CO2 concentrations both in the range of 1% to 18% by volume [37] and under extreme conditions, with CO2 concentrations up to 50% [38]. However, for example [22], there was a significant decrease in the growth of Chlorella sp. cells at high CO2 concentrations.
The results listed above show that a wide range of microalgae strains have already been considered, for which different results have been obtained, which are not always consistent with each other. In studies for the same culture, both stable productivity at high CO2 concentrations and inhibition of microalgae growth were found. This indicates that it is necessary to continue and expand the study of microalgae strains to have the most complete material based on the results of experiments, allowing the selection of the optimal conditions for growing cultures, and the method of adaptation of microalgae strains to high CO2 concentrations.
It should also be noted that in previous studies, experiments on the effect of elevated CO2 concentrations on the growth and development of microalgae were not carried out in a long multistage adaptation algorithm.
The aim of this study was to investigate various strains of microalgae to identify the most viable and resistant strains when cultivated in a gas–air environment with high CO2 concentrations. In our work, we proposed to conduct studies of various strains of green algae and cyanobacteria in one experiment with the same conditions of illumination, temperature, bubbling intensity, and concentration of CO2 in the gas–air mixture for a detailed comparative analysis. Both microalgae previously studied for tolerance to high CO2 concentrations (Chlorella vulgaris, Chlorella ellipsoidea, and Arthrospira platensis) and newly isolated strains of microalgae, whose studies are rare and can give interesting new results (Gloeotila pulchra and Elliptochloris subsphaerica), were selected as objects of research.
Since the experiments are focused on the further practical application of the results in large installations for the disposal of CO2 from flue gases, it is essential to select and test the methodology of rapid analysis of the viability of microalgae under stressful conditions for CO2 concentrations, which do not require lengthy microbiological procedures, which is also the novelty of this study.
Thus, the objectives of the present study were as follows:
- –
- Selection of microalgae strains resistant to high CO2 concentrations.
- –
- The cultivation of selected strains at different CO2 concentrations (0.04, 3, 6, 9%) and implementation of gradual laboratory adaptation of microalgae to high CO2 content over a long period of time (48 days of the experiment).
- –
- Assessment of the microalgae viability according to the state of cell permeability, based on cytochemical staining of living and dead cells with methylene blue dye, followed by cell control ordinary light microscopy.
2. Results and Discussions
2.1. Biomass Growth Rate
Figure 1 shows the change in the density of microalgae biomass in the experiments with CO2 concentrations of 0.04, 3, 6, and 9%. Figure 2 shows the results of determining the growth rate of microalgae biomass for all experiments.
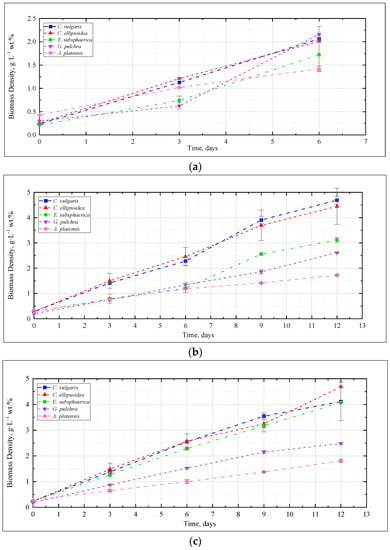
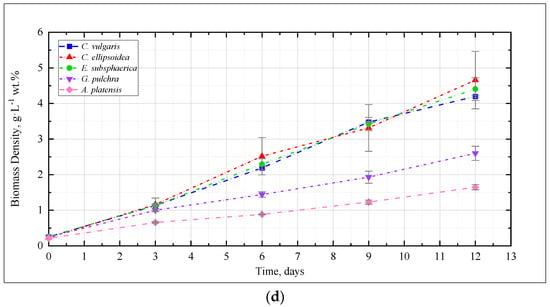
Figure 1.
Dynamics of microalgae biomass density in experiments with CO2 concentrations: (a) 0.04%, (b) 3%, (c) 6%, (d) 9%.
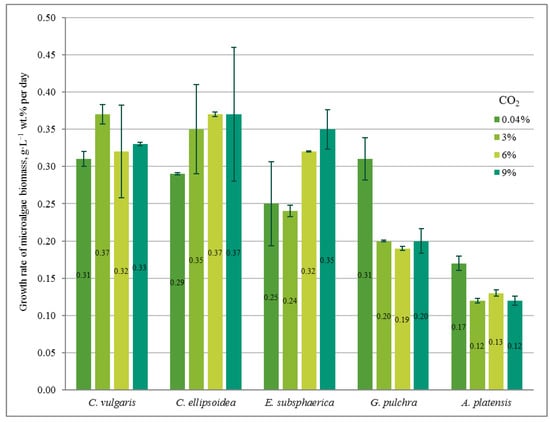
Figure 2.
The growth rate of microalgae biomass (g·L−1 wt. % per day) based on the results of the experiments.
The dynamics of microalgae biomass density in the experiment with CO2 = 0.04% is shown in Figure 1a. Here and further, the mean values for two repetitions and the error (standard deviation) are presented. Throughout the experiment, the microalgae biomass grows steadily. A marked increase in growth rate was observed for G. pulchra and E. subsphaerica after three days of the experiment.
In the experiment with CO2 = 3%, similar to the experiment with CO2 = 0.04%, a stable increase in the density of microalgae biomass was observed (Figure 1b). It can be noted that the growth is steady; therefore, there is no significant inhibition of culture growth due to the increased content of CO2 in the gas–air mixture. The growth rates of Chlorella cultures increased compared to the experiment with CO2 = 0.04%, while the growth rate of the strains of G. pulchra and A. platensis decreased markedly (Figure 2). The biomass growth rate for the E. subsphaerica strain remained almost unchanged (Figure 2).
As in the experiments with CO2 concentrations of 0.04 and 3%, in the experiment with CO2 = 6%, a steady increase in the density of microalgae biomass is observed (Figure 1c). Some tendency of slowing growth is visible only in the last three days of the experiment for G. pulchra. The results obtained indicate there is no significant inhibition of culture growth due to the increased CO2 content in the gas–air mixture. The maximum growth rate of biomass is achieved for the strain C. ellipsoidea (0.37 g·L−1 wt. % per day), while, compared with CO2 = 3%, the growth rate for the strain E. subsphaerica increased markedly; the strains G. pulchra and A. platensis remained almost unchanged, and the strain C. ellipsoidea decreased markedly (Figure 2).
In the experiment with CO2 = 9%, it is worth noting the preservation of the steady growth of the biomass density (Figure 1d), as in experiments with CO2 concentrations of 0.04, 3, and 6%. There is no inhibition of biomass growth due to an increase in the concentrations of CO2 in the gas–air mixture. The maximum growth rate of biomass is maintained for the strain C. ellipsoidea (0.37 g·L−1 wt. % per day), while, in comparison with the experiment with CO2 = 6%, the growth rate for the strain E. subsphaerica increased, and strains C. ellipsoidea, G. pulchra, and A. platensis remained almost unchanged (Figure 2).
Thus, for C. vulgaris, the highest biomass growth rate was achieved in the experiment with CO2 = 3%, for C. ellipsoidea with CO2 = 6 and 9%, for E. subsphaerica with CO2 = 9%, and for strains G. pulchra and A. platensis with CO2 = 0.04%.
The results obtained in the experiments on biomass growth rate have been compared with a study similar in goals, tools, and methods [39], where Chlorella sorokiniana IPPAS C-1 was considered an object of research. Cultivation was carried out in flat-panel photobioreactors with volumes of 5 and 18 L, lighting was provided by an LED system with an intensity of 900 µmol quanta·m−2·s−1, and the temperature 35.5 ± 0.5 °C. The productivity of Chlorella sorokiniana, depending on CO2 concentrations, and the ventilation coefficient of the gas–air mixture were estimated. The CO2 content in the gas–air mixture was lower than in our experiments (from 1 to 4%), and the results of the growth rate are presented only for the first three days of the experiment. However, the achieved biomass growth rates were more significant than in our experiments: the maximum growth rate was obtained at a concentration of CO2 = 1.5%, and was 1.51 ± 0.07 g·L−1 wt. % per day. As a result, after three days in [39], biomass density was achieved in the range of 4–5 g·L−1 wt. % at CO2 concentrations of 1.5, 2, and 4%. In our experiments, Chlorella showed the highest growth among all strains, the rate of which was at a maximum of 0.37 g·L−1 wt. % per day. At the same time, there was no tendency to decrease the growth rate with an increase in CO2 concentrations up to 9%; the increase in biomass density was stable and constant during the 12 days of the experiment. A comparison of the results suggests the possibility of increasing the growth rate of Chlorella microalgae biomass (and, consequently, the intensity of CO2 absorption) while optimizing the cultivation regime. In this case, an increase in the illumination intensity can be decisive (in our experiments, the illumination intensity was 74.3 µmol quanta·m−2·s−1), as well as optimal CO2 flow rate. The results also show the importance of the microalgae adaptation procedure to high CO2 concentrations, since it increases the efficiency of carbon dioxide absorption. Similar studies were carried out by Zhang B. et al. [40], who showed that adaptation improves the phenotype of microalgae based on random mutation and natural selection.
In our experiments, the microalgae demonstrated different responses to elevated CO2 concentrations and the rate of adaptation to these concentrations. Thus, C. vulgaris showed an almost constant growth rate at all CO2 values, C. ellipsoidea and E. subsphaerica achieved a significant increase in growth rate with increasing CO2, while G. pulchra and A. platensis were characterized by a decrease in growth rate at CO2 = 3, 6, and 9% compared to air. At the same time, the maximum growth rate reached values of the order of 0.35–0.37 g·L−1 wt. % per day. This value is consistent with the results obtained in [21]; however, in this work, microalgae consortia demonstrated maximum productivity only at CO2 = 1%, without significant changes with increasing CO2 content in the gas–air mixture.
The reason for such reaction differences may be the variety of ways of carbon assimilation and sources of carbon in the nutrient media. Thus, for A. platensis, the source of carbon is dissolved NaHCO3, while for the rest of the microalgae, it is CO2 supplied in gaseous form.
2.2. pH of the Culture Medium
The change in pH of the culture medium, as one of the most significant characteristics of the conditions for the cultivation of microalgae, is presented in Figure 3. Here and further, the graphs show the mean values for two repetitions and the error (standard deviation). In the experiment with CO2 = 0.04% (Figure 3a), a slight increase in the pH value was recorded for the strains E. subsphaerica and G. pulchra. For the strains Chlorella and A. platensis, the pH increase was more significant—5.5–5.6 to 6.8–6.9, and from 9.7 to 10.5, respectively.
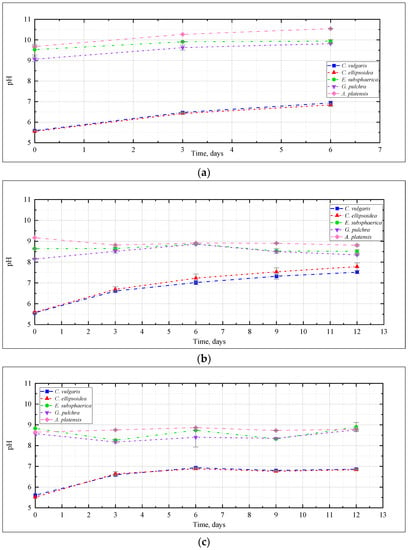
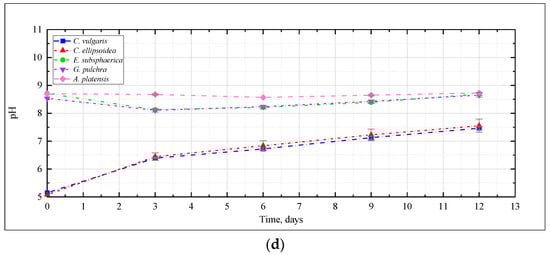
Figure 3.
Change of pH during the experiments with CO2 concentrations: (a) 0.04%, (b) 3%, (c) 6%, (d) 9%.
The change of pH in the experiment with CO2 = 3% (Figure 3b) depended on the strain, and generally turned out to be more significant than with CO2 = 0.04%. For Chlorella strains, a significant increase in pH was recorded from 5.5 to 7.5, and even 8. For the remaining strains of microalgae, the pH remained mostly constant or decreased, as in the case of A. platensis, whose pH value decreased from 9.2 to 8.8, which is not particularly typical for this culture. Many publications [21,31,41] show that CO2 bubbling causes acidification of media during the cultivation of a wide range of microalgae, even with buffer solutions used to stabilize the pH of the medium.
It should be noted that in the experiment with CO2 = 6% for Chlorella strains, the change in the pH of culture mediums turned out to be significant: initially, there was a significant increase in pH during the first three days of the experiment, after which this indicator reached a constant value of about 6.8–6.9 (Figure 3c).
In the experiment with CO2 = 9%, the change in pH was significant for Chlorella strains, and was characterized by a constant increase throughout the experiment. For the remaining strains, an almost constant pH value was observed again, which indicates a slight effect of high CO2 concentrations on the pH of the culture medium (Figure 3d).
Thus, for all microalgae strains under these experimental conditions, there was no noticeable acidification of the culture medium due to bubbling with a gas–air mixture with a high CO2 content (up to 9%). A constant or slight decrease in pH in experiments with A. platensis leads to an increase in the availability of bicarbonates (HCO3−) for microalgae and more efficient use of the components of the culture medium. The dynamics of the content of bicarbonates and carbonates in the cultivation medium of A. platensis in experiments at different CO2 concentrations (Figure 4) confirms this statement. It is possible to see a constant, or even slightly increasing, content of HCO3− due to the supply of gaseous CO2, and an almost constant and low content of carbonates.
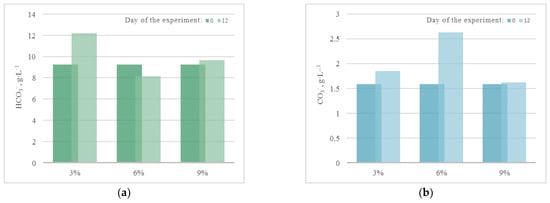
Figure 4.
Change in the content of (a) bicarbonates and (b) carbonates in the medium during cultivation of A. platensis.
Our experiments have shown that pH depends on several factors. First, on the composition of the nutrient medium. Zarrouk’s medium has a significant buffering capacity. Tamiya nutrient medium is unstable, since in the growth process of microalgae, the predominant physiological absorption of NO3− anions occurs compared to Na+ cations, which leads to an increase in pH. Secondly, in the growth process, CO2 bubbling acidifies the nutrient medium to a certain extent, which is confirmed by our experiments. It should be noted that in experiments on the use of flue gases, a decrease in pH during the growth of microalgae is observed [42].
2.3. Chemical Composition of the Culture Medium
The results of quantitative chemical analysis (QCA) in the experiment with CO2 = 3% showed that during the 12 days of the experiment, there was a significant increase in chemical and biological oxygen demand (COD, BOD5), as shown in Figure 5. The growth of COD and BOD5 shows that, along with the growth of microalgae, cell death and decomposition occur, accompanied by chemical and biological absorption of oxygen.
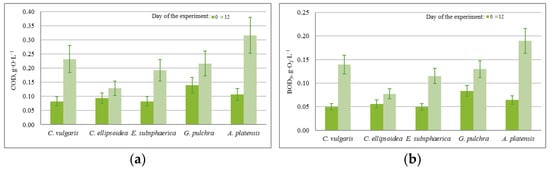
Figure 5.
Change in (a) chemical oxygen demand (g·O·L−1) and (b) biological oxygen demand (g·O2·L−1) with a CO2 concentration of 3%.
It should be noted that during the experiment, in all PBRs there was an increase in the concentration of bicarbonates (HCO3−) in the culture medium due to its constant bubbling with CO2. At the same time, an increase in the concentration of carbonates (CO3−) occurred only in the PBRs with A. platensis, which is associated with peculiar properties of the metabolism of this culture. For the rest of the significant components of the culture medium used as nutrients, the following dynamics were found, which are presented in Figure 6.
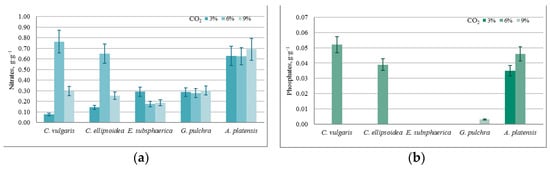
Figure 6.
A specific change in the content of culture media components, normalized for biomass growth (g·g−1): (a) nitrates, (b) phosphates.
The almost constant level of phosphate content in the medium with a nonzero increase in biomass in most experiments can be associated with the activity of heterotrophic bacteria, since the experiments were conducted not with axenic, but with algological pure cultures. This assumption is confirmed by the BOD5 values obtained in the experiments, which increased significantly during each experiment for all microalgae strains (on average from 0.05 g·O2·L−1 to 0.190 g·O2·L−1). In the case of strains E. subsphaerica and G. pulchra, it is difficult to monitor the dynamics of the phosphate content in the culture medium due to their initial low concentration.
Against the background of a steady increase in biomass, the results of QCA indicate that under the given experimental conditions (CO2 = 3%), there is no significant drop in the concentration for components of the culture medium, and, therefore, there is no inhibition of growth.
According to the results of QCA at CO2 = 6%, the pattern of the changes in COD and BOD5 is the same as in the experiment with CO2 = 3%. The change in the concentration of carbonates is also similar to the experiment with CO2 = 3%, where the concentration of bicarbonates increased in all cases except the strain A. platensis. Thus, in this experiment, significant changes in the content of nutrients were recorded compared to the experiment with CO2 = 3%.
According to the results of QCA, in the experiment with CO2 = 9%, there is a slight increase in COD and BOD5 for strains Chlorella and A. platensis, while for strains E. subsphaerica and G. pulchra, the values of these indicators remained unchanged within the margin of error. The change in the concentration of bicarbonates is similar to the experiment with CO2 = 6%. For strain A. platensis, the concentrations of HCO3− and CO3− did not change within the margin of error. Thus, in this experiment, significant changes in the content of nutrients were recorded in comparison with experiments with CO2 = 3 and 6%.
The obtained QCA results for all of the experiments make it possible to evaluate the intensity of consumption of individual components of culture medium, as well as to determine the mode of adding nutrients to maintain high productivity during long-term cultivation of microalgae.
2.4. Results of Microscopic Analysis of Microalgae
Microscopy of strains grown at CO2 = 3% showed that, visually, the cells of microalgae did not differ in morphometric parameters from the cells of culture samples from experiments with a CO2 content of 0.04% (air), as well as from cells from the working collection of algae of the Renewable Source Energy Laboratory at Lomonosov Moscow State University (RSE LMSU). The results of intravital staining of microalgae strains showed the absence or a minimal number of dead cells. Examples of photomicrographs are shown in Figure 7. They show the integrity of the microalgal cell walls. In the case of A. platensis and G. pulchra, only the mucous membranes of the microalgal trichomes are stained (Figure 7d,e), but not the internal parts.
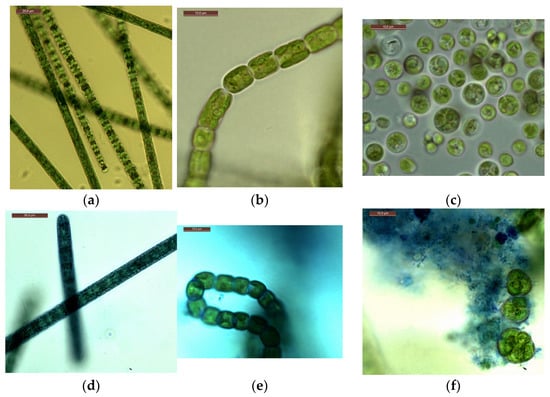
Figure 7.
Photomicrographs: A. platensis—(a,d); G. pulchra—(b,e); E. subsphaerica—(c,f). Trichomes and cells without staining: (a–c), trichomes and cells with staining: (d–f). Concentration of CO2 = 3%, sixth day of the experiment.
Similar results were obtained when growing strains with CO2 = 6%. Thus, almost the entire mass of cells of microalgae strains grown at high CO2 concentrations (3%, 6%) remained alive during the experiments, which indicates the preservation of the viability of cultures.
Microscopy of strains grown for 6 days at CO2 = 9% showed that the cells were not morphologically modified. When staining living cells, only single dead cells stained with methylene blue are found in the samples. However, the results obtained on the 12th day showed insignificant, but noticeable changes in the state of the microalgae (Figure 8).
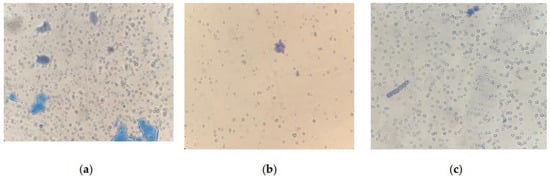
Figure 8.
Cells of microalgae strains: (a) C. vulgaris, (b) C. ellipsoidea, (c) E. subsphaerica, (d) G. pulchra. Samples with staining, magnification ×400; (e) A. platensis, sample without staining, ×100; (f) A. platensis, sample with staining, ×100. CO2 = 9%, 12th day of the experiment.
An analysis of photomicrographs of strains (Figure 8a–d) shows that the main mass of cells in the field of view are alive (unstained), against which clusters of dead colored cells are visible, the proportion of which is low. In the photo of E. subsphaerica, a strand of microalga, G. pulchra, is visible, which, as a result of contamination, was in small quantities already on the sixth day of the experiment. One strand of G. pulchra is colored (dead), which indicates the displacement of this strain by the main strain E. subsphaerica. In the photo of the strain G. pulchra (Figure 8d), in addition to living unstained cells, blue-colored remains of dead cells are visible in the form of separate short strands. The living strands of G. pulchra are long and curved, which indicates unfavorable conditions for the growth of this culture. In Figure 8e,f, A. platensis trichomes are shown, mostly alive (only the mucous membrane of cells is stained) and very long; a small number of short trichomes are visible in the field of view, which indicates a weakening of the process of cell growth and division. There are accumulations of detritus. Uncharacteristic convoluted trichomes of this strain are noted.
Thus, by the 12th day of the experiment, at CO2 = 9%, signs of some gradual inhibition of cells are detected, which are expressed as deviations in the shape of cells from normal, elongation (lack of division), and an increase in the number of dead cells. At the same time, mass death is not observed, even with such significant CO2 content in the gas–air mixture. In earlier work [35], where the strain A. platensis was grown at high CO2 concentrations under similar conditions, sustained growth could not be achieved: at a high concentration of CO2 (9%), mass cell death occurred. Based on the results of the current work, it can be concluded that the optimal method for adapting microalgae strains to high CO2 concentrations was selected and used.
3. Materials and Methods
3.1. Microalgae Strains and Nutrient Medium
During the initial screening, cultures of microalgae and their consortia with bacteria were selected. The following strains of microalgae with a high growth rate and capable of responding to changing environmental conditions, such as a decrease/increase in the concentration of the main nutrient elements, lability with respect to toxic elements, etc., [14] from the collection of the Renewable Source Energy Laboratory at Lomonosov Moscow State University (RSE LMSU), were used for the experiments: Chlorella vulgaris rsemsu Chv-20/11-Ps, Chlorella ellipsoidea rsemsu Chl-el, Gloeotila pulchra rsemsu Pz-6, Elliptochloris subsphaerica rsemsu N-1/11-B, and a stable consortium of microalgae/cyanobacteria Arthrospira platensis rsemsu P Bios with heterotrophic bacteria (heterotrophic bacteria are the representatives of the genera Pseudomonas, Bacterium, and Bacillus).
The following are descriptions of cultures and nutrient media, as well as the rationale for choosing the listed microalgae for conducting the experiments with high CO2 concentrations.
3.1.1. Arthrospira platensis
Arthrospira platensis (NCBI: https://www.ncbi.nlm.nih.gov/nuccore/KU855375 accessed on 10 June 2023) is a representative of one of the most well-known and cultivated microalgae. It is a filamentous blue-green microalga (cyanobacterium) with straight trichomes. The advantages of A. platensis are, firstly, the ability to grow in open cultivators without contamination by other microorganisms due to the high alkalinity of the nutrient medium for its cultivation (pH = 8.5–11.5), and secondly, the ability to use cheap gravitational methods of biomass harvesting due to the relatively large size of its filaments (up to 800 μm). The microalgae used as primary seeding were grown in planar open-type cultivators with a volume of 500 L, in a semicontinuous way on Zarrouk’s nutrient medium at a constant illumination of 25 ± 3 μE·m−2·s−1 and a temperature of 21 °C with near-surface mixing. The composition of Zarrouk’s medium for cultivation of A. platensis [43]: NaHCO3—16.8 g·L−1, KNO3—3.0 g·L−1, K2HPO4·3H2O—0.66 g·L−1, K2SO4—0.5 g·L−1, MgSO4·7H2O—0.2 g·L−1, NaCl—1.0 g·L−1, CaCl2—0.04 g·L−1, FeSO4·7H2O—0.018 g·L−1, EDTA—0.08 g·L−1, microelement solution for Zarrouk’s medium—1 mL·L−1.
3.1.2. Chlorella ellipsoidea and Chlorella vulgaris
Chlorella ellipsoidea Gern and Chlorella vulgaris Beijer were obtained in 1990 from the collection of microalgae cultures, the Microbiology Department, Faculty of Biology Lomonosov MSU (C. ellipsoidea DMMSU-4, C. vulgaris DMMSU-82). C. ellipsoidea and C. vulgaris are free-living unicellular green microalgae from the genus Chlorella. Culture cells are solitary, small, ellipsoid to spherical in shape, with a diameter of 1.3–6.8 μm. C. ellipsoidea and C. vulgaris were selected according to the results of literature screening [21,28,36,37,38,44] and a preliminary study. These strains are acidophilic; thus, they grow well on Tamiya nutrient medium with the initial pH value of about 5.5. Composition of Tamiya medium (on distilled water) [43]: KNO3—5.0 g·L−1, KH2PO4—1.25 g·L−1, MgSO4·7H2O—2.5 g·L−1, FeSO4·7H2O—0.009 g·L−1, EDTA—0.037 g·L−1, H3BO3—2.86 mg·L−1, MnCI2·4H20—1.81 mg·L−1, ZnSO4·7H2O—0.22 mg·L−1, MnO3—0.018 mg·L−1, NH4VO3—0.023 mg·L−1.
3.1.3. Gloeotila pulchra
Gloeotila pulchra (NCBI: https://www.ncbi.nlm.nih.gov/nuccore/KU961671 accessed on 10 June 2023) is a green, light-loving, free-living planktonic microalgae. The cells are cylindrical, 3.5–4 μm wide and 20–30 μm long, straight, and rounded at the ends. This microalga was selected based on the results of the preliminary screening of cultures. BG-11 cultivation medium composition [43]: NaNO3—1.5 g·L−1, K2HPO4·3H2O—0.04 g·L−1, MgSO4·7H2O—0.075 g·L−1, CaCl2·2H2O—0.04 g·L−1, Na2CO3—0.02 g·L−1, citric acid—0.006 g·L−1, Na2EDTA—0.001 g·L−1, ammonium iron citrate—0.006 g·L−1, microelement solution—1 mL·L−1. Composition of trace elements: H3BO3—2.86 g·L−1; MnCl2·4H2O—1.81 g·L−1; ZnSO4·7H2O—0.22 g·L−1; Na2MnO4·2H2O—0.4 g·L−1; CuSO4·5H2O—0.08 g·L−1; Co(NO3)2·7H2O—0.05 g·L−1.
3.1.4. Elliptochloris subsphaerica
Elliptochloris subsphaerica, (basionym: Pseudochlorella subsphaerica Reisigl, 1964) [NCBI: https://www.ncbi.nlm.nih.gov/nuccore/KU926337 accessed on 10 June 2023] is a planktonic unicellular green microalgae. Algae from this genus have round cells with single chloroplasts divided into two parts, and the cytoplasm is very granulated; the presence of a pyrenoid differs from other species of this genus. The cells have a diameter of 4–8 μm, withlarge cells up to 10 μm in size. BG-11 cultivation medium was used to cultivate E. subsphaerica.
3.2. Experimental Setup
To conduct experiments to test the viability of microalgae strains at high CO2 concentrations, a laboratory installation was created, which includes the following main elements: the atmospheric gas chamber (AGC) and photobioreactors (PBRs) (10 pcs).
3.2.1. Atmospheric Gas Chamber (AGC)
An AGC with a control unit was designed to create a controlled atmosphere with a given composition and parameters (temperature, pressure, gas composition, etc.). The internal volume of the chamber is 12 m3: width 2 m, length 3 m, height 2 m. The chamber is equipped with a door with a width of 0.6 m and a height of 1.6 m.
The AGC is equipped with a heater, cooler, blower, and sockets. The heater is designed to heat the air inside the chamber, the cooler is designed to cool the air inside the chamber, the blower is designed to mix the air mass inside the chamber, and the sockets are designed to connect electrical equipment inside the chamber. The AGC is also equipped with analytical instrumentation: a pressure sensor, a humidity sensor, contact-type temperature sensors with the ability to install at any point inside the chamber, and a gas composition analyzer. The gas analyzer installed in the chamber can determine the concentration of the following gases: oxygen, carbon monoxide, CO2, ammonia, methane, sulfur dioxide, and nitrogen dioxide.
A gas-discharge ramp with CO2 cylinders is connected to the chamber. Thus, the AGC can be configured to automatically maintain given CO2 concentrations. Additionally, the AGC can be configured to automatically maintain the set temperature inside the chamber. A detailed description of the AGC is presented in the earlier work [35].
3.2.2. Photobioreactors (PBRs)
PBRs for testing the viability of microalgae strains at high CO2 concentrations consist of the following main elements:
- –
- Reactors (designed for placing a nutrient medium with microalgae inoculum inside them).
- –
- LED system (designed to evenly distribute the luminous flux around the perimeter of the reactor using strip LED lamps).
- –
- Power supply system of the LED system (designed to supply electrical energy to the LED system), as well as to obtain a luminous flux from the LED system of a certain intensity.
- –
- A system for supplying a gaseous medium from the atmospheric gas chamber to the zone with a suspension of microalgae (designed to ensure continuous bubbling of gas from the atmosphere of the gas chamber through a suspension of microalgae throughout the experiment).
The main components of the reactor are a cylindrical glass flask with a height of 40 cm, an external diameter of 15 cm, a wall thickness of 3 mm, a textile cover for the PBR made of nonsterile cheesecloth with a size of 0.9 × 0.5 m, and an air aerator with the size of 80 × 50 mm, placed at the bottom of the glass flask. The LED system includes a 0.5 m galvanized pipe, a 3 m long LED strip, and a terminal block. The LED system provided illumination of 74.3 µmol quanta·m−2·s−1 on the inside of the PBR. Block diagrams on the example of one PBR and the 10 PBRs involved in the experiment are shown in Figure 9 and Figure 10, respectively. A general view of the PBR system in the amount of 10 pieces inside the AGC and a top view of a single PBR are shown in Figure 11.
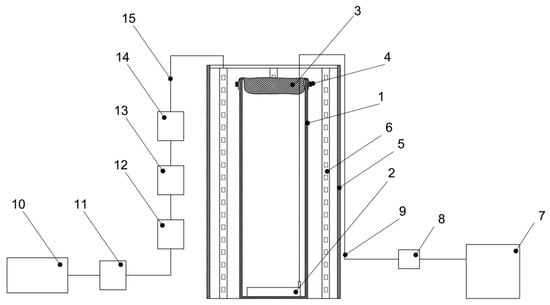
Figure 9.
Schematic diagram of PBR: 1—glass flask, 2—air aerator, 3, 4—textile cover for the PBR made of nonsterile cheesecloth, 5—galvanized pipe, 6—LED strip, 7—compressor, 8—check valve, 9—silicon hose, 10—power supply, 11—dimmer, 12–15—terminals for connecting LED strips to the power supply.
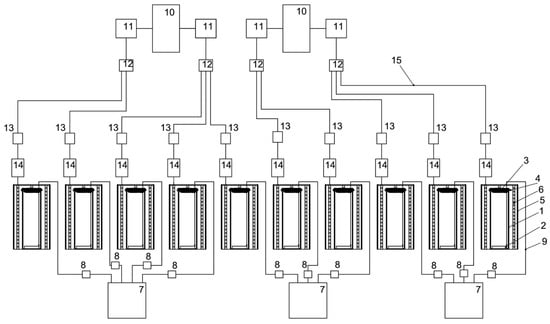
Figure 10.
Schematic diagram of ten PBRs involved in the experiments: 1—glass bulb, 2—air aerator, 3—gauze, 4—stationery elastic band, 5—galvanized pipe, 6—LED strip, 7—air compressor, 8—check valve, 9—silicone hose, 10—power supply, 11—dimmer, 12—universal terminal block mounting branching 2 × 6 wires, 13—power connector kit, 14—universal mounting terminal block 2-wire double-sided, 15—power cable.
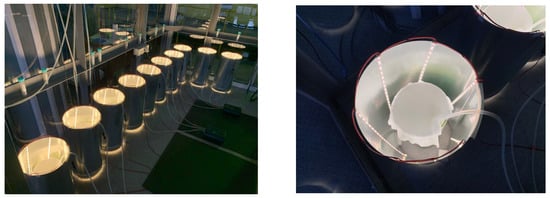
Figure 11.
A general view of ten PBRs inside the AGC and a top view of a single PBR.
3.3. Experimental Procedure
The experiments were carried out using the PBR in the amount of 10 pieces, placed in the AGC. Uniform illumination was provided around the perimeter and height of the PBR using strip LED lights. Illumination was constant (i.e., 24 h per day). The gas–air mixture was fed to the PBR through air aerators, while the gas flow rate adjusted by the compressor was 1 L·min−1. Each reactor was covered with a textile cover on top to minimize contamination of the PBR with nontarget microalgae strains.
Experiments were carried out on the microalgae cultivation on gas–air mixtures with a consequent increase in CO2 content: 0.04% (air), 3%, 6%, and 9%. The method description is given in [35,45]. Each experiment was conducted according to the following procedure:
- Preparation of nutrient medium on distilled water.
- Seeding the medium with an inoculum of each strain to the initial concentration of microalgae biomass (0.2–0.25) g·L−1 in terms of dry weight (wt. %).
- Filling two PBRs with cultural liquid (nutrient medium with inoculum): 4 L in each PBR for each strain.
- Placement of PBRs in the AGC, turning on the lighting and bubbling. Illumination is constant during the experiment.
- CO2 injection to a predetermined concentration in the AGC, sealing the chamber.
- Cultivation of microalgae during 12 days at given constant CO2 concentrations with a sampling of a suspension of microalgae on days 0, 3, 6, 9, and 12 of cultivation to determine the density and growth rate of biomass, pH, as well as the content of nutrients.
- After the end of the experiment and sampling for analysis, microalgae biomass with culture liquid was placed into 5 L containers. This biomass was used as a source of inoculum for seeding of the PBR in the next experiment. The application of this procedure is proposed for the first time.
3.4. Research Methods
3.4.1. The Schedule of Sampling and Analyses
The schedule of sampling, analysis of the state of microalgae (optical density of biomass—OD, pH of the medium, and microscopy), and the composition of the culture medium are presented below:
- –
- Composition of the medium—on days 0 and 12.
- –
- Microscopy—on days 0, 6, and 12.
- –
- OD and pH—on days 0, 3, 6, 9, and 12.
3.4.2. The Conditions of the Experiments
The conditions of the experiments were:
- –
- Microalgae strains: C. vulgaris, C. ellipsoidea, E. subsphaerica, G. pulchra, A. platensis.
- –
- Temperature in the AGC: 23.5 ± 0.5 °C.
- –
- PBR illumination intensity: 74.3 µmol quanta·m−2·s−1.
- –
- Water: distilled.
- –
- Duration: 6 days (experiment no. 1), 12 days (experiments no. 2–no. 4).
- –
- CO2 concentrations: 0.04% (experiment no. 1), 3% (experiment no. 2), 6% (experiment no. 3), and 9% (experiment no. 4).
3.4.3. Nutrient Medium Analysis
The following methods and measuring instruments were used to measure these characteristics:
- –
- OD determination using photometer Expert-003;
- –
- pH determination using the pH meter Expert-pH;
- –
- Quantitative chemical analysis (QCA) was carried out according to the methods presented in Table 1 (the error of the determination methods is about 10%).
 Table 1. Components of the cultural medium and methods for their determination.
3.4.4. Microscopic Analysis
The viability of microorganisms is an integral characteristic of all living systems. This term refers not only to the concept of “living”, but also includes the characteristic, for example, of the genetic and phenotypic usefulness of a living object, its ability to function normally in various, including unfavorable, conditions, as well as the adaptive capabilities of cells, their growth, and reproductive potentials. The paper [46] provides a classification of methods for determining the viability of microorganisms, which are divided into direct and indirect. The first includes methods based on direct consideration of the reproductive ability of living cells, for example, determining the growth rate of biomass. The second—methods of indirect manifestations of cell activity—includes the permeability of the cell wall and the ability of the cell to be stained with various dyes. In the presented work, the method of viability control by the state of the cell permeability barrier based on cytochemical staining of living and dead cells with vital dyes by microscopy and the microculture method according to Imshenetsky were used [47]. The essence of the method of vital staining is that some dyes can penetrate the cell only through the damaged membrane of dead cells, and stain their cytoplasm. Living cells, with undisturbed selective permeability of the cell wall or membrane, do not allow the dye to pass through, and remain colorless. Using methylene blue dye [47,48,49,50], living cells remain colorless, and dead cells are stained blue. Additionally, vital staining of cells with methylene blue makes it possible to assess the metabolism of cells and identify their early changes and, as a result, characterize the state of cells in culture.
Thus, an express method has been developed and tested for determining the viability of microalgae and cyanobacteria cells using a conventional light microscope, in which cell staining occurs/does not occur in a drop of the sample on a sterile slide and cover glasses when adding the intravital aqueous dye methylene blue. As a result, a microcultural method is implemented on a slide in 3–5 min. The method described above was developed for a simple and applicable method for the industrial cultivation of microalgae and cyanobacteria.
In this study, the evaluation of the viability of microalgae and cyanobacteria cells using the cytochemical microscopic method was carried out using the methylene blue aqueous dye at a concentration of 1:10,000. Microscopic monitoring of the state of microalgae cultures and their viability was carried out using a Leica DM 2500 digital microscope and a Mikmed-5—LOMO light microscope. At least 10 fields from each sample of experiments taken on the 6th and 12th day were viewed; at the maximum magnification of the microscope, the number of blue-stained (dead) cells or their clusters was counted, as well as a botanical description of the state of the cells and photography.
4. Conclusions
This study is devoted to the important issue of capturing CO2 with the help of microalgae, which may be of practical importance in the application to carbon dioxide industrial emissions. Cultivation was carried out under controlled laboratory conditions in photobioreactors placed in a closed atmospheric gas chamber; the growth characteristics of microalgae strains (C. vulgaris, C. ellipsoidea, E. subsphaerica, G. pulchra, A. platensis) at various CO2 concentrations (CO2 = 0.04, 3, 6, and 9%) were determined.
To assess the achievable viability of microalgae at high CO2 concentrations, a sequential adaptation mode was implemented in the experiments, when the microalgae biomass grown at lower CO2 concentrations was used as an inoculum at the next stage of the experiment at higher CO2 concentrations. The effectiveness of this approach was confirmed by previous studies with a consortium based on A. platensis with heterotrophic bacteria, when the lack of such a gradual adaptation led to the death of A. platensis cells under a concentration of 9% CO2. Under all concentrations of CO2, increasing biomass density of all microalgae strains was observed; however, the growth rate was different, which indicates the individual resistance of strains to excess CO2. As the concentration of CO2 increased, strains C. vulgaris, C. ellipsoidea, and E. subsphaerica showed a tendency to increase in growth rate (up to 0.35–0.37 g·L−1 wt. % per day), while strains G. pulchra and A. platensis, on the contrary, showed a significant decrease in growth rate (from 0.31 to 0.20 g·L−1 wt. % per day in case of G. pulchra).
These experiments made it possible to determine the most effective strains that can withstand high concentrations of CO2, as well as to show the need for a longer adaptation for such technological and productive strains as A. platensis. An express method has been proposed and tested for determining microalgae cell viability using a light microscope based on cytochemical staining of living and dead cells with the vital dye methylene blue. This method made it possible to determine an insignificant proportion of dead cells even at 9% CO2 concentration, though some gradual inhibition of cells is revealed, which is expressed in deviations of the cell shape from the norm at higher concentrations of CO2.
Thus, effective strains of microalgae have been identified, and the effectiveness of the method used for their adaptation to high CO2 concentrations has been shown. These results, as well as the proposed method of express microscopic analysis of the state of microalgae strains, can serve as a pilot plant’s basis for the utilization of carbon dioxide from gas–air mixtures.
Author Contributions
Investigation, formal analysis, visualization, writing—original draft preparation, E.A.C.; data curation, visualization, A.V.G.; conceptualization, methodology, investigation, resources, S.V.K.; conceptualization, methodology, investigation, resources, N.I.C.; data curation, K.G.R.; writing—review and editing, funding acquisition, V.K.; conceptualization, methodology, investigation, formal analysis, funding acquisition, project administration, M.S.V. All authors have read and agreed to the published version of the manuscript.
Funding
This research received no external funding.
Data Availability Statement
Not applicable.
Conflicts of Interest
The authors declare no conflict of interest.
References
- Yoro, K.; Daramola, M.O. CO2 emission sources, greenhouse gases, and the global warming effect. In Advances in Carbon Capture; Woodhead Publishing: Sawston, UK, 2020; pp. 1–28. [Google Scholar]
- Matsudo, M.; Bezerra, R.; Sato, S.; Converti, A.; Carvalho, J.C. Photosynthetic efficiency and rate of CO2 assimilation by Arthrospira (Spirulina) platensis continuously cultivated in a tubular photobioreactor. Biotechnol. J. 2012, 7, 1412–1417. [Google Scholar] [CrossRef] [PubMed]
- Hartwig Duarte, J.; Morais, E.; Radmann, E.; Costa, J.A. Biological CO2 mitigation from coal power plant by Chlorella fusca and Spirulina sp. Bioresour. Technol. 2017, 234, 472–475. [Google Scholar] [CrossRef] [PubMed]
- Vale, M.A.; Ferreira, A.; Pires, J.C.M.; Gonçalves, A.L. Chapter 17—CO2 capture using microalgae. In Advances in Carbon Capture; Rahimpour, M.R., Farsi, M., Makarem, M.A., Eds.; Woodhead Publishing: Sawston, UK, 2020; pp. 381–405. [Google Scholar]
- Raslavičius, L.; Semenov, V.G.; Chernova, N.I.; Keršys, A.; Kopeyka, A.K. Producing Transportation Fuels from Algae: In Search of Synergy. Renew. Sustain. Energy Rev. 2014, 40, 133–142. [Google Scholar] [CrossRef]
- Hsueh, H.T.; Chu, H.; Yu, S. A batch study on the bio-fixation of carbon dioxide in the absorbed solution from a chemical wet scrubber by hot spring and marine algae. Chemosphere 2007, 66, 878–886. [Google Scholar] [CrossRef]
- Zhu, X.-G.; Long, S.P.; Ort, D.R. What is the maximum efficiency with which photosynthesis can convert solar energy into biomass? Curr. Opin. Biotechnol. 2008, 19, 153–159. [Google Scholar] [CrossRef]
- Yang, J.; Long, S.P.; Ort, D.R. Life-cycle Analysis on Biodiesel Production from Microalgae: Water Footprint and Nutrients Balance. Bioresour. Technol. 2011, 102, 159–165. [Google Scholar] [CrossRef]
- Chernova, N.I.; Kiseleva, S.V. The wastewater using in technologies of bio-oil production from microalgae: CO2 capture and storage. In IOP Conference Series: Materials Science and Engineering; IOP Publishing: Bristol, UK, 2021; Volume 1037. [Google Scholar] [CrossRef]
- Alprol, A.E.; Heneash, A.M.M.; Ashour, M.; Abualnaja, K.M.; Alhashmialameer, D.; Mansour, A.T.; Sharawy, Z.Z.; Abu-Saied, M.A.; Abomohra, A.E.-F. Potential Applications of Arthrospira platensis Lipid-Free Biomass in Bioremediation of Organic Dye from Industrial Textile Effluents and Its Influence on Marine Rotifer (Brachionus plicatilis). Materials 2021, 14, 4446. [Google Scholar] [CrossRef]
- Ashour, M.; Alprol, A.E.; Heneash, A.M.M.; Saleh, H.; Abualnaja, K.M.; Alhashmialameer, D.; Mansour, A.T. Ammonia Bioremediation from Aquaculture Wastewater Effluents Using Arthrospira platensis NIOF17/003: Impact of Biodiesel Residue and Potential of Ammonia-Loaded Biomass as Rotifer Feed. Materials 2021, 14, 5460. [Google Scholar] [CrossRef]
- Wang, K.; Razzano, M.; Mou, X. Cyanobacterial blooms alter the relative importance of neutral and selective processes in assembling freshwater bacterioplankton community. Sci. Total Environ. 2020, 706, 135724. [Google Scholar] [CrossRef]
- Huisman, J.; Codd, G.A.; Paerl, H.W.; Ibelings, B.W.; Verspagen, J.M.H.; Visser, P.M. Cyanobacterial blooms. Nat. Rev. Microbiol. 2018, 16, 471–483. [Google Scholar] [CrossRef] [PubMed]
- Chernova, N.I.; Kiseleva, S.V. Microalgae Biofuels: Induction of Lipid Synthesis for Biodiesel Production and Biomass Residues into Hydrogen Conversion. Int. J. Hydrogen Energy 2017, 42, 2861–2867. [Google Scholar] [CrossRef]
- Sinetova, M.A.; Sidorov, R.A.; Starikov, A.Y.; Voronkov, A.S.; Medvedeva, A.S.; Krivova, Z.V.; Pakholkova, M.S.; Bachin, D.V.; Bedbenov, V.S.; Gabrielyan, D.A.; et al. Assessment of biotechnological potential of cyanobacteria and microalgae strains from the IPPAS culture collection. Appl. Biochem. Microbiol. 2020, 56, 36. [Google Scholar] [CrossRef]
- Chernova, N.I.; Grigorenko, A.V.; Kiseleva, S.V.; Larina, O.M.; Kumar, V.; Vlaskin, M.S. Comparative evaluation of pyrolysis and hydrothermal liquefaction for obtaining biofuel from a sustainable consortium of microalgae Arthrospira platensis with heterotrophic bacteria. Processes 2022, 10, 2202. [Google Scholar] [CrossRef]
- Ashour, M.; Omran, A.M.M. Recent Advances in Marine Microalgae Production: Highlighting Human Health Products from Microalgae in View of the Coronavirus Pandemic (COVID-19). Fermentation 2022, 8, 466. [Google Scholar] [CrossRef]
- Zhou, W.; Min, M.; Hu, B.; Ma, X.; Liu, Y.; Wang, Q.; Shi, J.; Chen, P.; Ruan, R. Filamentous fungi assisted bio-flocculation: A novel alternative technique for harvesting heterotrophic and autotrophic microalgal cells. Sep. Purif. Technol. 2013, 107, 158–165. [Google Scholar] [CrossRef]
- Chen, J.; Leng, L.; Ye, C.; Lu, Q.; Addy, M.; Wang, J.; Liu, J.; Chen, P.; Ruan, R.; Zhou, W. A comparative study between fungal pellet-and spore-assisted microalgae harvesting methods for algae bioflocculation. Bioresour. Technol. 2018, 259, 181–190. [Google Scholar] [CrossRef]
- Heilmann, S.M.; Davis, H.T.; Jader, L.R.; Lefebvre, P.A.; Sadowsky, M.J.; Schendel, F.J.; Von Keitz, M.G.; Valentas, K.J. Hydrothermal Carbonization of Microalgae. Biomass Bioenergy 2010, 34, 875–882. [Google Scholar] [CrossRef]
- Aslam, A.; Thomas-Hall, S.; Mughal, T.; Schenk, P. Selection and adaptation of microalgae to growth in 100% unfiltered coal-fired flue gas. Bioresour. Technol. 2017, 233, 271–283. [Google Scholar] [CrossRef] [PubMed]
- Chiu, S.-Y.; Kao, C.-Y.; Chen, C.-H.; Kuan, T.-C.; Ong, S.-C.; Lin, C.-S. Reduction of CO2 by a high-density culture of Chlorella sp. in a semicontinuous photobioreactor. Bioresour. Technol. 2008, 99, 3389–3396. [Google Scholar] [CrossRef] [PubMed]
- Morais, M.; Costa, J.A. Biofixation of carbon dioxide by Spirulina sp. and Scenedesmus obliquus cultivated in a three-stage serial tubular photobioreactor. J. Biotechnol. 2007, 129, 439–445. [Google Scholar] [CrossRef] [PubMed]
- Yahya, L.; Harun, R.; Luqman Chuah, A. Screening of native microalgae species for carbon fixation at the vicinity of Malaysian coal-fired power plant. Sci. Rep. 2020, 10, 22355. [Google Scholar] [CrossRef]
- Almomani, F.; Judd, S.; Bhosale, R.; Shurair, M.; Aljaml, K.; Khraisheh, M. Intergraded wastewater treatment and carbon bio-fixation from flue gases using Spirulina platensis and mixed algal culture. Process Saf. Environ. Prot. 2019, 124, 240–250. [Google Scholar] [CrossRef]
- Olivieri, G.; Gargano, I.; Andreozzi, R.; Marotta, R.; Marzocchella, A.; Pinto, G.; Pollio, A. Effects of CO2 and pH on Stichococcus bacillaris in Laboratory Scale Photobioreactors. Chem. Eng. Trans. 2012, 27, 127–132. [Google Scholar]
- Sergeenko, T.V.; Muradyan, E.A.; Pronina, N.A.; Klyachko-Gurvich, G.L.; Tsoglin, L.N.; Mishina, I.M. The effect of extremely high CO2 concentration on the growth and biochemical composition of microalgae. Plant Physiol. 2000, 47, 722–729. [Google Scholar]
- Hossain, N.; Meurah, T.; Mahlia, T.M.I. Progress in physicochemical parameters of microalgae cultivation for biofuel production. Crit. Rev. Biotechnol. 2019, 39, 835–859. [Google Scholar] [CrossRef] [PubMed]
- Zhu, B.; Xiao, T.; Shen, H.; Li, Y.; Ma, X.; Zhao, Y.; Pan, K. Effects of CO2 concentration on carbon fixation capability and production of valuable substances by Spirulina in a columnar photobioreactor. Algal Res. 2021, 56, 102310. [Google Scholar] [CrossRef]
- Ramirez-Perez, J.C.; Janes, H. Impact of salinity on the kinetics of CO2 fixation by Spirulina platensis cultivated in semi-continuous photobioreactors. Eclética Química J. 2021, 46, 21–34. [Google Scholar] [CrossRef]
- Zhao, B.; Su, Y. Process effect of microalgal-carbon dioxide fixation and biomass production: A review. Renew. Sustain. Energy Rev. 2014, 31, 121–132. [Google Scholar] [CrossRef]
- Baohua, Z.; Shen, H.; Li, Y.; Liu, Q.; Jin, G.; Han, J.; Zhao, Y.; Pan, K. Large-Scale Cultivation of Spirulina for Biological CO2 Mitigation in Open Raceway Ponds Using Purified CO2 From a Coal Chemical Flue Gas. Front. Bioeng. Biotechnol. 2020, 7, 441. [Google Scholar] [CrossRef]
- Kim, Y.; Lee, S.-H. Quantitative analysis of Spirulina platensis growth with CO2 mixed aeration. Environ. Eng. Res. 2018, 23, 216–222. [Google Scholar] [CrossRef]
- Liu, W.; Wang, J.; Liu, T. Low pH rather than high CO2 concentration itself inhibits growth of Arthrospira. Sci. Total Environ. 2019, 666, 572–580. [Google Scholar] [CrossRef]
- Chunzhuk, E.A.; Grigorenko, A.V.; Chernova, N.I.; Kiseleva, S.V.; Ryndin, K.G.; Popel, O.S.; Malaniy, S.Y.; Slavkina, O.V.; de Farias Neves, F.; Leng, L.; et al. Direct Study of CO2 Capture Efficiency during Microalgae Arthrospira platensis Cultivation at High CO2 Concentrations. Energies 2023, 16, 822. [Google Scholar] [CrossRef]
- Lizzul, A.; Hellier, P.; Purton, S.; Baganz, F.; Ladommatos, N.; Campos, L. Combined remediation and lipid production using Chlorella sorokiniana grown on wastewater and exhaust gases. Bioresour. Technol. 2013, 151C, 12–18. [Google Scholar] [CrossRef]
- Hulatt, C.; Thomas, D. Productivity, carbon dioxide uptake and net energy return of microalgal bubble column photobioreactors. Bioresour. Technol. 2011, 102, 5775–5787. [Google Scholar] [CrossRef]
- Maeda, K.; Owada, M.; Kimura, N.; Omata, K.; Karube, I. CO2 fixation from the flue gas on coal-fired thermal power plant by microalgae. Energy Convers. Manag. 1996, 36, 717–720. [Google Scholar] [CrossRef]
- Gabrielyan, D.A.; Gabel, B.V.; Sinetova, M.A.; Gabrielian, A.K.; Markelova, A.G.; Shcherbakova, N.V.; Los, D.A. Optimization of CO2 Supply for the Intensive Cultivation of Chlorella sorokiniana IPPAS C-1 in the Laboratory and Pilot-Scale Flat-Panel Photobioreactors. Life 2022, 12, 1469. [Google Scholar] [CrossRef]
- Zhang, B.; Wu, J.; Meng, F. Adaptive Laboratory Evolution of Microalgae: A Review of the Regulation of Growth, Stress Resistance, Metabolic Processes, and Biodegradation of Pollutants. Front. Microbiol. 2021, 12, 737248. [Google Scholar] [CrossRef]
- Lam, M.K.; Lee, K.T.; Mohamed, A.R. Current status and challenges on microalgae-based carbon capture. Int. J. Greenh. Gas Control 2012, 10, 456–469. [Google Scholar] [CrossRef]
- Cheng, D.; Li, X.; Yuan, Y.; Yang, C.; Tang, T.; Zhao, Q.; Sun, Y. Adaptive evolution and carbon dioxide fixation of Chlorella sp. in simulated flue gas. Sci. Total Environ. 2019, 650, 2931–2938. [Google Scholar] [CrossRef]
- Semenenko, V.E. (Ed.) Catalogue of Microalgal Cultures in the Collections of the USSR; Publishing House of the Russian Academy of Sciences: Moscow, Russia, 1991; p. 55. [Google Scholar]
- Li, D.; Wang, L.; Zhao, Q.; Wei, W.; Sun, Y. Improving high carbon dioxide tolerance and carbon dioxide fixation capability of Chlorella sp. by adaptive laboratory evolution. Bioresour. Technol. 2015, 185, 269–275. [Google Scholar] [CrossRef]
- Vlaskin, M.S.; Kiseleva, S.V.; Chernova, N.I.; Grigorenko, A.V.; Ryndin, K.G.; Popel’, O.S.; Malanii, S.Y.; Slavkina, O.V.; de Farias Naves, F.; Kumar, V. Effectiveness of CO2 Capture by Arthrospira platensis Microalgae from a Mixture Simulating Flue Gases. Therm. Eng. 2023, 70, 370–383. [Google Scholar] [CrossRef]
- Lusta, K.A.; Fichte, B.A. Methods for Determining the Viability of Microorganisms; DSTI SCBR AS USSR: Pushchino, Russia, 1990. [Google Scholar]
- Imshenetsky, A.A. Attitude to the coloring of living and dead yeast cells. Microbiology 1993, 2, 162–163. [Google Scholar]
- Fraser, C.G. The Action of Methylene Blue and Certain other Dyes on Living and Dead Yeast. J. Phys. Chem. 2002, 24, 741–748. [Google Scholar] [CrossRef]
- Fulmer, E.I.; Buchanan, R.E. Studies on toxicity. J. Gen. Physiol. 1923, 6, 77–89. [Google Scholar] [CrossRef]
- Lee, S.S.; Robinson, F.M.; Wang, H.Y. Rapid Determination of Yeast Viability; University of Michigan: Ann Arbor, MI, USA, 1981; Volume 11. [Google Scholar]


Disclaimer/Publisher’s Note: The statements, opinions and data contained in all publications are solely those of the individual author(s) and contributor(s) and not of MDPI and/or the editor(s). MDPI and/or the editor(s) disclaim responsibility for any injury to people or property resulting from any ideas, methods, instructions or products referred to in the content. |
© 2023 by the authors. Licensee MDPI, Basel, Switzerland. This article is an open access article distributed under the terms and conditions of the Creative Commons Attribution (CC BY) license (https://creativecommons.org/licenses/by/4.0/).