
Comparative Determination of Phenolic Compounds in Arabidopsis thaliana Leaf Powder under Distinct Stress Conditions Using Fourier-Transform Infrared (FT-IR) and Near-Infrared (FT-NIR) Spectroscopy

 , ,
, ,  , ,
, ,  , and
, and 
Abstract
:1. Introduction
2. Results and Discussion
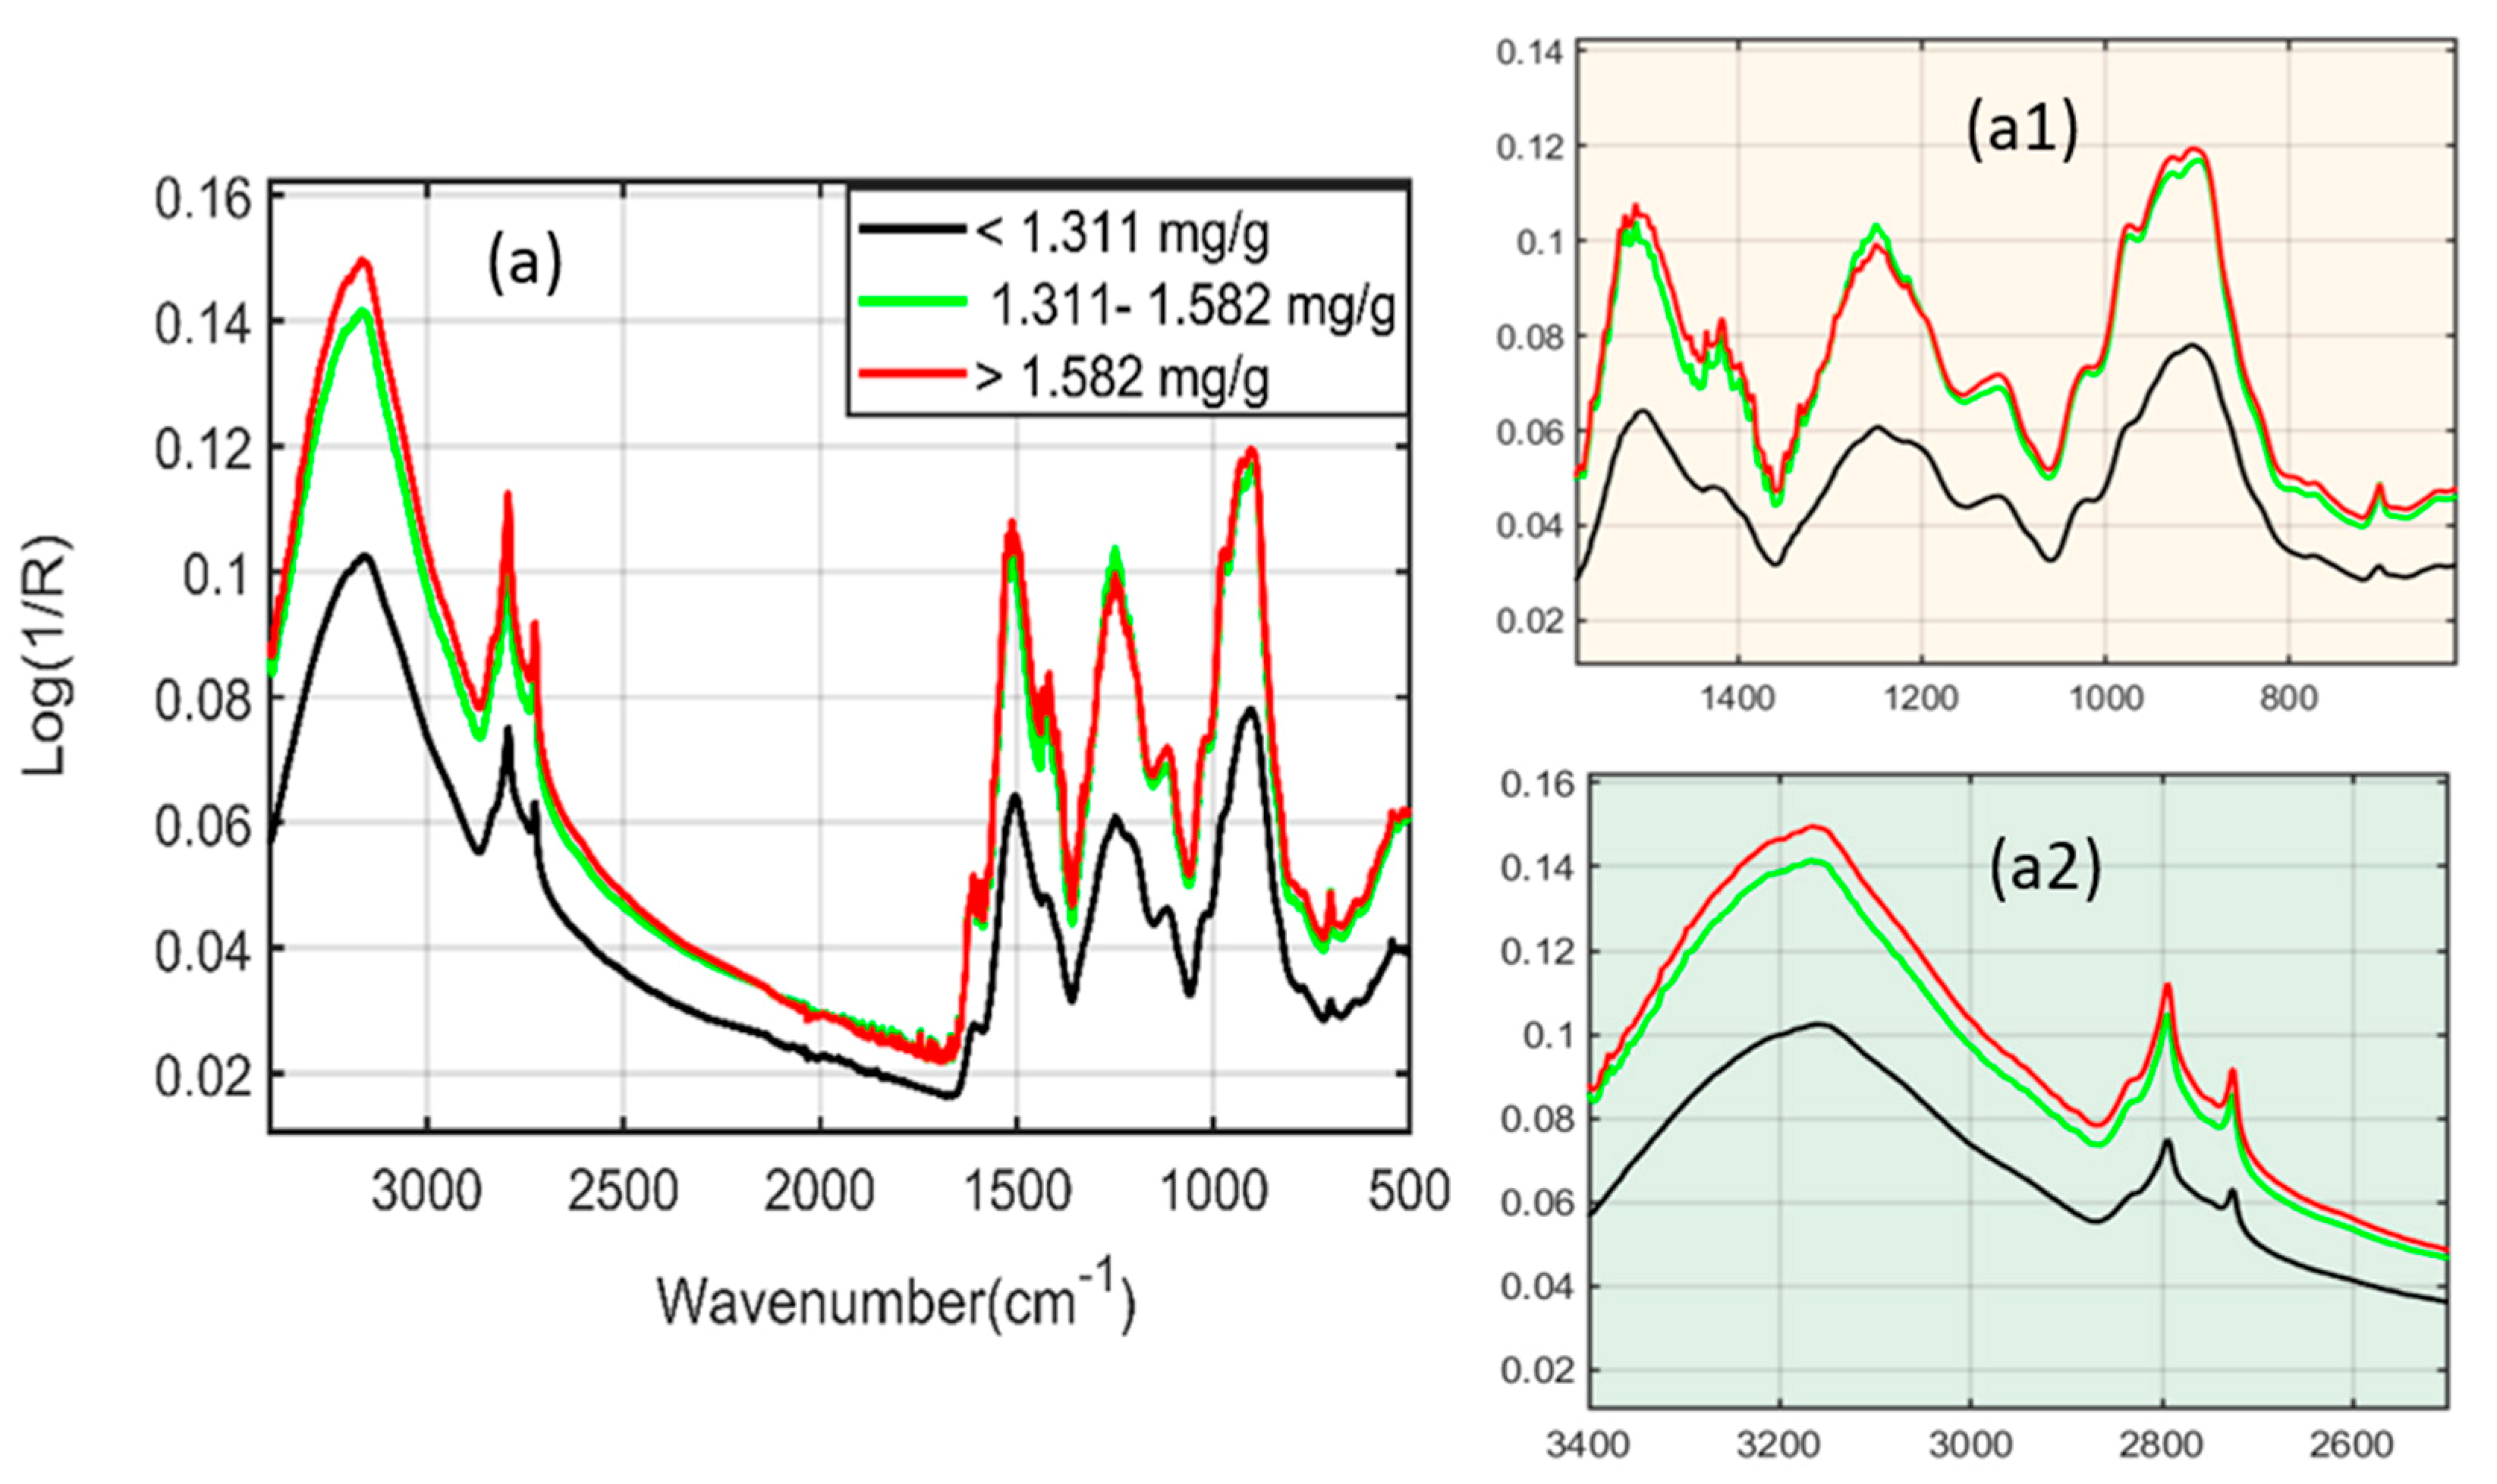
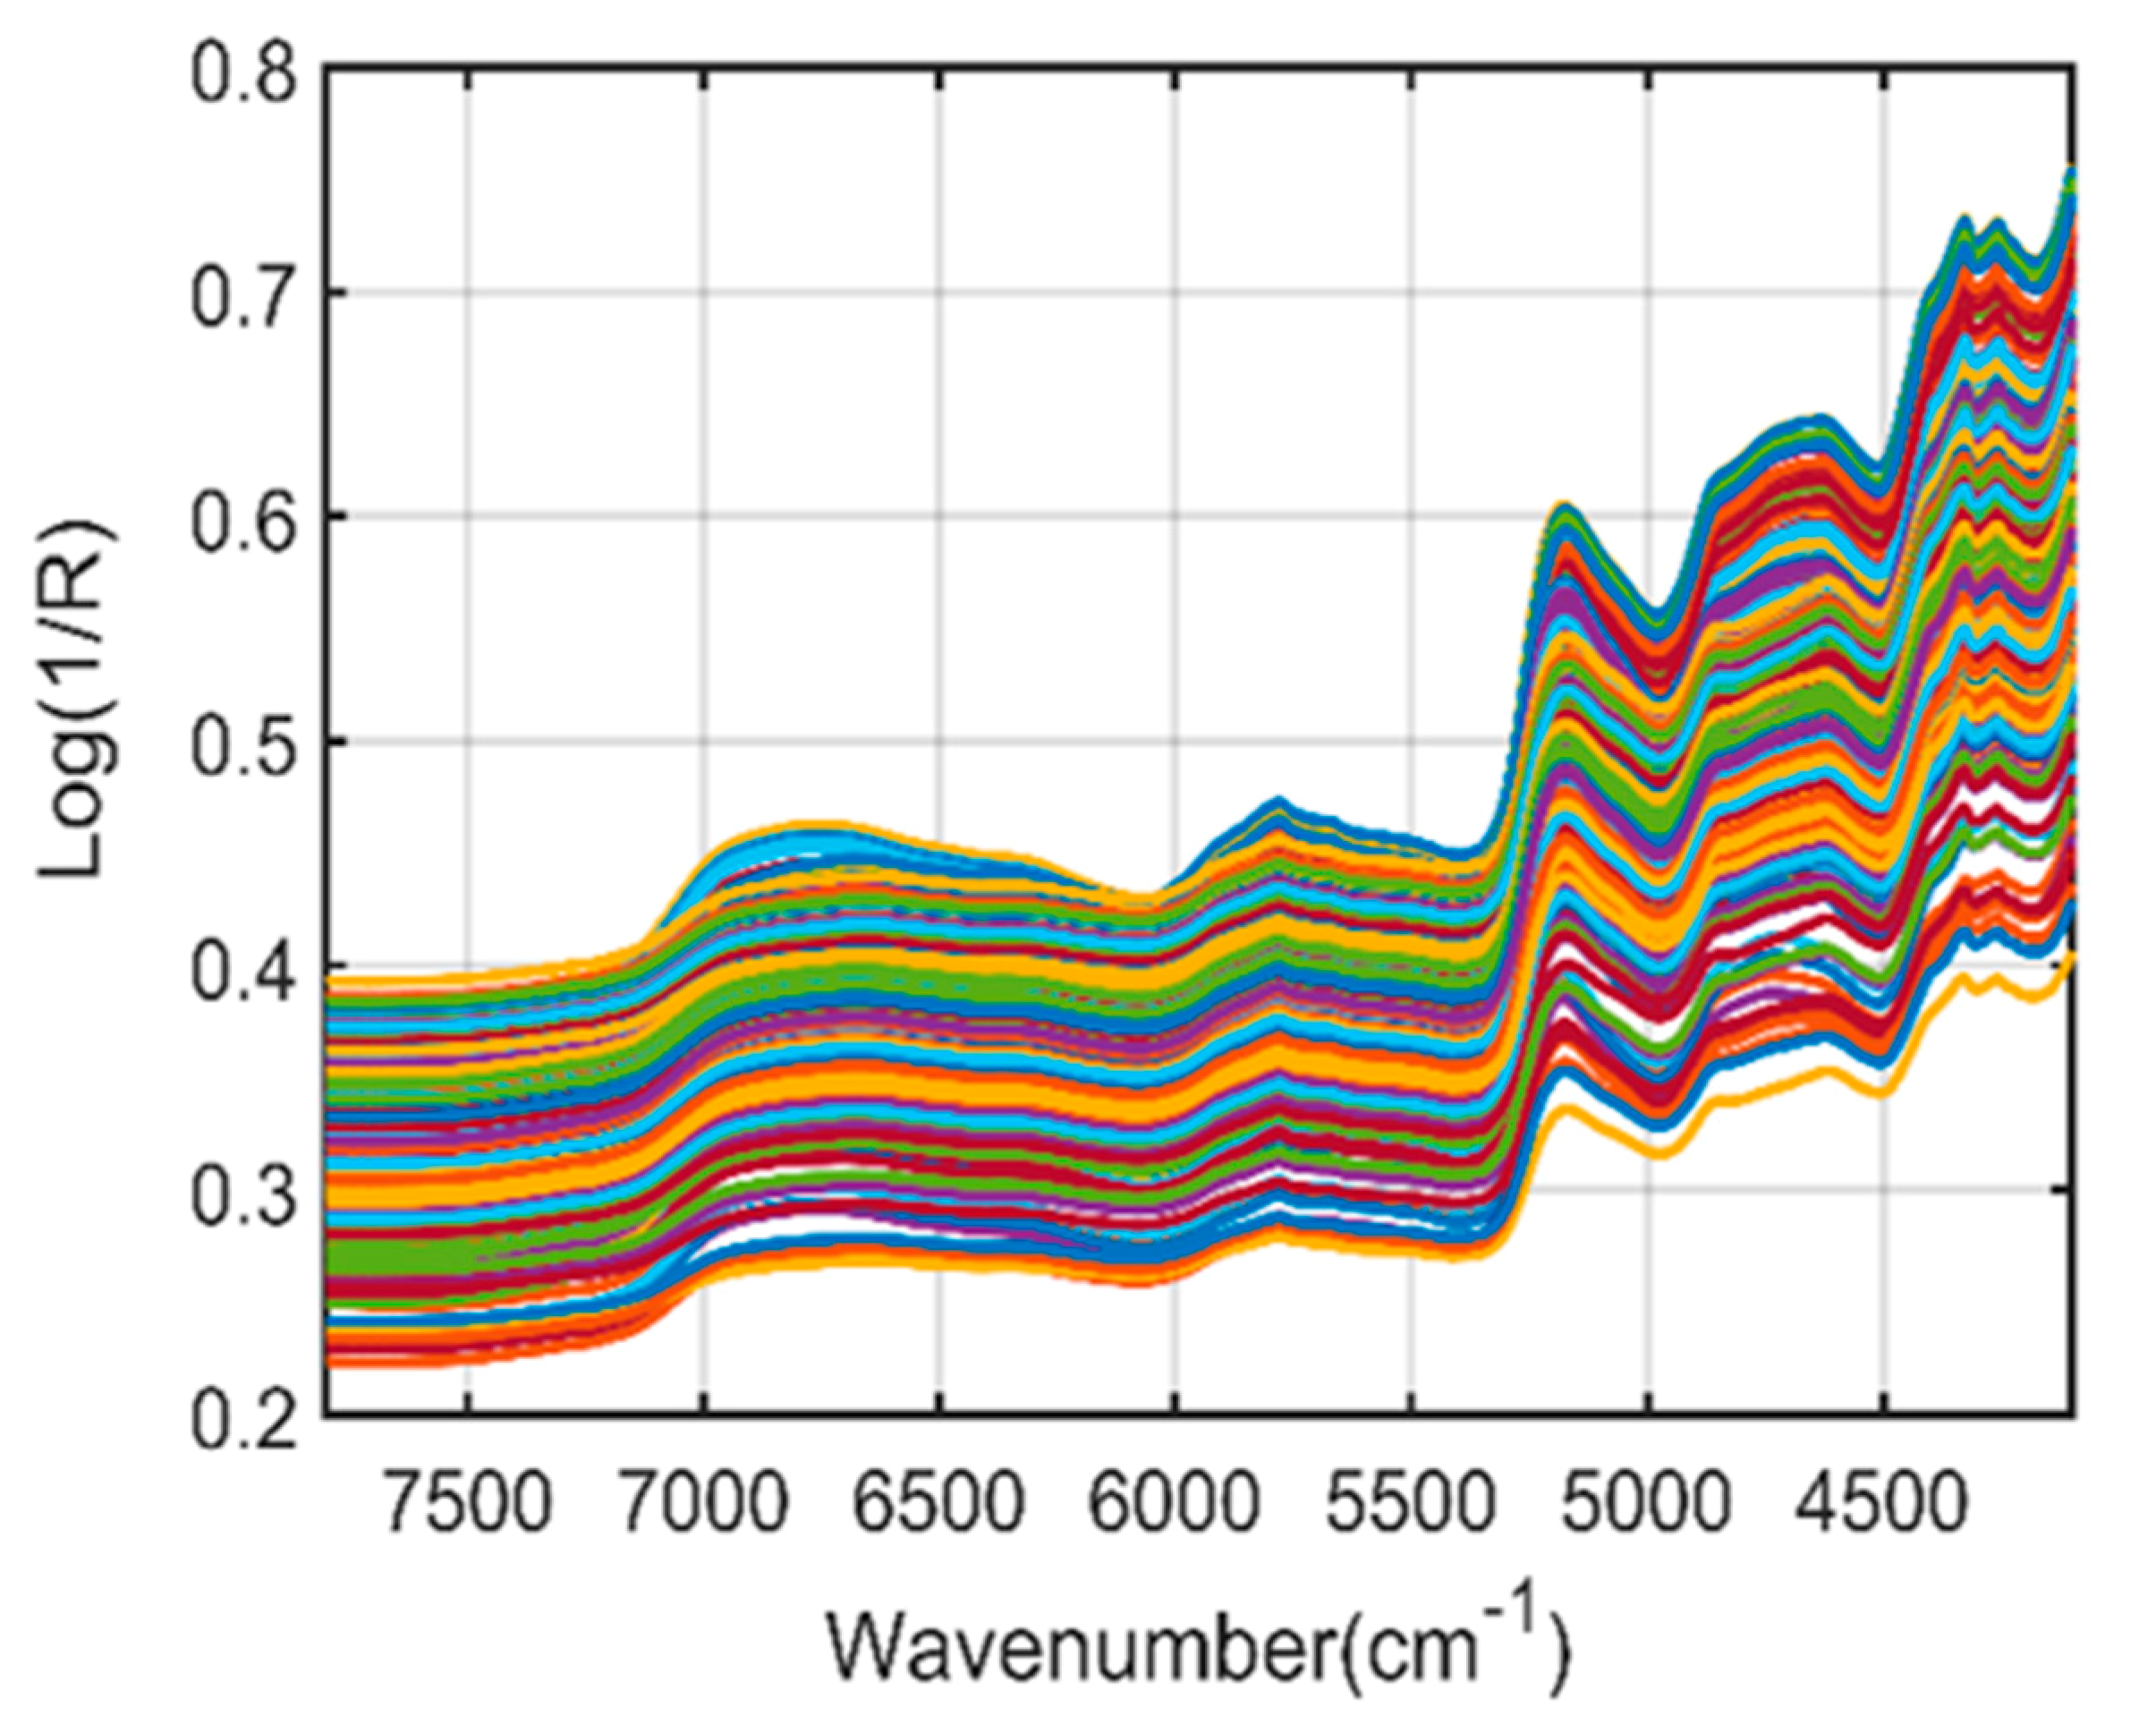
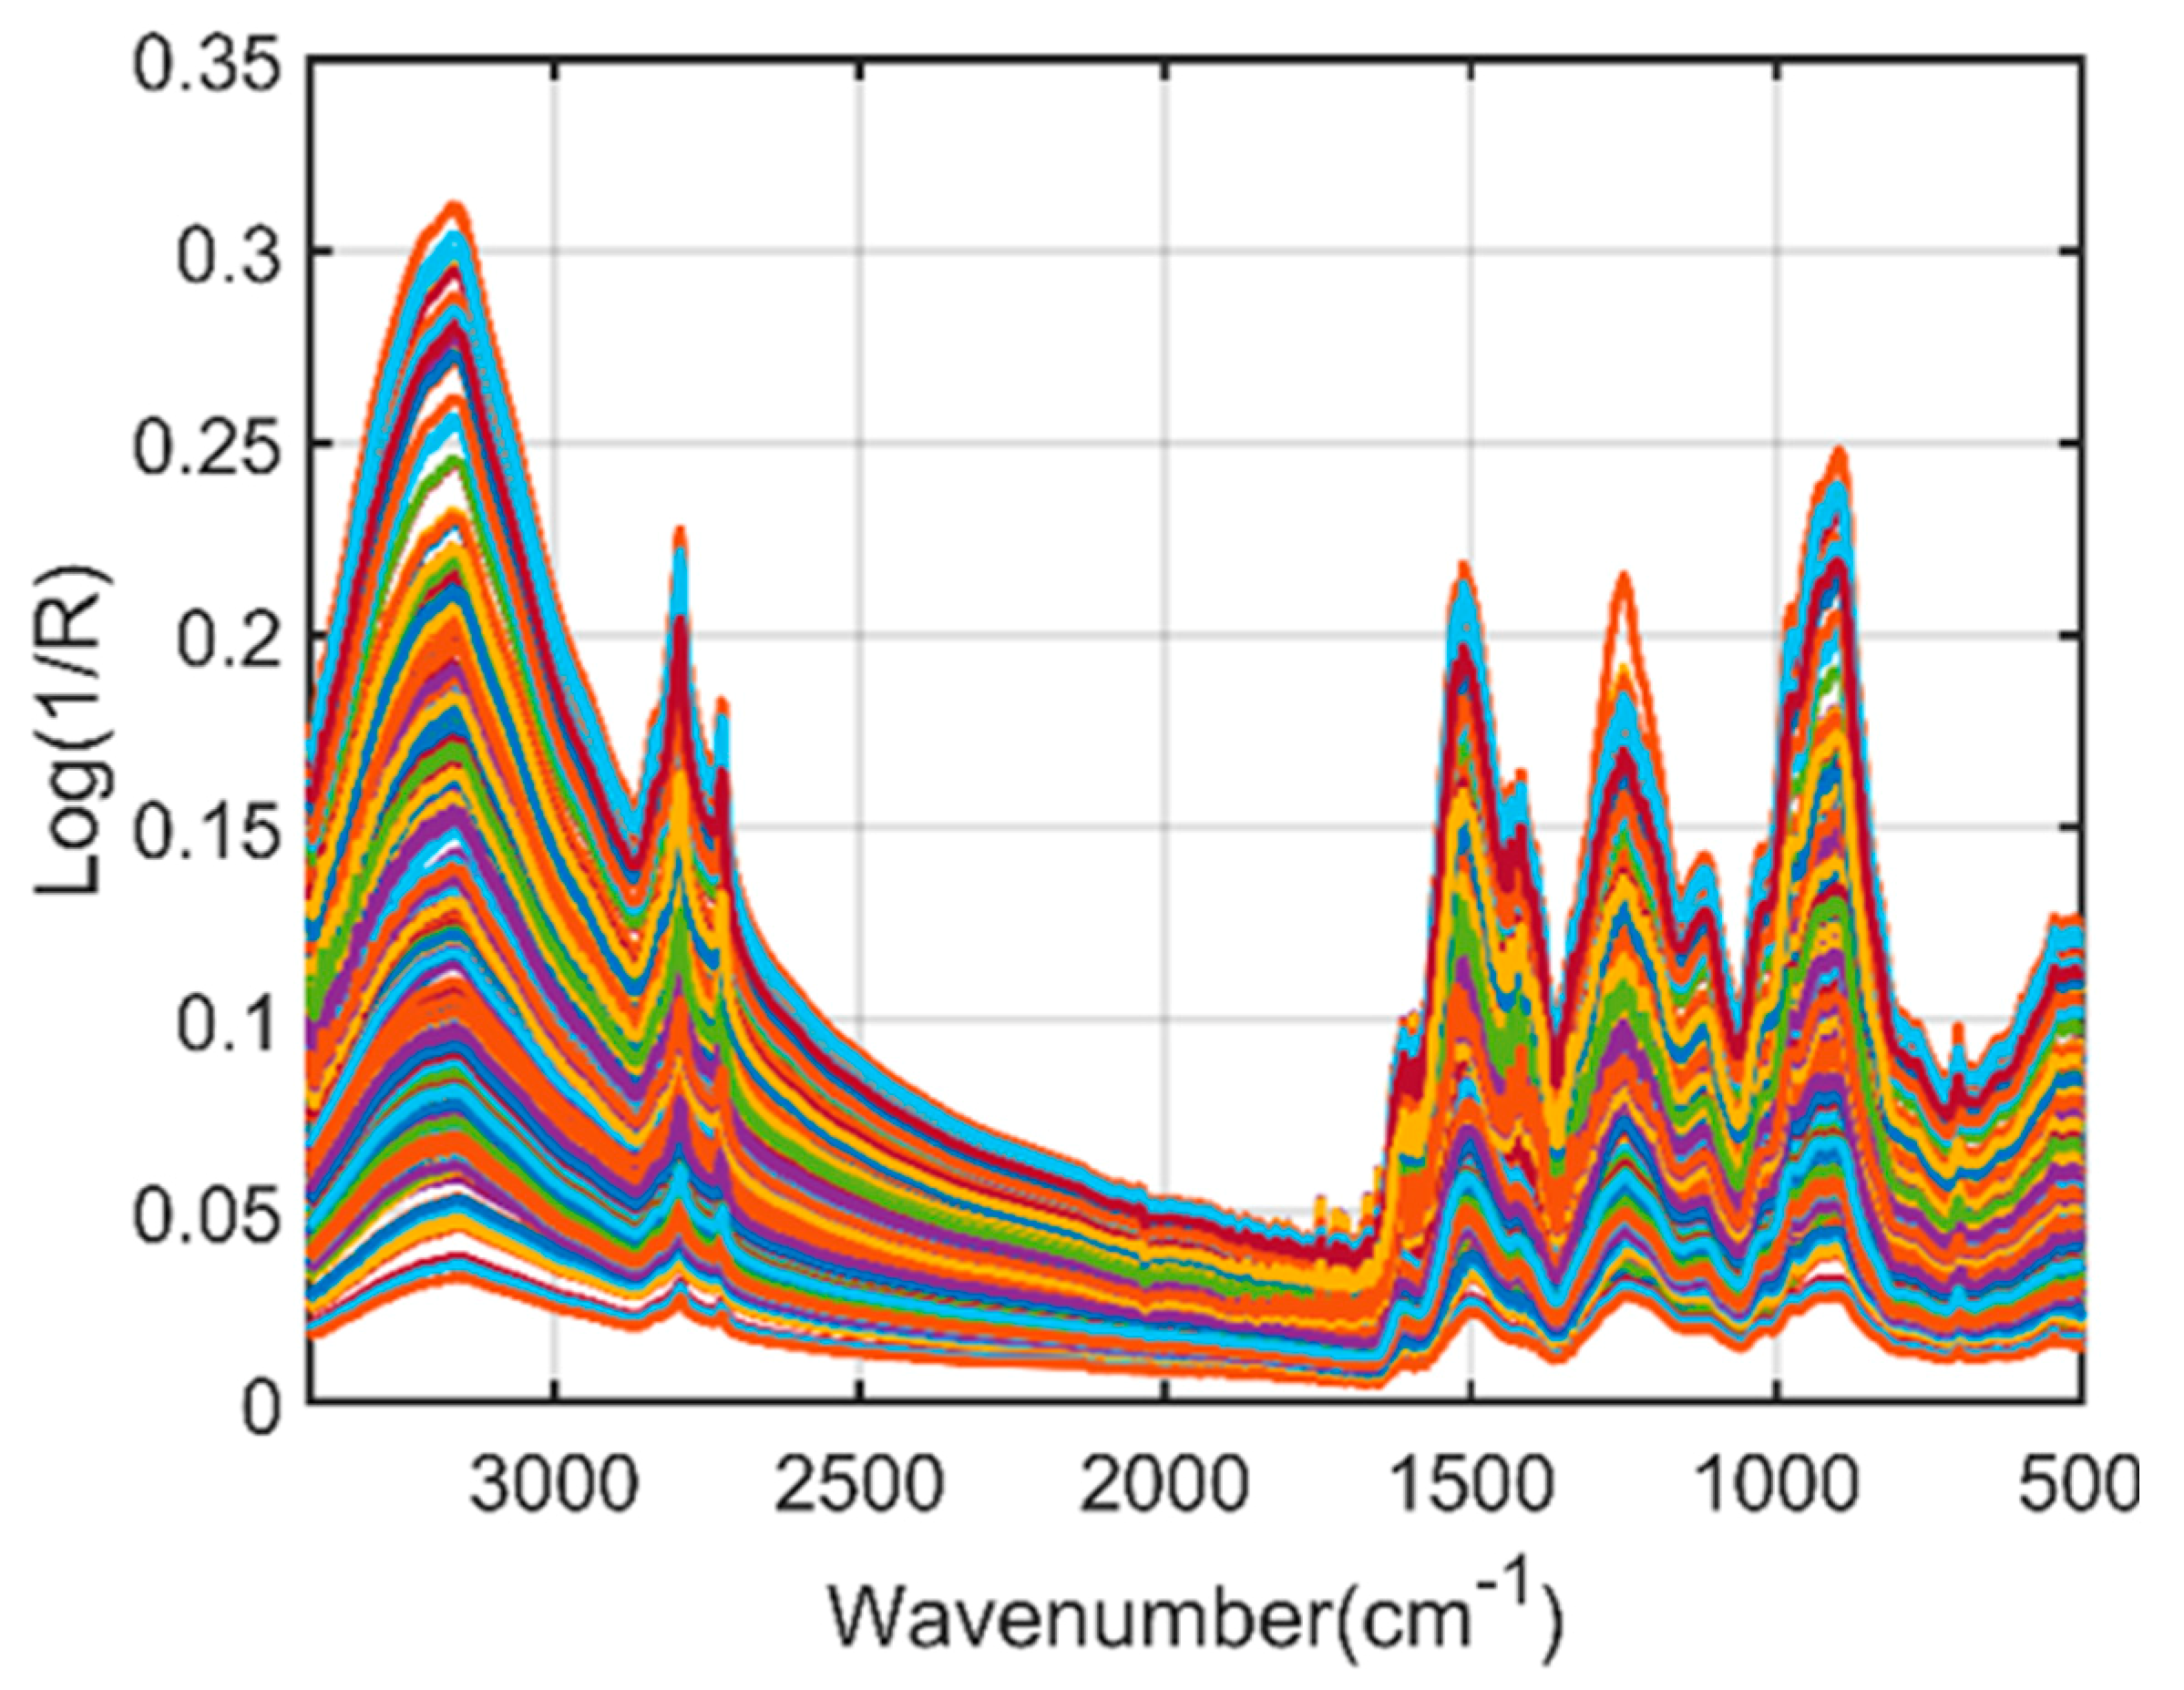
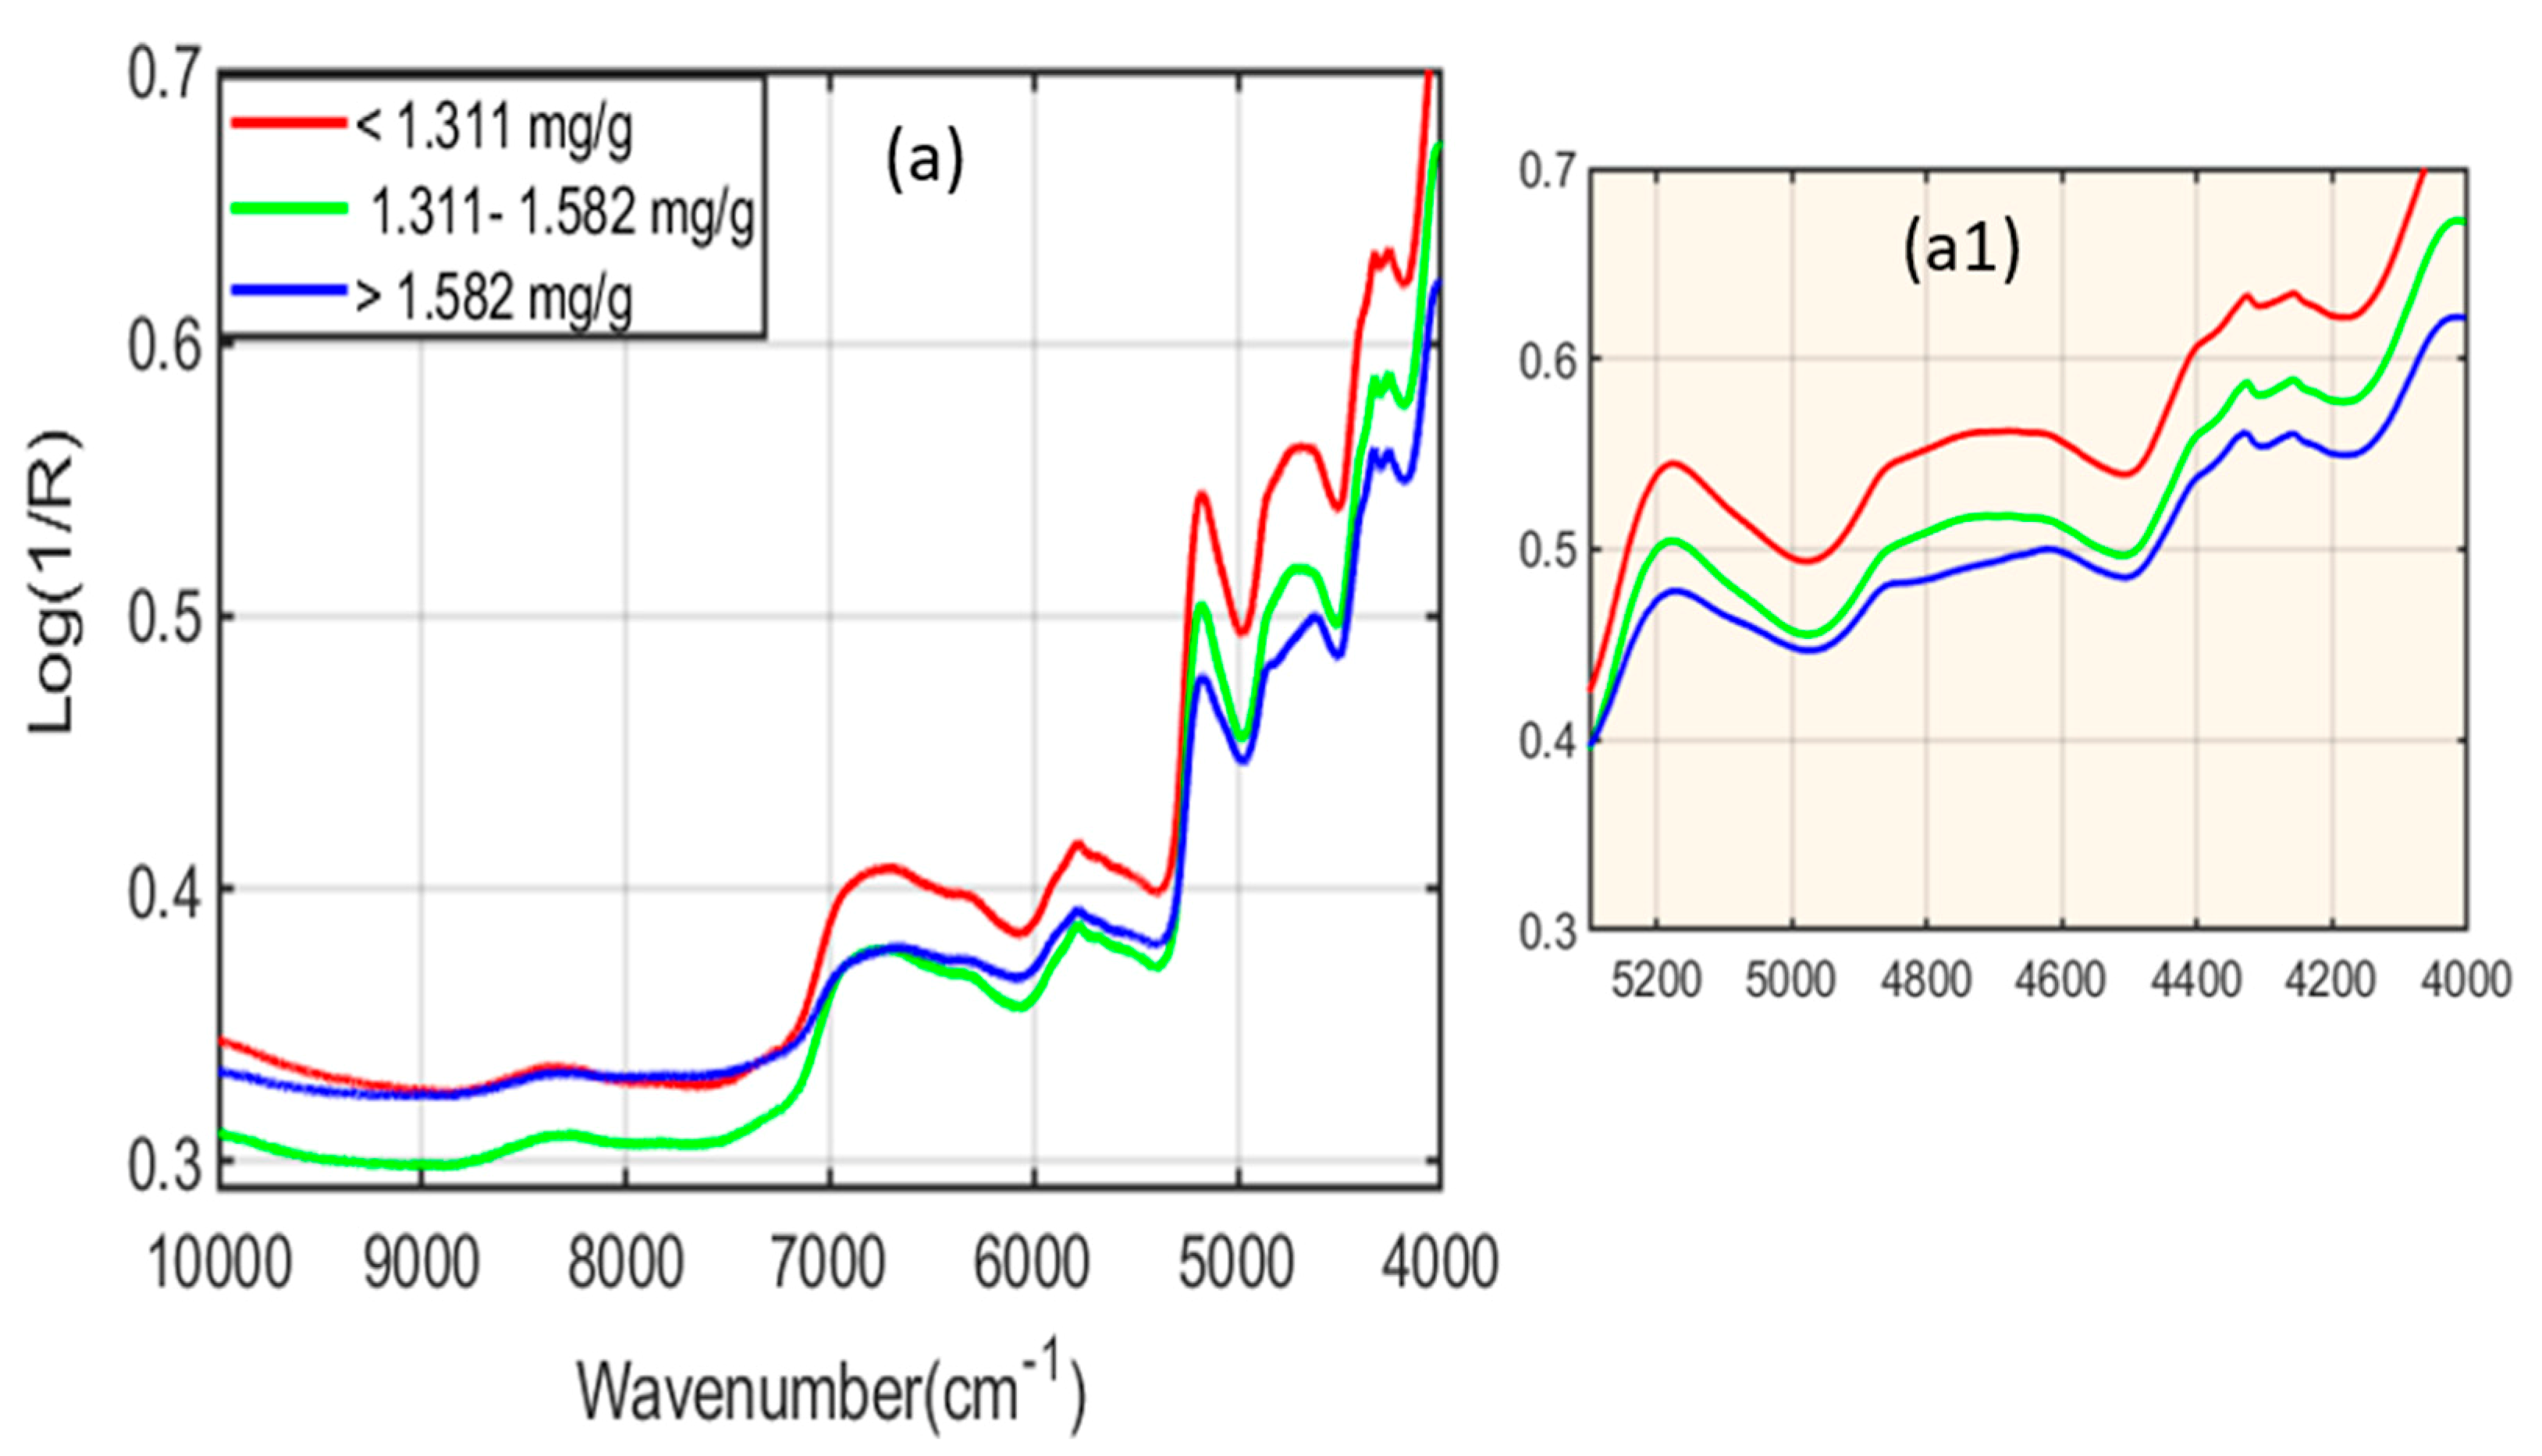
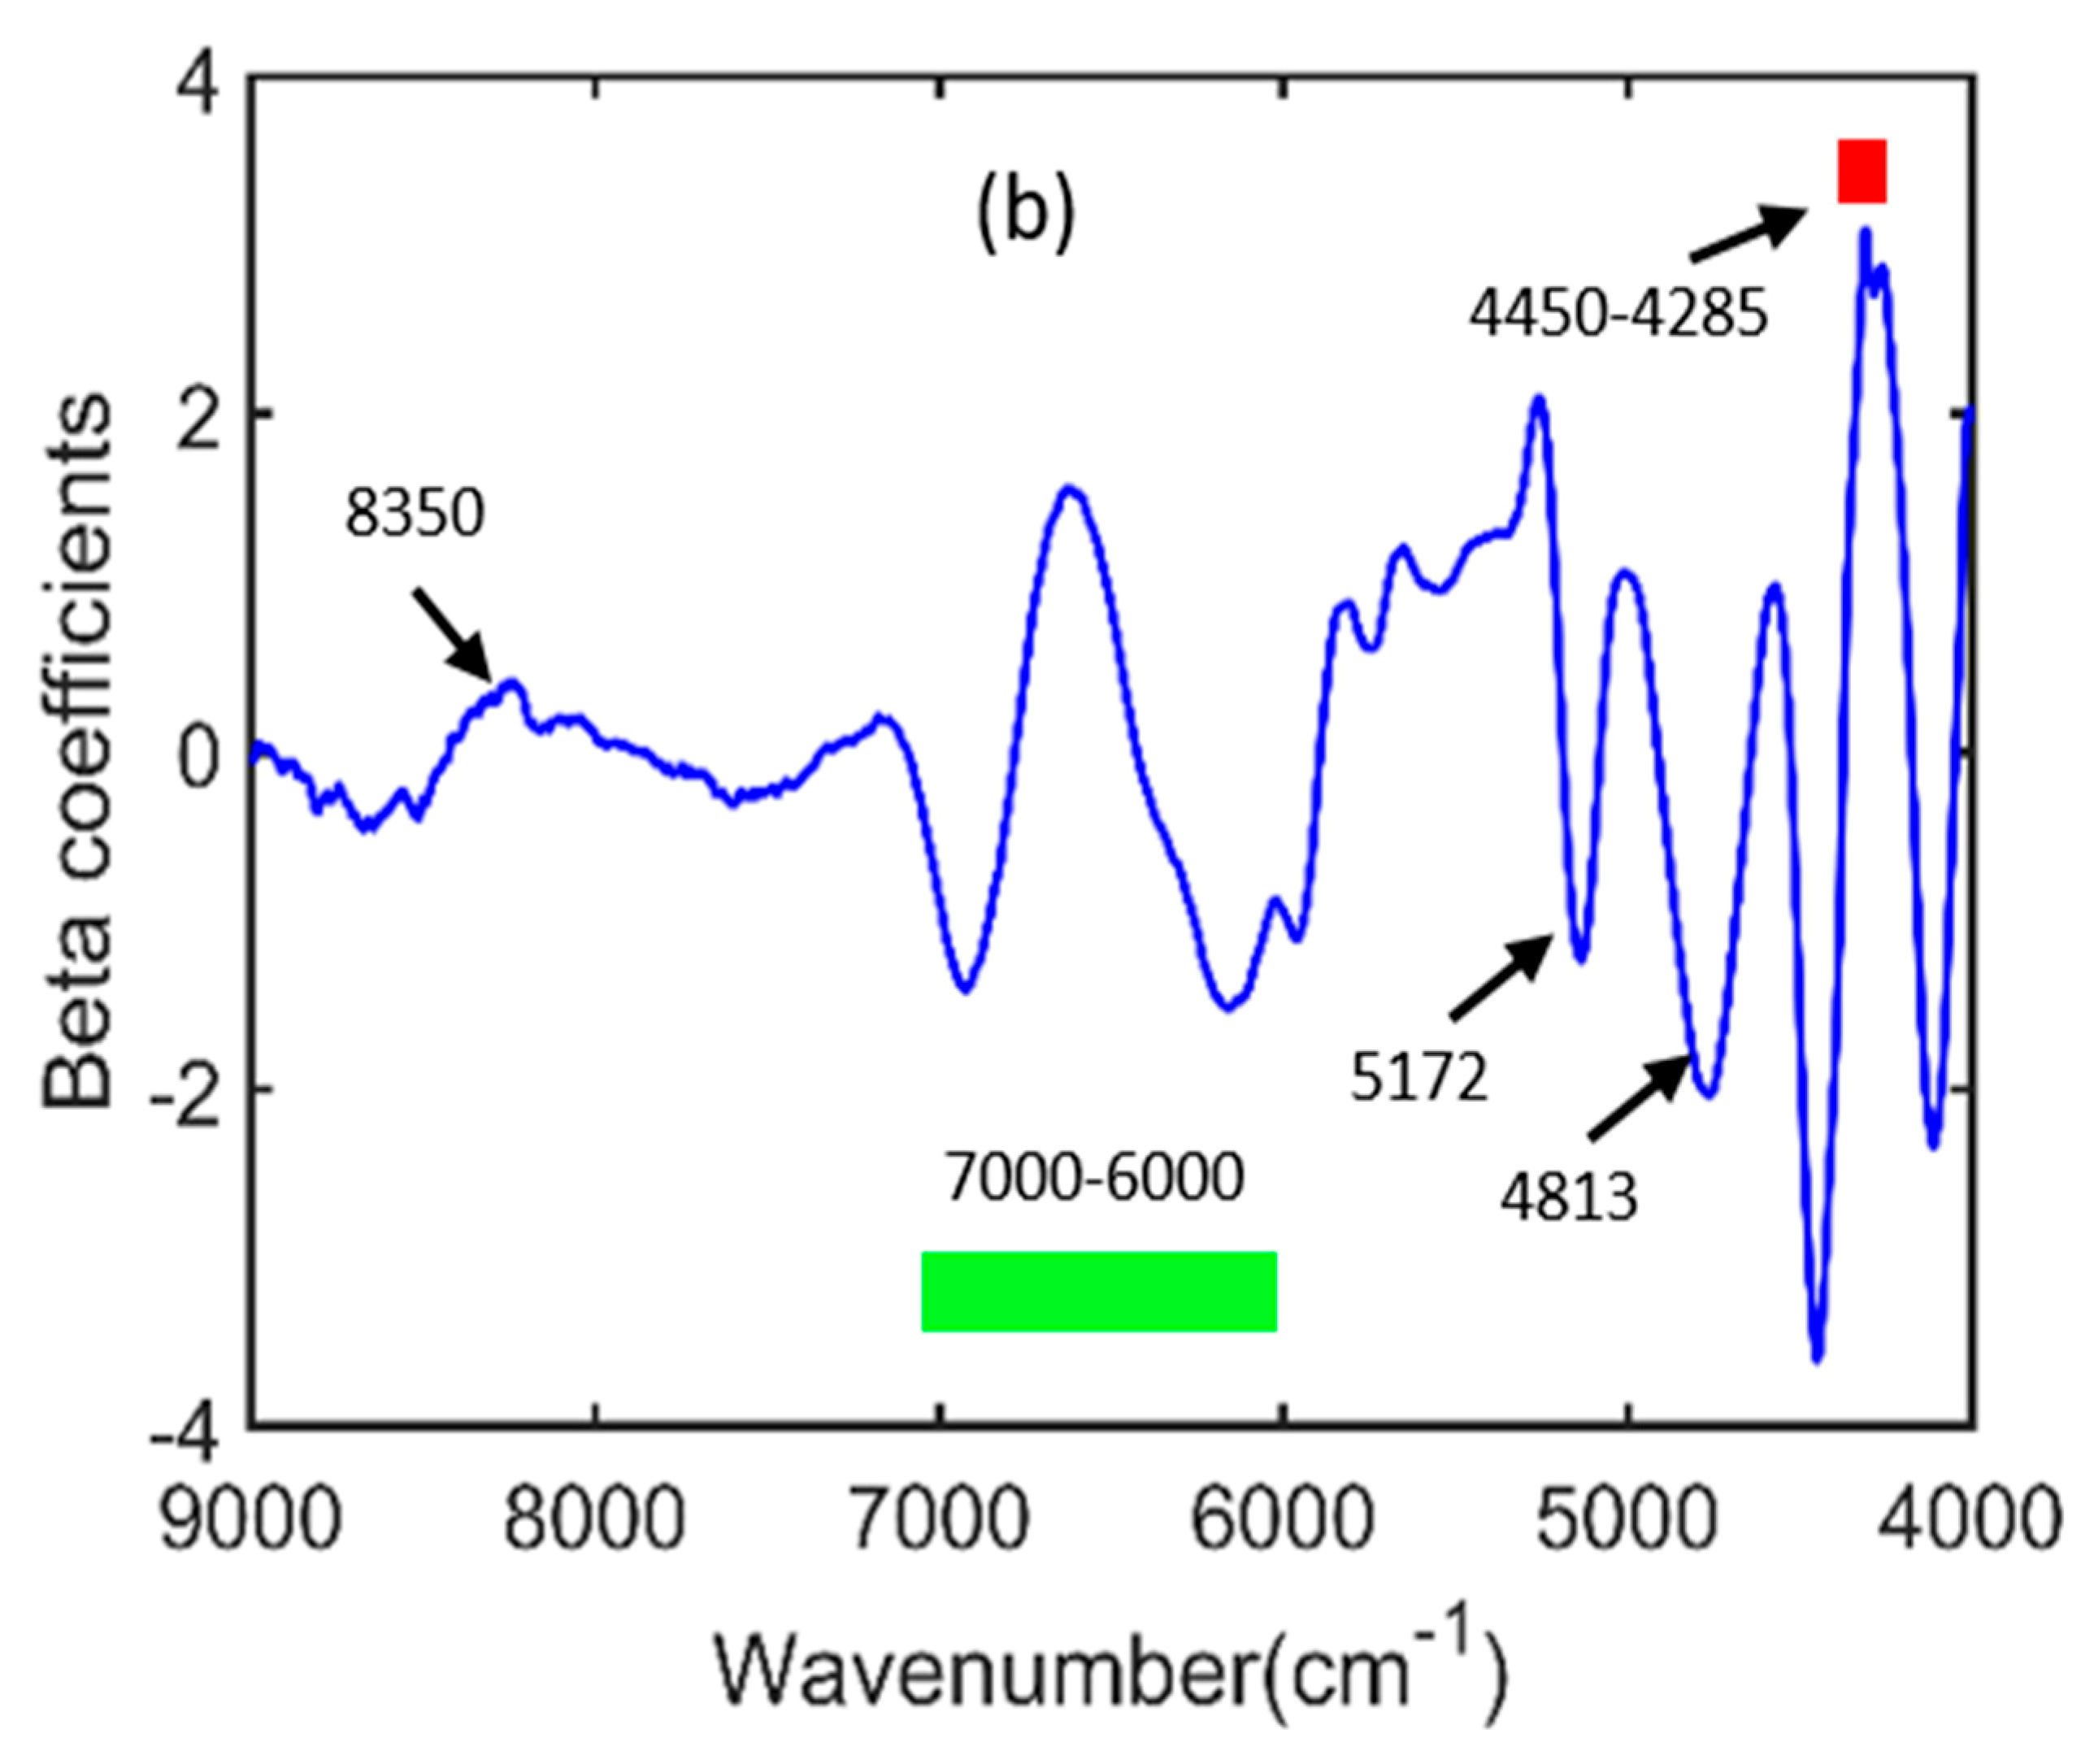
2.1. Spectral Interpretation of Fourier-Transform Infrared (FT-IR) and Fourier-Transform Near-Infrared (FT-NIR)
2.2. Dirichlet Distribution
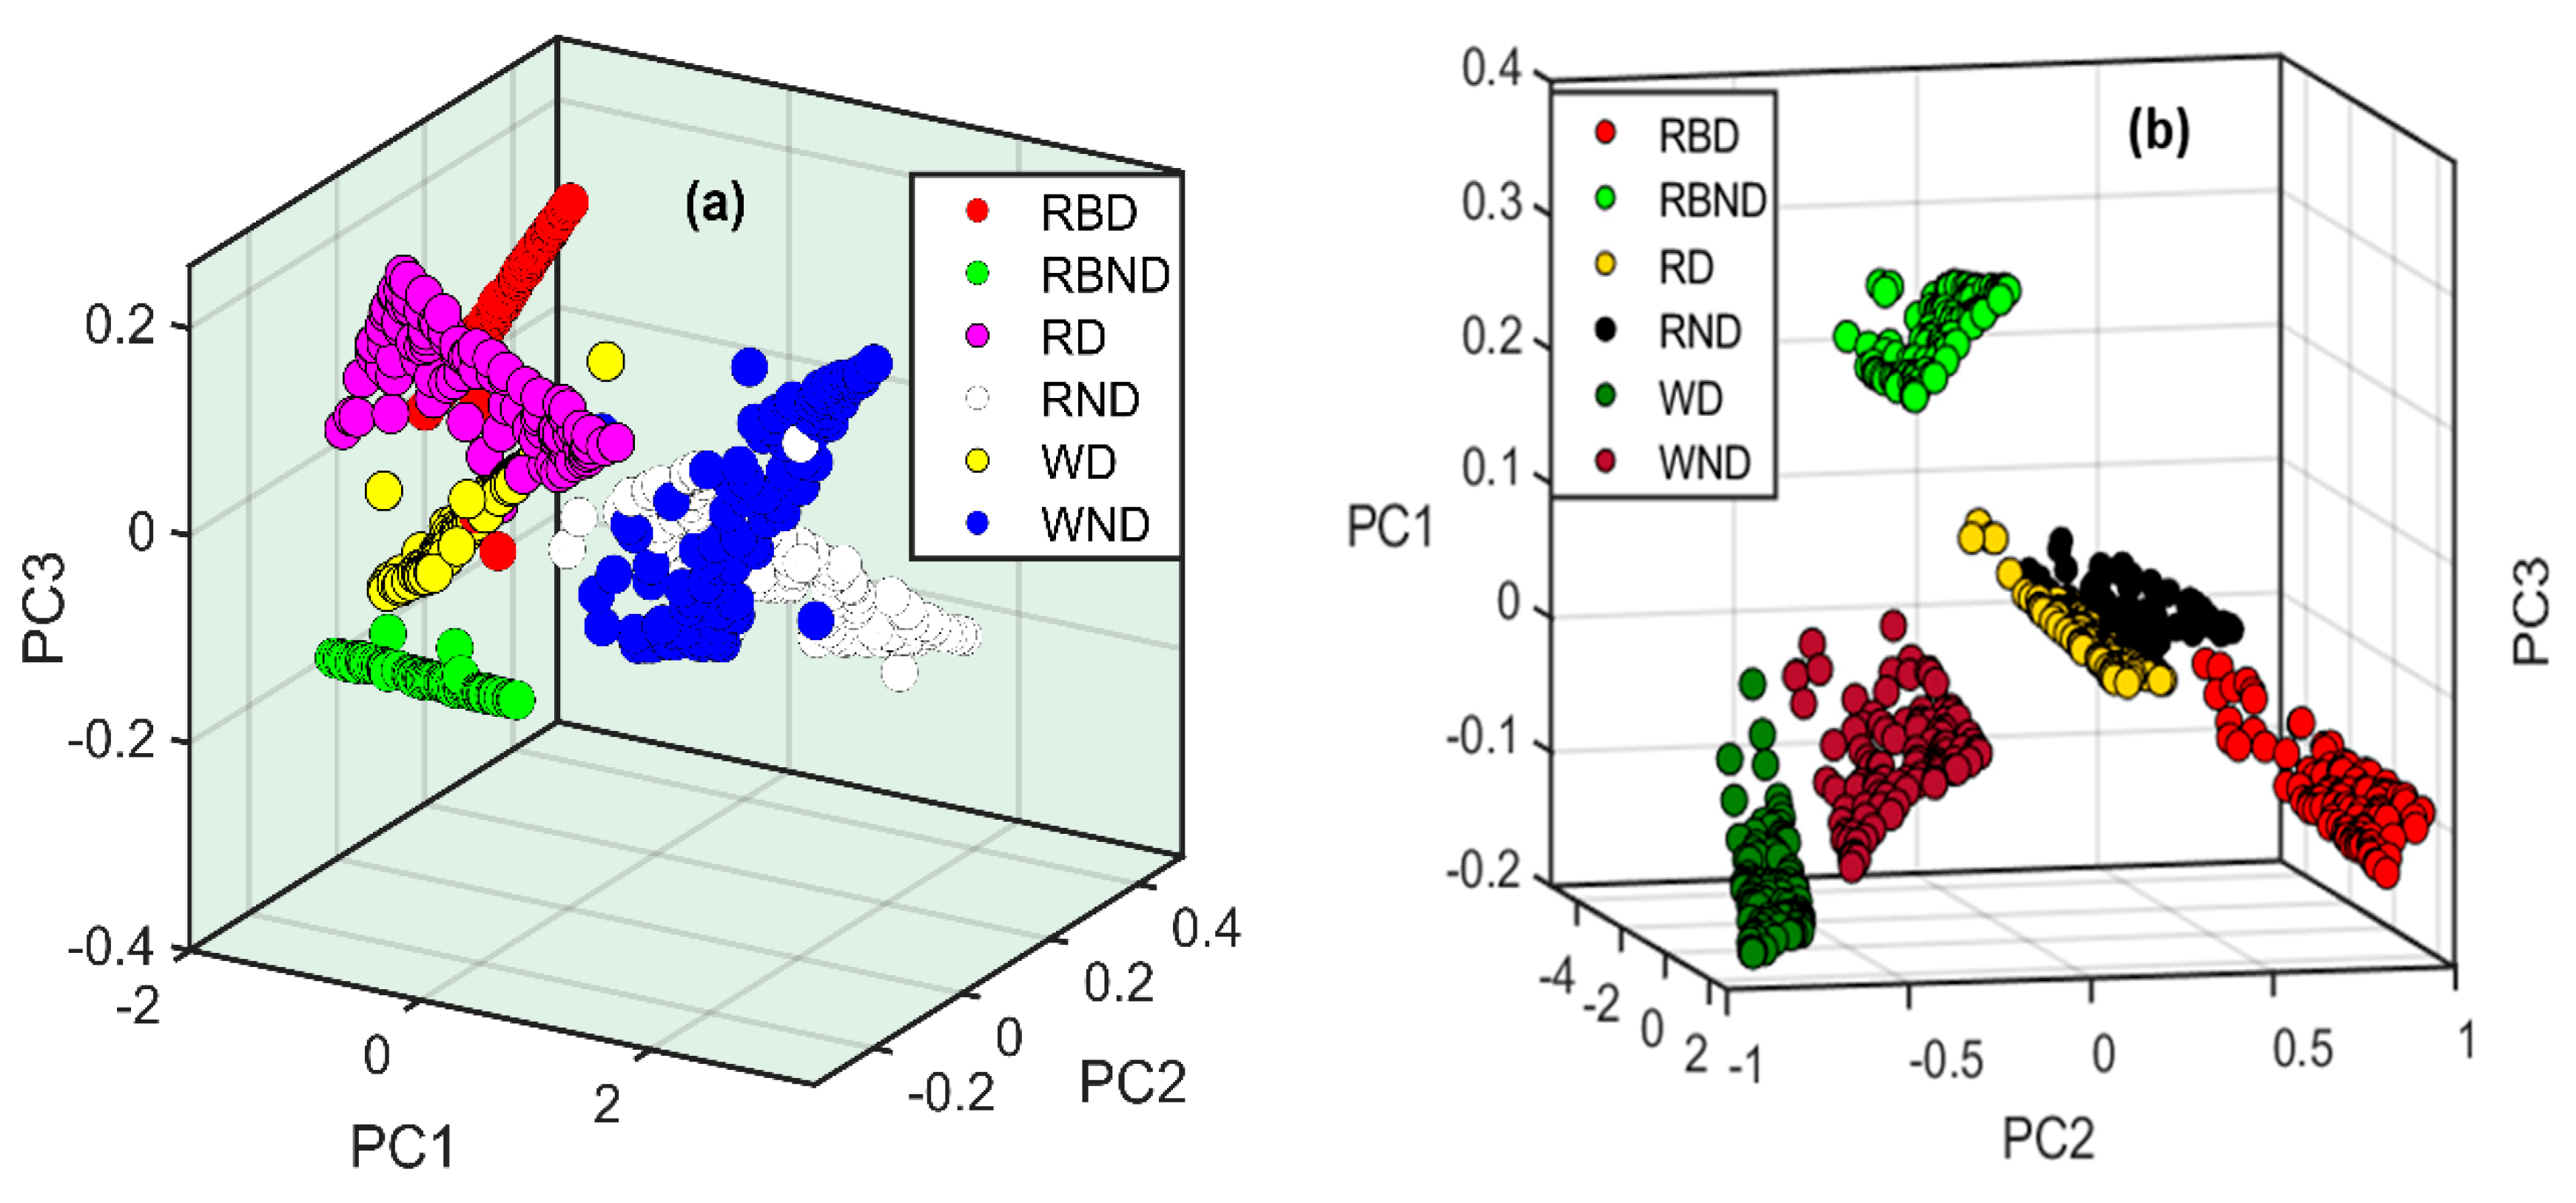
2.3. Principal Component Analysis (PCA) of Samples under Different Stress Conditions
2.4. High Performance Liquid Chromatography (HPLC) Reference Analysis for the Phenolic Compound Measurements
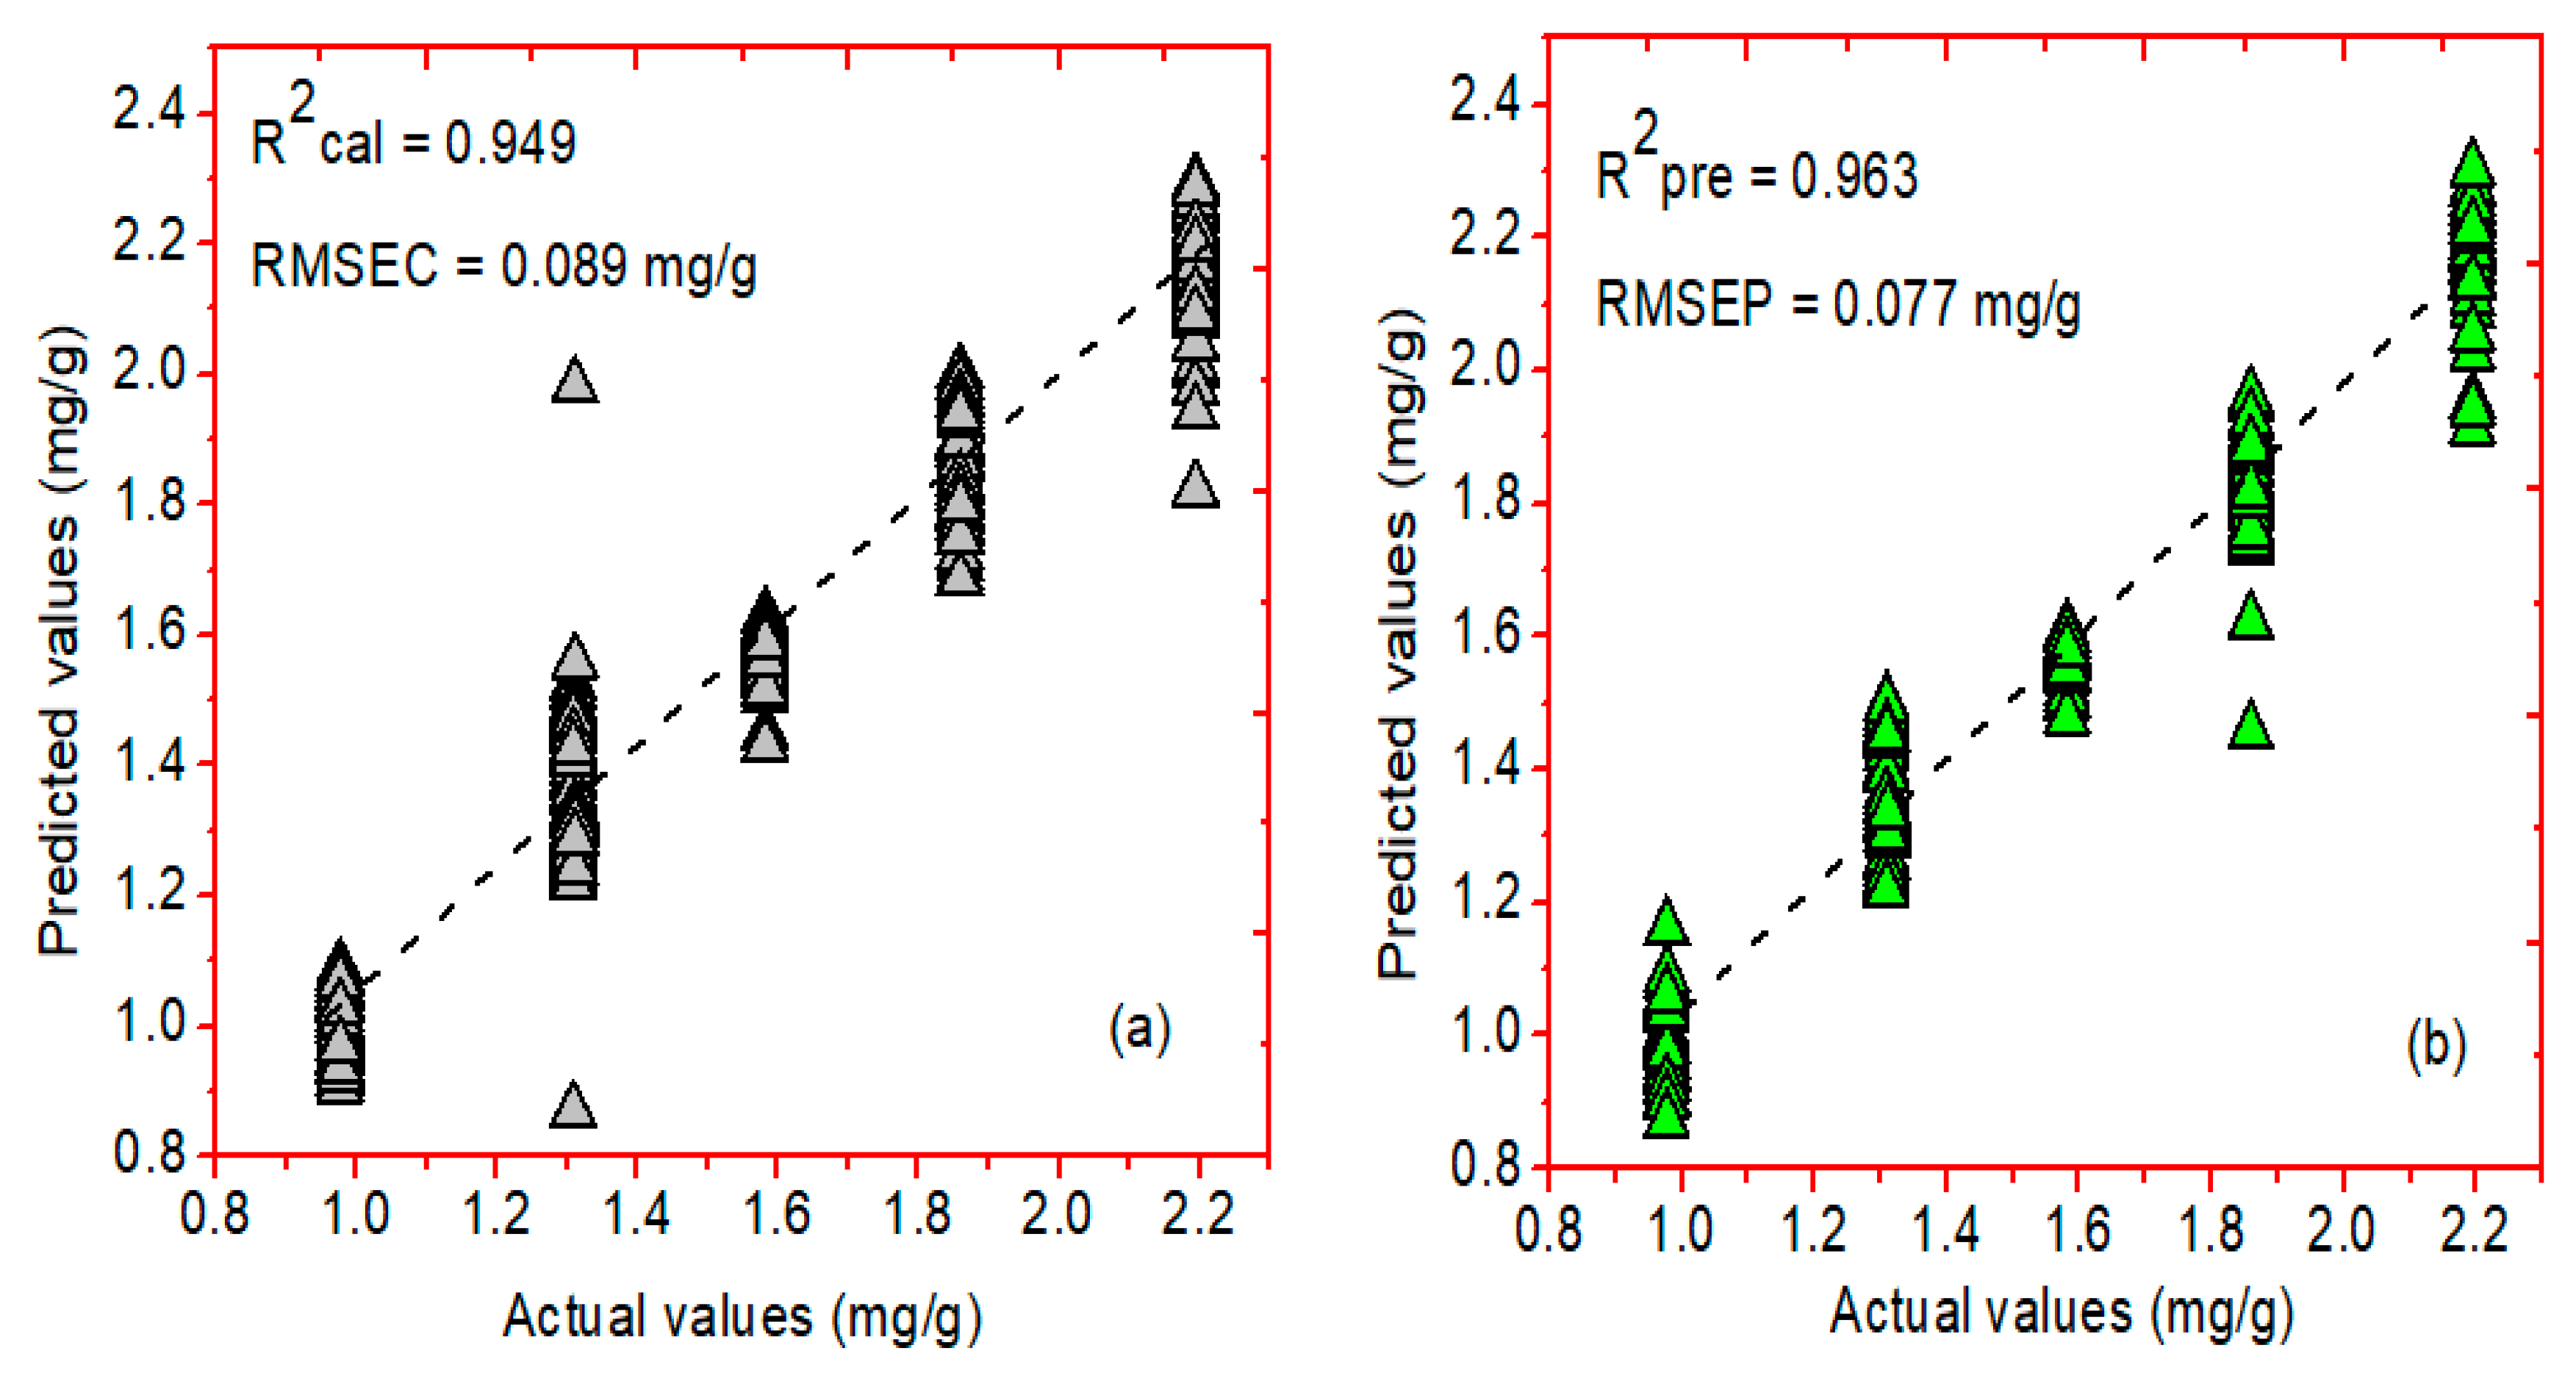
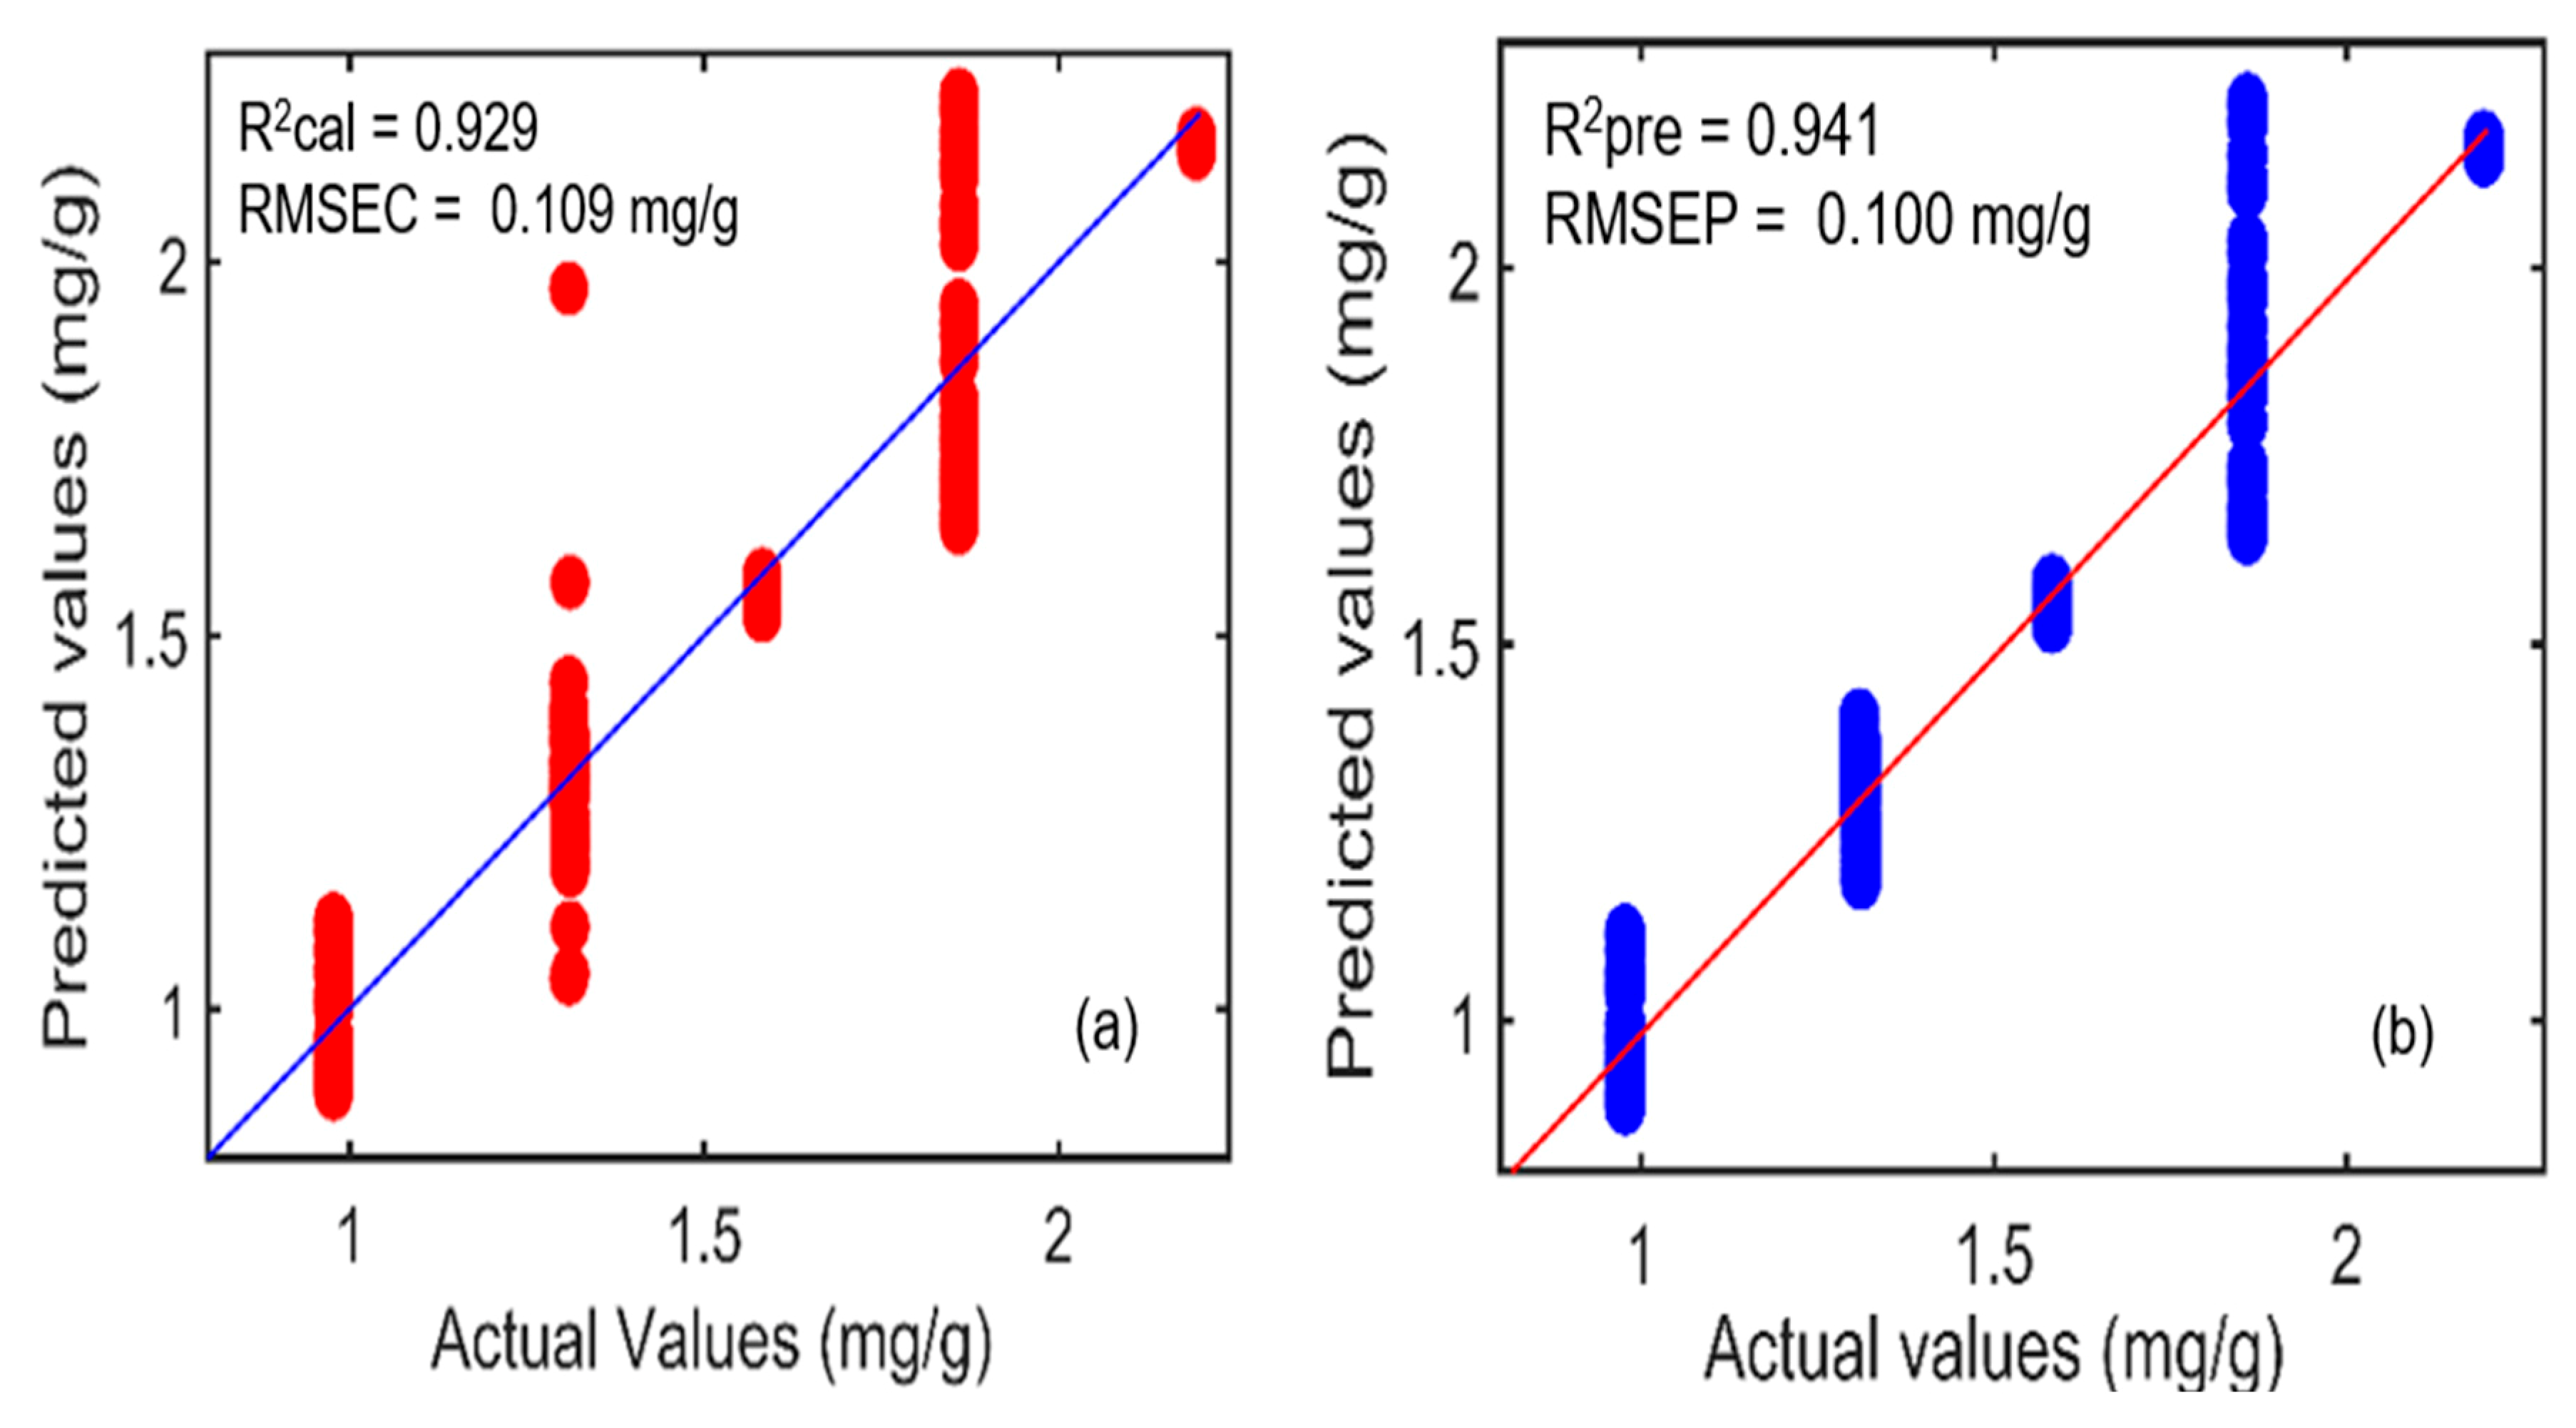
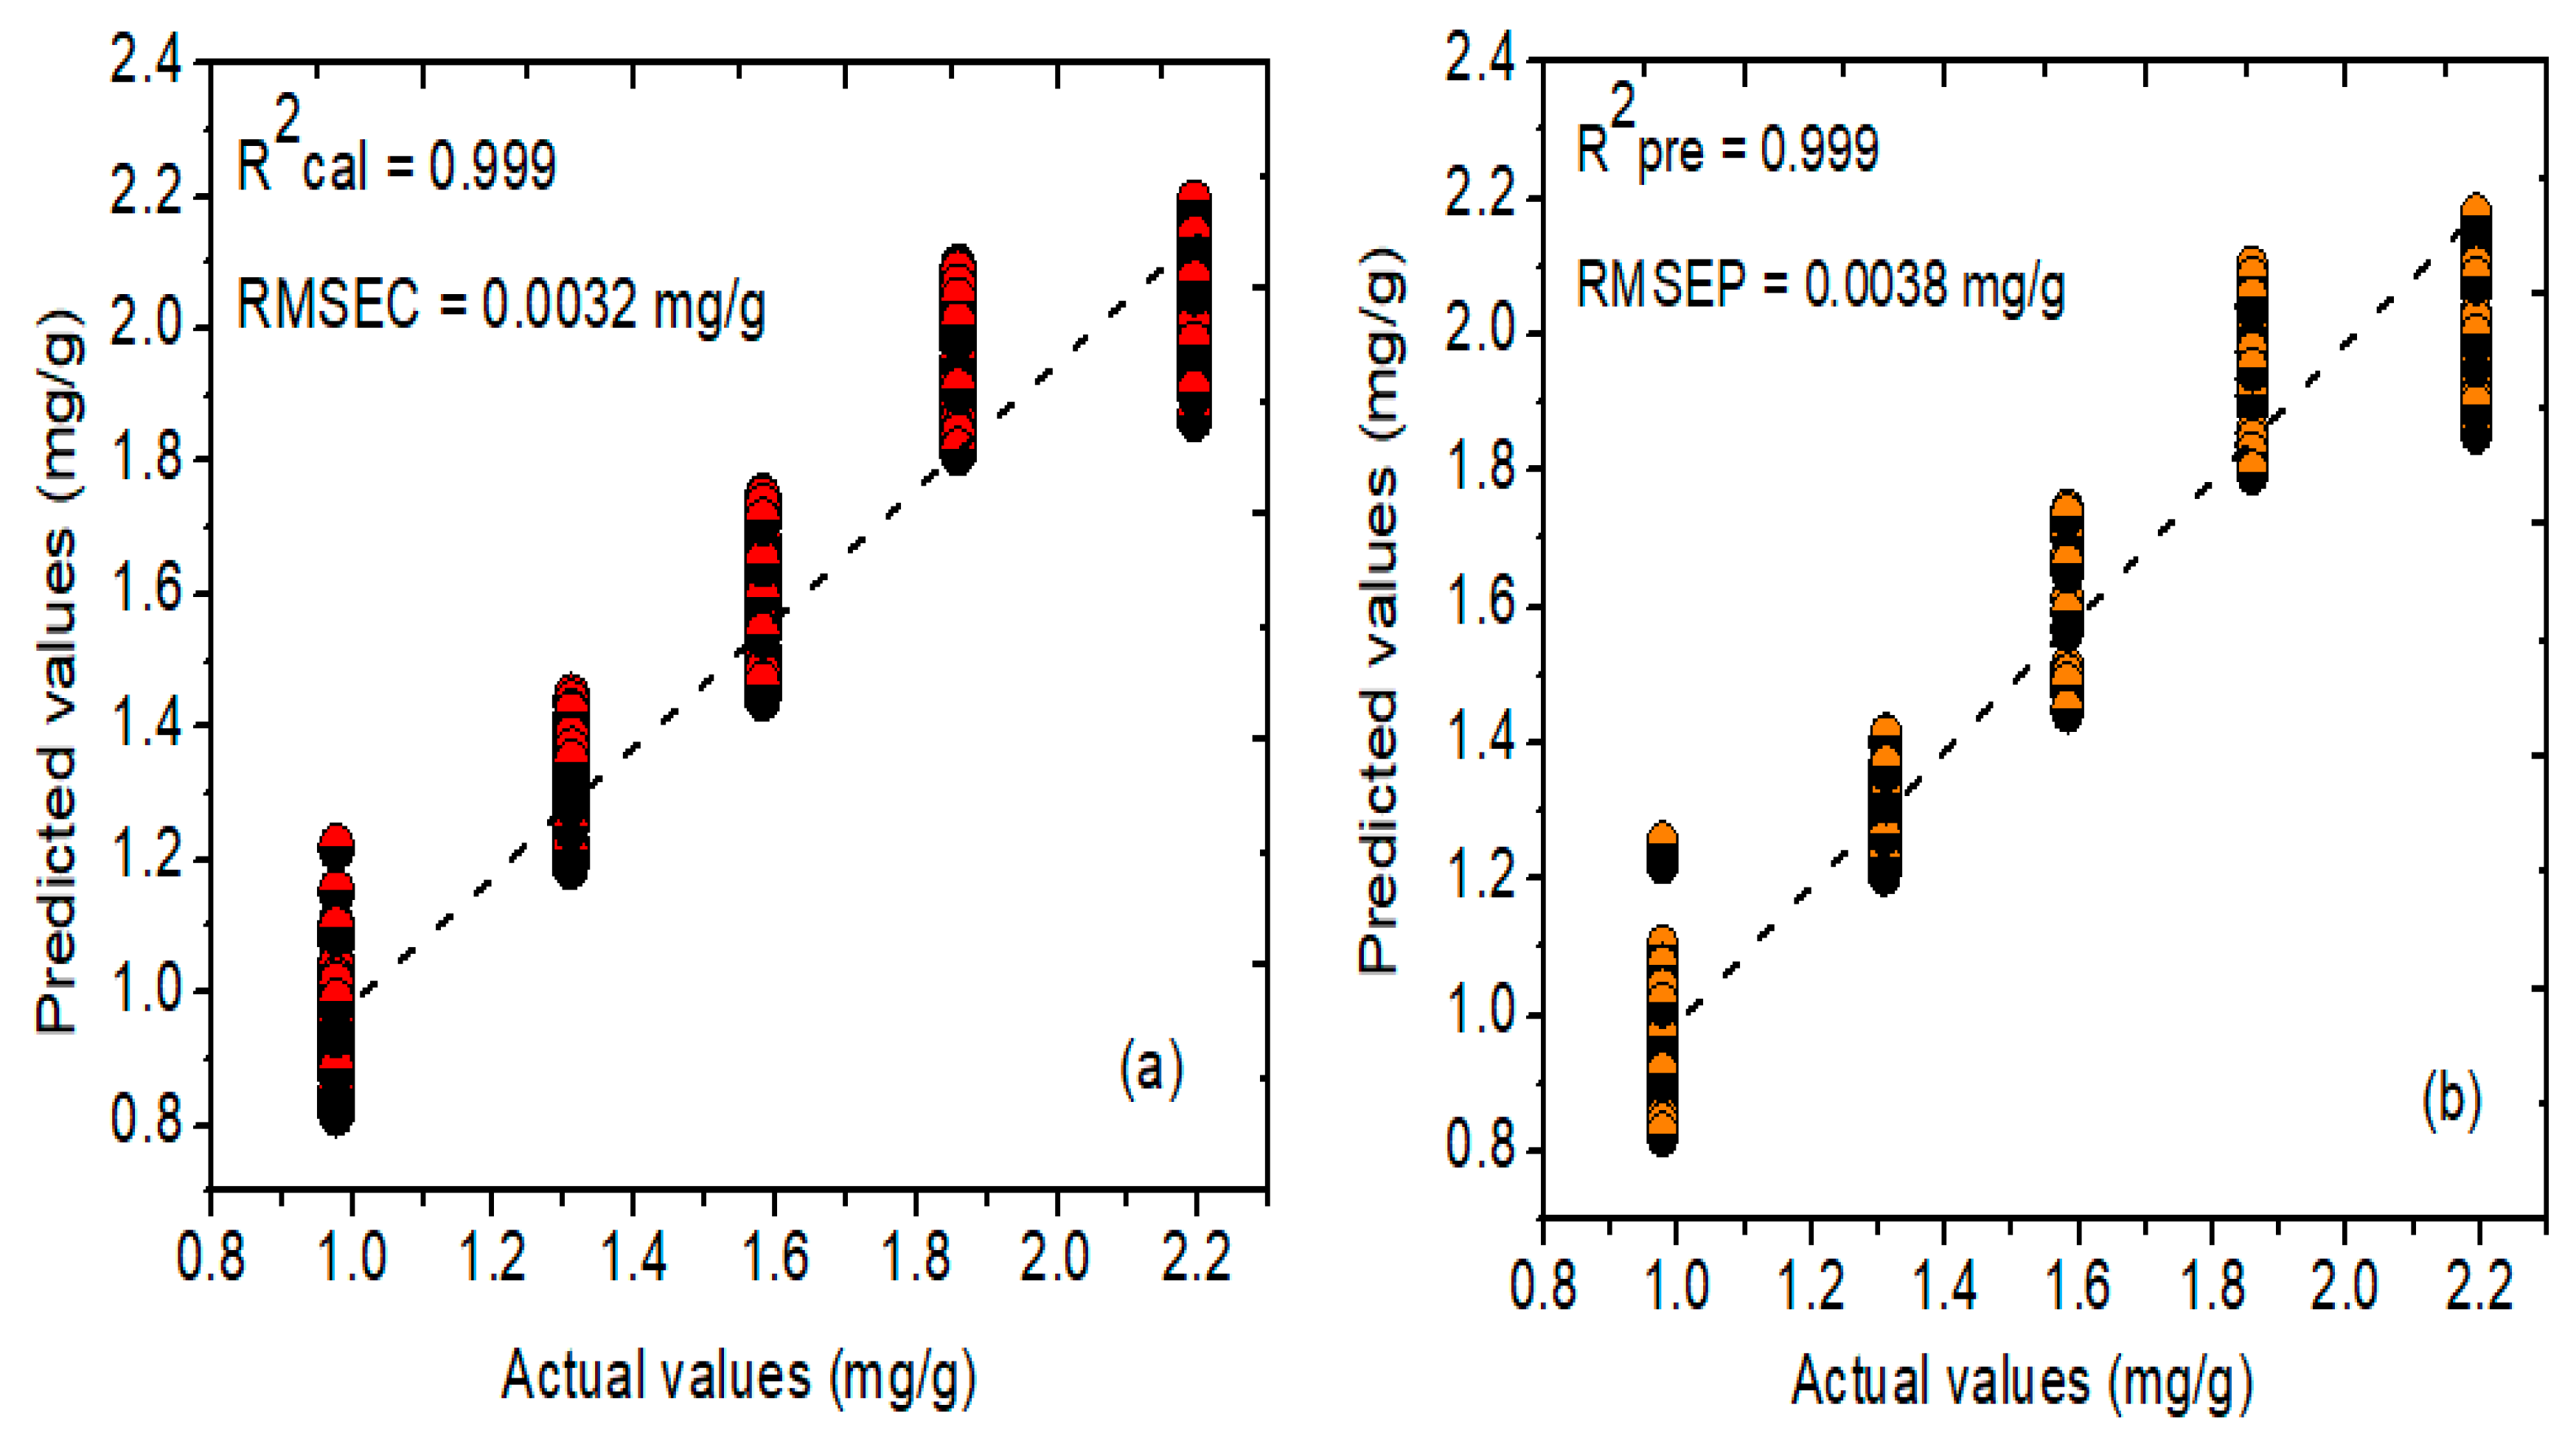
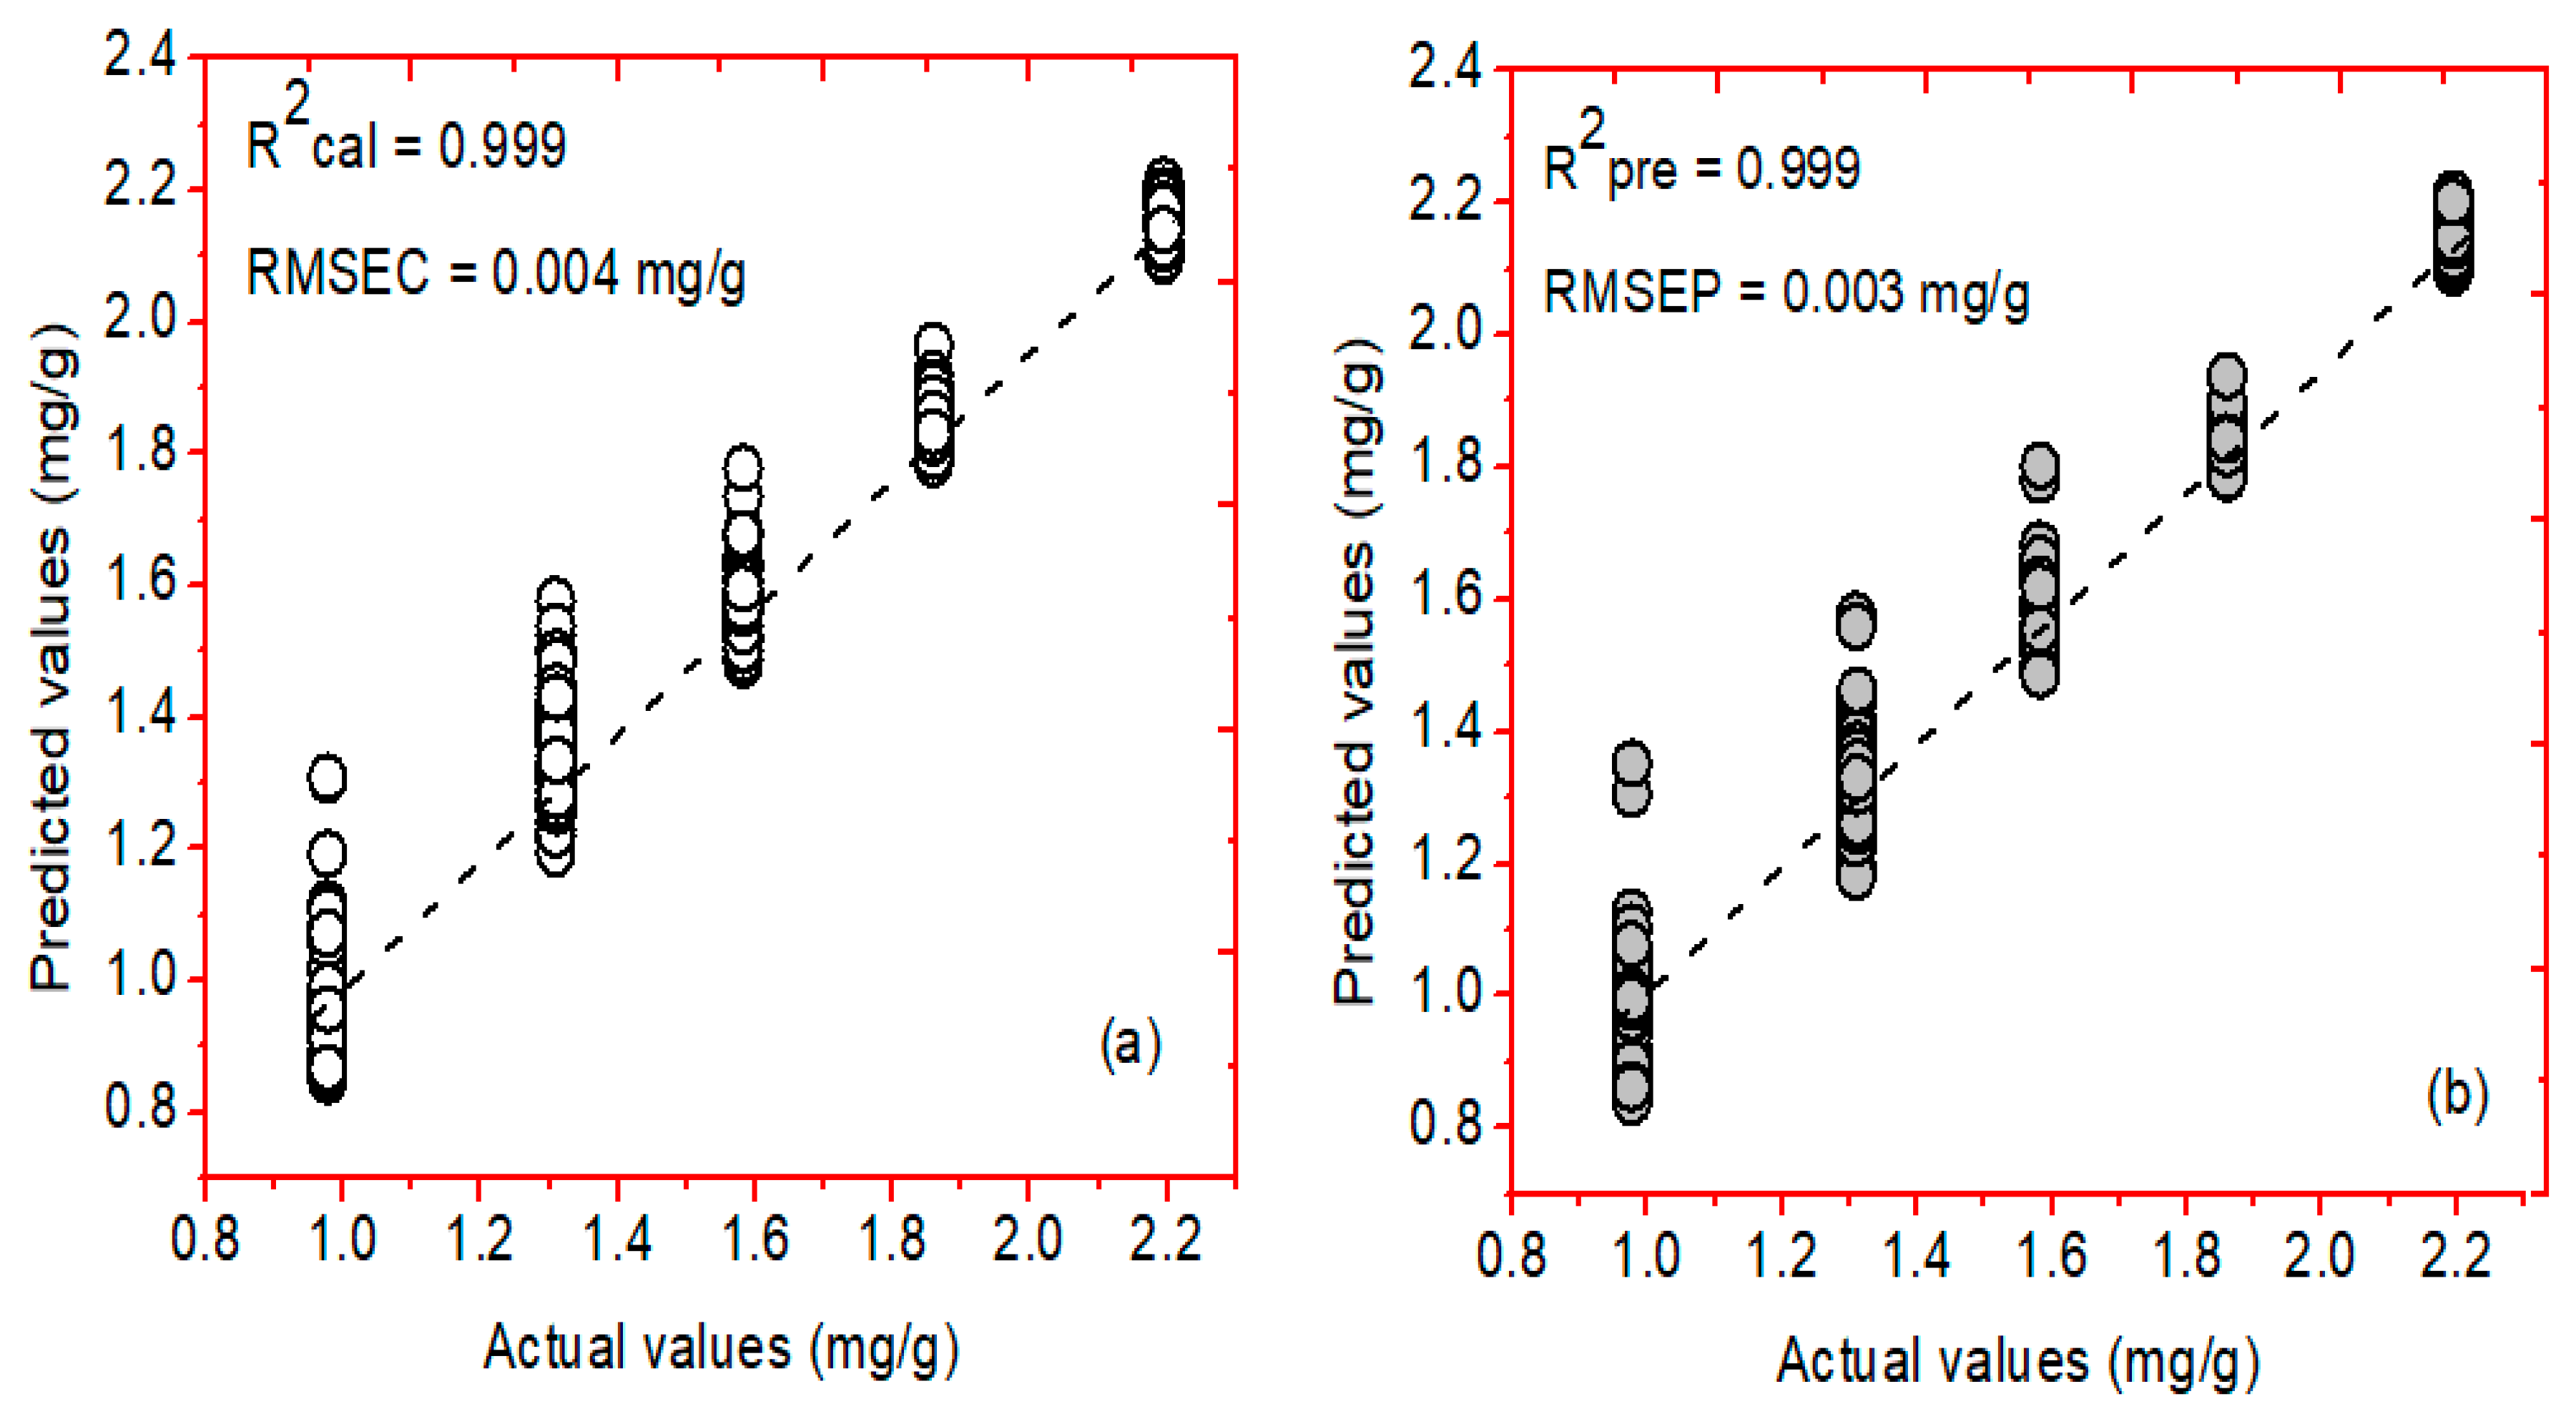
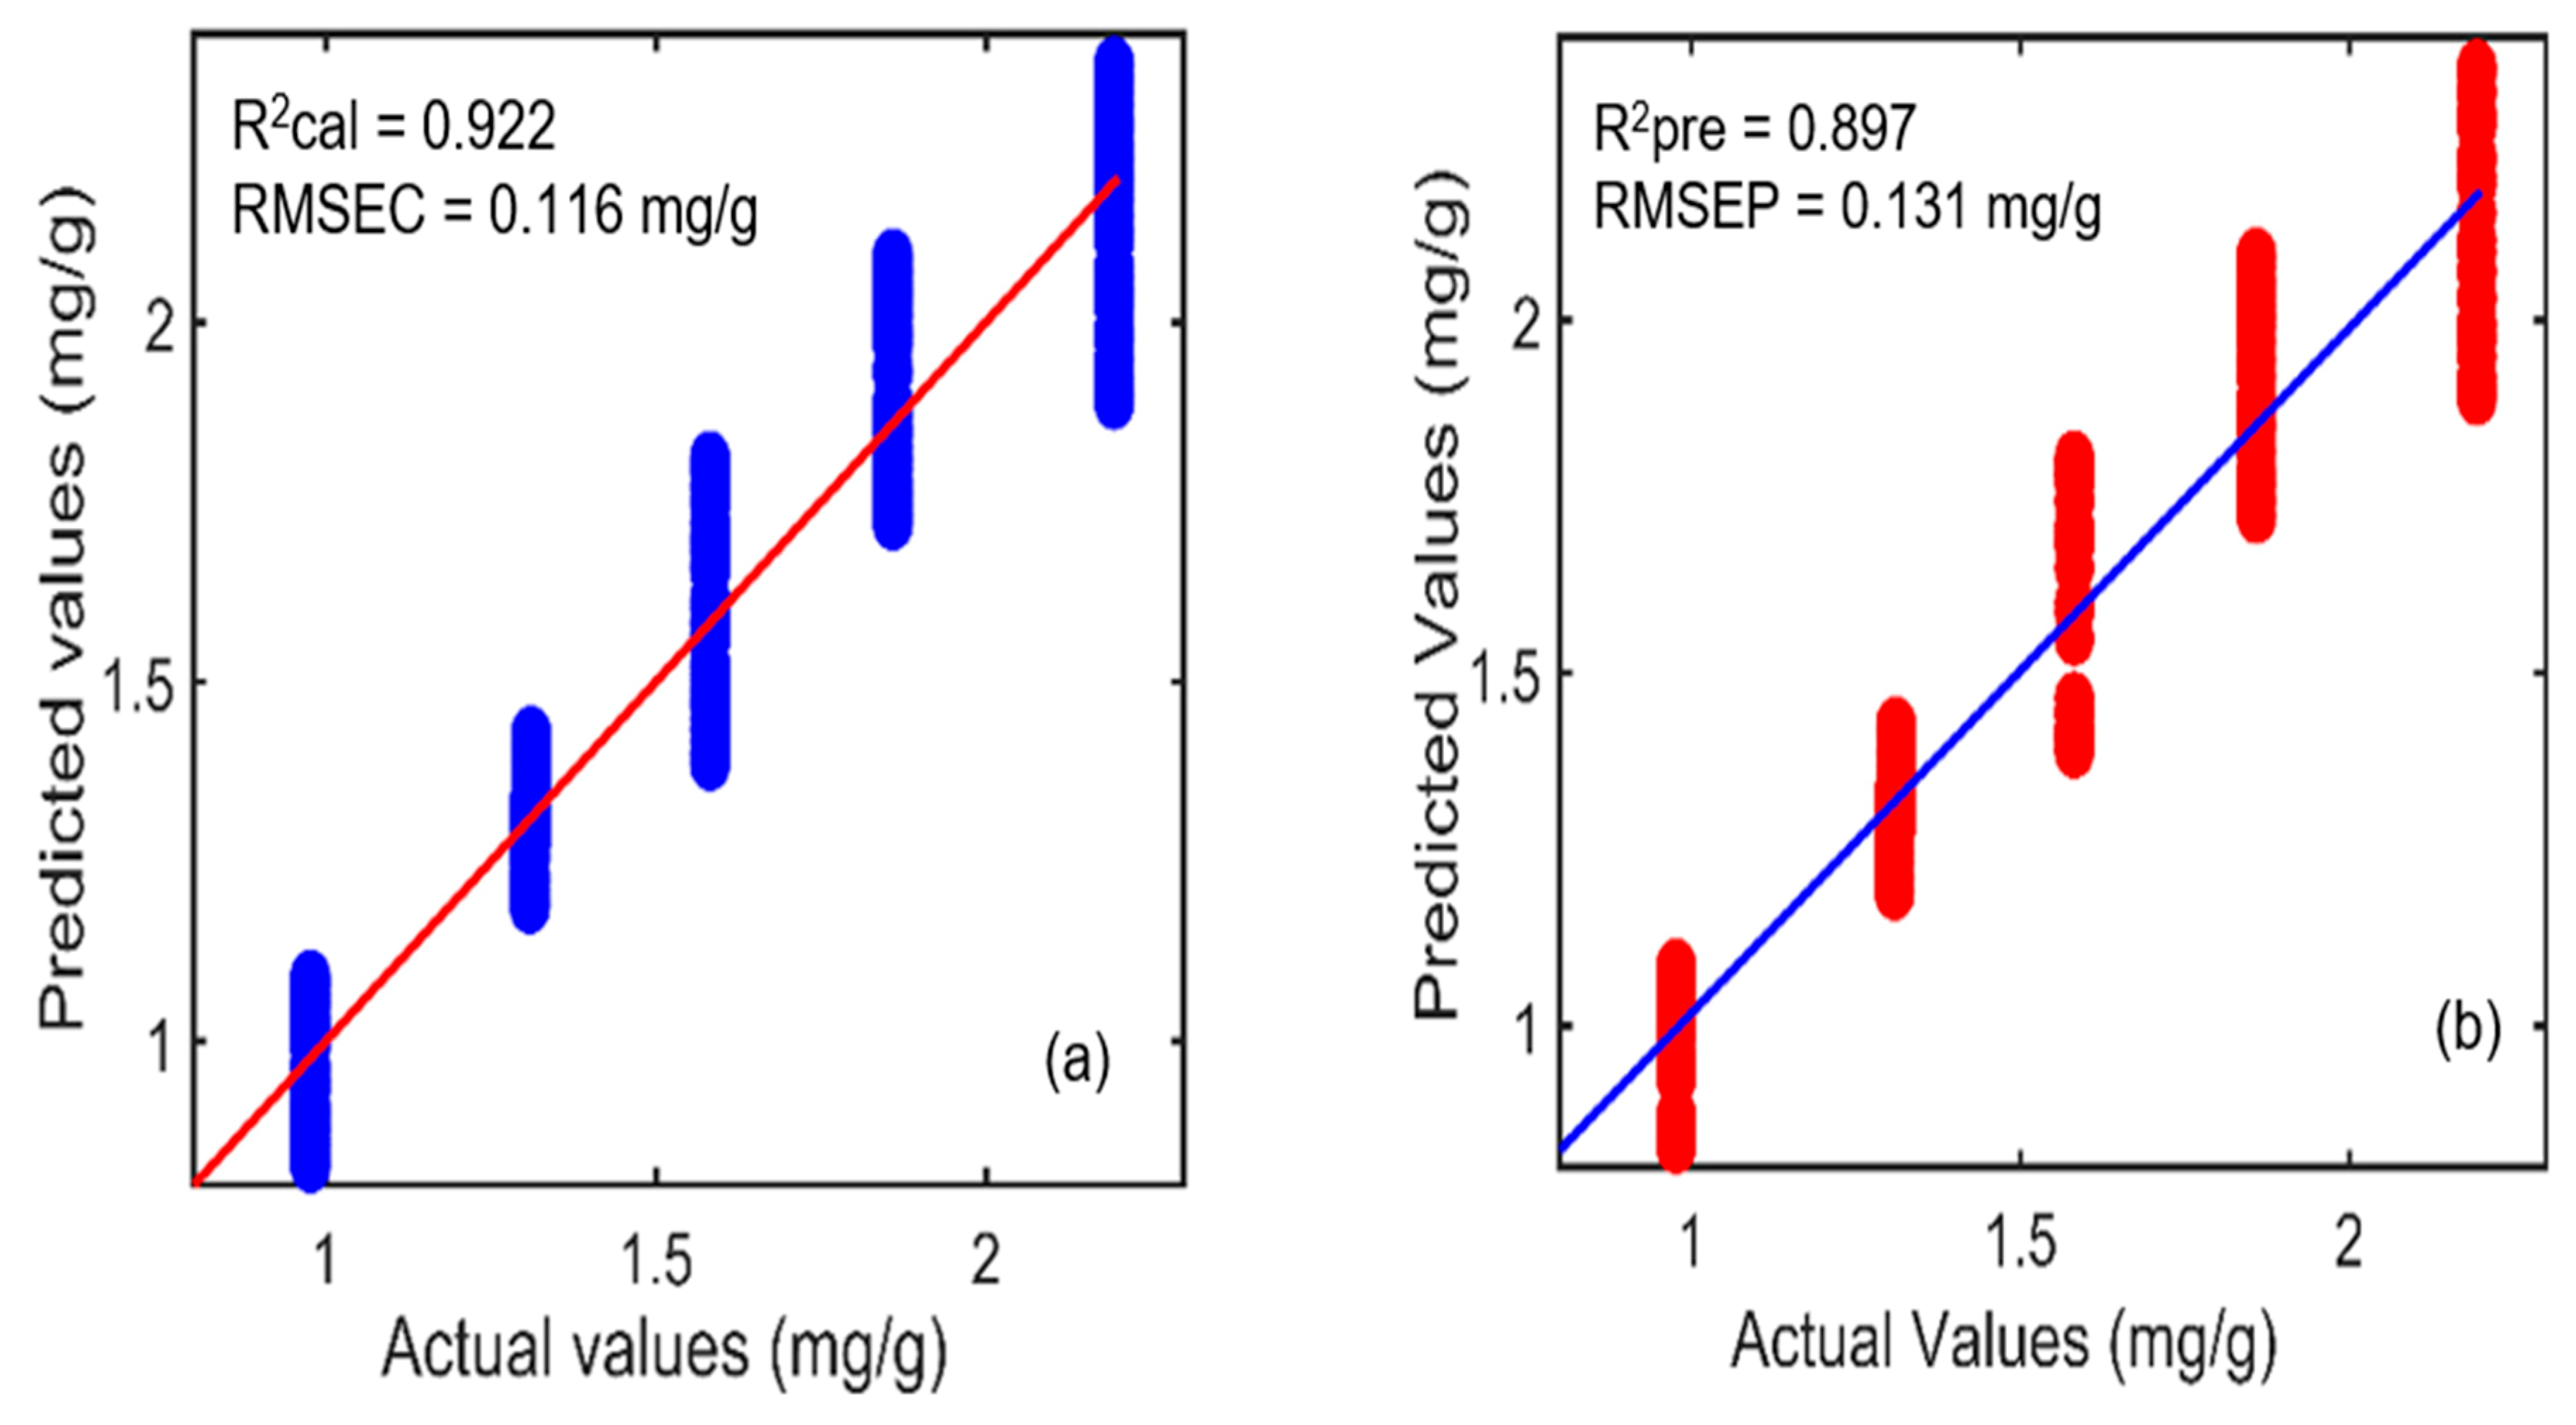
2.5. PLSR, PCR, and HLA/GO Prediction Results for FT-IR and FT-NIR Spectroscopy
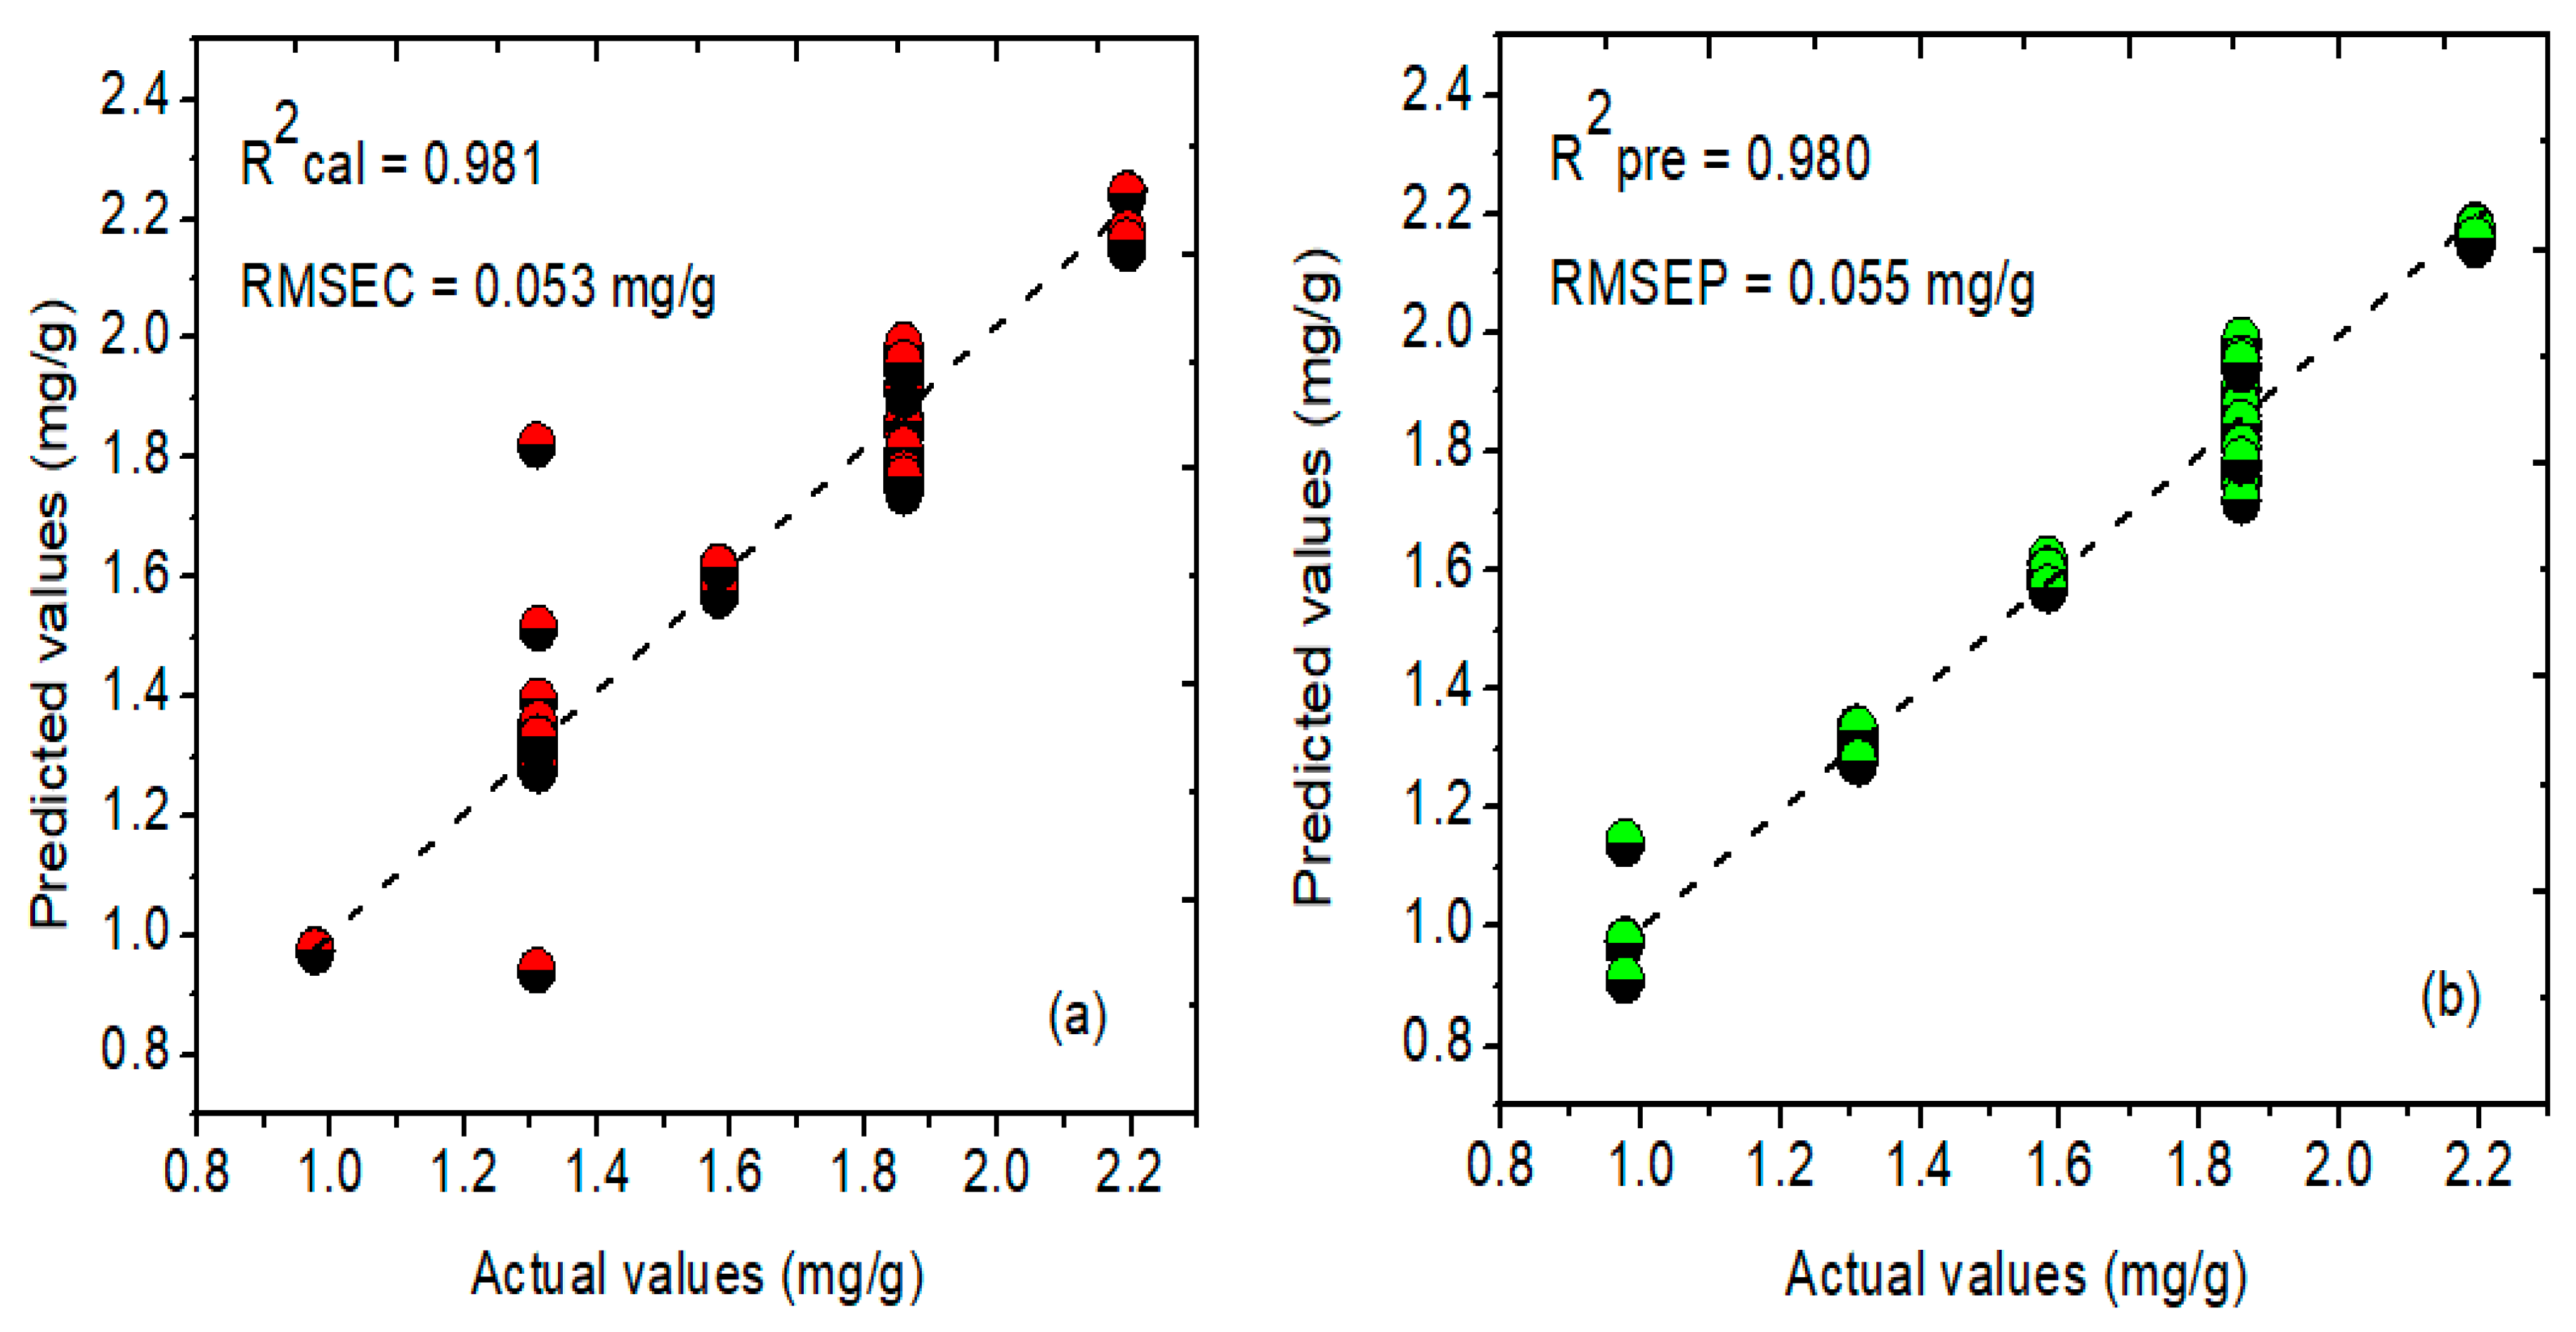
2.5.1. Prediction Analysis Results of FT-IR Spectroscopy
2.5.2. Prediction Results for FT-NIR Spectroscopy
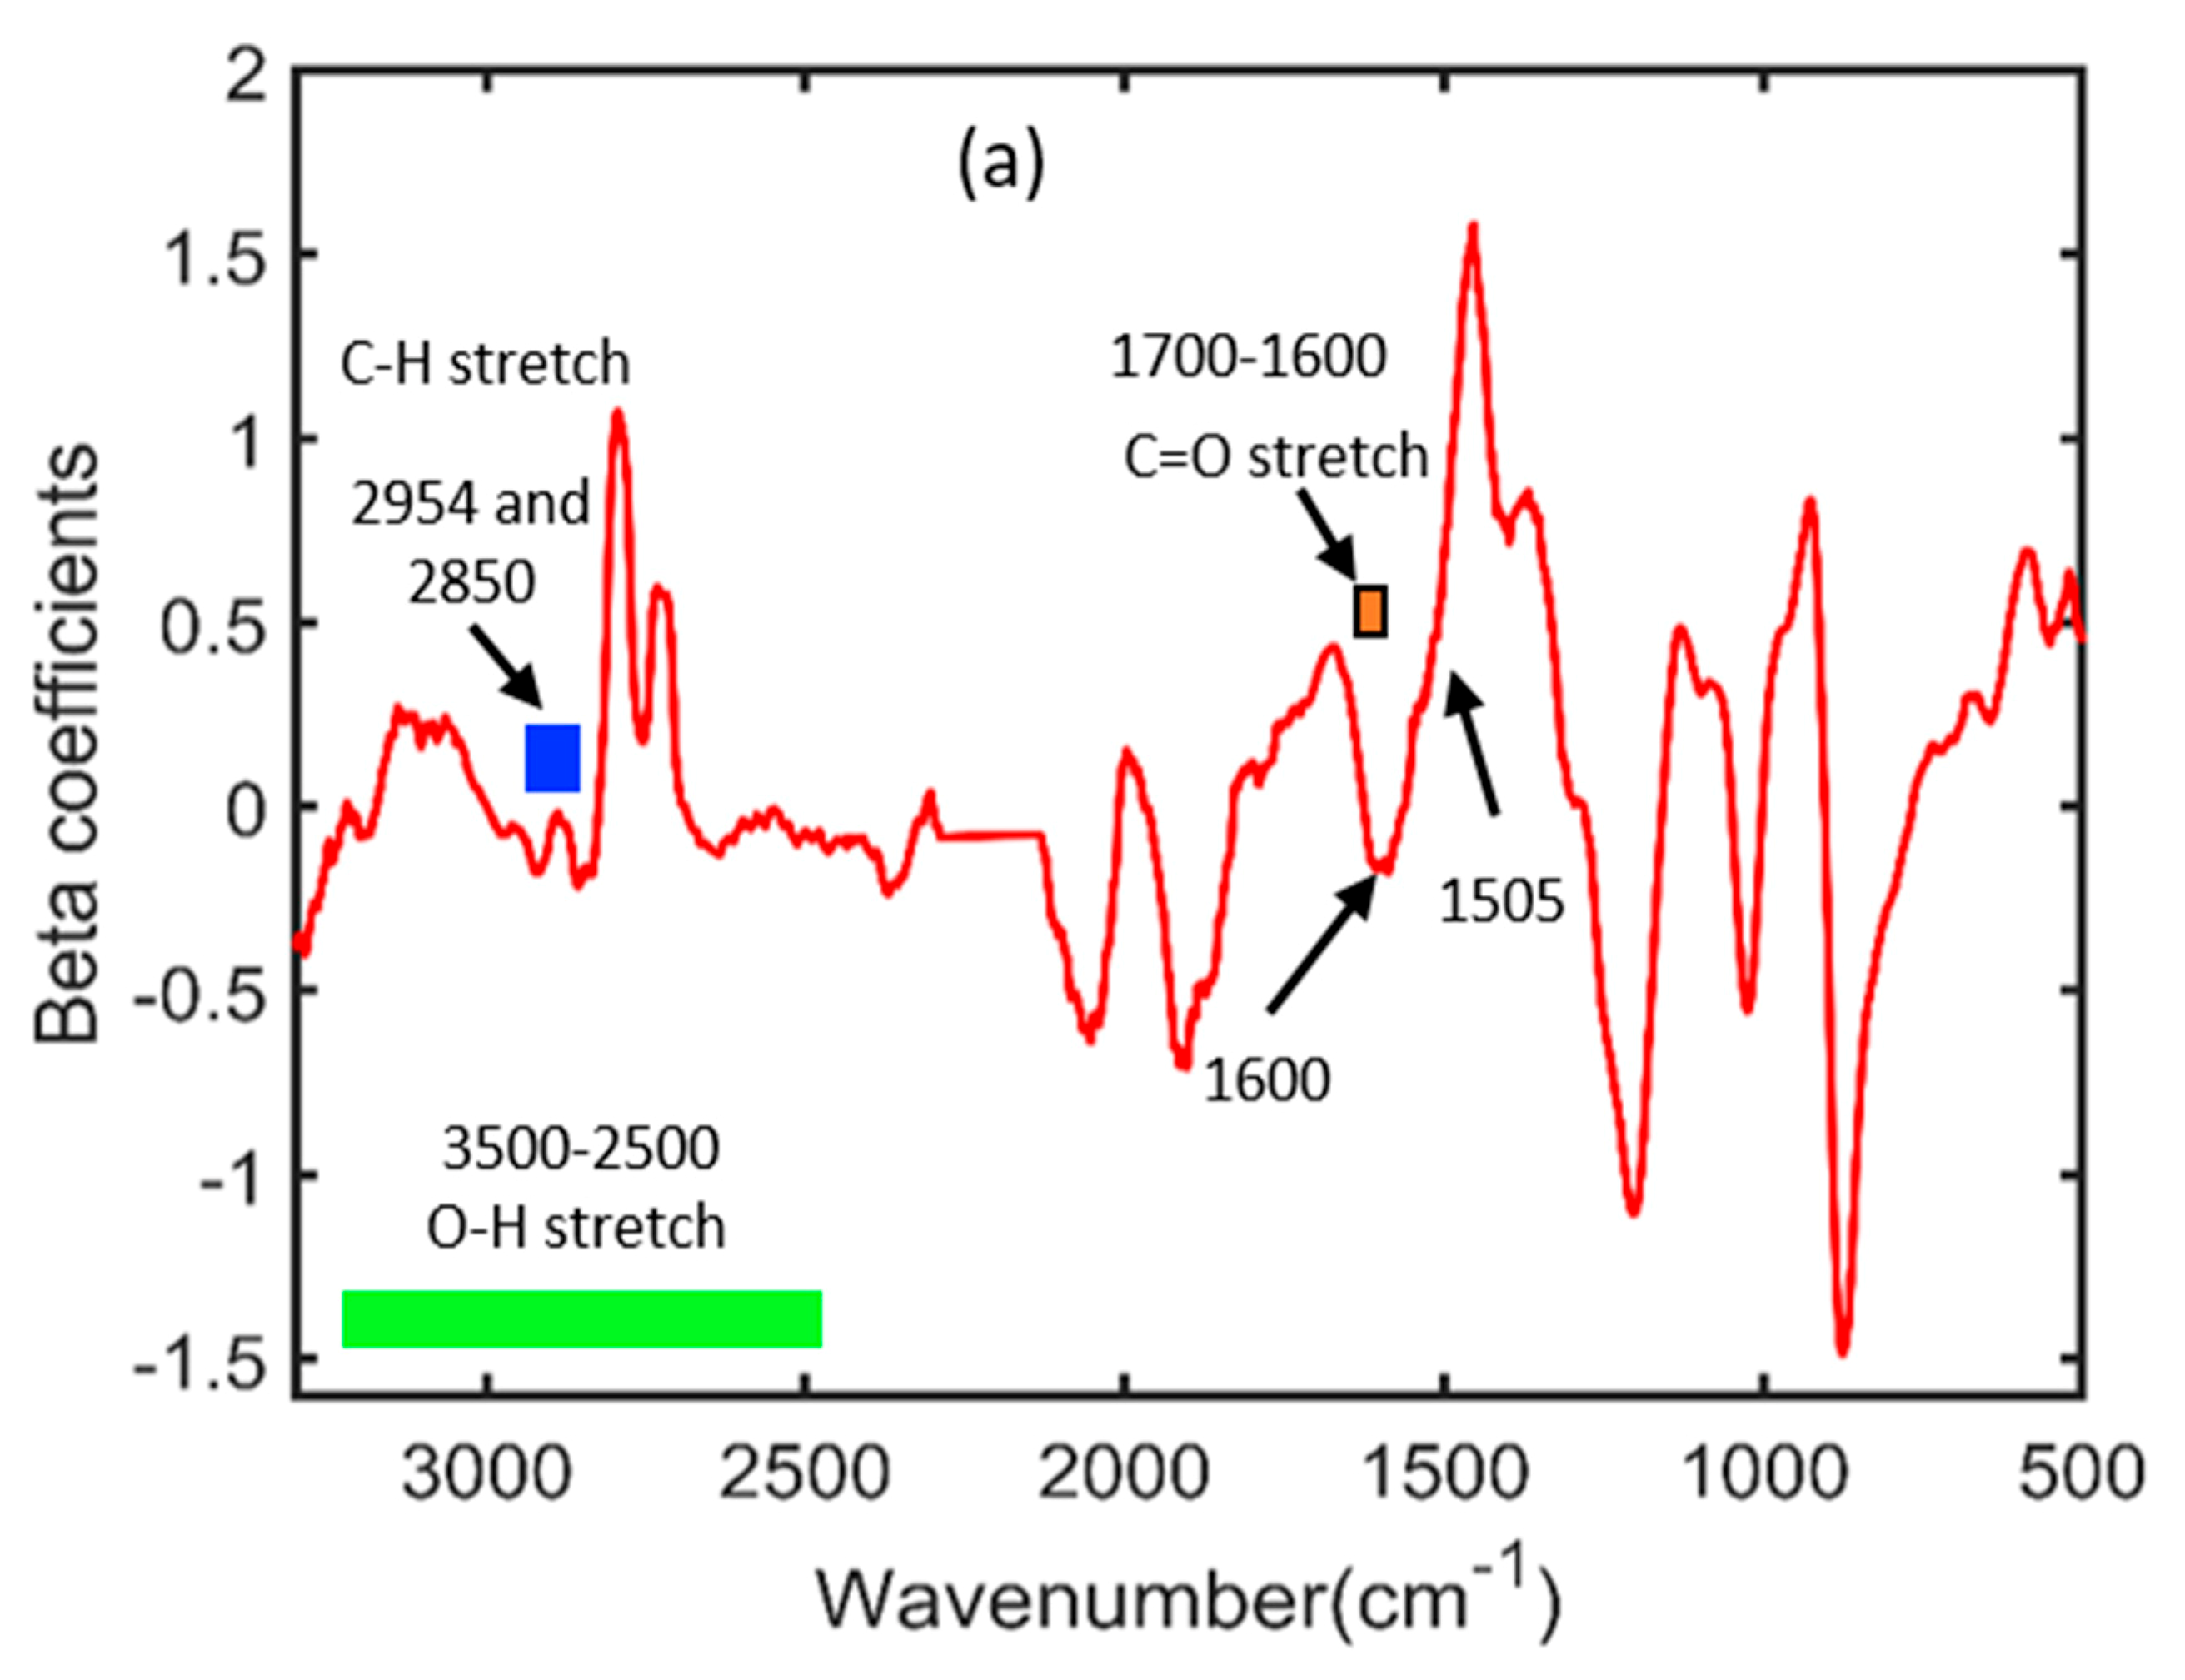
2.6. Beta Coefficients Results of FT-IR and FT-NIR Spectroscopy
3. Materials and Methods
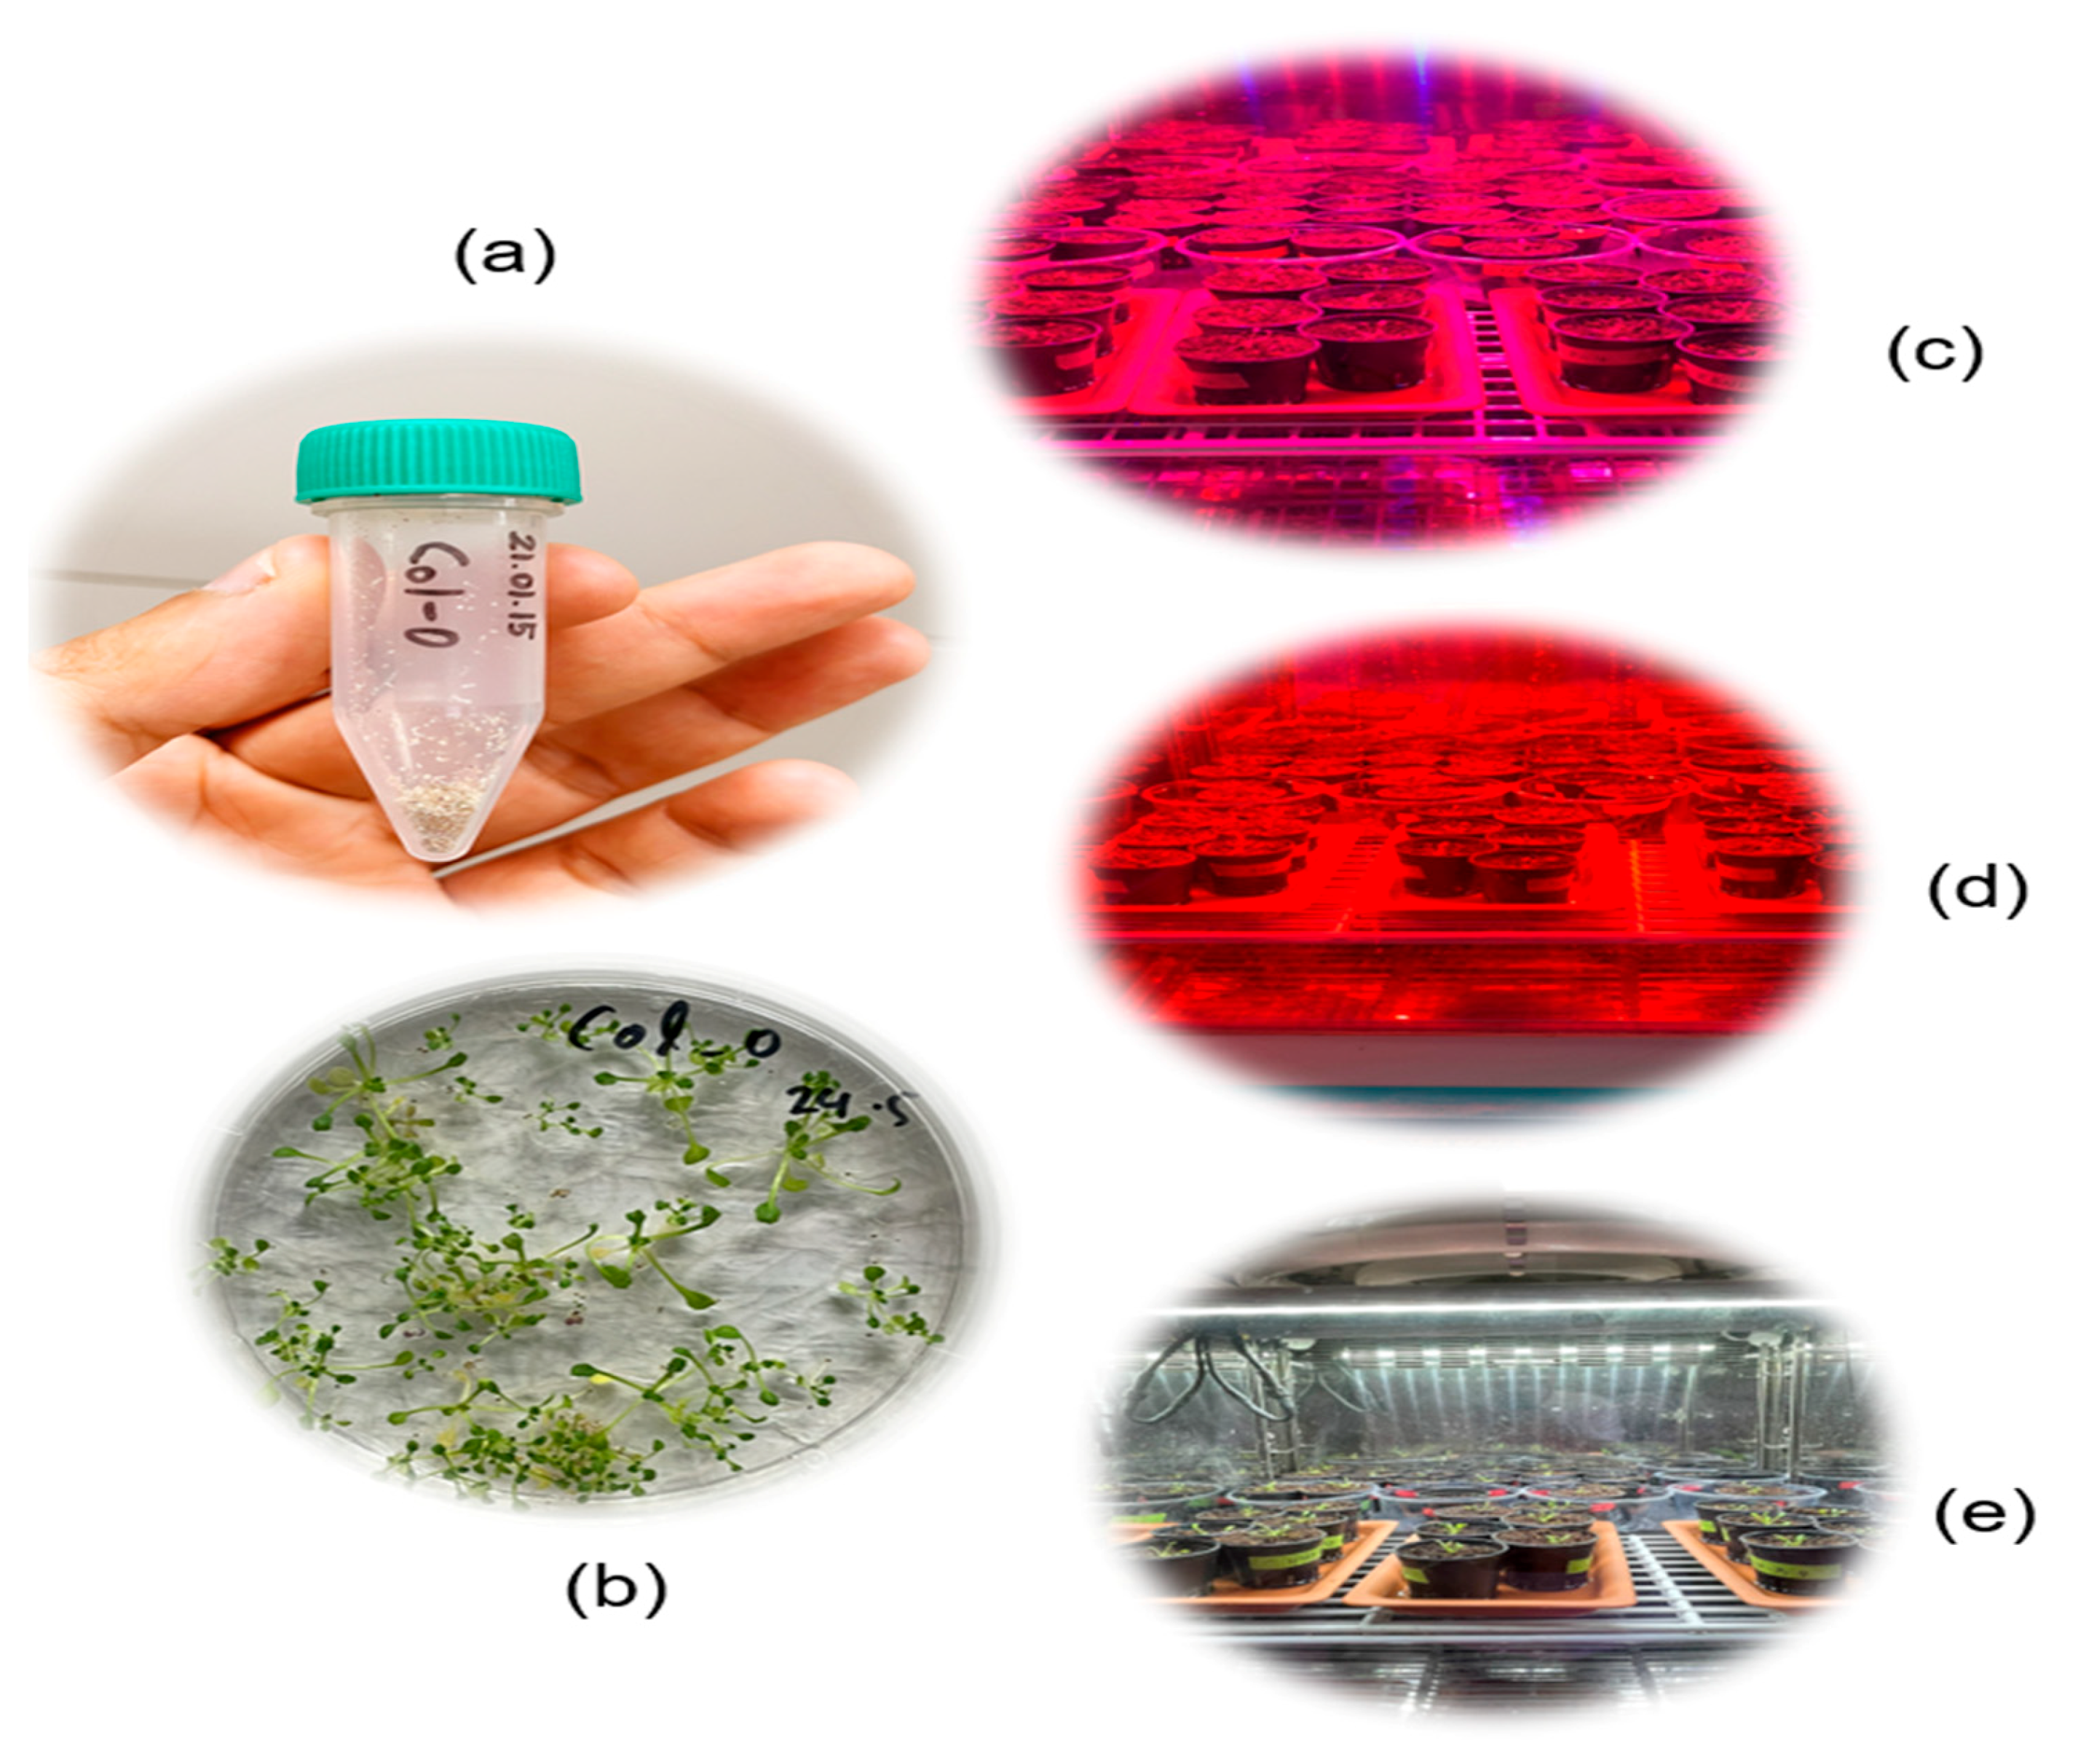
3.1. Sample Preparation
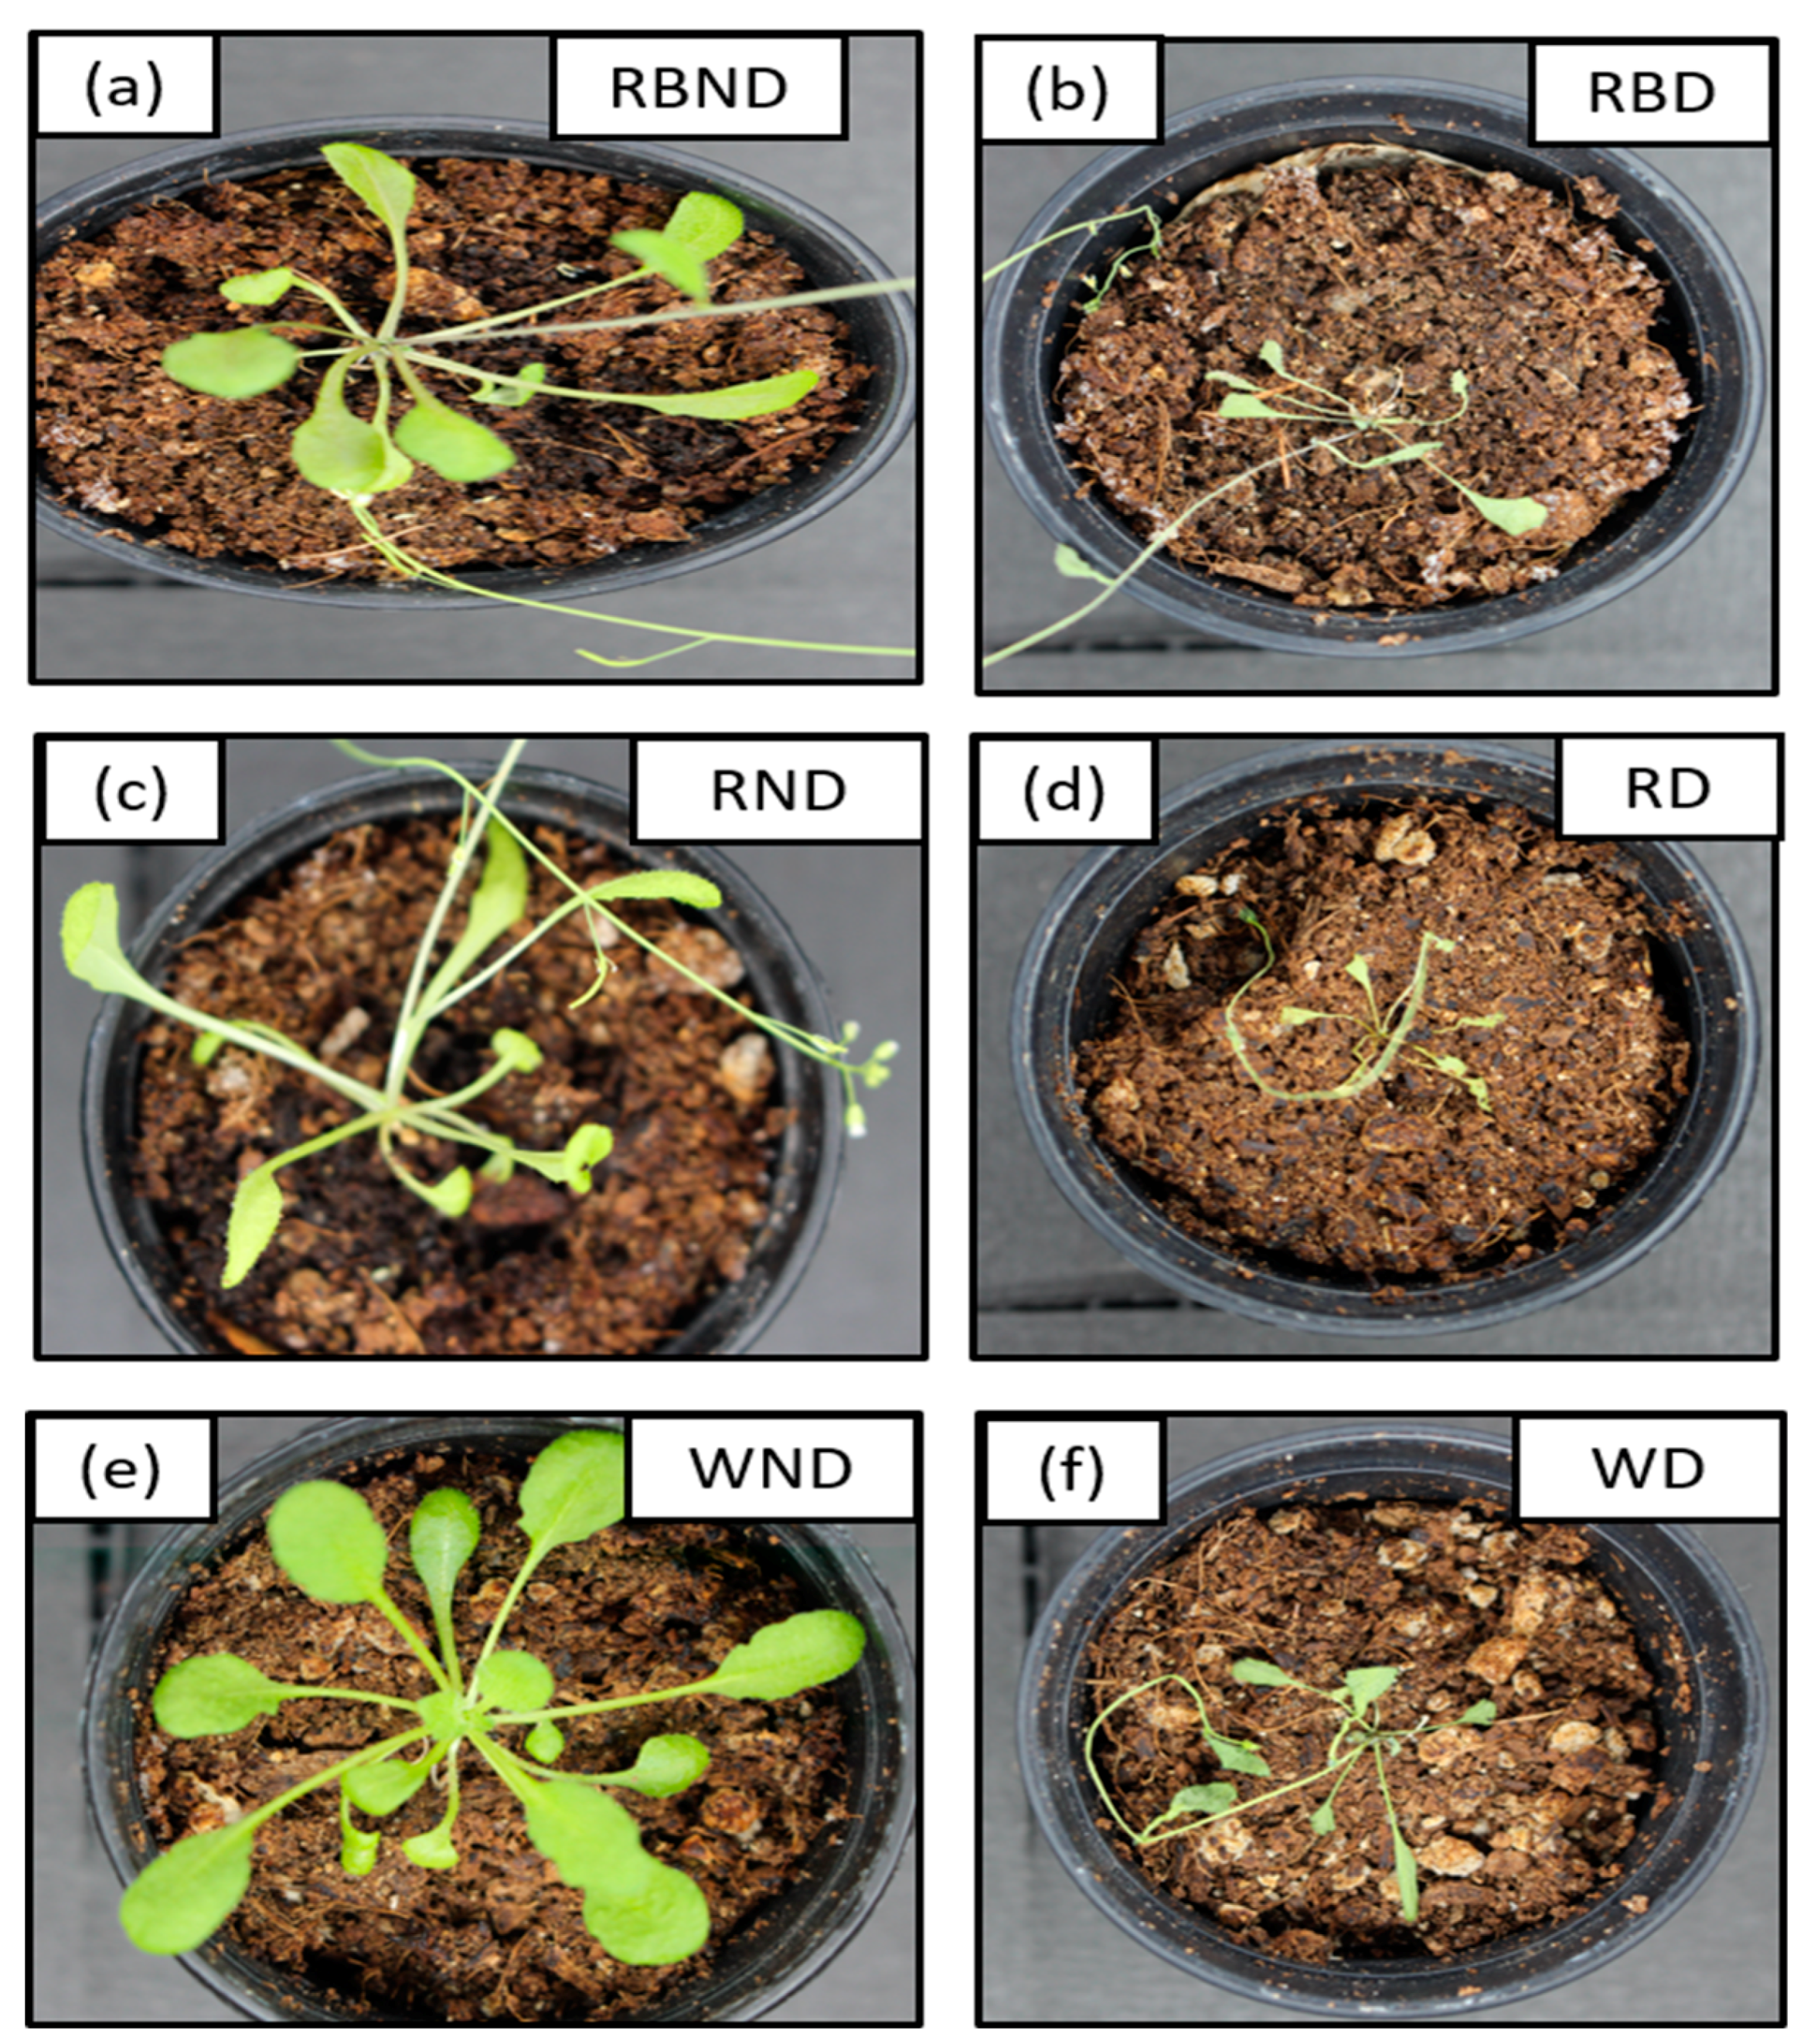
3.2. Plants during Non-Stress and Stress (Drought) Conditions
3.3. HPLC Analysis
3.4. FT-IR and FT-NIR Spectroscopy
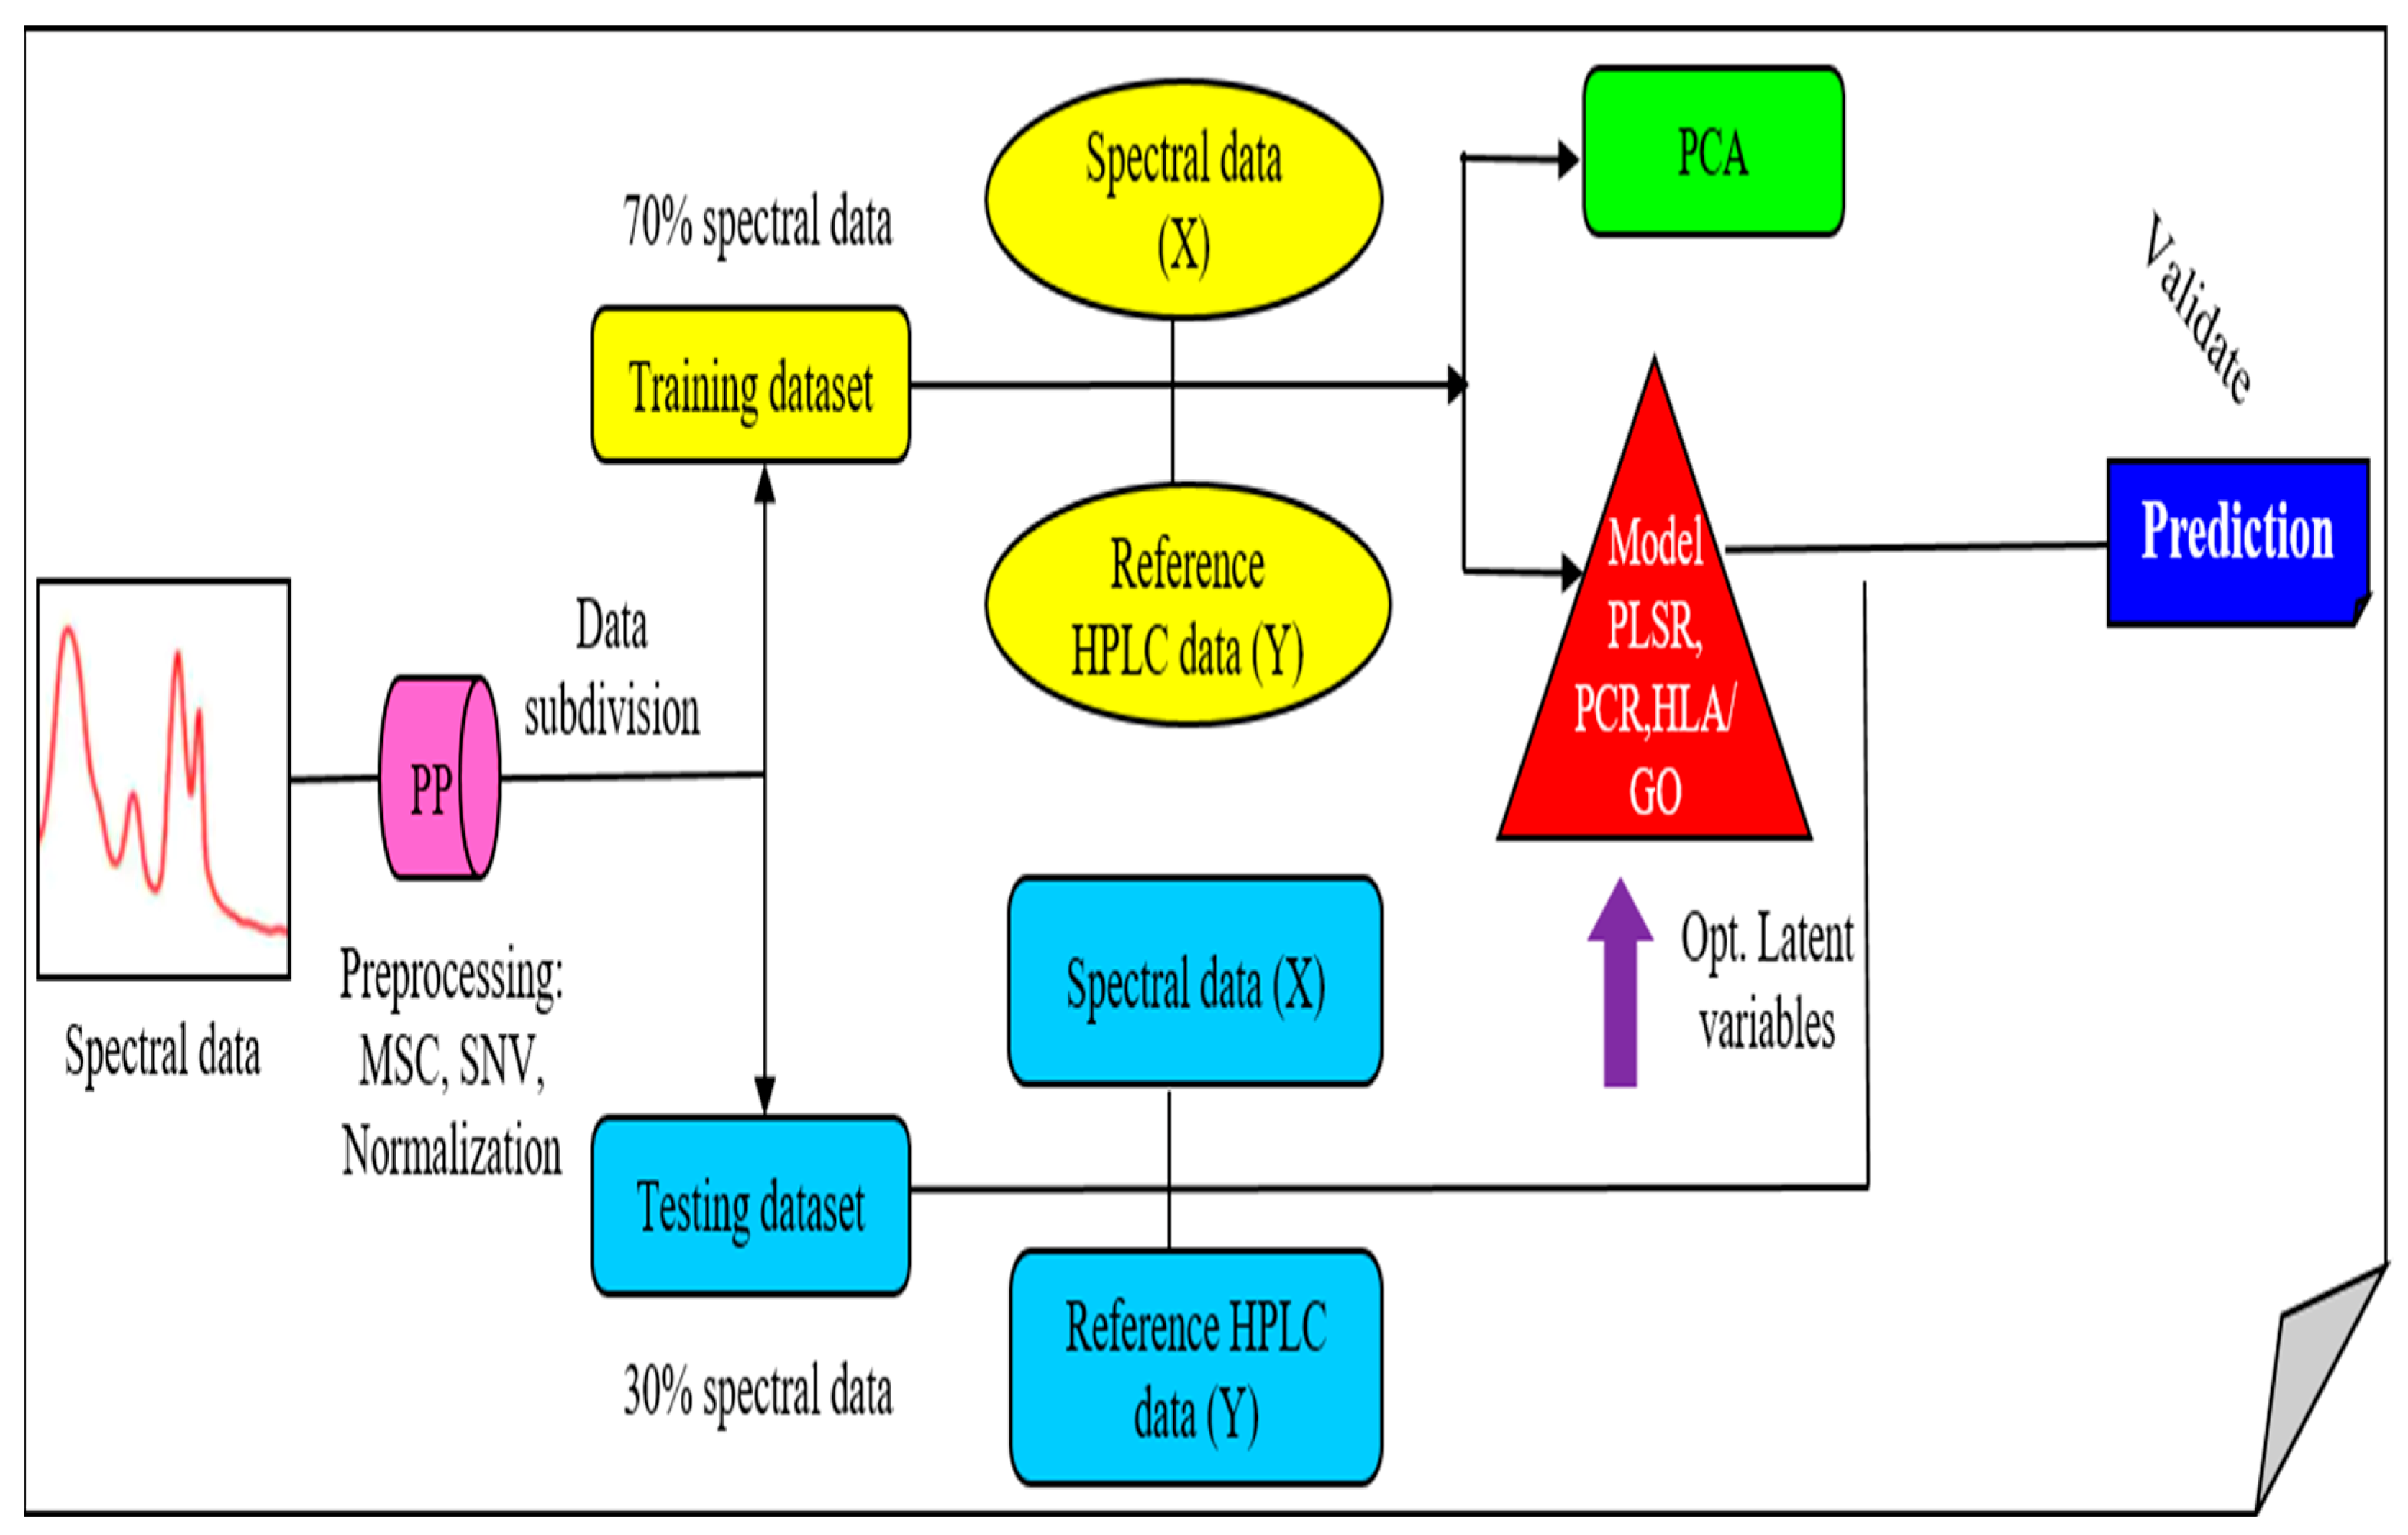
3.5. Data Analysis
3.5.1. PCA Model
3.5.2. Prediction Analysis Models
4. Conclusions
Author Contributions
Funding
Institutional Review Board Statement
Informed Consent Statement
Data Availability Statement
Conflicts of Interest
References
- Abbe, C.Y.; Aboa, N.; Ahi, P.A. Antioxidant Content in Solanum Anguivi Lam Berries as Affected by Cooking at Different Stages of Ripening. Asian Food Sci. J. 2019, 13, 1–10. [Google Scholar] [CrossRef]
- Khoddami, A.; Wilkes, M.A.; Roberts, T.H. Techniques for Analysis of Plant Phenolic Compounds. Molecules 2013, 18, 2328–2375. [Google Scholar] [CrossRef] [PubMed]
- Cheynier, V. Phenolic Compounds: From Plants to Foods. Phytochem. Rev. 2012, 11, 153–177. [Google Scholar] [CrossRef]
- Scalbert, A.; Johnson, I.T.; Saltmarsh, M. Polyphenols: Antioxidants and beyond. Am. J. Clin. Nutr. 2005, 81, 215–217. [Google Scholar] [CrossRef] [PubMed]
- Boots, A.W.; Wilms, L.C.; Swennen, E.L.R.; Kleinjans, J.C.S.; Bast, A.; Haenen, G.R.M.M. In vitro and ex vivo anti-inflammatory activity of quercetin in healthy volunteers. Nutrition 2008, 24, 703–710. [Google Scholar] [CrossRef]
- Kanadaswami, C.; Lee, L.T.; Lee, P.P.H.; Hwang, J.J.; Ke, F.C.; Huang, Y.T.; Lee, M.T. The antitumor activities of flavonoids. In Vivo 2005, 19, 895–910. [Google Scholar]
- Poczai, P.; Cernák, I.; Varga, I.; Hyvönen, J. Analysis of the genome sequence of the flowering plant Arabidopsis thaliana. Genet. Resour. Crop Evol. 2014, 61, 796–815. [Google Scholar]
- Seal, T. Quantitative HPLC analysis of phenolic acids, flavonoids and ascorbic acid in four different solvent extracts of two wild edible leaves, Sonchus arvensis and Oenanthe linearis of North-Eastern region in India. J. Appl. Pharm. Sci. 2016, 6, 157–166. [Google Scholar] [CrossRef] [Green Version]
- Jacques, R.A.; Santos, J.G.; Dariva, C.; Oliveira, J.V.; Caramão, E.B. GC/MS characterization of mate tea leaves extracts obtained from high-pressure CO2 extraction. J. Supercrit. Fluids 2007, 40, 354–359. [Google Scholar] [CrossRef]
- Blainski, A.; Lopes, G.C.; De Mello, J.C.P. Application and analysis of the folin ciocalteu method for the determination of the total phenolic content from Limonium brasiliense L. Molecules 2013, 18, 6852–6865. [Google Scholar] [CrossRef] [Green Version]
- Joshi, R.; Sathasivam, R.; Park, S.U.; Lee, H.; Kim, M.S.; Baek, I. Application of Fourier Transform Infrared Spectroscopy and Multivariate Analysis Methods for the Non-Destructive Evaluation of Phenolics Compounds in Moringa Powder. Agriculture 2021, 12, 10. [Google Scholar] [CrossRef]
- Joshi, R.; Cho, B.-K.; Lohumi, S.; Joshi, R.; Lee, J.; Lee, H.; Mo, C. Evaluation of benzene residue in edible oils using Fourier transform infrared (FTIR) spectroscopy. Korean J. Agric. Sci. 2019, 46, 257–271. [Google Scholar]
- Access, O. Quantitative analysis of glycerol concentration in red wine using Fourier transform infrared spectroscopy and chemometrics analysis. Korean J. Agric. Sci. 2021, 48, 299–310. [Google Scholar]
- Frizon, C.N.T.; Oliveira, G.A.; Perussello, C.A.; Peralta-Zamora, P.G.; Camlofski, A.M.O.; Rossa, Ü.B.; Hoffmann-Ribani, R. Determination of total phenolic compounds in yerba mate (Ilex paraguariensis) combining near infrared spectroscopy (NIR) and multivariate analysis. Lwt 2015, 60, 795–801. [Google Scholar] [CrossRef] [Green Version]
- Shi, J.Y.; Zou, X.B.; Zhao, J.W.; Mel, H.; Wang, K.L.; Wang, X.; Chen, H. Determination of total flavonoids content in fresh Ginkgo biloba leaf with different colors using near infrared spectroscopy. Spectrochim. Acta-Part A Mol. Biomol. Spectrosc. 2012, 94, 271–276. [Google Scholar] [CrossRef]
- Li, W.; Qu Haibin, H. Rapid quantification of phenolic acids in Radix Salvia Miltrorrhiza extract solutions by FT-NIR spectroscopy in transflective mode. J. Pharm. Biomed. Anal. 2010, 52, 425–431. [Google Scholar] [CrossRef]
- Arslan, M.; Xiaobo, Z.; Shi, J.; Tahir, H.E.; Zareef, M.; Rakha, A.; Bilal, M. In situ prediction of phenolic compounds in puff dried Ziziphus jujuba Mill. using hand-held spectral analytical system. Food Chem. 2020, 331, 127361. [Google Scholar] [CrossRef]
- Hssaini, L.; Razouk, R.; Bouslihim, Y. Rapid Prediction of Fig Phenolic Acids and Flavonoids Using Mid-Infrared Spectroscopy Combined With Partial Least Square Regression. Front. Plant Sci. 2022, 13, 429. [Google Scholar] [CrossRef]
- Fisher College, S.J.; Telange, D.R.; Patil, A.T.; Pethe, A.M.; Tatode, A.A.; Anand, S.; Fisher, S.J. Kaempferol-Phospholipid Complex: Formulation, and Evaluation Kaempferol-Phospholipid Complex: Formulation, and Evaluation of Improved Solubility, In Vivo Bioavailability, and Antioxidant of Improved Solubility, In Vivo Bioavailability, and Antioxidant Pot. J. Excip. Food Chem. 2016, 7, 89–116. [Google Scholar]
- Samsonowicz, M.; Kamińska, I.; Kalinowska, M.; Lewandowski, W. Alkali metal salts of rutin—Synthesis, spectroscopic (FT-IR, FT-Raman, UV-VIS), antioxidant and antimicrobial studies. Spectrochim. Act-Part A Mol. Biomol. Spectrosc. 2015, 151, 926–938. [Google Scholar] [CrossRef]
- Rodríguez-Rodríguez, W.A.; Colón, J.; Guzmán, R.; Rivera, H.; Santiago-Berríos, M.B. Synthesis, characterization and electrochemical characterization of lead selenide sub-micron particles capped with a benzoate ligand and prepared at different temperatures. Mater. Res. Express 2014, 1, 035906. [Google Scholar] [CrossRef]
- Hong, X.Z.; Fu, X.S.; Wang, Z.L.; Zhang, L.; Yu, X.P.; Ye, Z.H. Tracing Geographical Origins of Teas Based on FT-NIR Spectroscopy: Introduction of Model Updating and Imbalanced Data Handling Approaches. J. Anal. Methods Chem. 2019, 2019, 1537568. [Google Scholar] [CrossRef] [PubMed]
- Chang, X.; Wei, D.; Su, S.; Guo, S.; Qian, S.; Yan, H.; Zhao, M.; Shang, E.; Qian, D.; Sun, X.; et al. An integrated strategy for rapid discovery and prediction of nucleobases, nucleosides and amino acids as quality markers in different flowering stages of Flos Chrysanthemi using UPLC–MS/MS and FT-NIR coupled with multivariate statistical analysis. Microchem. J. 2020, 153, 104500. [Google Scholar] [CrossRef]
- Wang, M.; Zhao, M.; Rahardja, S. Nonlinear Unmixing of Hyperspectral Data via Deep Autoencoder Networks. IEEE Geosci. Remote Sens. Lett. 2019, 16, 1467–1471. [Google Scholar] [CrossRef]
- Claveria, L.T.; Jáuregui, O.; Codina, C.; Tiburico, A.F.; Bastida, J.; Viladomat, F. Analysis of phenolic compounds by high-performance liquid chromatography coupled to electrospray ionization tandem mass spectrometry in senescent and water-stressed tobacco. Plant Sci. 2012, 182, 71–78. [Google Scholar] [CrossRef] [PubMed]
- Villagra, J.G.; Cohen, J.D.; Diaz, M.M.R. Abscisic acid is involved in phenolic compounds biosynthesis, mainly anthocyanins, in leaves of Aristotelia chilensis plants (Mol.) subjected to drought stress. Physiol. Plant. 2019, 165, 855–866. [Google Scholar] [CrossRef]
- Yeo, H.J.; Baek, S.A.; Sathasivam, R.; Kim, J.K.; Park, S.U. Metabolomic analysis reveals the interaction of primary and secondary metabolism in white, pale green, and green pak choi (Brassica rapa subsp. chinensis). Appl. Biol. Chem. 2021, 64, 1–6. [Google Scholar] [CrossRef]
- Storme-Paris, I.; Clarot, I.; Esposito, S.; Chaumeil, J.C.; Nicolas, A.; Brion, F.; Rieutord, A.; Chaminade, P. Near InfraRed Spectroscopy homogeneity evaluation of complex powder blends in a small-scale pharmaceutical preformulation process, a real-life application. Eur. J. Pharm. Biopharm. 2009, 72, 189–198. [Google Scholar] [CrossRef]
- Joshi, R.; Joshi, R.; Mo, C.; Faqeerzada, M.A.; Amanah, H.Z.; Masithoh, R.E.; Kim, M.S.; Cho, B.-K. Raman Spectral Analysis for Quality Determination of Grignard Reagent. Appl. Sci. 2020, 10, 3545. [Google Scholar] [CrossRef]
- Shin, J.K.; Moon, S.H. Numerical Investigations in Choosing the Number of Principal Components in Principal Component Regression—CASE I. J. Korean Data Inf. Sci. Soc. 1997, 8, 127–134. [Google Scholar]
- Goicoechea, H.C.; Goicoechea, H.C.; Olivieri, A.C. Wavelength selection by net analyte signals calculated with multivariate factor-based hybrid linear analysis (HLA). A theoretical and experimental comparison with partial least-squares (PLS). Analyst 1999, 124, 725–731. [Google Scholar] [CrossRef]
- Lorber, A. Error propagation and figures of merit for quantification by solving matrix equations. Anal. Chem. 1986, 58, 1167–1172. [Google Scholar] [CrossRef]
- Marsili, N.R.; Sobrero, M.S.; Goicoechea, H.C. Spectrophotometric determination of sorbic and benzoic acids in fruit juices by a net analyte signal-based method with selection of the wavelength range to avoid non-modelled interferences. Anal. Bioanal. Chem. 2003, 376, 126–133. [Google Scholar] [CrossRef] [PubMed]


| Spectroscopic Technique | Absorption Frequency, ν (cm−1) | Assignment |
|---|---|---|
| FT-IR spectroscopy | 3500–2500 | O-H stretching |
| 1700–1600 | C=O stretching | |
| 2954 and 2850 | C-H stretching | |
| 1505 | C=C stretching | |
| 1600 | Benzene ring skeleton | |
| 1500 | C=C aromatic stretching |
| Spectroscopic Technique | Absorption Frequency, ν (cm−1) | Assignment |
|---|---|---|
| FT-NIR spectroscopy | 8350 | Second overtone of C-H stretching |
| 6000–7000 | First overtone of the O-H and N-H stretching | |
| 5172 | Combination of O-H and C-O stretching | |
| 4813 | Combination of O-H bending and C-O stretching | |
| 4450 to 4285 | Combination band region | |
| 4450 and 4410 | O-H bond combined with the C-O bond | |
| 4380 and 4315 | the C-H bond | |
| 4285 | The C-H bond combined with the C-H bond |
| Phenolics | Red + Non-Drought | Red + Drought | Red-Blue + Non-Drought | Red-Blue + Drought | White + Non-Drought | White + Drought |
|---|---|---|---|---|---|---|
| Gallic acid | ND | ND | ND | ND | 0.043 ± 0.010 a 1 | 0.017 ± 0.002 b |
| Catechin | 0.141 ± 0.003 a | 0.165 ± 0.021 a | 0.130 ± 0.014 a | 0.134 ± 0.014 a | 0.150 ± 0.011 a | 0.145 ± 0.026 a |
| Chlorogenic acid | 0.123 ± 0.002 a | 0.119 ± 0.011 a | ND | ND | 0.123 ± 0.005 a | 0.137 ± 0.009 a |
| Caffeic acid | 0.049 ± 0.010 b | 0.060 ± 0.007 b | ND | ND | 0.059 ± 0.005 b | 0.050 ± 0.011 b |
| (-)-Epicatechin | ND | ND | ND | ND | 0.055 ± 0.011 b | 0.037 ± 0.004 b |
| Epicatechin gallate | 0.124 ± 0.006 c | 0.255 ± 0.030 b | ND | ND | 0.743 ± 0.023 a | 0.302 ± 0.030 b |
| Ferulic acid | 0.033 ± 0.013 cd | 0.053 ± 0.001 c | ND | ND | 0.138 ± 0.014 b | 0.384 ± 0.029 a |
| Sinapic acid | ND | 0.015 ± 0.002 b | ND | ND | 0.032 ± 0.002 a | 0.035 ± 0.007 a |
| Benzoic acid | 0.136 ± 0.002 b | 0.138 ± 0.009 b | ND | 0.135 ± 0.010 b | ND | ND |
| Rutin | 0.340 ± 0.005 b | 0.339 ± 0.018 b | 0.464 ± 0.132 ab | 0.600 ± 0.168 a | 0.39 ± 0.040 ab | 0.390 ± 0.043 ab |
| Quercetin | 0.281 ± 0.004 a | 0.339 ± 0.049 a | 0.283 ± 0.016 a | 0.354 ± 0.085 a | 0.287 ± 0.018 a | 0.259 ± 0.014 a |
| Kaempferol | 0.085 ± 0.008 b | 0.098 ± 0.017 b | 0.100 ± 0.014 b | 0.086 ± 0.013 b | 0.174 ± 0.038 a | 0.104 ± 0.016 b |
| TOTAL | 1.311 ± 0.013 cd | 1.582 ± 0.063 bc | 0.977 ± 0.136 d | 1.309 ± 0.241 cd | 2.194 ± 0.053 a | 1.859 ± 0.084 b |
| Technique (n = 600) | Samples | Number of Samples (Calibration) | Number of Samples (Prediction) |
|---|---|---|---|
| FT-IR spectroscopy | Arabidopsis powder samples | 360 | 240 |
| Region | Model/Preprocessing | RMSEC (mg/g) | RMSEP (mg/g) | LVs | ||
|---|---|---|---|---|---|---|
| FT-IR spectroscopy | PLSR/Mean norm. | 0.983 | 0.051 | 0.978 | 0.058 | 8 |
| PLSR/MSC | 0.981 | 0.054 | 0.981 | 0.056 | 8 | |
| PLSR/SNV | 0.981 | 0.053 | 0.980 | 0.055 | 8 | |
| PLSR/SG-1 | 0.969 | 0.053 | 0.975 | 0.063 | 8 | |
| PLSR/SG-2 | 0.968 | 0.071 | 0.972 | 0.066 | 5 | |
| PLSR/Raw | 0.970 | 0.069 | 0.968 | 0.070 | 8 | |
| PCR/SG-1 | 0.949 | 0.089 | 0.963 | 0.077 | 6 | |
| HLA/GO/SNV | 0.929 | 0.109 | 0.941 | 0.100 | 8 |
| Region | Model/Preprocessing | RMSEC (mg/g) | RMSEP (mg/g) | LVs | ||
|---|---|---|---|---|---|---|
| FT-NIR spectroscopy | PLSR/Mean norm. | 0.943 | 0.094 | 0.931 | 0.104 | 5 |
| PLSR/MSC | 0.999 | 0.003 | 0.999 | 0.003 | 7 | |
| PLSR/SNV | 0.999 | 0.003 | 0.999 | 0.004 | 7 | |
| PLSR/SG-1 | 0.993 | 0.031 | 0.991 | 0.036 | 6 | |
| PLSR/SG-2 | 0.993 | 0.032 | 0.991 | 0.037 | 5 | |
| PLSR/Raw | 0.927 | 0.107 | 0.912 | 0.118 | 6 | |
| PCR/MSC | 0.999 | 0.004 | 0.999 | 0.003 | 6 | |
| HLA/GO/SNV | 0.922 | 0.116 | 0.897 | 0.131 | 5 |
Publisher’s Note: MDPI stays neutral with regard to jurisdictional claims in published maps and institutional affiliations. |
© 2022 by the authors. Licensee MDPI, Basel, Switzerland. This article is an open access article distributed under the terms and conditions of the Creative Commons Attribution (CC BY) license (https://creativecommons.org/licenses/by/4.0/).
Share and Cite
Joshi, R.; Sathasivam, R.; Jayapal, P.K.; Patel, A.K.; Nguyen, B.V.; Faqeerzada, M.A.; Park, S.U.; Lee, S.H.; Kim, M.S.; Baek, I.; et al. Comparative Determination of Phenolic Compounds in Arabidopsis thaliana Leaf Powder under Distinct Stress Conditions Using Fourier-Transform Infrared (FT-IR) and Near-Infrared (FT-NIR) Spectroscopy. Plants 2022, 11, 836. https://doi.org/10.3390/plants11070836
Joshi R, Sathasivam R, Jayapal PK, Patel AK, Nguyen BV, Faqeerzada MA, Park SU, Lee SH, Kim MS, Baek I, et al. Comparative Determination of Phenolic Compounds in Arabidopsis thaliana Leaf Powder under Distinct Stress Conditions Using Fourier-Transform Infrared (FT-IR) and Near-Infrared (FT-NIR) Spectroscopy. Plants. 2022; 11(7):836. https://doi.org/10.3390/plants11070836
Chicago/Turabian StyleJoshi, Rahul, Ramaraj Sathasivam, Praveen Kumar Jayapal, Ajay Kumar Patel, Bao Van Nguyen, Mohammad Akbar Faqeerzada, Sang Un Park, Seung Hyun Lee, Moon S. Kim, Insuck Baek, and et al. 2022. "Comparative Determination of Phenolic Compounds in Arabidopsis thaliana Leaf Powder under Distinct Stress Conditions Using Fourier-Transform Infrared (FT-IR) and Near-Infrared (FT-NIR) Spectroscopy" Plants 11, no. 7: 836. https://doi.org/10.3390/plants11070836
APA StyleJoshi, R., Sathasivam, R., Jayapal, P. K., Patel, A. K., Nguyen, B. V., Faqeerzada, M. A., Park, S. U., Lee, S. H., Kim, M. S., Baek, I., & Cho, B.-K. (2022). Comparative Determination of Phenolic Compounds in Arabidopsis thaliana Leaf Powder under Distinct Stress Conditions Using Fourier-Transform Infrared (FT-IR) and Near-Infrared (FT-NIR) Spectroscopy. Plants, 11(7), 836. https://doi.org/10.3390/plants11070836