Abstract
Genome–environment Associations (GEA) or Environmental Genome-Wide Association scans (EnvGWAS) have been poorly applied for studying the genomics of adaptive traits in bread wheat landraces (Triticum aestivum L.). We analyzed 990 landraces and seven climatic variables (mean temperature, maximum temperature, precipitation, precipitation seasonality, heat index of mean temperature, heat index of maximum temperature, and drought index) in GEA using the FarmCPU approach with GAPIT. Historical temperature and precipitation values were obtained as monthly averages from 1970 to 2000. Based on 26,064 high-quality SNP loci, landraces were classified into ten subpopulations exhibiting high genetic differentiation. The GEA identified 59 SNPs and nearly 89 protein-encoding genes involved in the response processes to abiotic stress. Genes related to biosynthesis and signaling are mainly mediated by auxins, abscisic acid (ABA), ethylene (ET), salicylic acid (SA), and jasmonates (JA), which are known to operate together in modulation responses to heat stress and drought in plants. In addition, we identified some proteins associated with the response and tolerance to stress by high temperatures, water deficit, and cell wall functions. The results provide candidate regions for selection aimed to improve drought and heat tolerance in bread wheat and provide insights into the genetic mechanisms involved in adaptation to extreme environments.
1. Introduction
Since its domestication more than 10,000 years ago, common wheat has experienced a series of selective events caused by humans and the environment, contributing to the increase in its genetic diversification [1]. Climate change has severely reduced wheat production in recent years due to extreme temperature episodes and unpredictable precipitation patterns [2,3]. Simulation models predict losses of more than 20% in agricultural production by 2050 [4].
There is an urgent need to discover new sources of adaptation to drought and heat that contribute to maintaining crop productivity [2]. To address this scenario, landraces are valuable, because they have developed survival mechanisms for challenging environments through natural and human selection [5,6]. This is why they preserve loci of adaptation to climate change in their places of origin [7].
Recent advances in sequencing technologies have allowed the exploration of entire genomes in various species with increasingly dense single-nucleotide polymorphism (SNP) data that identify selective events [8]. Likewise, novel bioinformatic analysis approaches, such as genome-wide association studies (GWAS), are very efficient in time, cost, and precision for identifying genes that control important agricultural traits [9].
Genome–environment Associations (GEA) or Environmental Genome-Wide Association scans (EnvGWAS) have been used successfully for studying adaptive traits in local populations. They consist of associating SNPs distributed throughout the genome with environmental variables of the accession sampling sites [10].
Associations between the genome and environment of origin were initially documented in wild populations, with the successful identification of adaptive loci and prediction of phenotypic variations [11,12,13,14]. However, its application in crops is recent, with research carried out on sorghum through bioclimatic and soil gradients to predict adaptive traits [15]. Subsequent applications have been made in crops such as corn [16], beans [10,17], barley [7,18], soybean [19], tomato [20], chickpea [21], peach [22] and wheat [23].
In the last decade, significant progress has been reported in the characterization of wheat genomes through high-throughput genotyping with DArT-seq technology. More than 100,000 accessions belonging to the germplasm bank of the International Maize and Wheat Improvement Center (CIMMYT) have been characterized through the Seeds of Discovery initiative [24,25].
Considering the effectiveness of GWAS for the identification of genomic regions associated with traits of agronomic importance, as well as the functional genetic variation to adapt crops to climate change, this research aims to identify genomic regions related to the adaptation process to arid climates through Genome–environment Association studies in the Triticum aestivum collection maintained in the CIMMYT germplasm bank.
2. Results
2.1. Exploratory Analysis
As expected, the highly significantly (p ≤ 0.001) and correlated variables share with each other temperature in their definition (Table 1). For instance (Table 1a), AMT was consistently significantly and positively correlated with the variables MaxTWM (r = 0.79), MeanTDQ (r = 0.71), and MeanTWQ (r = 0.77), similar to MaxTWM with MeanTWQ (r = 0.94). For those based on precipitation, only PDM with PDQ (r = 0.99) exhibited a significant correlation. Similarly, Table 1b shows positive correlations between the variables associated with temperature, such as the case of AMT with the variables MaxT (r = 0.98), HITmead (r = 0.92), and HITmax (r = 0.93); MaxT with HITmead (r = 0.92) and HITmax (r = 0.96); and HITmead with HITmax (r = 0.97). On the other hand, negative correlations were observed only for MeanTDQ with PWQ (r = −0.84) and AP with DI (r = −0.83), which reflect contrasting trends between temperature and precipitation.

Table 1.
Above the diagonal, correlations between bioclimatic variables, indices, and elevation. Below the diagonals, p-values for the significance test.
In the PCA, we observed that the evaluated variables had contrasting contributions to the total variation of each component, especially for the second set of variables (Figures S1 and S2). In the biplot graphs of the PCA (Figure 1), we identified that the accessions sites are well-differentiated with respect to their Köppen-Geiger climate, revealing a greater representation of collections from the temperate (C) and cold (D) groups. For the first set (Figure 1a), those related to temperature (AMT, MaxTWM, MeanTDQ, and MeanTWQ) are oriented along PC1, while the precipitation-derived variables (PDM, PS, and PDQ) predominate in PC2. Similarly, for the second set (Figure 1b), PC1 includes the temperature-related variables (AMT, HITmead, MaxT, and HITmax), while PC2 includes AP and DI. The PCA helpfully identified some variables with discriminating potential of accessions according to the Köppen-Geiger climate groups (Figure 1b). For example, the high DI sites are related to dry climates (B), whereas the temperature-related variables (HITmax, HITmead, AMT, and MaxT) define gradients from tropical (A) to temperate (C) groups. On the other hand, we identify the variables of most significant importance concerning the monitoring, follow-up, and informativeness of drought and heat stress events and their contribution to the total variation.
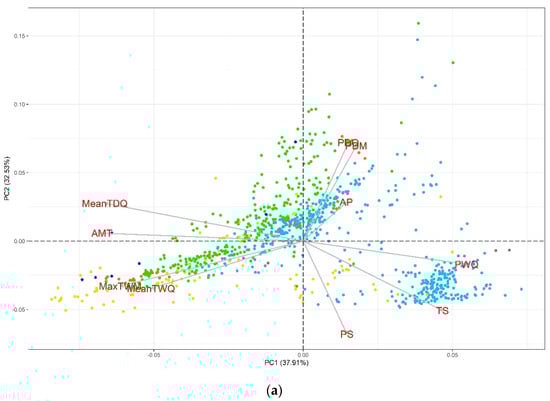
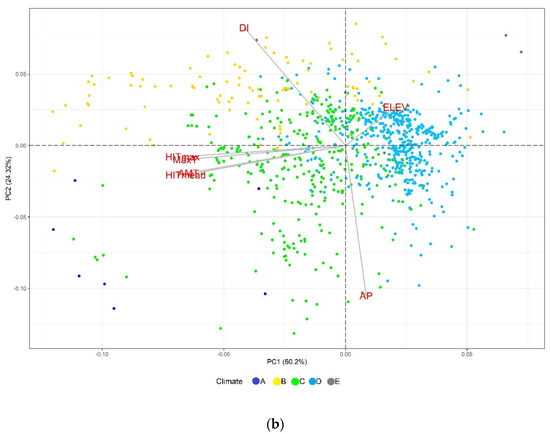
Figure 1.
Principal component analysis for bioclimatic variables and elevation: (a) bioclimatic variables related to aridity and (b) temperature-related variables, calculated indices, AP, and ELEV. A = Tropical, B = Dry, C = Temperate, D = Continental, and E = Polar.
2.2. Population Structure
The cross-entropy validation implemented in the LEA package, based on SNP markers, suggested an optimal number of 10 subpopulations (Figure 2). This subdivision reflects diversity according to the climate in the subpopulations, since there is no explicit representation between these and their geographic or regional origin. The main contribution of accessions comes from Turkey and China of 49.5% and 27.8%, respectively. This is followed by Afghanistan, Tajikistan, and Iran of 5.2%, 4.2%, and 3.4%, respectively. The rest of the countries contribute with less than 2% of the accessions. Subpopulations II, IV, VI, and X constitute 60.4% of the total population under study. On the other hand, the dispersion pattern observed in the molecular PCA biplot revealed that the subpopulations were well-differentiated, reflecting the high genetic diversity of the analyzed accessions (Figure 3a). The correspondence analysis (Figure 3b) between the subpopulations and Köppen-Geiger climate groups showed that dry weather accessions (B) were better associated with subpopulation VII. This subpopulation comprised 83 accessions from eight countries (Afghanistan, Armenia, Azerbaijan, China, Iran, Iraq, Tajikistan, and Turkey) cataloged principally within the region of Southern Asia (SAS) with records of an aridity index (DI) greater than 5, whose values indicated water deficiency.
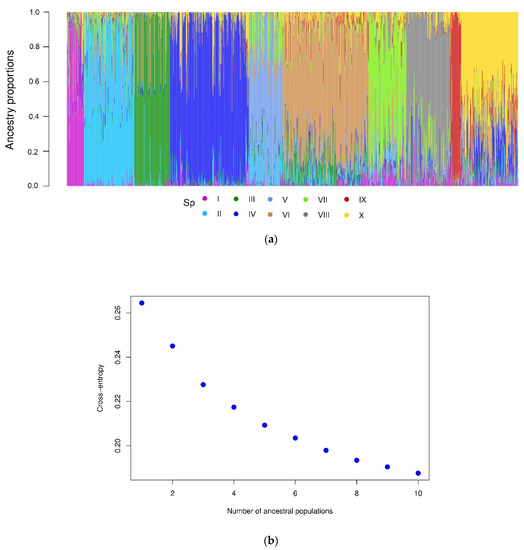
Figure 2.
(a) Grouping of subpopulations (K= 10); each collection is represented by a thin vertical line, divided into colored segments representing the estimated probabilities of belonging (Q) to each subpopulation. (b) Ancestry coefficients estimated by LEA.
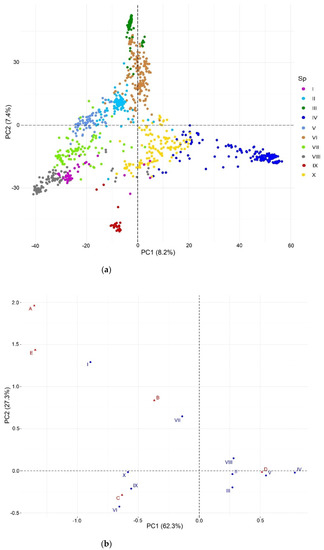
Figure 3.
Population structure: (a) biplot for molecular PCA and (b) biplot of the correspondence analysis, where A = Tropical, B = Dry, C = Temperate, D = Continental, and E = Polar.
2.3. Genome-Wide Association Studies
We identified 59 SNP markers associated with the climatic variables evaluated in all 21 bread wheat chromosomes (Table 2). The chromosomes with the highest number of associated markers were 2B (seven SNPs), 7A (six SNPs), 3B (five SNPs), and 5B (five SNPs). The chromosomes with a single associated marker were 1B, 5A, 6A, 6D, and 7D.
Table 2.
Number of genes detected from Genome–environment Associations (GEA) for seven climatic variables with 26,064 SNPs in 990 landraces of bread wheat.
For all variables, the QQ plots (Figure 4 and Figure 5) show a good adjustment, with most −log10 (p-values) for the null hypothesis of no association, being close to the diagonal. In contrast, some points at the top of each plot may be in linkage disequilibrium (LD) with a causal polymorphism, indicating that the model has a reasonable control for both false positives and negatives.
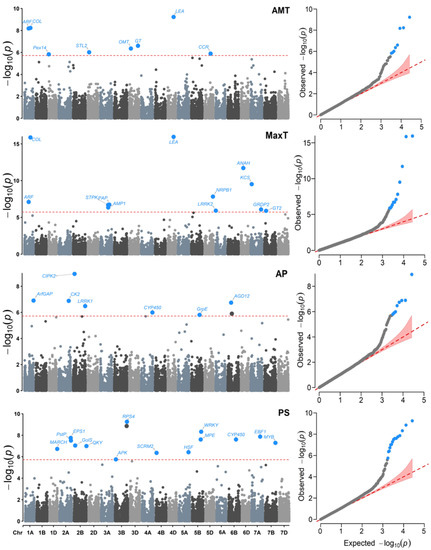
Figure 4.
Manhattan (left) and QQ (right) plots for the Genome–environment Associations (GEA) analyses with the FarmCPU model and the variables: annual mean temperature (AMT), maximum temperature (MaxT), annual precipitation (AP), and precipitation seasonality (PS) in 990 landraces of bread wheat and 26,064 SNP markers. The red dashed horizontal line marks the -log10 (p-value) threshold after Bonferroni correction for multiple comparisons. The proteins associated with the significant SNPs are labeled in each graph.
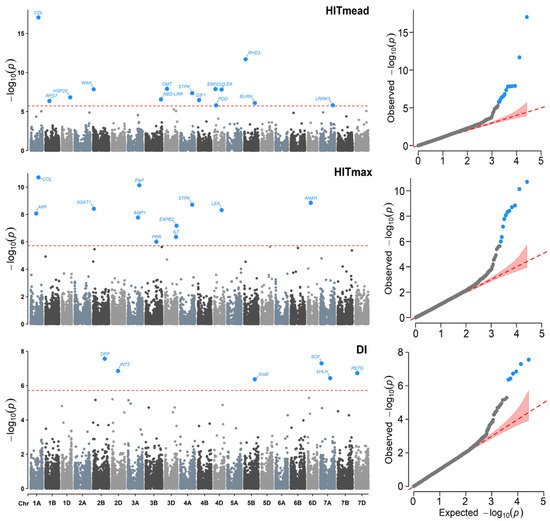
Figure 5.
Manhattan (left) and QQ (right) plots for Genome–environment Association (GEA) analyses with the FarmCPU model and the variables: heat index of the mean temperature (HITmead), heat index of the maximum temperature (HITmax), and drought index (DI) in 990 landraces of bread wheat and 26,064 SNPs markers. The red dashed horizontal line marks the -log10 (p-value) threshold after Bonferroni correction for multiple comparisons. The proteins associated with the significant SNPs are labeled in each graph.
Regarding the individual detection of association for each variable, there were different levels of associated SNPs (Table S1). These differences in detecting different SNPs in highly correlated variables may be due to the possible presence of atypical data in the collection sites. Likewise, it is known that the effects produced by drought and heat are differential in certain phases of reproductive development, during which plants are more susceptible. We observed a lower association with variables DI, AMT, and AP, with less than eight markers for each one. In contrast, the variables with more associated loci were PS, HITmead, MaxT, and HITmax, with 15, 14, 12, and 11 SNPs, respectively.
At least 10 SNP located in seven chromosomes (1A, 3A, 3D, 4A, 4D, 5B, and 6D) were detected more than once for variables AMT, MaxT, HITmead, and HITmax. The most frequent SNPs were 108825112|F|0-19:T>A-19:T>A and 108891114|F|0-33:A>G-33:A>G on chromosome 1A and allele 109431634|F|0-54:G>A-54:G>A on chromosome 4D. These SNPs are related to the genes Auxin response factor (ARF), CONSTANS-like (COL), and proteins abundant during late embryogenesis (LEA).
2.4. Identification of Genes Related to Adaptation to Abiotic Stress in Plants
For the associated regions, we found 89 candidate genes encoding proteins related to various biological processes in plants (Table 2). Among these, we identified the significant presence of 26 proteins involved in the signaling network (Table 3), 15 cell wall structural proteins (Table 4), 21 response proteins to various types of abiotic stress (Table 5), and 7 proteins related to morphological changes (Table S2).
Table 3.
Signaling genes and proteins identified for Genome–environment Associations (GEA) with seven climatic variables.
Table 4.
Cell wall genes and proteins identified for Genome–environment Associations (GEA) with seven climatic variables.
Table 5.
Abiotic stress genes and proteins identified for Genome–environment Associations (GEA) with seven climatic variables.
Given that a response to stress begins with the perception and signal transduction of environmental stimuli, it is not surprising that we found an abundance of signaling proteins with a well-documented role in plant responses to drought and heat stress. This is the case for protein kinases serine-threonine (Pstp-2A; STPK-2B, 3A, 4A, and 4D; and CIPK2-2B) and some proteins activated by stress-related plant hormones, such as ethylene (ET), abscisic acid (ABA), jasmonic acid (JA), salicylic acid (SA), and auxins, reported mainly by the BIO15, HITmax, and MaxT variables and chromosomes 7A, 4D, 2B, and 1D (Table 3).
Within the genes associated with the cell wall (Table 4), proteins involved in the biosynthesis of cuticle and cell wall components stand out, such as cuticular wax (ASAT1, CCR, and KCS); polysaccharides such as cellulose, hemicellulose, and pectin (STL2 and MAN2); lignin (OMT); and glycoproteins (GT and 1,3-β-glucanase) on chromosomes 2B, 2D, 3A, 3D, 5B, 5D, and 7A. We also found some structural proteins (WAK90, EXPB2, RD22, and GT2); a membrane trafficking protein (ArfGAP); and two signal transduction proteins (MARCH and QKY) on chromosomes 1A, 1D, 2B, 3D, 5B, and 7B.
Many morphological changes are induced when the plant is subjected to long periods of environmental stress (Table S2). For this reason, we also observed some genes regulating multiple development processes (FBX-2B and 4D), organ morphology (OFP-2B), stomatal differentiation (SCRM2-4B), cell expansion (GIF1-4B), proteins that affect gravitropism (AGD12–6B), and sheet curling (ROC5-6B).
2.5. Drought and Heat Adaptation Genes
Through genomic association with the variables AP, PS, MaxT, HITmead, and DI, we identified 12 genes related to the response and tolerance of plants to drought and heat stress (Table 5 and Figure 6) on chromosomes 1D (one gene), 2B (two genes), 4D (one gene), 5A (one gene), 5B (three genes), 5D (one gene), 6A (one gene), and 7A (two genes). Proteins from different domains represent biological processes related to water deficit: enzymes with galactinol synthase activity (GolS-2B); leucine-rich repeat kinase proteins (LRRK-2B, 6A, and 7A); late embryogenesis abundant proteins (LEA-4D); BURP domain proteins (BURP-5B); WRKY transcription factors (WRKY-5B); and component box proteins of the SKP–Cullin–F-box E3 complex (SCF-7A). Likewise, the response to heat stress by some heat shock proteins (HSP20-1D and HSFA2E-5A), a chronic heat stress thermotolerance protein (GrpE-5B), and a DNA-dependent RNA polymerase (NRPB1-5D).
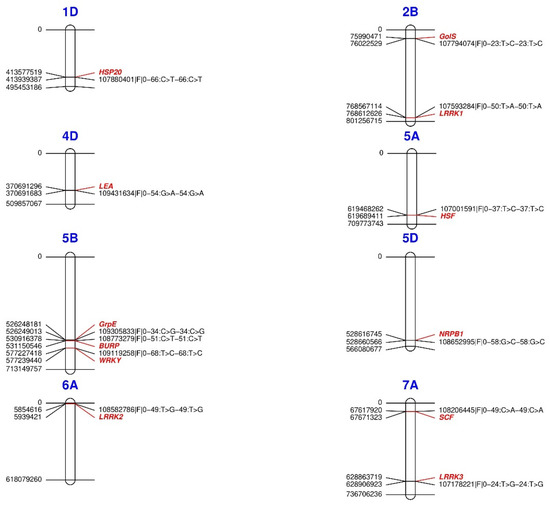
Figure 6.
Physical map of the location of SNPs associated with heat and drought tolerance-related genes in Triticum aestivum. For each locus, the position is written on the left side, whereas SNPs are coded on the right side. Gene names are colored. HSP20 = Heat shock protein class VI; GolS = Galactinol synthase 7; LEA = Late embryogenesis abundant; HSF = Heat shock factor; GrpE = GrpE protein homolog; BURP = BURP domain; WRKY = Probable WRKY TF 57; NRPB1 = DNA-directed RNA polymerase subunit; SCF = F-box component of the SKP-Cullin-F-box E3; LRRK = Leucine-rich repeat receptor-like kinase.
2.6. Other Genes
Additionally, we observed seven genes involved in the response to biotic stress (PELO, RIP, NBS-LRR, LFG4, FMO, and CNGC2); six genes involved in photosynthesis (GLO1, CHLH, PSB33, psbL, γCA1, and PETG); four genes involved in flowering (COL, CK2, FPF1, and APK); and three genes involved in nutrient assimilation (YSL1, PAP, and wSs2a-3) on chromosomes 1A, 2A, 2B, 2D, 3A, 3B, 3D, 4A, 4D, 5B, 5D, 7A, 7B, and 7D (Table S2).
3. Discussion
3.1. Environmental Variables Involved in the Detection of Adaptive Loci by GEA
Climate change affects diverse geographic areas throughout the world. However, its effects in arid and semiarid climatic zones have devastating impacts [26]. These selective environmental effects play an essential role in the local adaptation, genetic diversity, and population structure of wild accessions [17]. Therefore, using climatic variables to represent selective environmental pressure can be valuable to capture important components of the mechanisms of resistance and tolerance to abiotic stress. We observed local adaptation footprints in multiple genomic regions along the 21 wheat chromosomes, with each climatic variable having different numbers of genomic associations of biological importance.
It should be remarked that the climate data came from records spanning 1970–2000, which naturally did not cover the adaptation period of the accessions. However, these 30-year records are good indicators of the prevailing climate type in the collection sites. On the other hand, the accessions were collected from 1983 to 2011, with the main bulk of the collection occurring in 1984 and 2011. One must be aware of the noise arising from the migration dynamics of those materials, especially for the most recent collection efforts. Thus, the herein reported results are subject to validation by different approaches.
Exceptionally, the seasonality of precipitation (PS) had the largest number of significant SNP markers along different chromosomes, placed close to unique genes of resistance and tolerance to abiotic stress. This makes sense, because it is considered an important variable in influencing the distribution of species through water availability [27]. On the other hand, measuring the variations in precipitation [28] at the sites of origin of the collections over three decades (1970–2000) faithfully represents the alterations in the uniformity and distribution of precipitation.
The research of Cortés et al. [29] reaffirmed the above; they found a strong influence of rainfall patterns on the population structure and the ecological diversity to tolerance drought in wild beans. Usually, prolonged periods of drought cause the expression of genomic regions associated with the activation of plant survival mechanisms [17].
The associations with the maximum temperature (MaxT), heat index (HITmead), annual precipitation (AP), and drought index (DI) identified several adaptation genes to drought and heat stress. This is primarily explained by the nature and importance of these variables in the monitoring of conditions of meteorological drought. Both AP and DI are valid descriptors for measuring the drought intensity [30]. DI is calculated through a combination of climatic and meteorological variables, among which precipitation is the most important [31]. In addition, the estimate values DI presented an excellent discriminating potential of accessions from arid climates (B), which gives reliability to its use. On the other hand, according to López-Hernández & Cortés [10], the maximum temperature and the heat index are better estimators of the natural adaptation to high temperatures and identify successfully associated genetic factors markers.
Different variables shared associations with some loci, suggesting that their selective pressures can shape the same genomic regions [22] and, therefore, remain stable in the landraces of Triticum aestivum. The most frequent loci on chromosomes 1A and 4D are related to two genes: CONSTANS-like and proteins abundant in late embryogenesis (LEA). The first is involved in various biological processes of plants, such as the control of the flowering time, regulation of growth and development, and responses to abiotic stress [32,33,34]. LEA proteins are recognized during the adaptation to abiotic stress, which includes dehydration, salinity, high temperature, and cold [35,36,37].
On the other hand, the only matching locus between AP and DI flanked an F-box domain gene, which is a homolog of the GrpE protein. In Arabidopsis, this gene acts as a nucleotide exchange factor of the 70-kD heat shock protein complex (HSP70), which specializes in thermotolerance to heat stress [38,39].
3.2. Adaptation to Drought and Heat Stress
Despite their coexistence in a climate change scenario, the combined effects of drought and heat stress have been poorly studied [40]. They have a synergistic effect, altering the metabolism and gene expression in ways other than those induced independently [41]. These combined effects affect several physiological, cellular, and molecular processes in plant cells [10].
The stress response mechanism in plants is very complex and requires several integrated pathways to be activated in response to external stress [42]. Plant hormones, such as auxins, abscisic acid (ABA), ethylene (ET), salicylic acid (SA), and jasmonates (JA), operate together in the modulation of the plants’ heat and drought stress responses [43,44].
Typically, auxin and the auxin pathway regulate thermomorphogenesis in plants, coordinating the growth and defense against heat stress [45], while ABA and ET interact positively to activate or repress the expression of numerous stress response genes, such as LEA proteins and dehydrins [46,47]. Likewise, SA is related to the synthesizing of protein chaperones, heat shock proteins, protective membrane proteins, antioxidants, and secondary metabolites [46,48,49]. Jasmonates significantly improve the tolerance to heat and drought stress through various TFs, which induce responsive gene expression and organic osmo-protectant activation, osmotic adjustment, and antioxidant activity [50,51,52].
Many biochemical and physiological impacts affect the growth and development of plants [40], as they affect the photosynthetic system, gas exchange, and water relations [45]. Consequently, a series of physiological and molecular responses are produced, which include root increase, reduction in the number and conductance of the stomata, decrease in leaf area, and morphological changes in leaves [53]. On the other hand, among the molecular responses, one should consider the production of antioxidants and osmolytes for osmotic adjustment and the expression of various proteins, such as HSP, WRKY, MYB, LEA, and GrpE [40].
The genes reported in this work are involved in most of the mentioned biological processes, including genes with signaling roles and genes associated with the cell walls and membranes, photosynthesis, flowering, and, of course, proteins involved in the response to heat and drought stress on various chromosomes. Our findings are consistent with Y. Li et al. [22]: plant genomes have been shaped by natural selection during local adaptation to different environmental conditions, so there is a close relationship between species survival and response to climate change.
4. Materials and Methods
4.1. Geographical Data
Through code written in the R language v.3.4.4 [54], the passport data of 174,553 accessions from the CIMMYT Wheat Germplasm Bank were filtered to select 1151 landraces of Triticum aestivum with unique and sensible geographic coordinates. Subsequently, the location mapping was carried out through the geographic information system QGIS version 2.18 [55]. This filtering process yielded 990 landraces with validated geographic data. The accessions came from 33 countries distributed in 13 geographic regions (Table 6) [56].
Table 6.
Landrace countries of origin and geographic regions.
4.2. Genotypic Data
Germplasm genotyping was carried out through DArT-seq technology in CIMMYT under the Seeds of Discovery initiative for 45,871 accessions belonging to the wheat germplasm bank. The information was integrated using R v.3.4.4 [54] in a data table with the HapMap format containing the information of 86,683 SNP loci. The markers’ physical locations were obtained by reference genome sequences provided by Diversity Arrays Technology (wheat_ChineseSpring04), and only markers unambiguously located in the wheat genome were retained. Subsequently, they were filtered for quality control through a selection of the cleanest and most informative SNPs, with a maximum missing data rate of 20%, Shannon entropy greater than zero, and variants with a minor allele frequency (MAF) ≥ 2%. The filtered table contained 26,064 SNP loci in 990 landraces with geographic data.
4.3. Climatic Data
For each collection site, we extracted the values of altitude, temperature, precipitation, and eight bioclimatic variables related to drought and heat stress (Table 7) at a spatial resolution of 2.5 min (4.5 km) from the WorldClim platform (https://www.worldclim.org/ accessed on 31 July 2022) using the getData function of the R raster package version 3.5–15 [57]. Bioclimatic variables are derived from the monthly temperature and rainfall historical climate data from 1970 to 2000 in order to generate more biologically meaningful variables [58].
Table 7.
List of geographic, climatic, and bioclimatic variables downloaded from the WorldClim platform.
Additionally, we determined the Köppen-Geiger main climate groups (Table 8) through the R kgc package version 1.0.0.2 [59]. Köppen classification was constructed based on five vegetation groups that distinguish between plants of the equatorial zone (A), the arid zone (B), the warm temperate zone (C), the snow zone (D), and the polar zone (E); in the subclassification, the second letter considers the precipitation while the third letter the air temperature [60].
Table 8.
Climate types under the Köppen-Geiger climate classification.
4.4. Index Estimation
Two heat indices (HIT) were estimated by the Thornthwaite model [61] using values of the mean and maximum temperature from 1970 to 2000. We denominated the HITmean and HITmax, respectively:
For tmeani, tmaxi > 0, where tmeani is the average monthly temperature, and tmaxi is the maximum monthly, respectively, for the ith month.
Furthermore, a drought index was calculated [29]. This index is based on the relationship between the potential evapotranspiration and the annual precipitation of each collection site:
where DI is the drought index, PET is the potential evapotranspiration, and AP is the annual precipitation. In this index, negative values indicate excessive precipitation, while positive values indicate water deficiency. The calculation of PET was done with the thornthwaite function of the R SPEI package version 1.7 [62], through the values of the monthly average temperatures from 1970 to 2000 (tmedi > 0) with the estimated solar radiation being based on the latitude of each collection site.
DI = 100 × [(PET − AP) /PET],
4.5. Exploratory Analysis of Climatic Variables
To look for patterns of relationships among climate variables, we used the Pearson correlation coefficient (r) and principal component analysis (PCA). The standardized variables are used in PCA to estimate the correlation matrix and determine the principal components (PC). The bioclimatic variables were grouped into two sets, with the first one containing bioclimatic variables related to aridity (AMT, TS, MaxTWM, MeanTDQ, MeanTWQ, AP, PS, PDM, PDQ, and PWQ). The second set included AMT; MaxT; AP; constructed indices (HITmean, HITmax, and DI); and ELEV. AMT and AP were included in both sets, because they are considered the main variables for indices related to aridity. The biplot graphs were constructed with the factoextra R package version 1.0.7 [63]. In the latter, the vector’s length and the angle’s cosine were used to group the variables into different groups. The Köppen-Geiger climate groups of each collection were also included.
4.6. Population Structure
The stratification of the collection was explored by two methods. The first one was based on the Landscape and Ecological Associations studies (LEA) package [64], with the SNPs coded in numerical form (0, 1, and 2). The smnf function was used to estimate the ancestry coefficients (K) with cross-entropy. This algorithm was executed with 10 replications and a K-value from 1 to 10. The optimal number of K was defined to assign genotypes to subpopulations according to estimates of individual admixture coefficients from the genotypic matrix. Subsequently, we visualized principal components through GAPIT R package version 3.0 [65]. We compared the results of the population stratification in subpopulations with the Köppen-Geiger climate groups using a correspondence analysis (CA), which reveals the close relationships between and within two groups of categorical variables based on data provided in a contingency table.
4.7. Association Analysis
We used 990 landraces of Triticum aestivum genotyped with 26,064 SNP loci and seven variables (AMT, MaxT, AP, PS, HITmead, HITmax, and DI) to run Genome–environment Association (GEA) studies with the Fixed and random model Circulating Probability Unification multiple-locus model “FarmCPU” [66] implemented in the R GAPIT (Genome Association and Prediction Integrated Tool) package version 3.0 [65]. FarmCPU is characterized by iteratively using two models, a linear mixed model (MLM) and a fixed-effects model, to select a set of markers associated with a trait of interest.
The significant SNPs were determined according to the Bonferroni threshold to an alpha of 0.05, with a threshold value of -log10 (0.05/26,064) = 5.72, coupled by the visual interpretation of the Q-Q plots. The Manhattan and Q-Q plots were built with the R CMplot package version 4.0.0 [67].
4.8. Candidate Genes and Their Annotation
The sequence of the significant SNP markers was blasted in the wheat reference genome IWGSC_refseqv1.0 [68] published in the Ensembl Plants database (www.https://plants.ensembl.org/ accessed on 31 July 2022) to identify the candidate genes. For this, the genes found in the overlapping region and within one Mb upstream and downstream of the matched regions were selected as the candidate genes, and their molecular functions were determined. We identified the proteins in the UniProt (https://www.uniprot.org/ accessed on 31 July 2022) and InterPro (https://www.ebi.ac.uk/interpro accessed on 31 July 2022) databases encoded by the candidate genes, the functionality of the sequences, their domains, and classification. Finally, we elaborated a schematic representation of the physical map of bread wheat with the significant SNPs associated with response proteins to water stress and heat stress with the R LinkageMapView package version 2.1.2 [69].
5. Conclusions and Practical Implications
The results suggest that local adaptations have footprints along the 21 wheat chromosomes in multiple genomic regions. We found vital genes that include several critical points on the abiotic stress response mechanisms—highlighting a considerable number of signaling genes mediated by plant hormones, regulatory processes of the cell wall, morphophysiological changes, photosynthesis, flowering, and some response mechanisms to abiotic stress.
We showed that the climatic variables estimated with historical data help capturing the environmental variability that occurred in the collection sites of the landraces. The variables of the maximum temperature, annual precipitation, precipitation seasonality, and heat and drought indices relevantly participated in identifying genes related to the response to water deficit and high temperatures. This confirms its representativeness in determining aridity in some climatic regions.
This study points to 89 genes involved in the adaptation of bread wheat to its native habitats by association with seven specific climatic variables. The results are consistent with the idea that environmental pressure has modeled, through natural selection, the structure of genomic regions in local wheat populations over time.
Our findings constitute a new resource to select accessions carrying alleles linked to specific climatic responses, which can be exploited through genomic prediction tools to select germplasms with genetic potential for adaptation to climate change.
Supplementary Materials
The following are available online at https://www.mdpi.com/article/10.3390/plants11172289/s1: Figure S1: Contributions to the total variations of each component for the evaluated variables in the PCA. Figure S2: Contributions to component principals 1 and 2 for the evaluated variables in the PCA. Table S1: Detection of associated SNPs for seven climatic variables. Table S2: Other genes and proteins identified by Genome–environment Association with seven climatic variables.
Author Contributions
Conceptualization, data curation, formal analysis, investigation, and writing—original draft, A.L.G.-E.; Conceptualization, methodology, project administration, supervision, and writing—review and editing, M.H.R.-V.; Data curation, funding acquisition, and supervision, C.P.S.; Funding acquisition, investigation, methodology, supervision, writing—review and editing, J.B.; Methodology, supervision, writing—review and editing, F.H.T.; and Investigation and writing—review and editing, A.B.-M. All authors have read and agreed to the published version of the manuscript.
Funding
This work was implemented by CIMMYT as part of the Seeds of Discovery (SeeD) Initiative in collaboration with Universidad Autónoma Agraria Antonio Narro (UAAAN), made possible by the generous support of Sustainable Modernization of Traditional Agriculture (MasAgro) Project funded by the Ministry of Agriculture, and Rural Development (SADER) of the Government of Mexico. Any opinions, findings, conclusion, or recommendations expressed in this publication are those of the author(s) and do not necessarily reflect the view of SADER.
Data Availability Statement
The data presented in this study are available on request from the corresponding author.
Acknowledgments
We are grateful to the Consejo Nacional de Ciencia y Tecnología (CONACYT, México) for the scholarship provided to the first author for her doctoral studies.
Conflicts of Interest
The authors declare no conflict of interest.
References
- Chao, S.; Dubcovsky, J.; Dvorak, J.; Luo, M.-C.; Baenziger, S.P.; Matnyazov, R.; Clark, D.R.; Talbert, L.E.; Anderson, J.A.; Dreisigacker, S.; et al. Population- andGenome-Specific Patterns of Linkage Disequilibriumand SNP Variationin Spring and Winter Wheat (Triticum aestivum L.). BMC Genom. 2010, 11, 727. [Google Scholar] [CrossRef] [PubMed]
- Lopes, M.S.; El-Basyoni, I.; Baenziger, P.S.; Singh, S.; Royo, C.; Ozbek, K.; Aktas, H.; Ozer, E.; Ozdemir, F.; Manickavelu, A.; et al. Exploiting Genetic Diversity from LandracesinWheat Breeding for Adaptation to Climate Change. J. Exp. Bot. 2015, 66, 3477–3486. [Google Scholar] [CrossRef]
- Nazim Ud Dowla, M.A.N.; Edwards, I.; O’Hara, G.; Islam, S.; Ma, W. Developing Wheat for Improved Yield and Adaptation under a Changing Climate: Optimization of a Few Key Genes. Engineering 2018, 4, 514–522. [Google Scholar] [CrossRef]
- Challinor, A.J.; Watson, J.; Lobell, D.B.; Howden, S.M.; Smith, D.R.; Chhetri, N. A Meta-Analysis of Crop Yield under Climate Change and Adaptation. Nat. Clim. Change 2014, 4, 287–291. [Google Scholar] [CrossRef]
- Corrado, G.; Rao, R. Towards the Genomic Basis of Local Adaptation in Landraces. Diversity 2017, 9, 51. [Google Scholar] [CrossRef]
- Sansaloni, C.; Franco, J.; Santos, B.; Percival-Alwyn, L.; Singh, S.; Petroli, C.; Campos, J.; Dreher, K.; Payne, T.; Marshall, D.; et al. Diversity Analysis of 80,000 Wheat Accessions Reveals Consequences and Opportunities of Selection Footprints. Nat. Commun. 2020, 11, 4572. [Google Scholar] [CrossRef] [PubMed]
- Contreras-Moreira, B.; Serrano-Notivoli, R.; Mohammed, N.E.; Cantalapiedra, C.P.; Beguería, S.; Casas, A.M.; Igartua, E. Genetic Association with High-Resolution Climate Data Reveals Selection Footprints in the Genomes of Barley Landraces across the Iberian Peninsula. Mol. Ecol. 2019, 28, 1994–2012. [Google Scholar] [CrossRef] [PubMed]
- Pavlidis, P.; Jensen, J.D.; Stephan, W. Searching for Footprints of Positive Selection in Whole-Genome SNP Data from Nonequilibrium Populations. Genetics 2010, 185, 907–922. [Google Scholar] [CrossRef] [PubMed]
- Tang, Y.; Liu, X.; Wang, J.; Li, M.; Wang, Q.; Tian, F.; Su, Z.; Pan, Y.; Liu, D.; Lipka, A.E.; et al. GAPIT Version2: An Enhanced Integrated Tool for Genomic Association and Prediction. Plant Genome 2016, 9. [Google Scholar] [CrossRef]
- López-Hernández, F.; Cortés, A.J. Last-Generation Genome–Environment Associations Reveal the Genetic Basis of Heat Tolerancein Common Bean (Phaseolus vulgaris L.). Front. Genet. 2019, 10, 954. [Google Scholar] [CrossRef] [Green Version]
- Hancock, A.M.; Brachi, B.; Faure, N.; Horton, M.W.; Jarymowycz, L.B.; Sperone, F.G.; Toomajian, C.; Roux, F.; Bergelson, J. Adaptation to Climate across the Arabidopsis thaliana Genome. Science 2011, 334, 83–86. [Google Scholar] [CrossRef] [PubMed]
- Jones, F.C.; Grabherr, M.G.; Chan, Y.F.; Russell, P.; Mauceli, E.; Johnson, J.; Swofford, R.; Pirun, M.; Zody, M.C.; White, S.; et al. The Genomic Basis of Adaptive Evolution in Threespine Sticklebacks. Nature 2012, 484, 55–61. [Google Scholar] [CrossRef] [PubMed]
- Turner, T.L.; Bourne, E.C.; VonWettberg, E.J.; Hu, T.T.; Nuzhdin, S.V. Population Resequencing Reveals Local Adaptation of Arabidopsis lyrate to Serpentine Soils. Nat. Genet. 2010, 42, 260–263. [Google Scholar] [CrossRef] [PubMed]
- Yoder, J.B.; Stanton-Geddes, J.; Zhou, P.; Briskine, R.; Young, N.D.; Tiffin, P. Genomic Signature of Adaptation to Climate in Medicago Truncatula. Genetics 2014, 196, 1263–1275. [Google Scholar] [CrossRef]
- Lasky, J.R.; Upadhyaya, H.D.; Ramu, P.; Deshpande, S.; Hash, C.T.; Bonnette, J.; Juenger, T.E.; Hyma, K.; Acharya, C.; Mitchell, S.E.; et al. Genome-Environment Associations in Sorghum Landraces Predict Adaptive Traits. Sci. Adv. 2015, 1, e1400218. [Google Scholar] [CrossRef]
- Romero-Navarro, J.A.; Willcox, M.; Burgueño, J.; Romay, C.; Swarts, K.; Trachsel, S.; Preciado, E.; Terron, A.; Delgado, H.V.; Vidal, V.; et al. A Study of Allelic Diversity Underlying Flowering-Time Adaptation in Maize Landraces. Nat. Genet. 2017, 49, 476–480. [Google Scholar] [CrossRef]
- Cortés, A.J.; Blair, M.W. Genotyping by Sequencing and Genome–Environment Associations in Wild Common Bean Predict Widespread Divergent Adaptation to Drought. Front. Plant Sci. 2018, 9, 128. [Google Scholar] [CrossRef]
- Lei, L.; Poets, A.M.; Liu, C.; Wyant, S.R.; Hoffman, P.J.; Carter, C.K.; Shaw, B.G.; Li, X.; Muehlbauer, G.J.; Katagiri, F.; et al. Environmental Association Identifies Candidates for Tolerance to Low Temperature and Drought. G3 Genes Genomes Genet. 2019, 9, 3423–3438. [Google Scholar] [CrossRef]
- Li, Y.; Li, D.; Jiao, Y.; Schnable, J.C.; Li, Y.; Li, H.; Chen, H.; Hong, H.; Zhang, T.; Liu, B.; et al. Identification of Loci Controlling Adaptation in Chinese Soya Bean Landraces via a Combination of Conventional and Bioclimatic GWAS. Plant Biotechnol. J. 2020, 18, 389–401. [Google Scholar] [CrossRef]
- Rodriguez, M.; Scintu, A.; Posadinu, C.M.; Xu, Y.; Nguyen, C.V.; Sun, H.; Bitocchi, E.; Bellucci, E.; Papa, R.; Fei, Z.; et al. GWASBasedon RNA-Seq SNPs and High-Throughput Phenotyping Combined with Climatic Data Highlights the Reservoir of Valuable Genetic Diversity in Regional Tomato Landraces. Genes 2020, 11, 1387. [Google Scholar] [CrossRef]
- Sokolkova, A.; Bulyntsev, S.V.; Chang, P.L.; Carrasquilla-Garcia, N.; Igolkina, A.A.; Noujdina, N.V.; von Wettberg, E.; Vishnyakova, M.A.; Cook, D.R.; Nuzhdin, S.V.; et al. Genomic Analysis of Vavilov’s Historic Chickpea Landraces Reveals Footprintsof Environmental and Human Selection. Int. J. Mol. Sci. 2020, 21, 3952. [Google Scholar] [CrossRef]
- Li, Y.; Cao, K.; Li, N.; Zhu, G.; Fang, W.; Chen, C.; Wang, X.; Guo, J.; Wang, Q.; Ding, T.; et al. Genomic Analyses Provide Insights into Peach Local Adaptation and Responses to Climate Change. Genome Res. 2021, 31, 592–606. [Google Scholar] [CrossRef]
- Hanif, U.; Alipour, H.; Gul, A.; Jing, L.; Darvishzadeh, R.; Amir, R.; Munir, F.; Ilyas, M.K.; Ghafoor, A.; Siddiqui, S.U.; et al. Characterization of the Genetic Basis of Local Adaptation of Wheat Landraces from Iran and Pakistan Using Genome-WideAssociation Study. Plant Genome 2021, 14, e20096. [Google Scholar] [CrossRef] [PubMed]
- Pixley, K.V.; Salinas-Garcia, G.E.; Hall, A.; Kropff, M.; Ortiz, C.; Bouvet, L.C.; Suhalia, A.; Vikram, P.; Singh, S. CIMMYT’s Seeds of Discovery Initiative: Harnessing Biodiversity for Food Security and Sustainable Development. Indian J. Plant Genet. Resour. 2018, 31, 1. [Google Scholar] [CrossRef]
- Vikram, P.; Franco, J.; Burgueño-Ferreira, J.; Li, H.; Sehgal, D.; SaintPierre, C.; Ortiz, C.; Sneller, C.; Tattaris, M.; Guzman, C.; et al. Unlocking the Genetic Diversity of Creole Wheats. Sci. Rep. 2016, 6, 23092. [Google Scholar] [CrossRef] [PubMed]
- Vangelis, H.; Tigkas, D.; Tsakiris, G. The Effect of PET Method on Reconnaissance Drought Index (RDI) Calculation. J. Arid Environ. 2013, 88, 130–140. [Google Scholar] [CrossRef]
- O’Donnell, M.S.; Ignizio, D.A. Bioclimatic Predictors for Supporting Ecological Applications in the Conterminous United States; Data Series; U.S. Geological Survey; U.S. Department of the Interior: Washington, DC, USA, 2012.
- Noce, S.; Caporaso, L.; Santini, M. A New Global Dataset of Bioclimatic Indicators. Sci. Data 2020, 7, 398. [Google Scholar] [CrossRef]
- Cortés, A.J.; Monserrate, F.A.; Ramírez-Villegas, J.; Madriñán, S.; Blair, M.W. Drought Tolerance in Wild Plant Populations: The Case of Common Beans (Phaseolus vulgaris L.). PLoS ONE 2013, 8, e62898. [Google Scholar] [CrossRef]
- Van der Schrier, G.; Jones, P.D.; Briffa, K.R. The Sensitivity of the PDSI to the Thornthwaite and Penman-Monteith Parameterizations for Potential Evapotranspiration. J. Geophys. Res. 2011, 116, D03106. [Google Scholar] [CrossRef]
- Salehnia, N.; Alizadeh, A.; Sanaeinejad, H.; Bannayan, M.; Zarrin, A.; Hoogenboom, G. Estimation of Meteorological Drought Indices Based on AgMERRA Precipitation Data and Station-Observed Precipitation Data. J. Arid Land 2017, 9, 797–809. [Google Scholar] [CrossRef] [Green Version]
- Khatun, K.; Debnath, S.; Robin, A.H.K.; Wai, A.H.; Nath, U.K.; Lee, D.-J.; Kim, C.-K.; Chung, M.-Y. Genome-Wide Identification, Genomic Organization, and Expression Profiling of the CONSTANS-like (COL) Gene Family in Petunia under Multiple Stresses. BMC Genom. 2021, 22, 727. [Google Scholar] [CrossRef] [PubMed]
- Qin, W.; Yu, Y.; Jin, Y.; Wang, X.; Liu, J.; Xi, J.; Li, Z.; Li, H.; Zhao, G.; Hu, W.; et al. Genome-Wide Analysis Elucidates the Role of CONSTANS-like Genes in Stress Responses of Cotton. Int. J. Mol. Sci. 2018, 19, 2658. [Google Scholar] [CrossRef] [PubMed]
- Wong, A.C.S.; Hecht, V.F.G.; Picard, K.; Diwadkar, P.; Laurie, R.E.; Wen, J.; Mysore, K.; Macknight, R.C.; Weller, J.L. Isolation and Functional Analysis of CONSTANS-LIKE Genes Suggests That a Central Role for CONSTANS in Flowering Time Control Is Not Evolutionarily Conserved in Medicago Truncatula. Front. Plant Sci. 2014, 5, 486. [Google Scholar] [CrossRef] [PubMed]
- Battaglia, M.; Covarrubias, A.A. Late Embryogenesis Abundant (LEA) Proteins in Legumes. Front. Plant Sci. 2013, 4, 190. [Google Scholar] [CrossRef]
- Liu, H.; Xing, M.; Yang, W.; Mu, X.; Wang, X.; Lu, F.; Wang, Y.; Zhang, L. Genome-Wide Identification of and Functional Insights into the Late Embryogenesis Abundant (LEA) Gene Family in Bread Wheat (Triticum aestivum). Sci. Rep. 2019, 9, 13375. [Google Scholar] [CrossRef]
- Mertens, J.; Aliyu, H.; Cowan, D.A. LEA Proteins and the Evolution of the WHy Domain. Appl. Environ. Microbiol. 2018, 84, e00539-18. [Google Scholar] [CrossRef]
- Hu, C.; Lin, S.; Chi, W.; Charng, Y. Recent Gene Duplication and Subfunctionalization Produced a Mitochondrial GrpE, the Nucleotide Exchange Factor of the Hsp70 Complex, Specialized in Thermotolerance to Chronic Heat Stressin Arabidopsis. Plant Physiol. 2012, 158, 747–758. [Google Scholar] [CrossRef]
- Su, P.-H.; Lin, H.-Y.; Lai, Y.-H. Two Arabidopsis Chloroplast GrpE Homologues Exhibit Distinct Biological Activities and Can Form Homo- and Hetero-Oligomers. Front. Plant Sci. 2020, 10, 1719. [Google Scholar] [CrossRef]
- ElHabti, A.; Fleury, D.; Jewell, N.; Garnett, T.; Tricker, P.J. Tolerance of Combined Drought and Heat Stress Is Associated with ranspiration Maintenance and Water Soluble Carbohydrates in Wheat Grains. Front. PlantSci. 2020, 11, 568693. [Google Scholar] [CrossRef]
- Qaseem, M.F.; Qureshi, R.; Muqaddasi, Q.H.; Shaheen, H.; Kousar, R.; Röder, M.S. Genome-Wide Association Mapping in Bread Wheat Subjected to Independentand Combined High Temperature and Drought Stress. PLoS ONE 2018, 13, e0199121. [Google Scholar] [CrossRef] [Green Version]
- Verma, V.; Ravindran, P.; Kumar, P.P. Plant Hormone-Mediated Regulation of Stress Responses. BMC Plant Biol. 2016, 16, 86. [Google Scholar] [CrossRef] [PubMed]
- Miura, K.; Tada, Y. Regulation of Water, Salinity, and Cold Stress Responses by Salicylic Acid. Front. Plant Sci. 2014, 5, 4. [Google Scholar] [CrossRef] [PubMed]
- Sabagh, A.E.; Mbarki, S.; Hossain, A.; Iqbal, M.A.; Islam, M.S.; Raza, A.; Llanes, A.; Reginato, M.; Rahman, M.A.; Mahboob, W.; et al. Potential Role of Plant Growth Regulators in Administering Crucial Processes against Abiotic Stresses. Front. Agron. 2021, 3, 648694. [Google Scholar] [CrossRef]
- Li, N.; Euring, D.; Cha, J.Y.; Lin, Z.; Lu, M.; Huang, L.-J.; Kim, W.Y. Plant Hormone-Mediated Regulation of Heat Tolerance in Response to Global Climate Change. Front. PlantSci. 2021, 11, 627969. [Google Scholar] [CrossRef] [PubMed]
- Binder, B.M. Ethylene Signaling in Plants. J. Biol. Chem. 2020, 295, 7710–7725. [Google Scholar] [CrossRef]
- Müller, M. Foesor Friends: ABA and Ethylene Interactionunder Abiotic Stress. Plants 2021, 10, 448. [Google Scholar] [CrossRef]
- Khan, M.I.R.; Fatma, M.; Per, T.S.; Anjum, N.A.; Khan, N.A. Salicylic Acid-Induced Abiotic Stress Tolerance and Underlying Mechanisms in Plants. Front. Plant Sci. 2015, 6, 462. [Google Scholar] [CrossRef]
- Wani, S.H.; Kumar, V.; Shriram, V.; Sah, S.K. Phytohormones and Their Metabolic Engineering for Abiotic Stress Tolerance in Crop Plants. Crop J. 2016, 4, 162–176. [Google Scholar] [CrossRef]
- Qiu, Z.; Guo, J.; Zhu, A.; Zhang, L.; Zhang, M. Exogenous Jasmonic Acid Can Enhance Tolerance of Wheat Seedlings to Salt Stress. Ecotoxicol. Environ. Saf. 2014, 104, 202–208. [Google Scholar] [CrossRef]
- Su, Y.; Huang, Y.; Dong, X.; Wang, R.; Tang, M.; Cai, J.; Chen, J.; Zhang, X.; Nie, G. Exogenous Methyl Jasmonate Improves Heat Tolerance of Perennial Ryegrass through Alteration of Osmotic Adjustment, Antioxidant Defense, and Expression of Jasmonic Acid-Responsive Genes. Front. Plant Sci. 2021, 12, 664519. [Google Scholar] [CrossRef]
- Sharma, M.; Laxmi, A. Jasmonates: Emerging Players in Controlling Temperature Stress Tolerance. Front. Plant Sci. 2016, 6, 1129. [Google Scholar] [CrossRef] [PubMed]
- Lamaoui, M.; Jemo, M.; Datla, R.; Bekkaoui, F. Heat and Drought Stresses in Crops and Approaches for Their Mitigation. Front. Chem. 2018, 6, 26. [Google Scholar] [CrossRef] [PubMed]
- R Core Team. R: A Language and Environment for Statistical Computing; R Foundation for Statistical Computing: Vienna, Austria, 2017. [Google Scholar]
- QGIS Development Team. QGIS Las Palmas. Open Source Geospatial Foundation Project; QGIS: Austin, TX, USA, 2017. [Google Scholar]
- Balfourier, F.; Bouchet, S.; Robert, S.; DeOliveira, R.; Rimbert, H.; Kitt, J.; Choulet, F.; IWGSC; Breed Wheat, C.; Paux, E. Worldwide Phylogeography and History of Wheat Genetic Diversity. Sci. Adv. 2019, 11, eaav0536. [Google Scholar] [CrossRef] [PubMed]
- Hijmans, R.J. Raster: Geographic Data Analysis and Modeling; R Package Version: Vienna, Austria, 2022. [Google Scholar]
- Fick, S.E.; Hijmans, R.J. World Clim2: New1-km Spatial Resolution Climate Surfaces for Global Land Areas. Int. J. Climatol. 2017, 37, 4302–4315. [Google Scholar] [CrossRef]
- Chelsey, B.; Wheeler, N.R.; Rubel, F.; French, R.H. Kgc: Koeppen-Geiger Climatic Zones; R Package Version: Vienna, Austria, 2017. [Google Scholar]
- Kottek, M.; Grieser, J.; Beck, C.; Rudolf, B.; Rubel, F. World Map of the Köppen-Geiger Climate Classification Updated. Meteorol. Z. 2006, 15, 259–263. [Google Scholar] [CrossRef]
- Thornthwaite, C.W. An Approach toward a Rational Classification of Climate. Geogr. Rev. 1948, 38, 55. [Google Scholar] [CrossRef]
- Beguería, S.; Vicente-Serrano, S.M. SPEI: Calculation of the Standardised Precipitation—Evapotranspiration Index; R Core Team: Indianapolis, IN, USA, 2017. [Google Scholar]
- Alboukadel, K.; Mundt, F. Factoextra: Extract and Visualize the Results of Multivariate Data Analyses; R Package Version: Vienna, Austria, 2020. [Google Scholar]
- Frichot, E.; François, O. LEA: An R Package for Landscape and Ecological Association Studies. Methods Ecol. Evol. 2015, 6, 925–929. [Google Scholar] [CrossRef]
- Wang, J.; Zhang, Z. GAPIT Version3: Boosting Power and Accuracy for Genomic Association and Prediction. Genom. Proteom. Bioinform. 2021, 19, 629–640. [Google Scholar] [CrossRef]
- Liu, X.; Huang, M.; Fan, B.; Buckler, E.S.; Zhang, Z. Iterative Usage of Fixed and Random Effect Models for Powerful and Efficient Genome-Wide Association Studies. PLoS Genet. 2016, 12, e1005767. [Google Scholar] [CrossRef]
- LiLin, Y. CMplot: Circle Manhattan Plot; R Package Version: Vienna, Austria, 2022. [Google Scholar]
- IWGSC The International Wheat Genome Sequencing Consortium. Shifting the limits in wheat research and breeding using a fully annotated reference genome. Science 2018, 361, eaar7191. [Google Scholar] [CrossRef] [Green Version]
- Ouellette, L.A.; Reid, R.W.; Blanchard, S.G.; Brouwer, C.R. Linkage Map View-Rendering High-Resolution Linkage andQ TL Maps. Bionformatics 2018, 34, 306–307. [Google Scholar] [CrossRef] [PubMed] [Green Version]
Publisher’s Note: MDPI stays neutral with regard to jurisdictional claims in published maps and institutional affiliations. |
© 2022 by the authors. Licensee MDPI, Basel, Switzerland. This article is an open access article distributed under the terms and conditions of the Creative Commons Attribution (CC BY) license (https://creativecommons.org/licenses/by/4.0/).