3.1. The PI3K Inhibitor LY294002 Can Block Epicardial EMT
One pathway implicated in regulating epithelial junctional integrity is the PI3K/Akt signaling pathway [
19,
20,
24] and this pathway can be modified by cell-surface integrins [
19,
25,
26]. It is also known that inhibition of PI3K/Akt signaling represses epicardial EMT in mice [
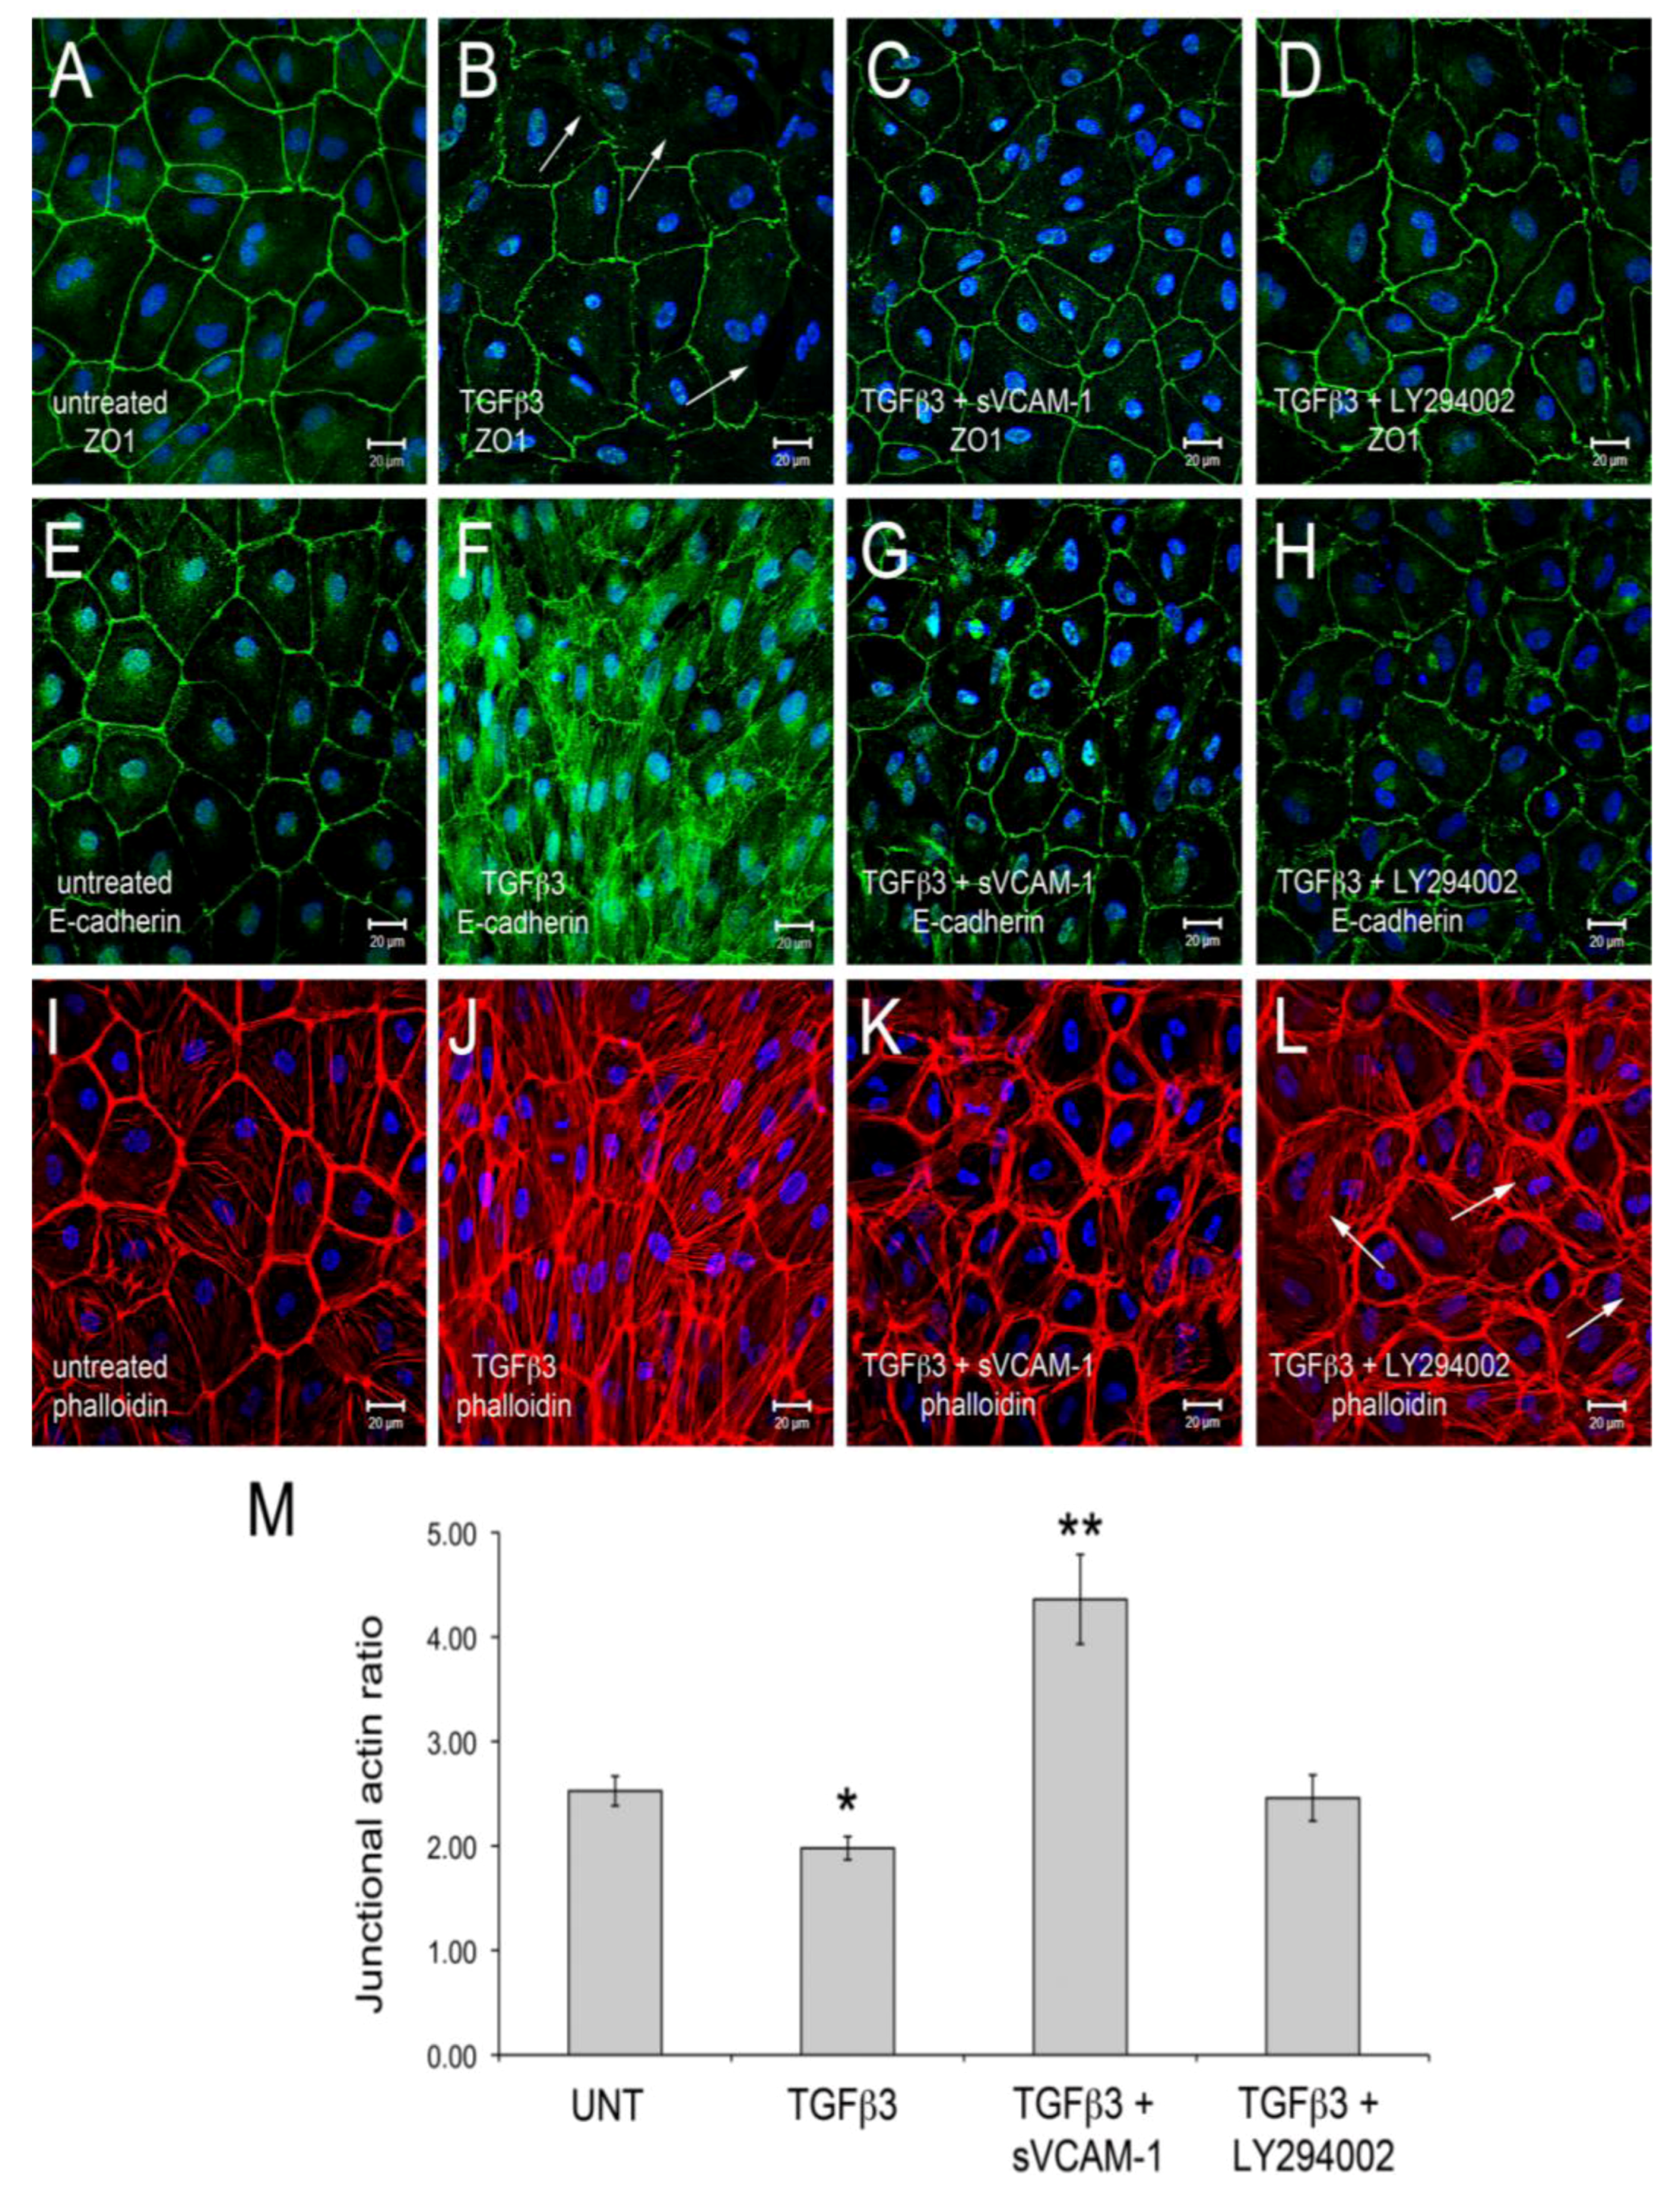
22]. We therefore tested if the PI3K inhibitor LY294002 can modulate junctional complexes and actin polymerization in EMCs similar to what we have observed with sVCAM-1. HH24 Chick embryonic EMCs were cultured in serum free medium and treated for 24 h with TGFβ3, TGFβ3 and sVCAM-1 or TGFβ3 and LY294002. Cells were fixed and stained for the tight junction protein zona occludins-1 (ZO1), the adherens junction protein E-Cadherin or f-actin with Texas-Red-X phalloidin (
Figure 1). Here, we observed that TGFβ3 altered ZO1 (
Figure 1B) and E-Cadherin localization in intercellular junctions (
Figure 1F) and caused cytoskeletal changes in these cells (
Figure 1J). sVCAM-1 limited these changes during an identical treatment period (
Figure 1C, G) and increased circumferential actin belts at the expense of stress fibers (
Figure 1K). LY294002 effectively inhibited changes to junctional complexes (
Figure 1D, H) and increased circumferential actin belts but stress fibers were still present (
Figure 1L).
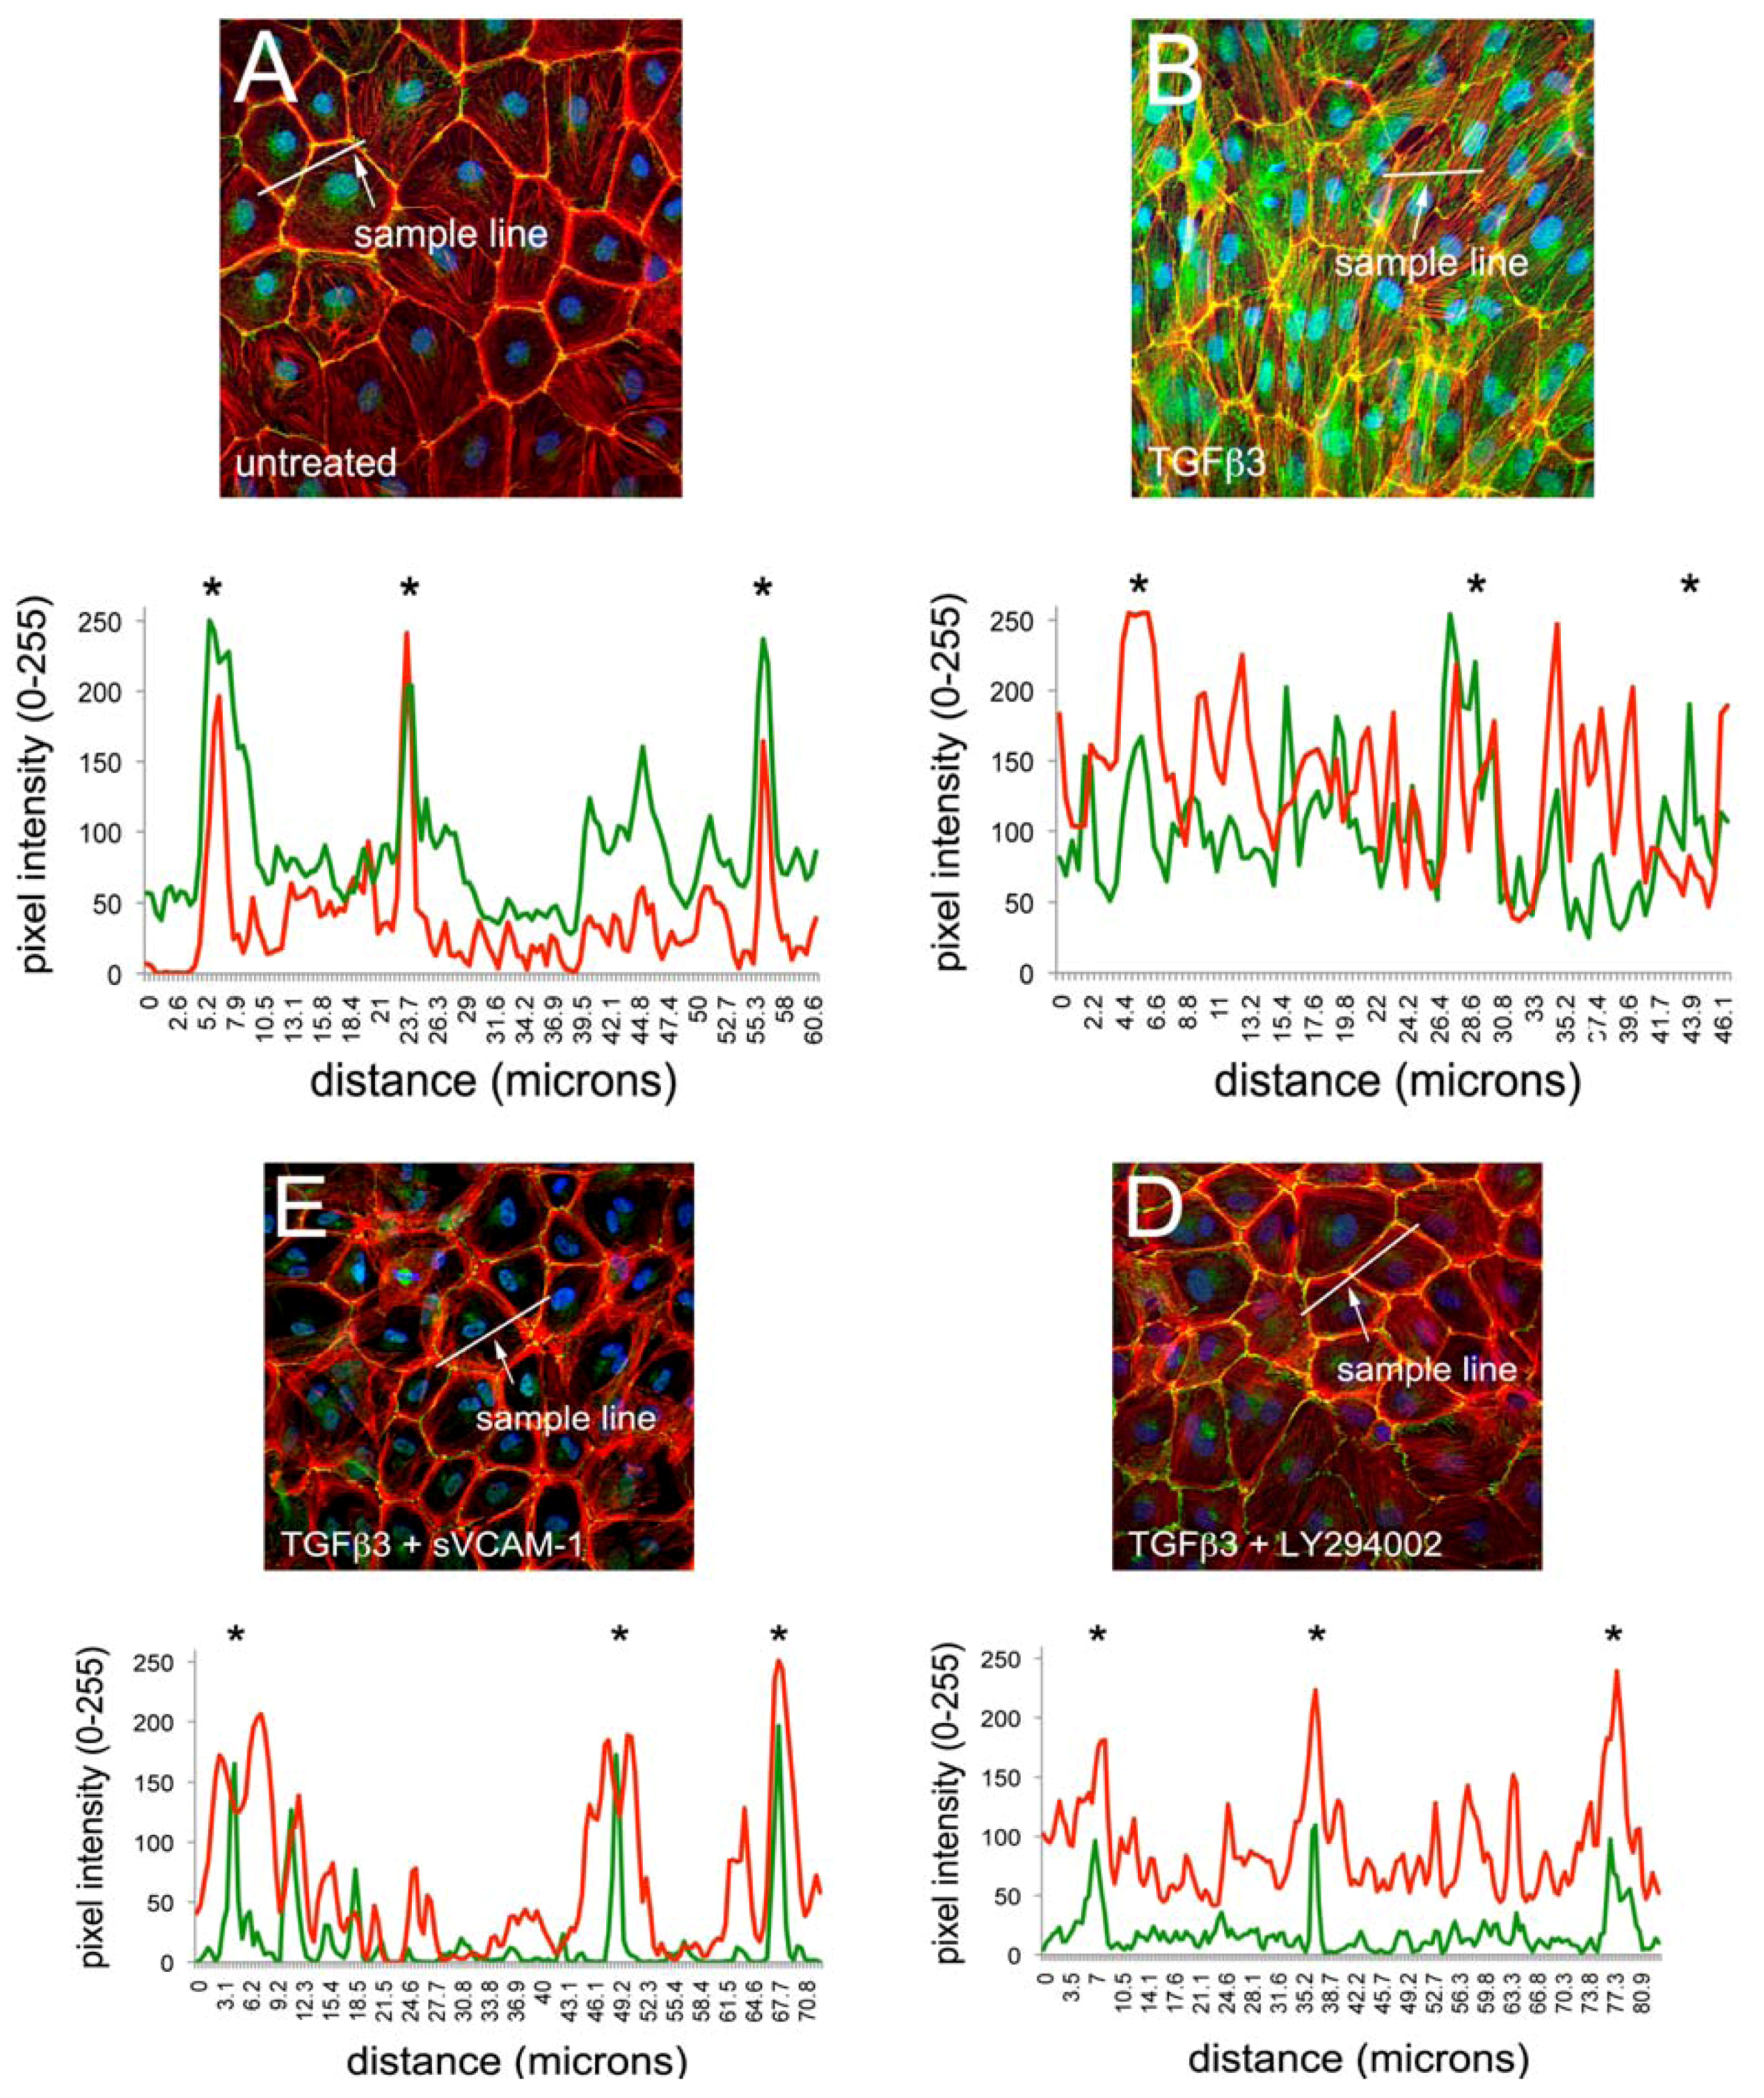
To quantify changes to f-actin we measured pixel intensity using ImageJ (see methods). Lines of pixels spanning three junctions were sampled for pixel intensity. The mean ratio of the pixel intensity for phalloidin staining was determined at junctions and in-between junctions. The ratio of junctional to cytosolic pixel intensity was calculated and is shown in
Figure 1M (see Methods and
Figure S1). We observed that the mean junctional actin ratio in untreated EMCs was 2.53, reflecting a combination of stress fibers and circumferential actin belts in these cells. In TGFβ3 treated cultures, the mean junctional actin ratio was 1.98, reflecting an increase in stress fibers and a decrease in circumferential actin belts. In TGFβ3 + sVCAM-1 cultures, the mean junctional actin ratio was 4.36 reflecting a decrease in stress fibers and an increase in circumferential actin belts. This observation supported the idea that, in the presence of TGFβ3, sVCAM-1 alters pathways that affect both stress fibers and circumferential actin belts. In TGFβ3 + LY294002 cultures, the mean junctional actin ratio was 2.46, statistically identical to the untreated cultures. This supported the idea that, in the presence of TGFβ3, LY294002 alters pathways that primarily affect circumferential actin belts.
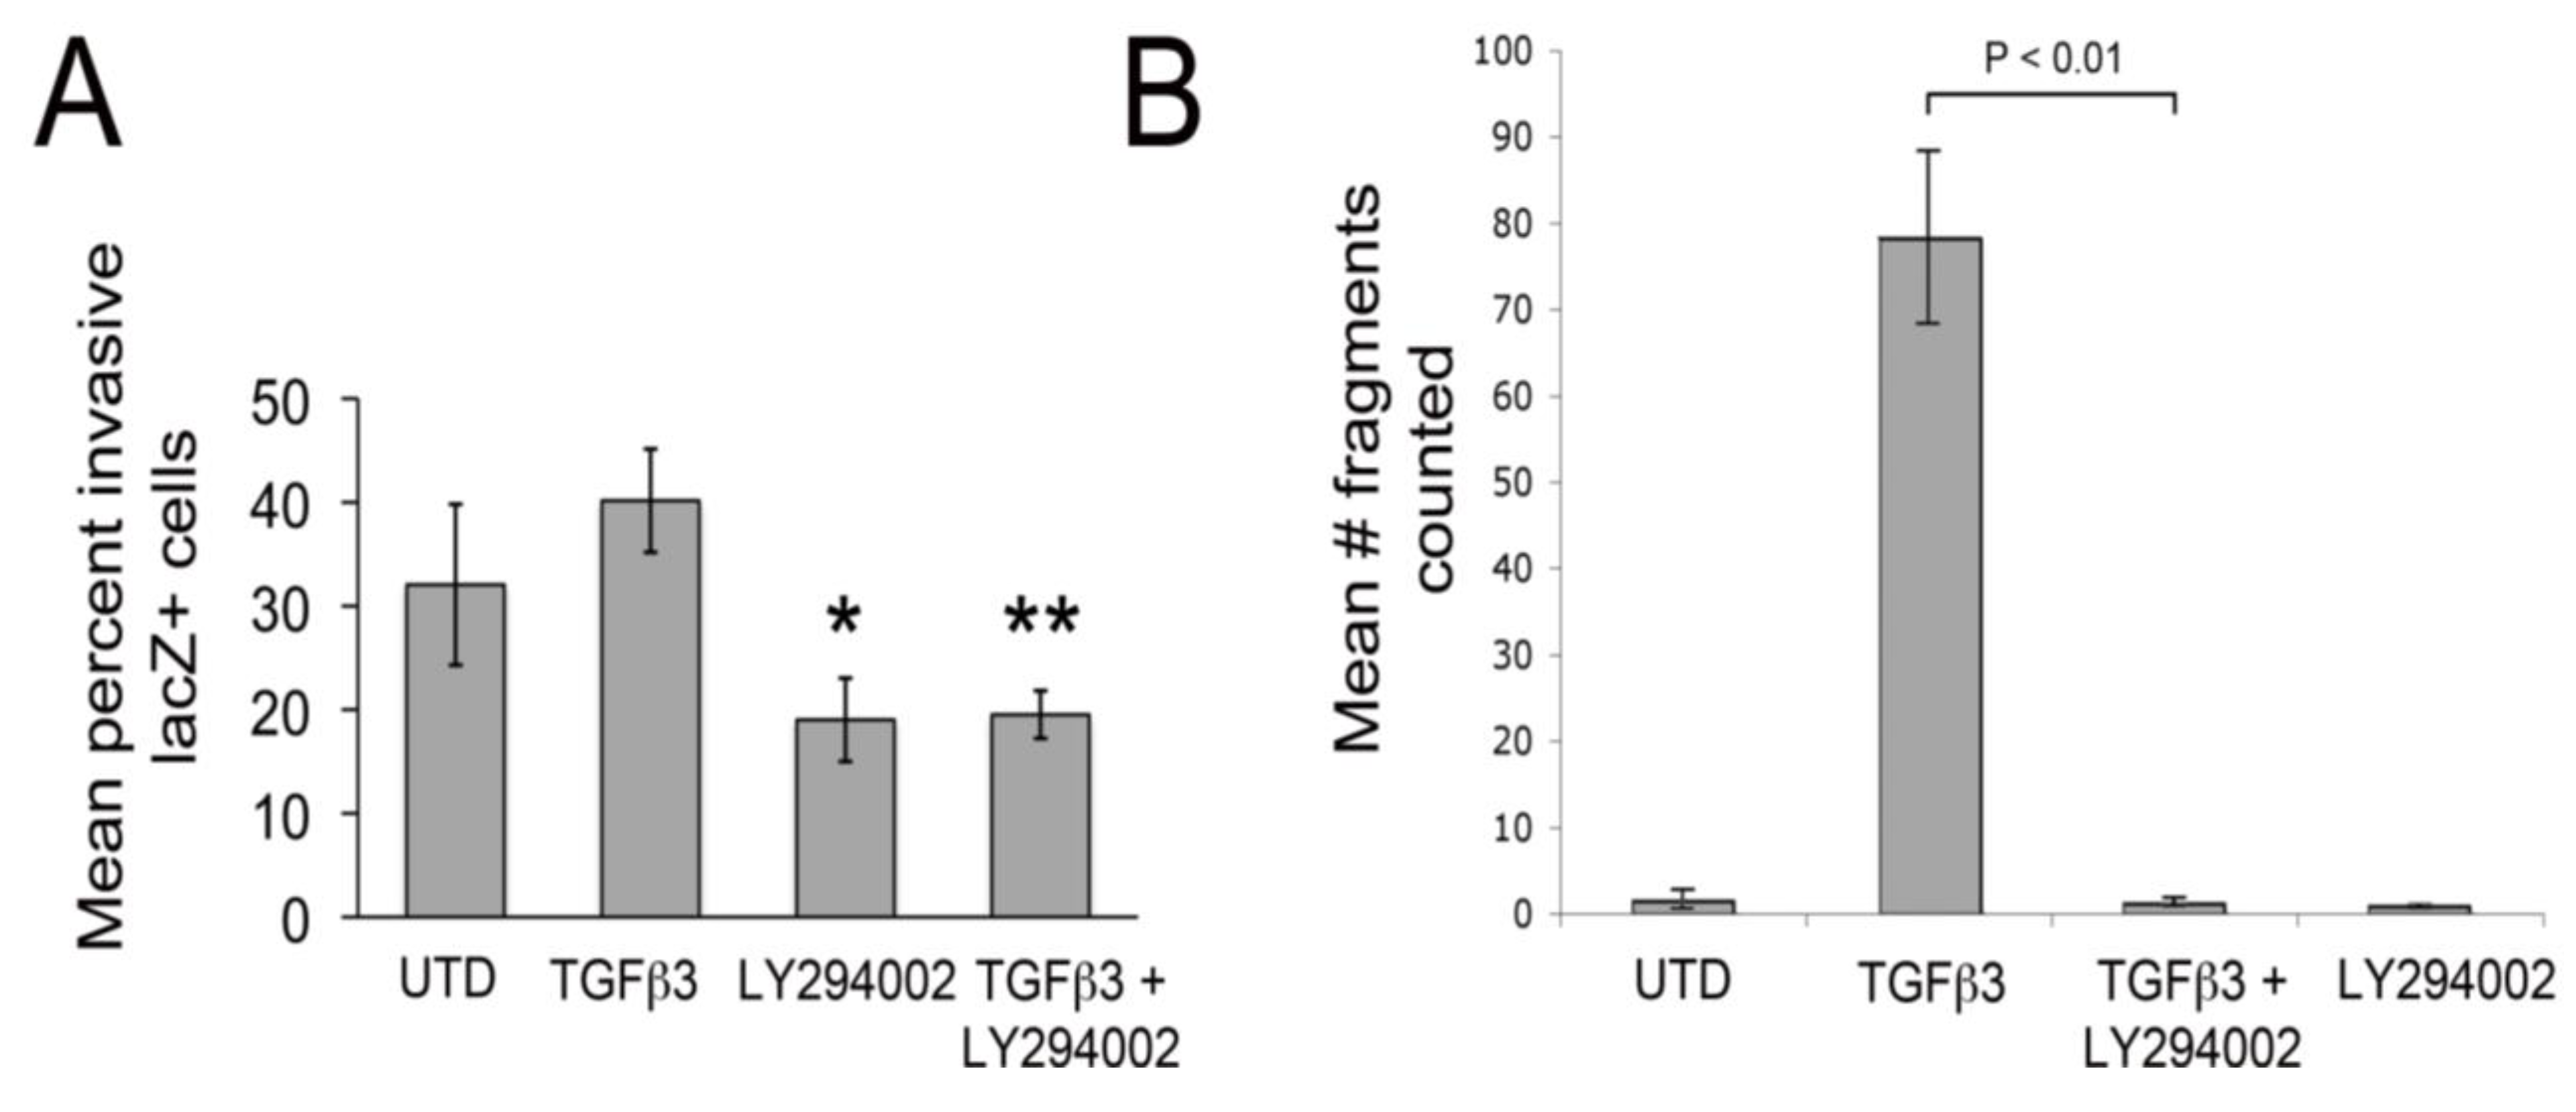
Since LY29002 appeared to protect junctional complexes in cultured chick EMCs treated with TGFβ3, we tested if LY29002 could inhibit epicardial EMT using an organ culture system. Here, embryonic hearts (HH27) were excised, infected with an adenovirus, which expresses a gene encoding nuclear targeted β-galactosidase. When hearts are infected in this manner, epicardium is infected but not underlying myocardial cells [
11,
12]. Hearts were washed with serum free medium and TGFβ3, LY294002 (or a combination) were added to the culture medium and hearts were cultured for 48 h. In these embryonic hearts, LY294002 significantly attenuated EMT, as detected by a decrease in TGFβ3-induced cellular invasion into the myocardium (
Figure 2A). LY294002 also significantly decreased baseline invasion by about 1.7-fold. Together, these observations indicate that PI3K/Akt signaling plays an important role in facilitating epicardial EMT. To measure the strength of intercellular junctions we carried out dispase II assays [
37] on rat epicardial mesothelial cell rEMCs) [
12,
32,
33,
34,
35]. In this assay, monolayers are “lifted” from culture dishes (using Dispase II) without altering intercellular adhesion. Then, monolayers are agitated by shaking. If junctional contacts are weak, the monolayers fall apart and if they are strong, monolayers stay intact. Here, we found that TGFβ3 dramatically weakened intercellular junctions and this was almost completely inhibited by simultaneous treatment with LY294002 (
Figure 2B). In a previous study, we made an identical observation using the dispase II assay in rEMCs treated with TGFβ3 and sVCAM-1 [
12].
Figure 1.
Activation of PI3K plays a role in TGFβ3 mediated cEMC shape changes and epicardial to mesenchymal transformation (EMT). (A-L) Confocal images of chicken embryonic EMCs cultured from HH24 hearts and left untreated (A, E, I), treated with TGFβ3 (B, F, J), TGFβ3 + sVCAM-1 (C, G, K) or TGFβ3 + LY294002 (D, H, L). Cells were fixed and stained for ZO1 (A-D), E-cadherin (E-H) or f-actin (I-L). All cells were stained with DAPI (blue) to identify nuclei. Arrows in (B) point to example regions where tight junctions have been degraded. Arrows in (L) point to example regions where stress fibers are readily apparent. Magnification bars are 20 µm. (M) Quantification of fluorescent pixel intensity across three junctions as described in the methods. Bar graph indicates the ratio of pixel intensity at junctions to pixel intensity between junctions. Error bars represent SEM with N = 6 for each treatment group.
Figure 2.
LY29004 inhibits epicardial EMT and weakening of junctional strength by TGFβ3. (A) Quantification of invasion of AdnlacZ infected surface cells in cultured HH27 chick hearts. Bars indicate percent of total cells counted that were in subepicardium or myocardium. * P < 0.05 for TGFβ3 (1 ng/ml) compared with LY294002 (10 µM) and ** P < 0.05 for TGFβ3 (1 ng/mL) + LY294002 (10 µM). Statistical significance was determined using ANOVA followed by a Newman-Keuls post-test. Error bars represent SEM with N = 4 for UTD, TGFβ3, LY294002 and N = 5 for TGFβ3 + LY294002. (B) Monolayer fragmentation after dispase II treatment of rEMC monolayers shown in bar graph format. Error bars represent SEM with N = 3 for each bar. Statistical significance was calculated using one-way ANOVA followed by a Tukey-Kramer Multiple Comparison Test.
3.2. sVCAM-1 Modifies PTEN Phosphatase Localization and Activity
Since sVCAM-1 and LY294002 protected circumferential actin belts and inhibited epicardial EMT in the presence of TGFβ3, we reasoned that, like LY294002, sVCAM-1 may activate pathways in EMCs that counteract PI3K/Akt. One pathway that does this involves the dual specificity (lipid and protein) phosphatase PTEN. We therefore tested if PTEN could be altered by sVCAM-1 in rEMCs. PTEN is sequestered in the cytoplasm in a stable but catalytically inactive form [
38,
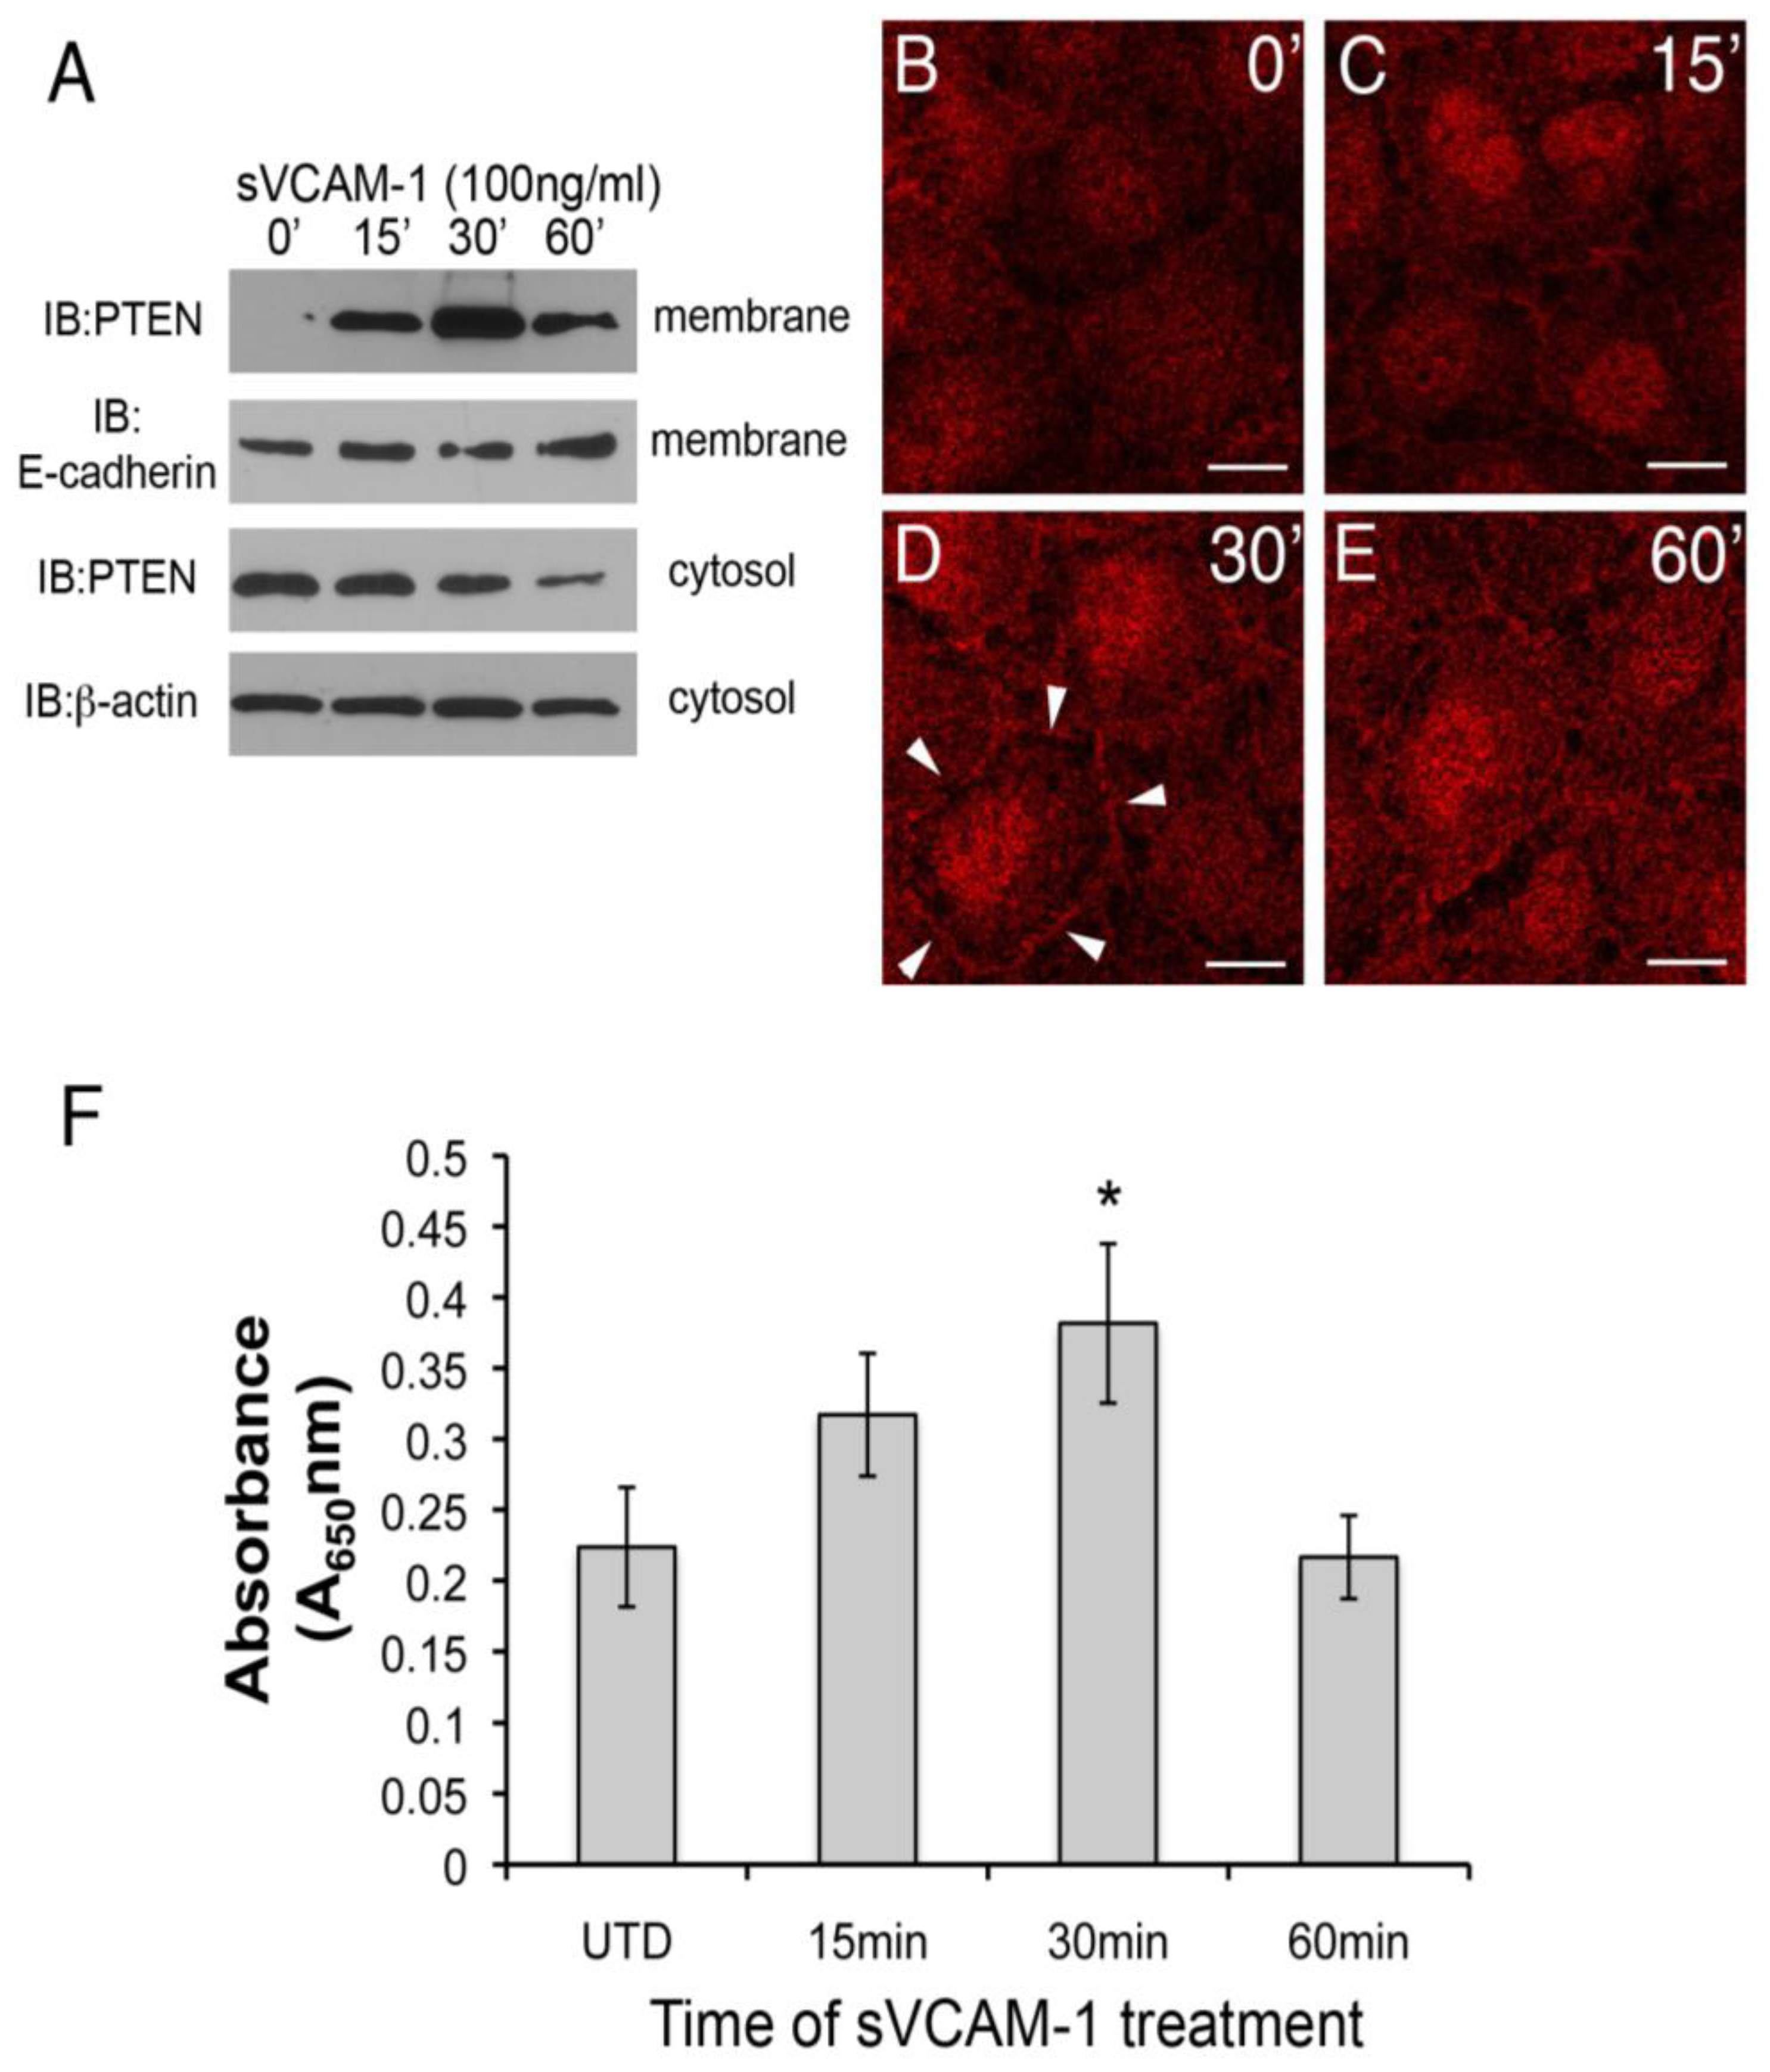
39]. When activated, it moves to the membrane and nucleus where its substrates exist. We therefore investigated if sVCAM-1 treatment of serum-starved rEMCs could alter the sub-cellular localization of PTEN using cell-fractionation. Here, we observed that PTEN could be detected in the membrane fraction of rEMCs 15 min after treatment with sVCAM-1. This accumulation was transient. After peaking at 30 min, PTEN was less abundant in the membrane band at 60 min (
Figure 3A). In an independent experiment, we treated serum-starved rEMCs with sVCAM-1 and analyzed the cytosolic fractions for PTEN (
Figure 3A, lower two blots). Here, we observed that PTEN protein was successively reduced in the cytosolic fraction after 1 h. Together these experiments suggest that sVCAM-1 activates signaling pathways that alter the sub-cellular localization of PTEN consistent with its activation. To further test this, we treated serum-starved rEMCs with sVCAM-1 for various times and fixed and stained them for PTEN (
Figure 3B-E). Here, we observed general cytoplasmic staining in untreated cells (
Figure 3B). After 15 min, staining was discernible in intercellular junctions and in nuclei (
Figure 3C). The intensity of this localization was greatest at 30 min and then was reduced after 60 min correlating well with our cell fractionation studies. Thus, we conclude that in rEMCs, sVCAM-1 stimulation is sufficient to alter PTEN localization consistent with its activation.
Figure 3.
sVCAM-1 alters PTEN localization and activity in rEMCs. (A) Immunoblot analysis of PTEN accumulation in untreated and sVCAM-1 treated, serum-starved rEMCs. Immunoblots were probed for PTEN, E-cadherin (membrane control) and β-actin (cytosolic control). Time of treatment with sVCAM-1 is indicated above each lane. Representative data is shown from two experiments done in triplicate. (B-E) Confocal images of PTEN localization in serum-starved rEMCs treated with sVCAM-1 for 0, 15, 30 and 60 min. Arrowheads in (D) point to junctional localization of PTEN at the 30 min time point. N = 2 in (B-E). Magnification bars represent 20 µm. (F) Lipid phosphatase activity in serum-starved rEMCs after sVCAM-1 treatment. The Y-axis indicates fold-lipid phosphatase activity relative to untreated, serum-starved rEMCs. The X-axis indicates time of treatment with sVCAM-1. Error bars represent SEM. Statistical significance relative to the 0 min time point (*, P < 0.05) was calculated using ANOVA followed by a Newman-Keuls post-test. N = 8 for all time points.
![Jdb 01 00159 g003]()
To confirm that the activity of PTEN could be altered by sVCAM-1 in rEMCs, we performed lipid phosphatase assays. Cells were serum starved and treated with sVCAM-1 at 15 min intervals up to 1 h. PTEN was immunoprecipitated from total protein and incubated with phospholipid vesicles for various times. Phosphate released from the phospholipid vesicles was measured using the BioMol green reagent and absorbance determined at 650 nm. Here, we found that phospholipids were dephosphorylated in increasing amounts up to 30 min, with a statistically significant value at 30 min (
Figure 3F). The timing of peak lipid phosphatase activity corresponded well with the timing of changes to the subcellular localization of PTEN that we observed. These findings supported our hypothesis that sVCAM-1 can alter PTEN localization and activity in epicardium, and suggested that PTEN plays an important role in epicardial cells.
3.3. Altering PTEN Function Can Change Epicardial EMT in Vitro
Our observations in rEMCs supported a model in which sVCAM-1 regulation of PTEN plays an important role in regulating epicardial EMT. Consistent with this model, activating PTEN should reduce epicardial EMT and loss of PTEN should promote EMT. To test this hypothesis, we created avian RCAS retroviruses that express either an active variant of human PTEN fused to GFP (called A4) [
45] (RCAS
PTENA4-GFP) or express a short hairpin RNA to chick PTEN (RCAS
shPTEN) (
Figure 4A,B). We also generated control viruses that express EGFP (RCAS
EGFP), and that express a shRNA to β-galactosidase (RCAS
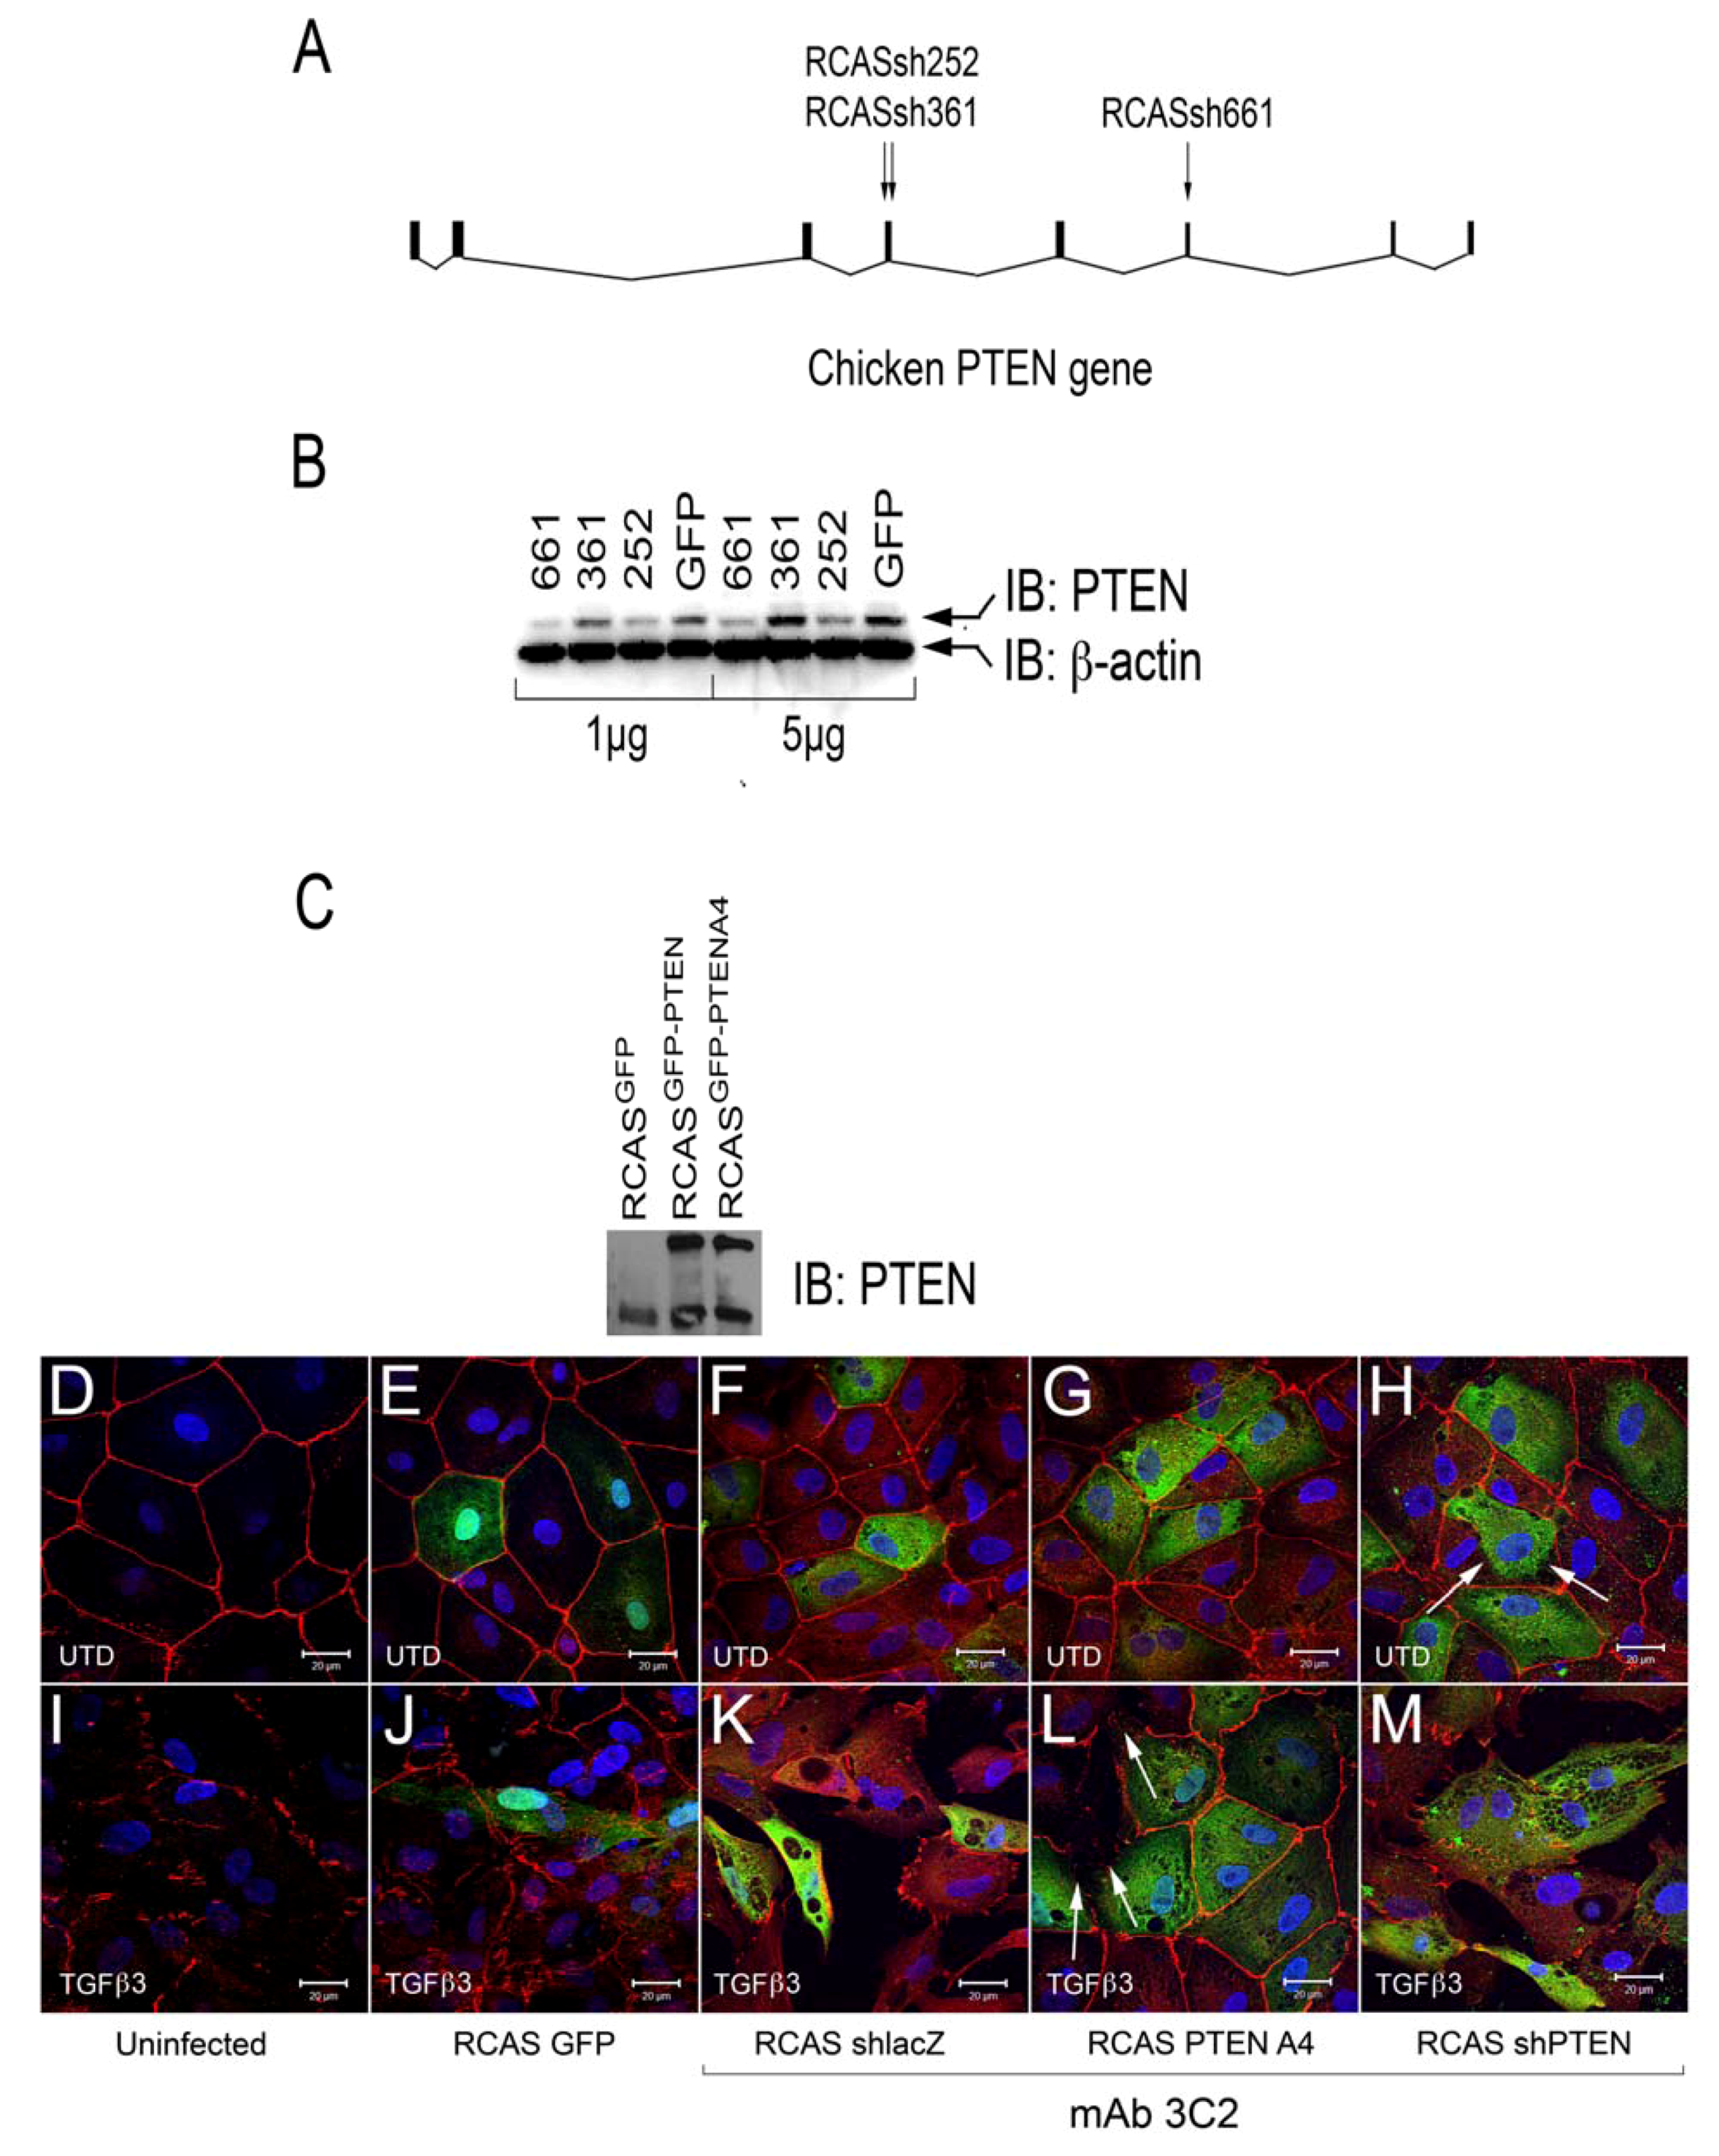
shlacZ). Viruses were tested for their ability to knock down chick PTEN (
Figure 4B) or express PTEN variants (
Figure 4C).
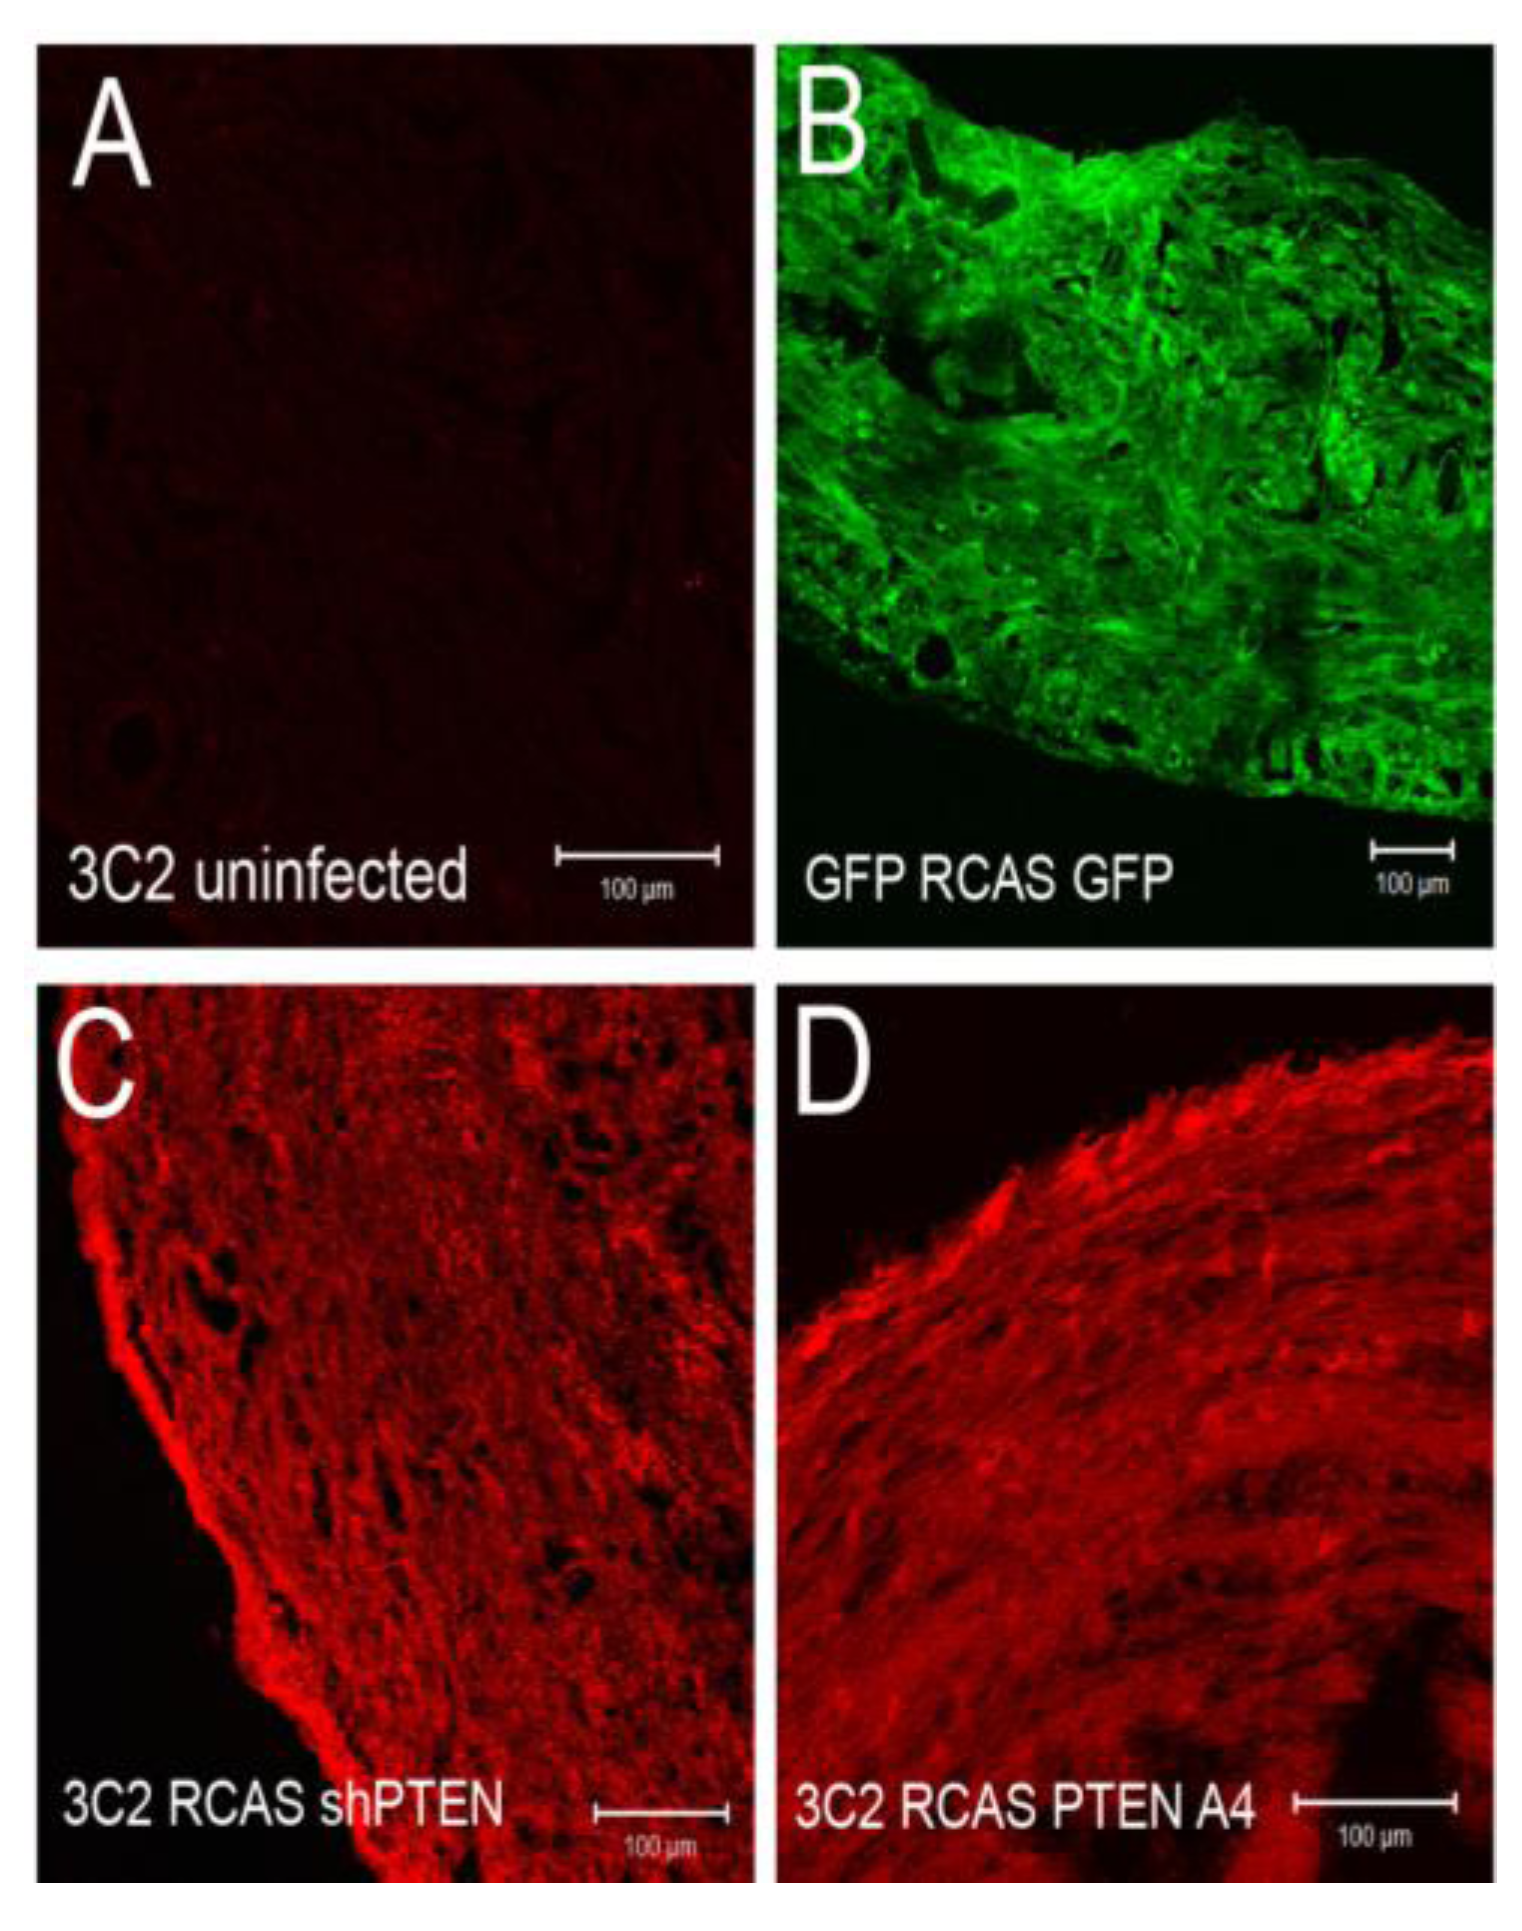
We tested if infection by these viruses altered intercellular junctions either in untreated cells or in EMCs treated with TGFβ3. We infected chick EMCs grown on glass coverslips for 48 h in serum free medium. The medium was replaced with fresh serum free medium or medium containing TGFβ3 (1 ng/mL) and cells were incubated for an additional 24 h. Cells were fixed and stained with anti-ZO1 to label tight junctions and mAb 3C2 (which binds to viral GAG protein) to label RCAS infected cells. Cells were analyzed using confocal microscopy (
Figure 4D-M). Infection by RCAS
GFP (
Figure 4E), RCAS
shlacZ (
Figure 4F), RCAS
PTENA4-GFP (
Figure 4G), and RCAS
shPTEN (
Figure 4H), did not result in widespread disruption of junctional complexes in EMCs. For RCAS
shPTEN infection, only a few infected cells lost contact with their neighbors (
Figure 4H, arrows). This observation suggested that loss-of-function of PTEN is not sufficient to stimulate EMT and that additional stimuli are required. When infected EMCs were treated with TGFβ3, they became loosely organized with degrading junctional complexes (
Figure 4I-K, M). The exception to this was when cells were infected with RCAS
PTENA4-GFP (
Figure 4L). In this case, infected cells maintained their junctions, whereas neighboring uninfected cells had degraded junctions (
Figure 4L, arrows). These observations indicated that loss-of-PTEN by RCAS
shRNA did not robustly induce loss of junctional complexes, but that expression of the active A4 variant was sufficient to interfere with the TGFβ3 dependent pathways that reduce intercellular adhesion during EMT.
Figure 4.
Intercellular junctions in cEMCs are altered in response to changes in PTEN expression. (A) Representation of the structure of the chicken PTEN gene, which contains eight exons and seven introns. We designed three shRNA constucts called sh252, sh361 and sh661 representing the first position of the sequence in the shRNA relative to the sequence in the mRNA. (B) Constructs were tested in chick embryonic fibroblasts for their ability to reduce the PTEN protein product (N = 2). Blot was probed simultaneously with anti-PTEN and anti-beta actin. One or five micrograms of total protein were run for each lane. RCASsh661 reduced PTEN levels by about 80% (renamed RCASshPTEN). (C) Immunoblot of expression of RCASPTENA4-GFP and RCASPTEN-GFP. Bands: intrinsic chick PTEN (lower bands) and GFP-fusion proteins to human PTEN or the PTENA4 variant. RCASGFP infected cells were used as a negative control for the fusion protein. (D-M) Confocal images of chicken embryonic EMCs cultured from HH24 hearts and left untreated (D-H) or treated with TGFβ3 (I-M) for 24 h. Cells are either uninfected (D, I) or infected with RCAS viruses as indicated below each set of panels. Immunofluorescence for ZO-1 is red and nuclear staining with DAPI is blue in every panel. Green fluorescence in (E and J) is EGFP. Green fluorescence in (F-H and K-M) is immunofluorescent staining with mAb 3C2. 3C2 staining resulted in some speckling in these images as retroviruses are present in exocytic vesicles. Arrows in (H and L) point to cells that have disrupted tight junctions. N = 3 in (D-M). Magnification bars represent 20 µm.
![Jdb 01 00159 g004]()
To further investigate if PTEN knockdown was sufficient to induce EMT we performed collagen gel assays. Hearts were infected with RCAS viruses at HH17 (E2.5)
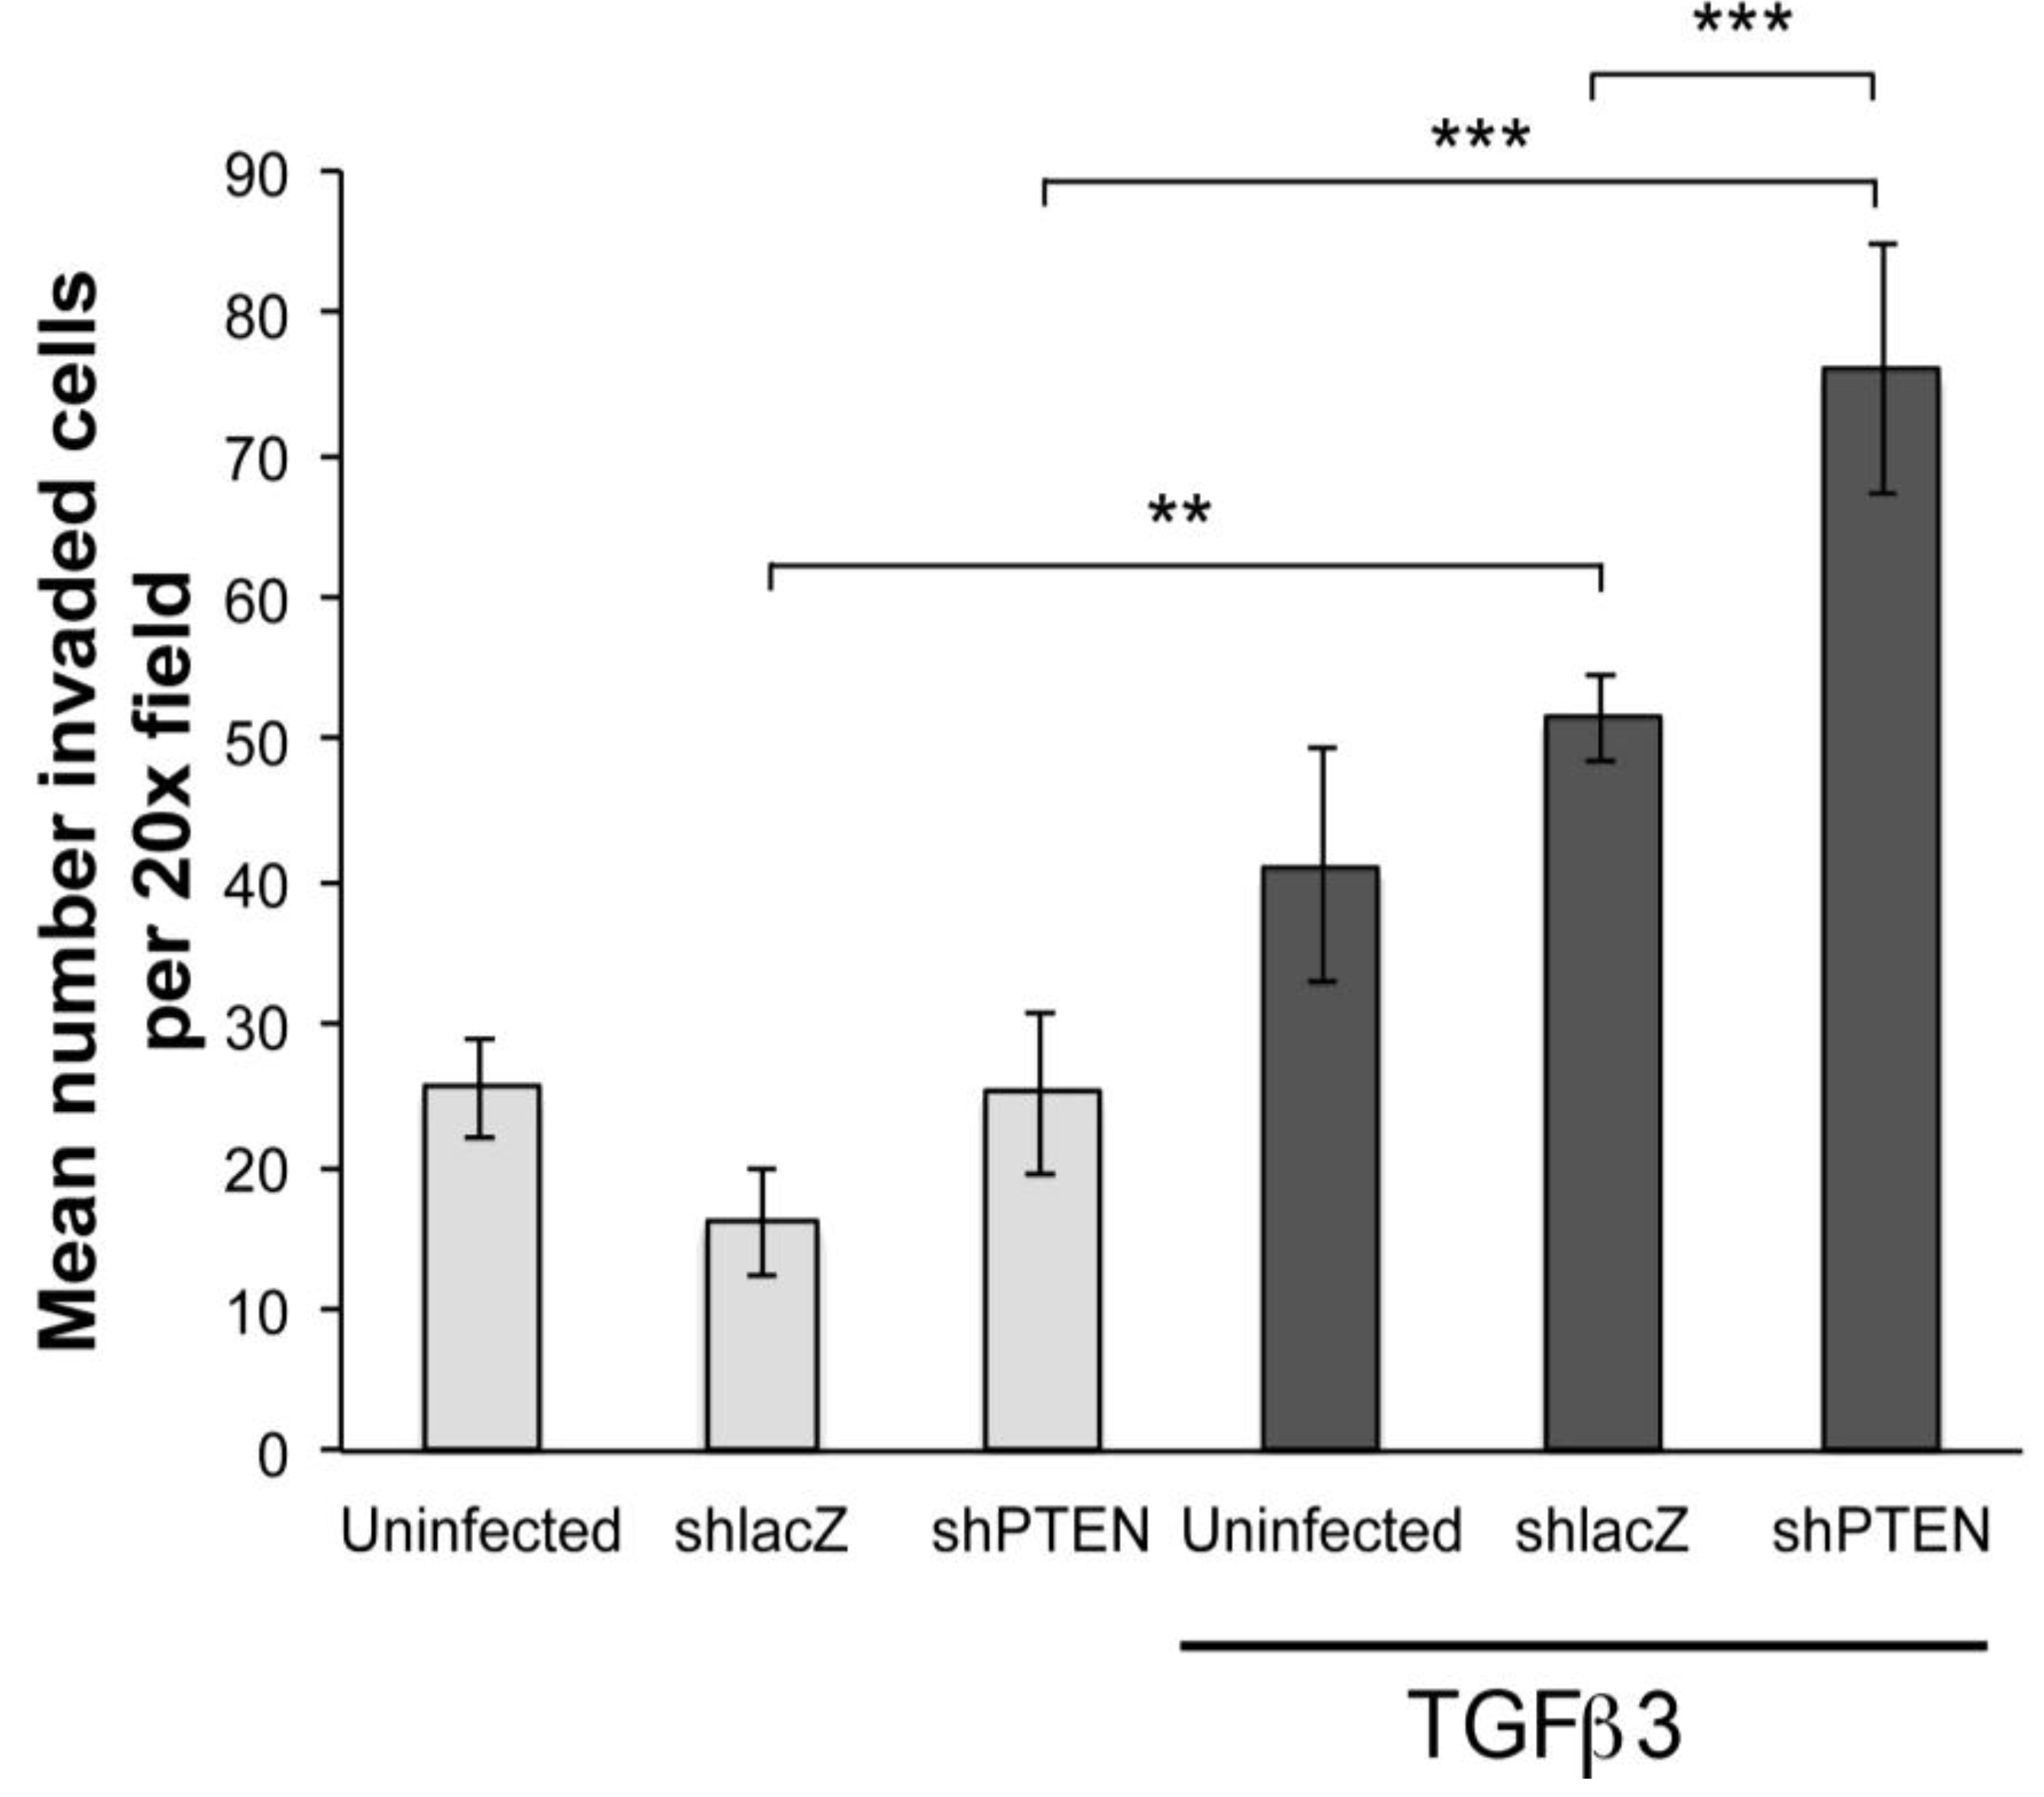
in ovo and embryos allowed to develop until HH24 (E4.5). Hearts were removed, explanted to the surface of drained collagen gels and epicardial cells were allowed to migrate to the surface. After 48 h, some gels were treated with TGFβ3 for 24 h. In this study, we made two observations (
Figure 5). First, in monolayers not treated with TGFβ3, there were no significant differences between uninfected, RCAS
shlacZ infected and RCAS
shPTEN infected cultures (
Figure 5, left three bars). However, in cultures treated with TGFβ3, there were three times as many cells inside the collagen when infected with RCAS
shPTEN as compared with untreated RCAS
shPTEN cultures (
Figure 5, right-most bar). This observation supported the hypothesis that lowering PTEN levels in chick EMCs itself is not sufficient to induce EMT, but that reduced PTEN renders EMCs more susceptible to pro-invasion factors like TGFβ3. RCAS
shPTEN infected TGFβ3 treated cultures seeded about 1.8 times as many cells as uninfected TGFβ3 treated cultures, and about 1.5 times as many RCAS
shlacZ infected and TGFβ3 treated cultures. This indicated that knockdown of PTEN can increase the responsiveness of epicardial cells to EMT-stimulatory molecules such as TGFβ3.
3.4. Altering PTEN Function Changes Coronary Blood Vessel Development
Pro-invasive factors may not be present at physiologic levels in collagen gel assays, but are likely to be present in the developing heart. We therefore tested if infection with our RCAS viruses could alter coronary vascular development in chick embryos. Since RCAS viruses are replication competent, they spread throughout the infected embryo. So, infection of the heart is likely to be significant during the course of our experiment. This is what we observed in HH38 hearts using the mAb 3C2 (
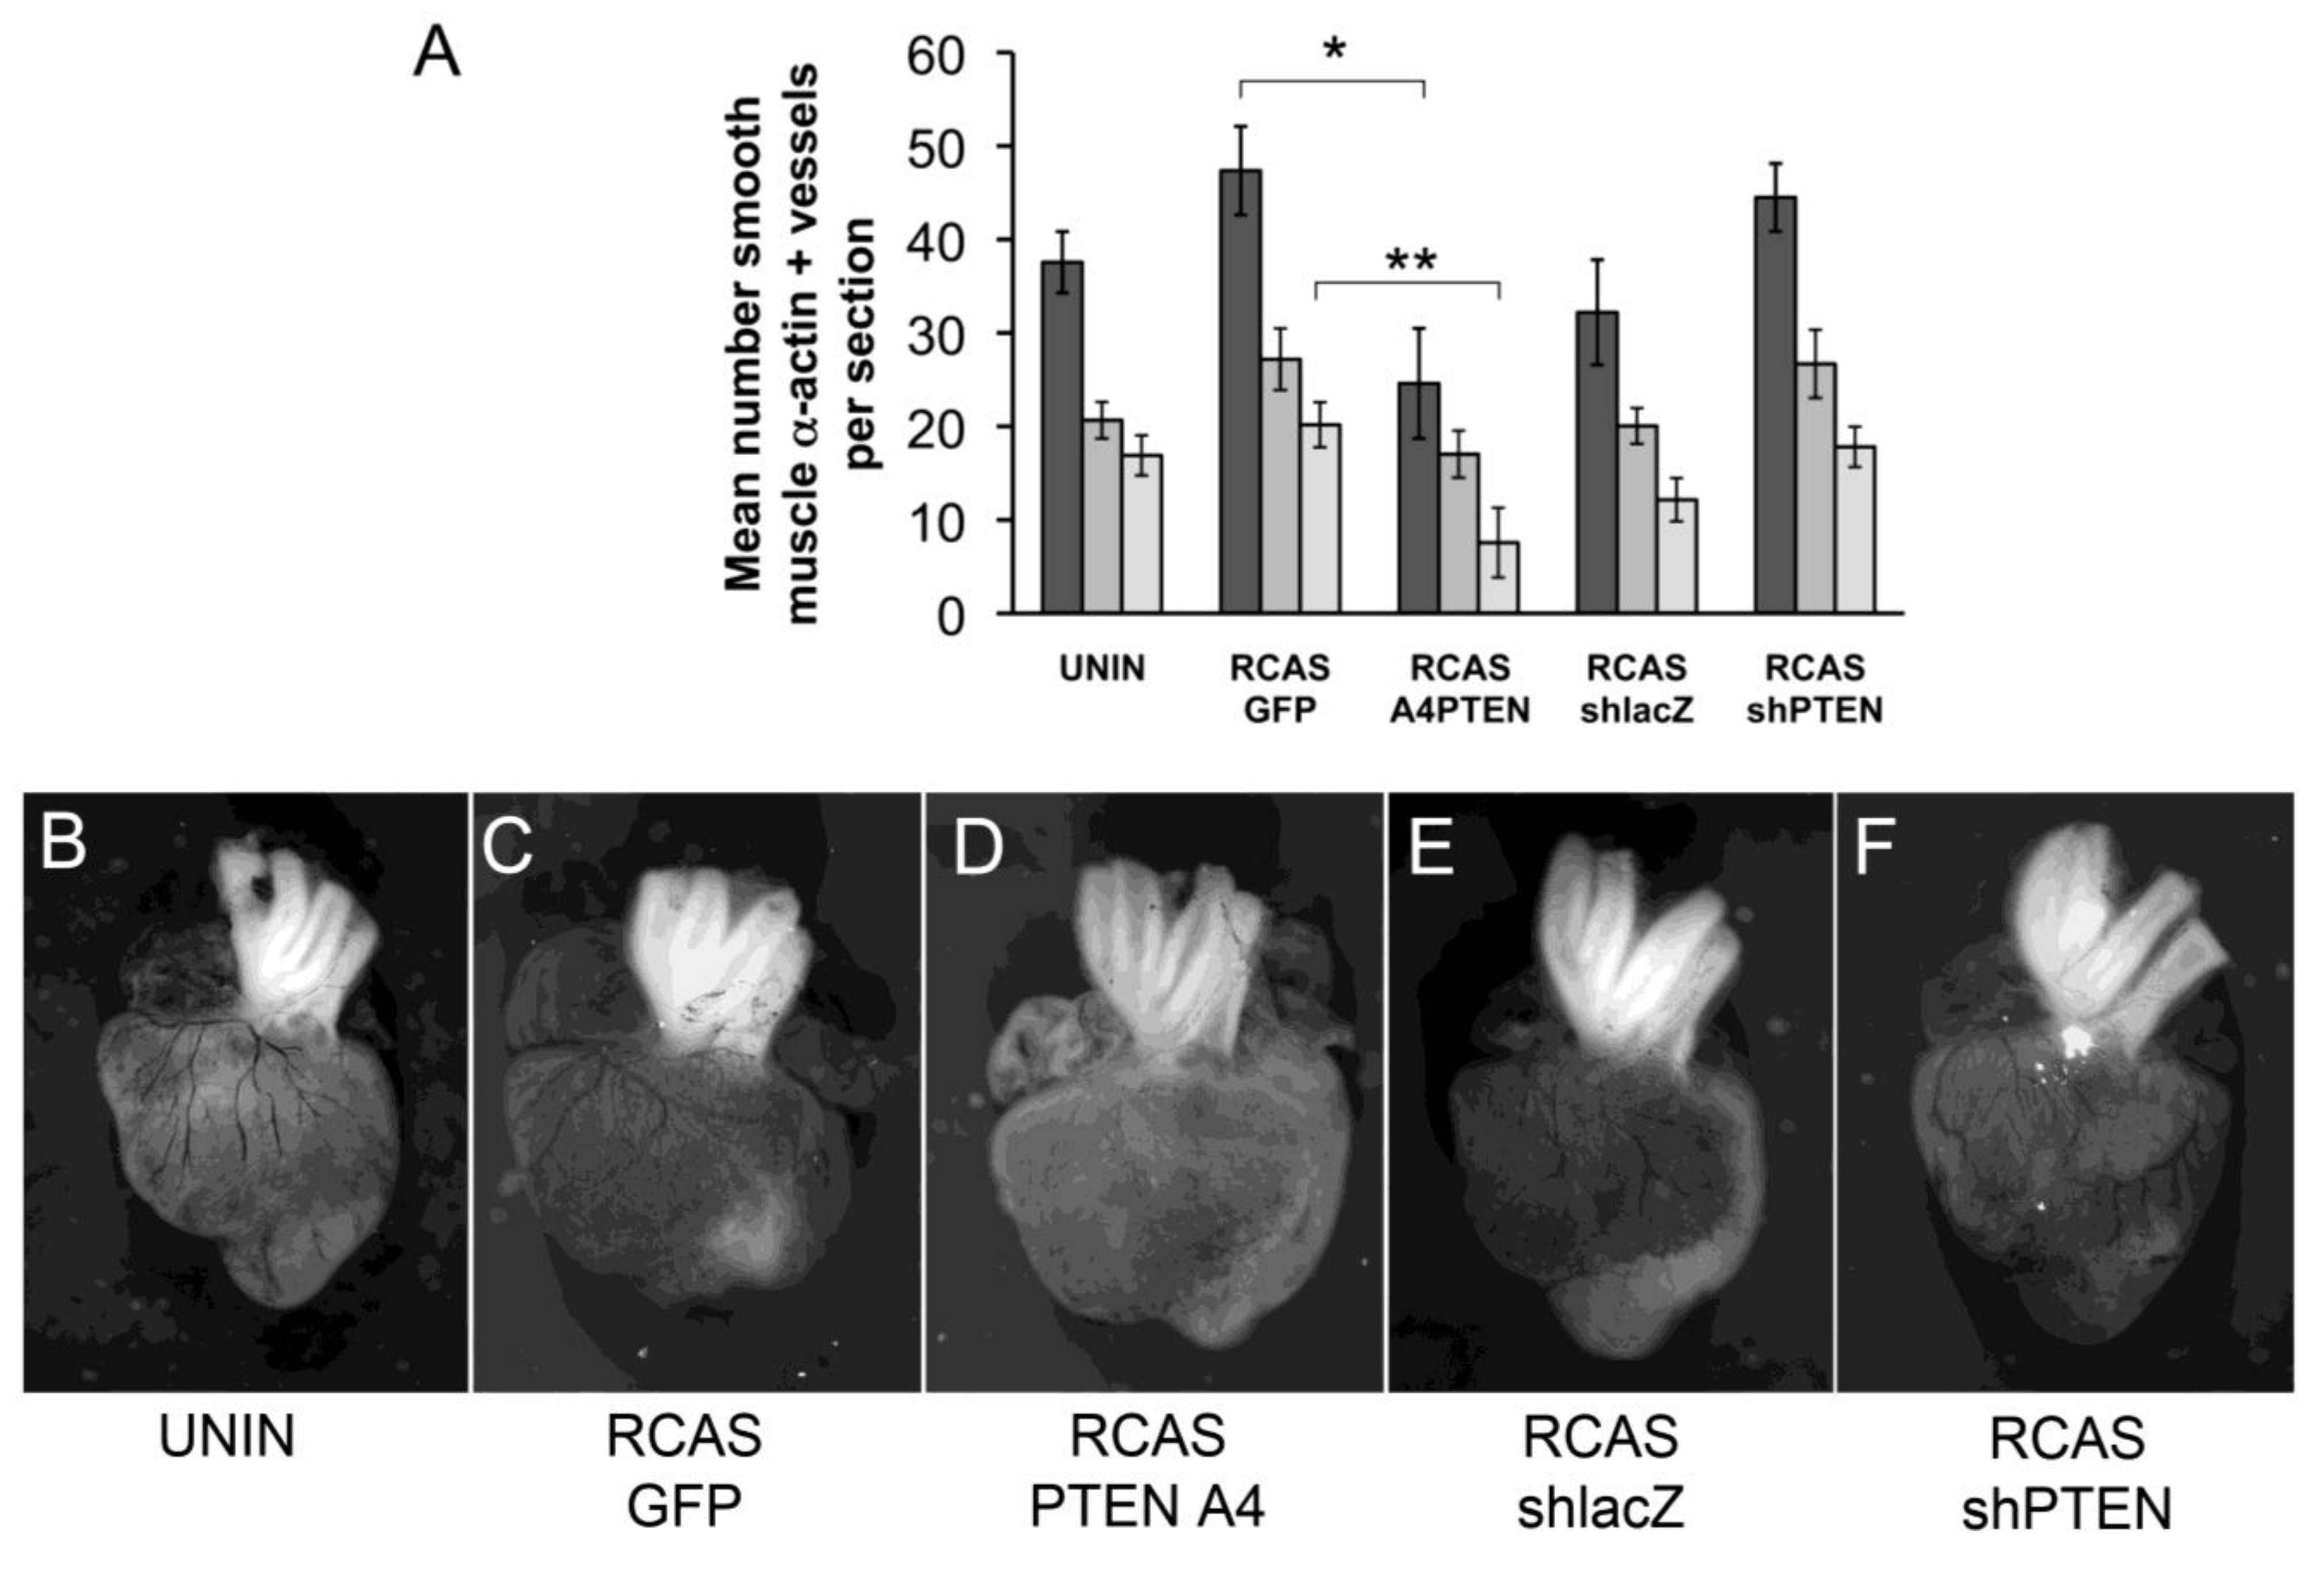
Figure S2). We injected virus into the pericardial space of HH17 embryos and allowed embryos to develop to HH38. Embryos were removed from eggs and a mixture of dilute India ink and saline was injected into the left ventricle to label coronary vessels. Hearts were sectioned and stained with anti-smooth muscle α-actin. Vessels were quantified in sections (see methods).
Figure 5.
PTEN knockdown increases sensitivity of cEMCs to TGFβ3. Bar graph representing collagen gel invasion assay of cEMCs infected with RCAS viruses. Hearts were uninfected or infected with RCASshlacZ or RCASshPTEN in ovo at HH17 and explanted to the collagen gel at HH24. Lighter bars represent untreated and darker bars represent cultures treated with TGFβ3 (1 ng/mL) as indicated below the X-axis. The Y-axis represents the mean number of cells inside the collagen gel per 20x field. A minimum of four fields was counted for each sample. Statistical significance (** P < 0.01, *** P < 0.001) was calculated using ANOVA followed by a Newman-Keuls post test. Sample sizes are as follows: N = 14 for UTD; N = 15 for TGFβ3; N = 6 for RCASshlacZ; N = 6 for RCASshlacZ + TGFβ3; N = 9 for RCASshPTEN; N = 9 for RCASshPTEN + TGFβ3. Error bars are SEM.
We initially observed that infection with RCAS viruses had varying effects on coronary vessel development. Although the differences between control RCAS viruses (RCAS
GFP and RCAS
shlacZ) were not statistically significant, the trend was either to increase muscularized vessels (RCAS
GFP) or decrease vessels (RCAS
shlacZ). Here, RCAS
GFP and RCAS
PTENA4-GFP expressed recombinant proteins and RCAS
shlacZ and RCAS
shPTEN expressed short hairpin RNAs, so the responses we observed might be due to the expression of gene products from each virus. Thus, the use of uninfected hearts as a control may not accurately reflect the effects of the experimental virus. By comparing infection of RCAS
GFP to RCAS
PTENA4-GFP, the effect of expression of PTENA4-GFP was to reduce the total number of muscularized coronary arteries by almost two-fold (from 47.4 per section to 24.6 per section) (
Figure 6A,C,D). We wondered if there was a difference in the proportion of vessels in the subepicardial region of the lateral ventricles versus the interventricular septal region when comparing hearts infected with RCAS
GFP and RCAS
PTENA4-GFP. Here, we observed that the mean number of vessels in the subepicardium was less in RCAS
PTENA4-GFP infected hearts than in RCAS
GFP controls (from 27.1 to 17) (
Figure 6A). Similarly, the number of interventricular septum (IVS) vessels was reduced from 20.2 per section to 7.6 per section. However, the proportion of vessels increased in the lateral ventricles in RCAS
PTENA4-GFP infected hearts by approximately 1.7 times. In other words, the vessels that formed in these hearts were about twice as likely to be in the lateral ventricles as in the IVS septum. This observation may reflect a requirement for regulation of PTEN activity during invasive migration such that cells expressing PTENA4-GFP do not migrate as far as they should into the myocardium.
Figure 6.
Changes to coronary arteries in chick hearts infected with RCAS viruses. (A) Bar graph representing the number of coronary arteries in developing chick hearts stained with smooth muscle α-actin. Hearts were uninfected or infected with RCASGFP, RCASPTENA4-GFP, RCASshPTEN or RCASshlacZ in ovo at HH17 and allowed to develop until HH38. The Y-axis represents the mean number of smooth muscle α-actin positive vessels per section counted. Dark grey bars represent the total number of vessels counted. The medium grey bars are the number of vessels in the lateral ventricles. The light grey bars are the number of vessels in the interventricular septum. Statistical significance (*, P < 0.05, **, P < 0.01) was calculated using ANOVA followed by a Newman-Keuls post test. (B-F) Representative India ink injected hearts from this study. Hearts were infected with viruses as indicated below each panel. Sample sizes are as follows: N = 8 for uninfected; N = 9 for RCASGFP; N = 5 for RCASPTENA4-GFP; N = 6 for RCASshlacZ; N = 6 for RCASshPTEN. Error bars are SEM.
![Jdb 01 00159 g006]()
PTEN knockdown by RCAS
shPTEN infection increased the total number of muscularized vessels, as well as subepicardial and IVS vessels (
Figure 6A,E,F). However, this increase was not statistically significant. The ratio of vessels in the lateral ventricles to the IVS remained relatively constant with a ratio of 1.6 in RCAS
shacZ infected hearts and 1.5 in RCAS
shPTEN hearts. Thus, loss of PTEN may increase coronary artery development but does not seem to affect the sites of formation of these vessels.
3.5. What is the Significance of Activated PTEN in Epicardial Cells?
Our data support a role for a VCAM-1/α
4β
1/PTEN pathway in epicardial cells. What is the significance of activated PTEN in PE attachment, directional migration and EMT? Since PTEN catalyzes the dephosphorylation of PIP
3 to PIP
2, it increases the membrane concentration of PIP
2 in the plasma membrane. It should be noted here that dephosphorylation of PIP
3 specifically creates the phosphoinositol (4,5) bisphosphate second messenger, a lipid second messenger that differs from phosphoinositol (3,4) bisphosphate and phosphoinositol (3,5) bisphosphate in its ability to modulate critical events in the cell membrane. One example is that increased PIP
2 promotes localized actin polymerization. PIP
2 is thought to regulate actin polymerization at many levels, including by binding proteins that sever f-actin and proteins that promote actin polymerization, branching and bundling [
40,
41]. Thus, treatment of serum starved EMCs with sVCAM-1 promotes increased circumferential actin belts as we have observed, likely due to increased interaction of PIP
2 with proteins that promote junctional actin polymerization.
A second effect of activated PTEN is the inhibition of the PI3K/AKT signaling pathway. This would have different effects than increasing membrane PIP
2 as the PI3K/AKT pathway alters many downstream events such as cell proliferation, migration and differentiation. Activation of Akt is postulated to impact other pathways already implicated in epicardial development [
24,
42]. For example, Akt is an inhibitor of the Ser/Thr kinase GSK3β, a component of the Wnt/β-catenin destruction complex, which also includes the tumor suppressors Axin and adenomatous polyposis coli (APC), as well as CK1, protein phosphatase 2A (PP2A), and the E3-ubiquitin ligase β-TrCP. In canonical Wnt signaling, the Wnt/β-catenin destruction complex actively traffics cytoplasmic β-catenin to the proteasome, unless it is inhibited via another pathway (reviewed in [
43]). Activated Akt phosphorylates GSK3β at Ser-9, and similarly, targets it to the proteasome, and in this way amplifies the signal produced by Wnt ligands [
44,
45,
46]. Wnt signaling has been implicated in epicardial development in a pathway involving WT1, retinoic acid (RA), fibroblast growth factor and Wnts [
47,
48]. WT1 is expressed in the PE and migrating mesothelium and it participates in the transcriptional activation of the gene encoding retinaldehyde dehydrogenase-2 (RALDH2). RALDH2 catalyzes the conversion of retinaldehyde to RA. RA, through one of its receptors—RxRα, activates expression of epicardial FGFs and Wnts. Conditional loss of epicardial RxRα in the mouse altered epicardial development as well as epicardial expression of FGF2 (basic FGF), β-catenin, and Wnt9b [
48]. Loss of RxRα specifically interfered with Wnt9b expression since the epicardial expression of Wnt2a, Wnt8a, and Wnt8b were not affected [
48]. Interestingly, loss of β-catenin in RxRα conditonal knockout mice was due to increased instability of the protein and this effect was blocked by inhibiting GSK3β. Thus, signals derived from RxRα promote canonical Wnt signaling by antagonizing the β-catenin destruction complex and by activating Wnt9b synthesis. It is not known if Wnt9b activates PI3K, but it is known that Wnt3a can activate PI3K [
49,
50]. Active PTEN in the epicardium therefore could attenuate/balance PI3K/Akt effects downstream of Wnt/β-catenin destruction complex signaling in epicardial mesothelial cells.
A third effect of the VCAM-1/α4β1/PTEN pathway is the likely regulation of E-cadherin-based junctions in EMCs. The cornerstone of epithelial cell adhesion is Ca
2+ dependent homophilic ligation of E-cadherins [
51]. Cadherins themselves are trafficked to the cell membrane and actively recycled. A critical part of this trafficking is regulated by PIP
2 (reviewed in [
51]). Movement of newly synthesized E-cadherin is mediated by targeted exocytosis and this requires the expression of PIP kinase I𝜸 (PIPK𝜸) [
52]. PIPK𝜸 is a type I PIP kinase that catalyzes the formation of PI(4)P to PI(4,5)P
2 and directly associates with all cadherins. Genetic ablation of the gene encoding PIPK𝜸 resulted in phenotypes consistent with a role for PIPK𝜸 in mediating formations of epithelial junctions, circumferential actin belts and vesicle trafficking [
53]. PIP2 also regulates the “exocyst,” a complex consisting of eight protein subunits that is expressed on exocytic vesicles emerging from the Trans-golgi network (reviewed in [
54]). At least two proteins of the exocyst, Exo70 and Sec3, bind to PIP
2 to mediate their interactions with the plasma membrane [
43,
55]. Disruption of the ability of Exo70 to bind to PIP
2 interfered with the ability of exocytic vesicles to tether and fuse with the plasma membrane [
55]. Thus, PIP
2 likely plays an important role in bringing E-cadheren to the plasma membrane to establish or maintain intercellular adhesion. The VCAM-1/α4β1/PTEN pathway could therefore maintain localized levels of PIP
2 in EMCs to promote junctional integrity during mesothelial migration.
Once intercellular junctions are established, E-cadherins maintain a dynamic interaction with other proteins inside cells to maintain their adhesion to other cells. This process is intimately involved with actin polymerization near the apical junctional complex as we have discussed above (reviewed in [
56]). One way this is known to occur is that PIP
2 inhibits the actin severing protein gelsolin, so as to promote longer filaments with cortical actin belts at the basolateral membrane [
57]. PIP
2 also plays an important role in the rapid recycling of E-cadherins [
51]. If the rate of endocytosis of E-cadherins is increased, for example by pathways that stimulate EMT, junctional complexes are weakened and E-cadherin is predominantly targeted to the proteasome. However, in the absence of these signals, cells can rapidly recycle E-cadherin to the basolateral membrane via the exocyst complex, so increased PIP
2 could mediate an increased recycling of E-cadherin, thus strengthening junctional complexes.
A fourth, but untested, outcome of modification of PTEN by the VCAM-1/α4β1/PTEN pathway may be to alter Rho/ROCK signaling in epicardium. We observed movement of PTEN in cells from the cytoplasm to the basolateral membrane. This process has been linked to RhoA activation [
58] and β-arrestins [
59]. In fact, RhoA can also activate PTEN lipid phosphatase activity through ROCK [
58,
60]. How can this be related to our observations of epicardial cohesion in the presence of sVCAM-1? We had previously found that RhoA was stimulated by TGFβ isoforms in cultured epicardial cells [
12] and others have observed that the Y27632 compound, which inhibits ROCK-kinase, inhibits PDGF-BB stimulated epicardial EMT and stress fiber formation [
61]. PDGF-BB can stimulate both RhoA/ROCK and PI3K/Akt in epicardium [
24,
61], so it appears that activation of both pathways is important for EMT. Consistent with this, we have observed that sVCAM-1 strongly inhibits epicardial EMT [
12], modulates RhoA through p190RhoGAP and relocalizes and activates PTEN. Critical to this discussion then are two completely unresolved issues: first, can PDGF-BB or TGFβ also activate PTEN through RhoA/ROCK? Second, is activation of these pathways limited to critical subcellular areas? This will be a fruitful area for future studies.
3.6. A Model for the Role of Lipid Signaling in Epicardial Mesothelial Cells
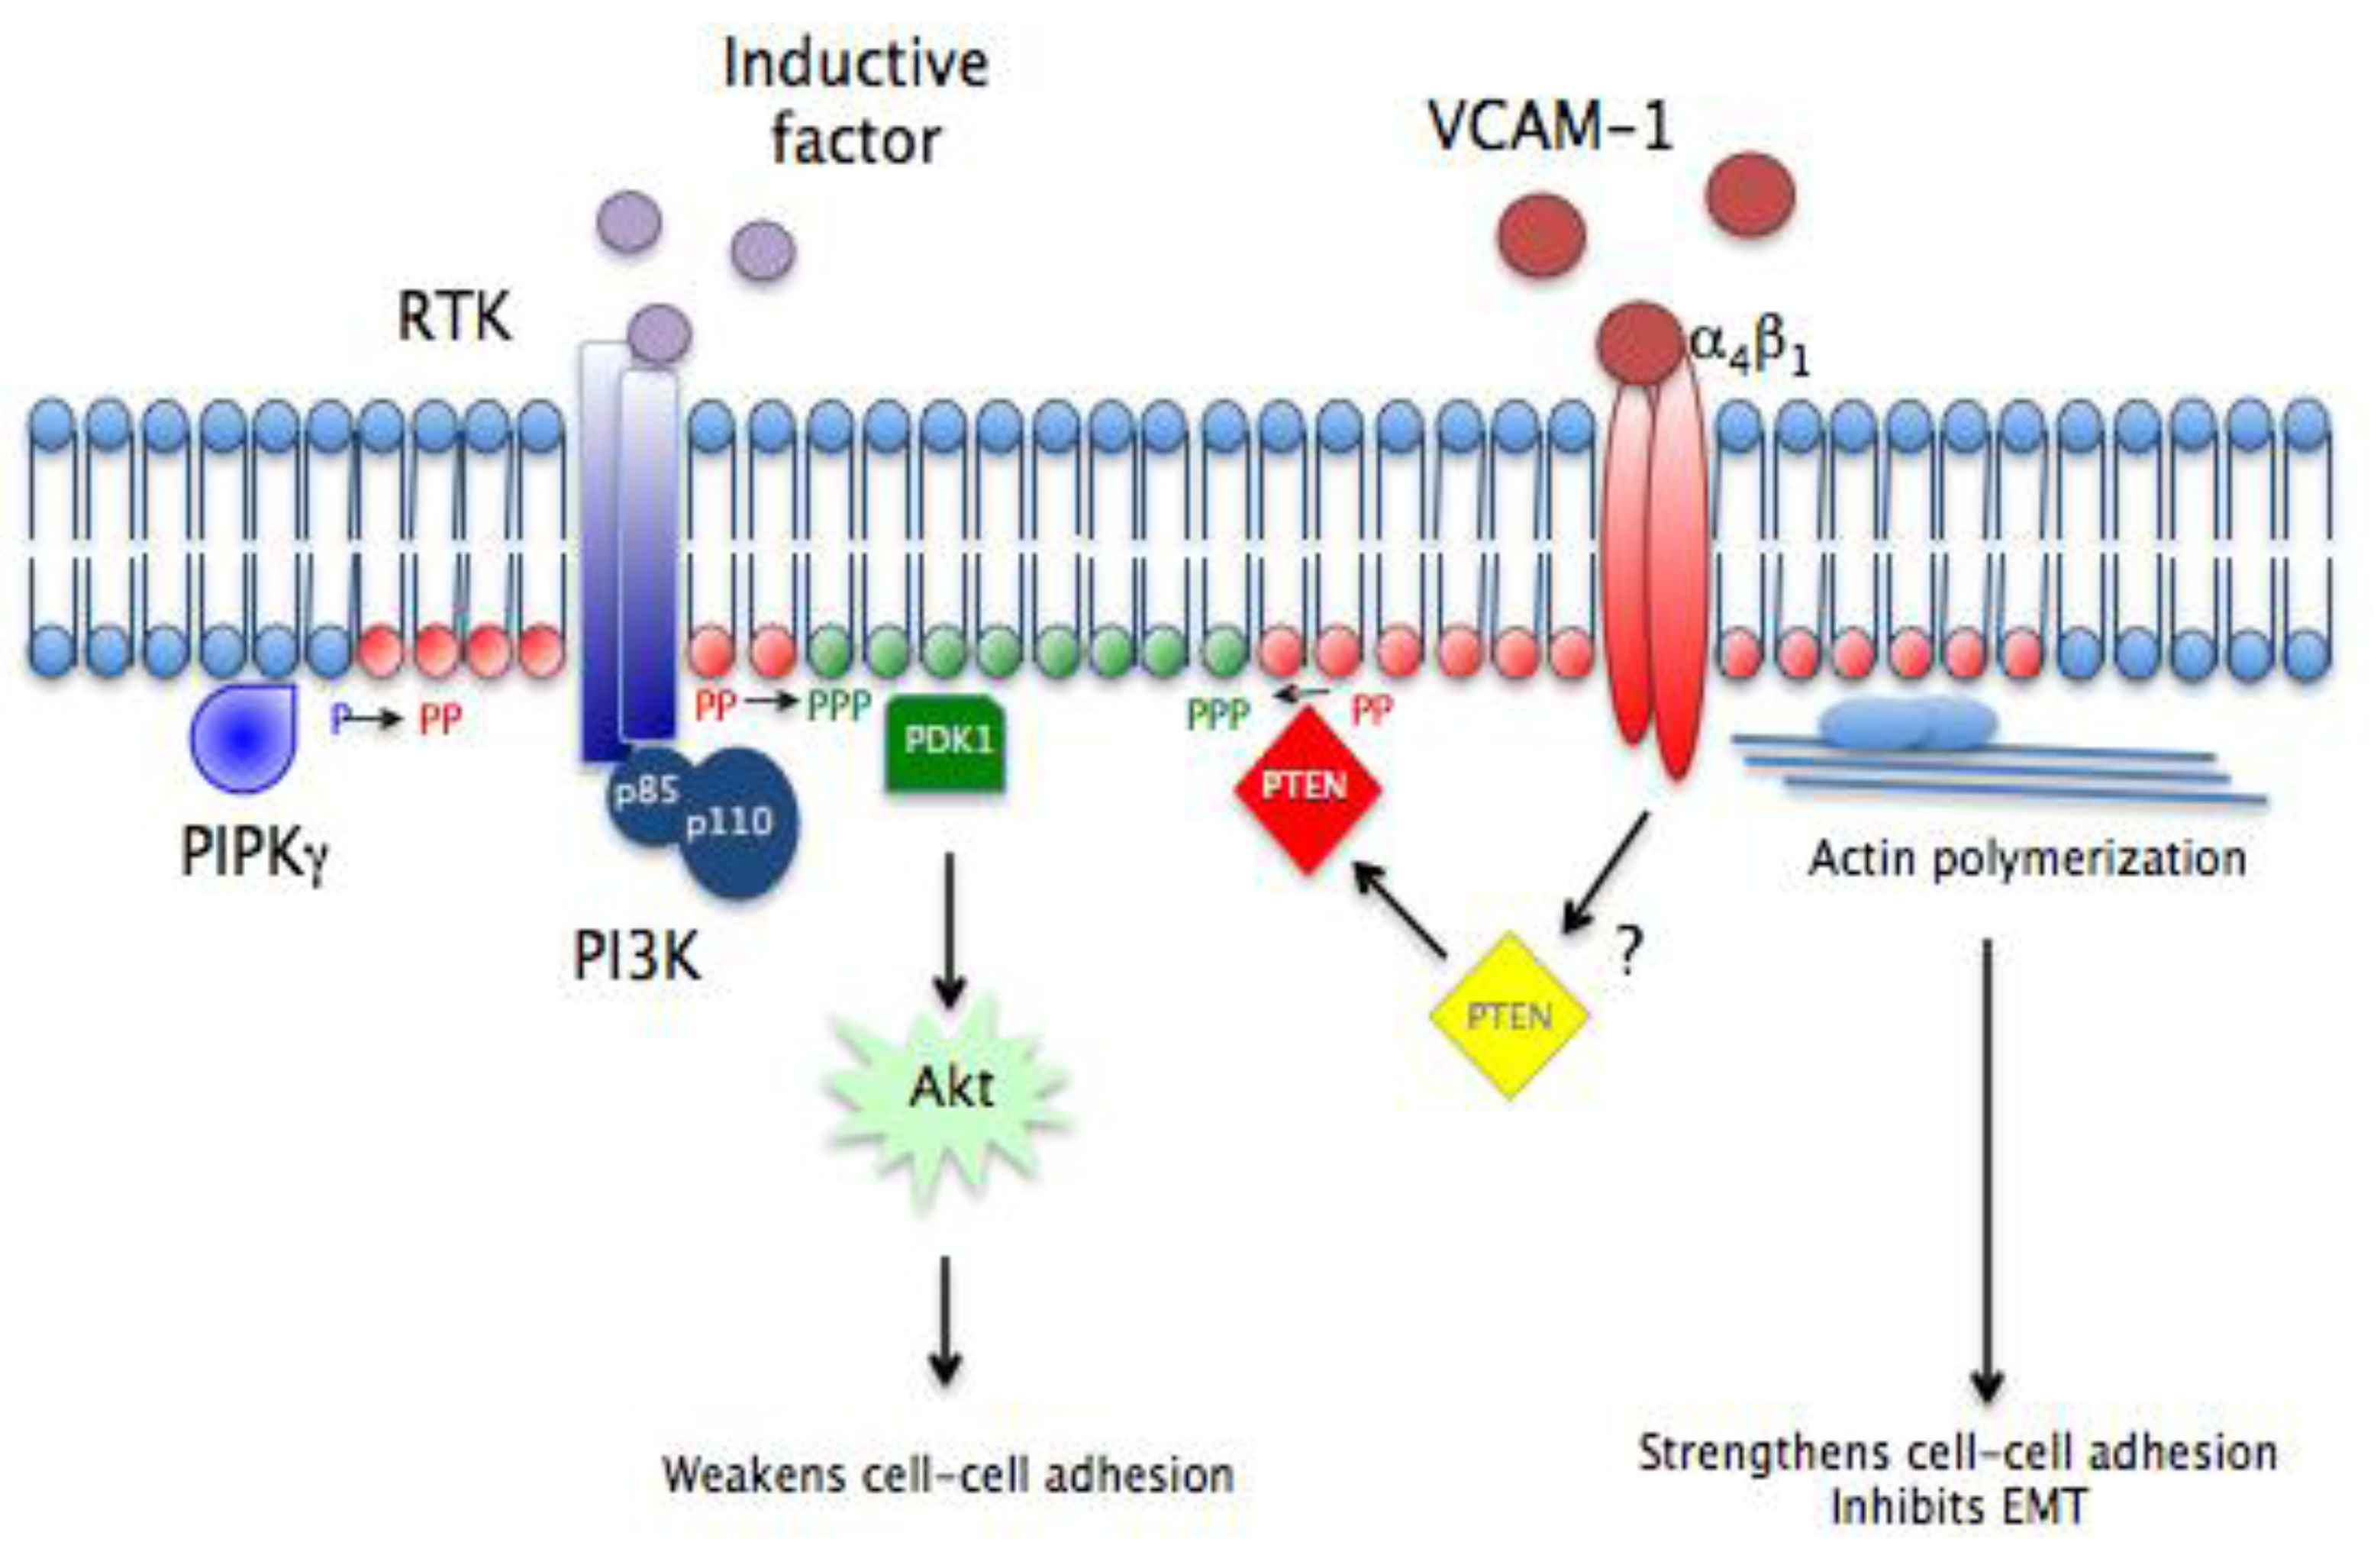
A hypothetical model demonstrating how the VCAM-1/α4β1/PTEN pathway regulates epicardial formation is shown in
Figure 7. Our findings linking sVCAM-1 to PTEN activity support a role for myocardial ligands such as VCAM-1 to influence lipid signaling in epicardial mesothelium. The epicardial mesothelium is initially formed on the primary myocardium, which is expressing VCAM-1 [
8,
9,
16]. Three types of interactions between receptors and ligands have now been identified during this initial physical contact: myocardial BMP with epicardial BMPR [
62]; myocardial Eph receptor with epicardial ephrin [
63]; and myocardial VCAM-1 with epicardial α
4β
1 integrin. The interaction between α
4β
1 integrin and VCAM-1 facilitates the migration of EMCs and, we would argue, maintains them in their mesothelial state during this initial migration. At a later time, inductive factors such as TGFβ isoforms or PDGF-BB are presented to EMCs and this activates intracellular signaling pathways, such as PI3K/Akt, or Wnt/β-catenin to stimulate loss of cell adhesion, EMT and invasion. Other pathways like Rho/ROCK and p38MAP kinase are other intracellular signaling pathways likely involved but not included in our model [
12,
61,
64,
65,
66]. Counteracting these inductive signals is the continued presence of α
4β
1 integrin bound to its ligands VCAM-1 (or later fibronectin). These ligands activate PTEN and localize it to the basolateral membrane to limit the accumulation of PIP
3 within the inner leaflet. Thus, a balance is created, where two opposing pathways maintain the equilibrium between the migrating mesothelium and its mesenchymal derivatives. In situations where inductive signals are stronger, PIP
3 increases, PIP
2 decreases and cells undergo EMT and invade. Alternately, when the α
4β
1 integrin signal is stronger, PTEN is activated, PIP
3 decreases, PIP
2 increases and cells remain in the mesothelium.
We do not know how VCAM-1/α4β1 integrin alters PTEN activity nor do we understand how it can modify its intracellular localization. PIP2 is likely generated in localized regions of the plasma membrane by a member of the PIPK𝜸 family. This PIP2 is then converted to PIP3 by PI3K. This activates Akt and its downstream events, such as inhibiting GSK3β in the Wnt/β-catenin destruction complex. Other pathways are activated to weaken cell-cell junctions, as we have shown that LY294002 blocks weakening of intercellular adhesion. It is possible that the strengthening of junctional complexes we have observed is accomplished simply by increasing plasma membrane PIP2. PIP2 and PTEN then promote epithelial adhesion by binding to and concentrating proteins involved in actin polymerization.
