Abstract
Urban landmarks are frequently used in way-finding and representations of spatial knowledge. However, assessing the salience of urban landmarks is difficult. Moreover, no method exists to rapidly extract urban landmarks from basic geographic information databases. The goal of this paper is to solve these problems from the dual aspects of spatial knowledge representation and public spatial cognition rules. A clear and systematic definition for multiple-scale urban landmarks is proposed, together with a category reference for extracting small- and medium-scale urban landmarks and a model for the large-scale automatic extraction of urban landmarks. In this large-scale automatic urban landmark extraction model, the salience is expressed by two weighted parameters: the check-in totals and local accessibility. The extraction threshold is set according to a predefined number of landmarks to be extracted. Experiments show that the extraction results match the reference data well.
1. Introduction
Urban landmarks are spatial features that are relatively more prominent than the surrounding features [1,2]. This prominence can include being different from neighboring features in appearance or shape, being in an important location (for example, features that divide an urban space, are easy to access, or are located at decision points), or having a special function or cultural significance [1,3].
As a carrier of geographical information, urban landmarks have played an indispensable role in spatial cognition. These landmarks are frequently used and have broad prospects for application in various aspects of way-finding and in representations of spatial knowledge [4]. By using landmarks as spatial references, spatial cues, and symbols [5], people can more easily define the locations of other features, judge their own positions, and better recognize spatial patterns [6]. People also prefer route guidance by using landmarks because these features are more understandable and elicit better results than other route guidance methods [1,3,7,8,9].
Therefore, urban landmarks are important, and many researchers have attempted to simplify urban landmarks to evaluate and extract them, usually by abstracting their features and quantifying their salience [1,4,10,11,12,13].
In this paper, we also perform simplification and extraction tasks, first by classifying objects and then by using various methods to assess and extract landmarks from them. This paper aims to analyze landmarks from representations of spatial knowledge, focusing on extracting urban landmarks by providing practical methods for building landmark layers based on the information in basic geographic information databases. A systematic definition for landmarks at multi-scales from the perspective of representation of spatial knowledge is proposed. Category references for landmarks extraction at small- and medium-scales, salience indicators and extraction methods for landmarks at large scale, based on basic geographic information databases, are proposed.
This paper is organized as follows. Section 2 provides a review of related work. In Section 3, we define landmarks at multiple scales. In Section 4, we provide a category reference for extracting landmarks at small and medium scales and propose a method to extract urban landmarks at large scales. In Section 5, we describe the available data sources and the characteristics of the study area: Shenzhen, China. In Section 6, we present our results along with diagrams and compare these results with those of the artificial extraction method. In Section 7, we draw conclusions and describe future work.
2. Related Works
In this section, we review related works on evaluation and extraction methods for landmarks and landmark hierarchies.
2.1. Evaluation and Extraction Methods for Landmarks
Common evaluation and extraction methods mainly include saliency estimation methods and data mining methods. Landmark saliency describes how obvious a spatial feature is and how easily a feature can be regarded as a landmark. A landmark’s saliency depends on both a landmark’s individual attributes and its distinction from the surrounding spatial features [3,14]. Caduff and Timpf [14] proposed a three-valued saliency vector that includes perceptual saliency, cognitive saliency and contextual saliency based on a summary of previous studies. Perceptual saliency focuses on the tendency of exogenous saliency to attract visual attention, and cognitive saliency focuses on endogenous attention to an object that is triggered by informative cues. Contextual saliency defines the saliency from modality and the task to be performed. This three-valued saliency vector is well-suited to classify other quantitative indices of landmark salience at the conceptual level. Other quantitative indices, such as the singularity, prominence of the spatial location, content, and prototypicality, which were proposed by [1], and the visual, semantic, and structural attraction, which were proposed by [3], can be regarded as instantiations of the three-valued saliency vector. Researchers have attempted to use these measures to extract landmarks from buildings and points of interest (POIs) [15,16,17,18].
Unfortunately, traditional landmark extraction methods that are based on these indices are usually difficult to use in practice because they require administering numerous questionnaire surveys, constructing a large attribute directory, and collecting attributes or images that are typically not present in basic urban geographic information databases.
Other common methods that researchers have investigated include data mining methods. Data mining methods that are based on cadaster can extract landmarks automatically and in bulk [19] by judging whether buildings are salient in a given environment by considering attributes such as building use, geometry, and the number of immediate neighbors. However, this approach also has problems, including its failure to consider cognitive peculiarities. Some researchers have attempted to extract landmarks by gathering statistical information from textual information in digital documents on the Internet as an extension of data mining based on cadaster [20]. However, web documents are not sufficiently comprehensive because of biases in web users and the imprecise locations of spatial objects, leading to incomplete urban landmark extraction. There are approaches computing visual salience for 2D or 3D images to assess salience of landmarks [17,21], but these images are still not available in basic geographic information databases.
Current studies on landmark extraction are primarily aimed at applications to aid navigation but tend to remain at the qualitative discussion level in terms of spatial knowledge representation. Moreover, these applications lack a unified systematic definition for urban landmarks under multiple-scale environments, which makes landmark data less easily transmitted and used in map displays or navigation programs and weakens the role that urban landmarks play in the construction of digital cities. This paper ameliorates these drawbacks.
2.2. Landmark Hierarchies
Most researchers recognize that city landmarks have a cognitive hierarchy. Usually, this hierarchy is quantitatively ascertained by measuring landmark salience and reference regions or by directly and qualitatively dividing landmarks into global and local landmarks [4,18,22]. Actually, these hierarchies all follow a natural impulse to place landmarks into different spatial scales. Landmarks with higher saliency and larger reference regions are at higher levels and can be spatial reference points, spatial cues or symbols at smaller scales.
Landmarks can be layered by their spatial scale because they are important concepts in the fields of spatial information and spatial cognition, both of which have hierarchical organizations that are usually defined by spatial scales. Larger scales provide higher spatial accuracy; consequently, we can see more details of a given spatial object at larger scales. Conversely, smaller scales provide larger spatial spans and make grasping the total characteristics of an area easier [23]. This hierarchical organization of cognitive space also leads to a hierarchical organization of people cognitive behaviors and purposes at different spatial scales and causes people to use landmarks at different spatial scales differently.
Li attempted to divide landmarks into five ranks based on spatial scale: city, region, district, block, and vision landmark levels [16]. These levels can match the cognitive models of space. However, the scope of these ranks is fuzzy; they lack systematic definition and quantification, which can be confusing. In this paper, we refer to this five-rank division, provide clear definitions for landmarks at each scale, and propose respective extraction methods. Section 3 provides more detail.
3. Definitions for Landmarks at Multiple Scales
We divide landmarks into three scales, namely, small scale (city level), medium scale (region and district levels), and large scale (block and vision levels) based on the rudimentary division of multiple-scale landmarks as proposed by [16] and the common hierarchy of cognitive space (Figure 1).
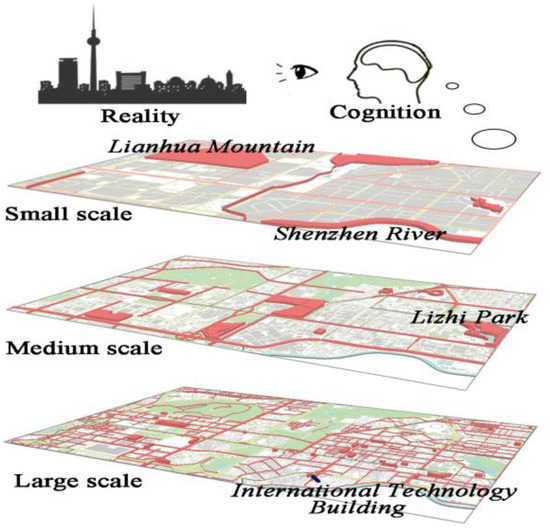
Figure 1.
Cognition Schematic Diagram of Urban Landmarks at Multiple Scales.
After this partition, we define landmarks at each scale, describe their characteristics, and then study their respective extraction methods according to these characteristics.
We adopt a better assessment model of landmark salience that was proposed by Caduff and Timpf (2008), which barely changes the cognitive salience. This model is more comprehensive and general than other models. This model includes perceptual salience, cognitive salience and contextual salience.
Perceptual salience focuses on the objective attraction of a landmark and depends on whether the landmark is salient in some sense (i.e., visually, aurally, or olfactorily). Perceptual salience includes visual and structural attraction as described in [1,3]. Cognitive salience focuses on the subjective attraction of a landmark and depends on people's experiences. Objects that have a high degree of recognition and idiosyncratic relevance can be landmarks. Cognitive salience also includes semantic attraction according to [3] and cognitive attraction according to [1]. Contextual salience focuses on the tasks and modalities that people use when they go out. These context types influence the focus of attention and field of view, causing people to choose different objects as landmarks.
The characteristics that are included in these definitions were developed by generating and summarizing the characteristics of landmarks on online map services. These online map services are displayed in multiple scales, and landmarks were manually extracted from one of these online map services.
3.1. Landmarks at Small Scales
Landmarks at small scales are urban spatial features that are prominent at the city level. These features have the following characteristics:
- Their names are unique in the entire city.
- Perceptually, they have obvious spatial boundaries, cover a large area, or act as dividing features for the urban regional structure.
- Cognitively, they play important roles as transportation, cultural or political hubs both within the city and to the outside world; both inhabitants and travelers are highly aware of these landmarks, and these features can help identify the global spatial structures of the city.
- Contextually, they can act as route guidelines or destinations for a trip; thus, they are always salient in a travel context.
At a small scale, spatial information cannot be obtained from direct observations and is usually acquired by reading maps or from long-term experience in moving around the city. At this scale, people’s spatial cognition functions at the orientation level or at the level of ascertaining the area in which a target object is located. In this circumstance, the main functions of landmarks are to help with orientation or to help people separate geographical spaces to construct the basic contours of a mental map. Therefore, spatial features that are prominent at this scale and have a large influence on urban structure, global layout, or communication and transportation between cities can become landmarks. These landmarks may include administrative divisions at the district/county level that divide the city, large-area natural elements that naturally limit urban structures, transportation junctions, and political, cultural and economic hubs.
3.2. Landmarks at Medium Scales
At medium scales, landmarks are the prominent spatial features at the regional and district levels. These features have the following characteristics:
- Their names are unique within the region/district.
- Perceptually, they cover a certain area or divide the region/district.
- Cognitively, they provide large public venues for social, economic, cultural, political, and recreational activities, and inhabitants are highly aware of them.
- Contextually, they have an extensible form that radially influences the surrounding features, can provide topological guidance, or are near decision points (such as intersections), and they are usually salient in driving or riding contexts.
At medium scales, spatial information cannot be obtained from a fixed perspective, which is instead usually acquired from the experience of moving around in the region. People must ascertain the approximate scope of a destination and know the general direction in which to travel to this destination. Landmarks at medium scales address this need. Concretely, spatial features that divide regional structures (such as township-level administrative divisions (blocks) and main roads) and have extensible forms (such as large public housing facilities, giant malls, business areas, and entertainment venues) can be landmarks at medium scales because these features can act as spatial cues or symbols, indicating the approximate scope of a target object. For example, people might say, “The Hubei Surveying and Mapping Building is at Optical Valley,” where the business area “Optical Valley” is a landmark. Streets, and small- and medium-sized rivers and lakes can also be landmarks when they provide topological directional guidance; for instance, people might say “Follow the river” to give directional guidance.
3.3. Landmarks at Large Scales
At large scales, landmarks are spatial features that are prominent at the block and visual levels, offering accurate location information. Their characteristics are as follows:
- Perceptually, they are close to roads and are easily accessible.
- Cognitively, they provide venues (public service facilities) where people participate in social, economic, cultural, political, and recreational activities, have cultural (memorial) value, or are transportation facilities. They are intimately related to peoples’ daily lives, and nearby residents are highly aware of them.
- Contextually, they are usually near roads and salient in a walking context.
At large scales, detailed spatial information can be obtained from a fixed perspective or from a small amount of movement. People consider known or easily noticed spatial features as landmarks and use their precise location information to help ascertain the location of a target object.
Landmarks at this scale are the closest to daily life among all landmark types and thus are usually the most commonly used type of landmark in representations of spatial knowledge. Therefore, public service facilities, businesses, and other prominent buildings such as restaurants, markets, mansions, schools, shopping centers, housing, transportation hubs, and relatively prominent spatial features that have cultural significance or functions can be landmarks. Huge numbers of landmarks exist at this scale. These landmarks have complex types and are difficult to extract with feature categories; however, we can take advantage of their characteristics, including their strong links to daily life, proximity to roads, and high accessibility, to extract them. This paper proposes a practical method to extract landmarks at large scales in Section 3.2.
4. Landmark Extraction
A flow chart of landmark extraction is shown in Figure 2, in which part (a) is for landmarks at small and medium scales, and part (b) is for landmarks at large scale. As thresholds of this approach for small and medium scales are still being studied, we will focus on the approach for large scales.
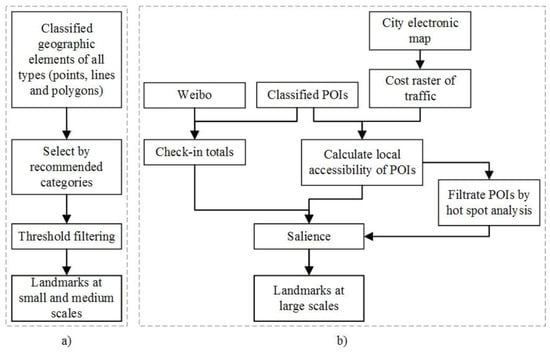
Figure 2.
Flow Chart of Urban Landmark Extraction: (a) landmarks at small and medium scales; (b) landmarks at large scales.
4.1. Landmark Extraction at Multiple Scales
For the small and medium scales, we provide category references for landmark extraction according to GB/T 13923-2006, “Specifications for feature classification and codes of fundamental geographic information” [24]. This standard was proposed to guide the production of basic geographic information data and is considered the reference standard for many local classification specifications. This standard is used in nearly every surveying, mapping and geographic information industry, such as geographical national conditions surveys, inland electronic navigation charts, etc. and therefore has been widely accepted amongst the public.
The granularity of classification in this specification is somewhat large; consequently, some features that people often consider (such as squares) are not present in these feature classification codes but can be included in the subclasses. Moreover, this classification covers all the basic geographic information features, has definite delineated limits between each category and is widely accepted among the public, which makes this approach useful to provide category references based on specifications for landmarks at small and medium scales. We propose a method to assess the salience of landmarks at large scales to improve automatic landmark extraction.
According to the definition and description in Section 3, we recommend six categories of features for small-scale landmarks (Table 1) and twelve categories for medium-scale landmarks (Table 2) from GB/T 13923-2006. When in actual use, this category reference can be a filter and can be used to roughly but effectively extract landmarks at small and medium scales alongside a more detailed threshold limit. Further surveys and experiments must be conducted to set more precise threshold limits (rank, area, length, etc., instead of “large scale” in Table 1 and Table 2) and different threshold limits under different city sizes or other special circumstances, which is our next goal.

Table 1.
Categories of Landmarks at Small Scales.
Table 2.
Categories of Landmarks at Medium Scales.
We propose a method to assess the salience of landmarks at large scales for extraction purposes. Although landmarks at this scale are tremendously common, exhibit complex types and are difficult extract via feature categories, we can take advantage of their characteristics, including their strong link to daily life, proximity to road, and high accessibility, to extract them. This paper proposes a practical method to extract landmarks at large scales in Section 4.2.
4.2. Landmark Extraction at Large Scales
To extract landmarks at large scales, we start with POIs that have been classified based on the GB/T 13923-2006 as the foundational data. We assess the salience of these POIs from perceptual, cognitive and contextual aspects and then add this salience as a standard for extracting landmarks at large scales from these POIs. These indices specifically include check-in totals from location-based services (LBS) and local accessibility. Check-in totals are used to assess cognitive salience, and the local accessibility is used to assess perceptual salience and contextual salience.
These POIs are constrained to points. As mentioned in Section 3.3, a large-scale landmark should basically have precise location information and can be seen without a large amount of movement. Thus, polygonal features such as parks and schools and linear features such as roads and rivers (rivers can be regarded as polygons) cannot be landmarks at this scale because using the entire feature as a landmark to describe the position of another feature is difficult. However, points, such as the gates of a polygonal feature or a building beside a road, may be selected as landmarks.
In previous works, researchers have often considered appearance indices such as color; however, this paper did not use these indices. There are two reasons for this:
- (1)
- Appearance indices are difficult to obtain. When the number of spatial features becomes large, these indices become difficult to obtain and measure, making them impractical for assessing landmark salience. In other researches, for examples, Raubal and Winter use visual, semantic and structural attraction to assess salience of landmarks. The data sources they need include digital city maps, navigation graphs, and rectified geo-referenced images of facades [1], in which the images are not available according to our database. The data source Elias used are buildings in cadastral data set [19,25], in which parcel information is not available either in our basic geographic information database.
- (2)
- Perceptual saliency will partly transition into cognitive saliency after a period, because spatial cognition usually begins with perception. There are several theoretical perspectives or frameworks that have described the process of spatial cognition developing [26].The process of human spatial cognition, usually starts with perception, such as the process of perception, coding, saving, memorizing and decoding, and then become cognition [27].
Therefore, we do not attempt to consider appearances. Instead, the two indices adopted by this paper cover public cognition and spatial structures alongside subjective and objective aspects. Where “Subjective aspect” refers to the subjective selection of a landmark, which internally occurs depending on the observer’s knowledge, experience and preference. “Objective aspect” refers to the objective attraction of a landmark, which is externally represented in urban environments, including the color, size, shape, etc. of spatial objects.
The check-in number for a POI reflects how many people have been to this POI. Studies also showed that POIs with high check-in numbers are more well-known among the public [15]. We can assume that these well- known POIs have a higher possibility to be subjectively chosen as landmarks [14] when people cognize space or describe locations because of people’s experience and knowledge.
“Accessibility” refers to the ease with which a POI can be reached, which reflects this POI’s salience in terms of spatial structure. POIs with high accessibility are usually near roads and easily seen and reached, thus having a higher possibility to be objectively considered landmarks.
4.2.1. Check-in Totals
Check-in data are location data that are transmitted by LBS users that use mobile Internet devices with global positioning system (GPS) sensors. As geographic data from a public source, check-in totals can reflect public behavior characteristics to a large degree and are especially appropriate for describing the spatial tendencies of leisure activity. Studies have shown that POIs with high check-in totals have a higher cognitive saliency value than those with low check-in totals [15].
Check-in behavior also has some limitations because check-ins are based on the use of social software on mobile devices, which skews the data toward younger people who are partial to recreational activities, and provide little information concerning hospitals, government agencies, non-entertainment enterprises, or public institutions. Hence, this index can be a criterion of salience only for spatial features that include categories such as parks and greenways, urban centers, technology and educational destinations, culture and sports facilities, transportation facilities, tourist and sightseeing spots, hotels and restaurants, and shopping centers. Still, check-in totals can be a good method to reflect the cognitive saliency of POIs that are related to daily life and leisure activities compared to tedious questionnaires.
The specific method to obtain this index is as follows. First, obtain check-in datasets from dominant social networking sites such as Sina Weibo. Then, match these datasets with POIs. Finally, total the check-ins (C) for each POI.
4.2.2. Local Accessibility
Accessibility is a measurement that reflects how easily people can obtain access other places from a designated position, considering traffic. High accessibility usually means being close to a road, easily seen, or convenient to public transportation and enhances perceptual salience and contextual salience. In this article, the accessibility of a POI is calculated from the viewpoint of the Floating Catchment Area (FCA) method and combined with a hot spot analysis technique to select POIs.
The procedures are as follows:
1. Create cost raster of traffic
When rasterizing city electronic maps, grids are weighted by the travel-time costs according to the speed and transport capacity of different transportation elements (see Figure 3a,b for an example; in (b), the numbers 1–4 indicate different travel-time costs, among which “1” represents the shortest time). In addition, the size of a raster cell should not exceed the width of the lowest-grade road around the urban area. Here, we set this size to 5 × 5 m.
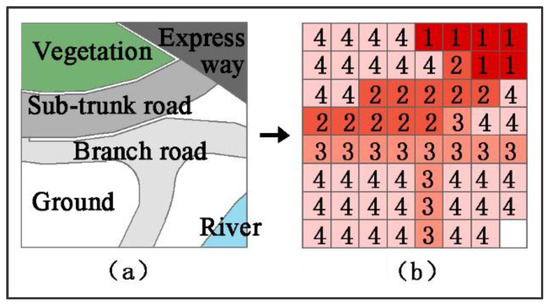
Figure 3.
Methods and Procedures 1: (a,b) Generating an Accessibility Cost Raster.
The transport capacity of different grades of transportation elements are listed in Table 3 alongside the travel time that each cell represents based on CJJ37-2012, “Code for design of urban road engineering” [28]. The transport capacity numbers of the road types in this table are calculated from the traffic volume per hour (larger traffic volumes indicate better transport capacity); however, the superhighway grade should be considered separately. In reality, superhighways barely affect traffic at large scales in terms of transport capacity because they have limited entrances and exits within urban areas. Although superhighways make travel fast between cities, they do not have significant effects at urban scales.
Table 3.
Time Cost of Transportation Elements.
2. Calculate the local accessibility
This study adopted the FCA method to obtain the local accessibility of each POI. The FCA method works as a filter window, usually a circle or square, within which the average value of an attribute represents the center point (such as in Figure 4a). In this paper, we set a fixed search radius, making each POI the center of a circle that functions as the search scope (the filter window) to calculate the average time cost, T, on the cost raster. People have easier access to a POI when the time cost is low. In this study, we set the radius to 250 m based on the building density and road density in the study area. This radius can lead to a larger discrepancy in accessibility among all POIs.
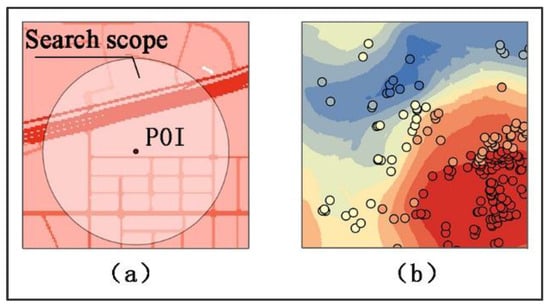
Figure 4.
Methods and Procedures 2: (a) FCA; (b) Hot Spot Analysis.
The value of A (the local accessibility of POIs) indicates the numbers and grades of the roads around a POI and therefore is equal to the reciprocal of T, as shown in the expression below:
A = 1/T
3. Apply hot spot analysis to the POIs’ local accessibility
Hot spot analysis is a technique to identify statistically significant spatial clusters of high values (hot spots) and low values (cold spots) by using the Getis-Ord Gi* statistic (Figure 4b). To be a statistically significant hot spot, a feature must have a high value and be surrounded by other features of that type. When the local sum of a feature and its neighbors is distinguished from the expected local sum, said feature may be a result of spatial clustering rather than random chance. The resultant z-scores and p-values are measures of statistical significance. The calculations [29] are as follows:
where xj is the attribute value for feature j (here, the local accessibility), wi,j is the spatial weight between feature i and j, n is equal to the total number of features, E is the expectation of Gi*, and Var is the variance of Gi*.
The p-value shows the probability that the observed spatial pattern was created by some random process. With a small p-value, the higher (or lower) the z-score is, the more intense the clustering of high (or low) values becomes. A z-score near zero indicates no apparent spatial clustering.
A clustering of high values indicates that POIs with high local accessibility are gathered in this area and that the area is both well-equipped and convenient for people in the city to reach. Thus, such places can motivate socio-economic activities [18] and have high spatial cognition at medium or small scales [30]. We can conclude that POIs in such areas are more likely to have remarkable perceptual, cognitive and other aspects of salience. Therefore, we adopted hot spot analysis as a method to select the POIs that are more likely to be urban landmarks amongst all POIs with high values.
A confidence level should be chosen that reflects the degree of confidence in the outcome before running the spatial statistic. Typical confidence levels are 90%, 95%, or 99%. Here, we chose 90%; otherwise, the method might have omitted some POIs that have high check-in totals but no clustering. For this confidence level, the critical p-value is 0.1 and the z-score is 1.65. POIs within hot spot areas can be selected according to this threshold.
4.2.3. Salience
The next step is to assess the salience, S, of landmarks in the hot spot region. The assessment model comprises both the check-in totals C and the local accessibility A as follows:
S = w1C + w2A
The indices C and A must be normalized (using min-max normalization) to eliminate the effects of the index dimension and the quantity of data. Each x is normalized to x* as follows:
where min is the smallest data value among all values of x, and max is the largest.
The weight coefficients w1 and w2 are determined synthetically by both the entropy weight method and expert grading. Comprehensive weight coefficients for each index C or A are determined as follows:
where wi is the comprehensive weight coefficient, and a () is an experience factor that reflects the portion of the objective weight that is shared by the coefficient Qi (which is obtained by the entropy weight method) and the subjective weight coefficient Pi (which is obtained by expert grading). In this formula, a is usually set to 0.5.
The main idea behind the entropy weight method is to objectively determine the weights based on the degree of variability of the indices. Information entropy was first proposed by C.E. Shannon [31]. Entropy can be a measure of the unpredictability of an indicator or its average information content. The higher the unpredictability, the higher the information content becomes. Moreover, the greater the amount of information that this index can yield, the larger the effect the index has on the overall evaluation; thus, this index should have a higher weight coefficient. The following describes how the entropy weight is measured [32,33].
For an evaluation object set {Ai} (i = 1, 2, …, m) and indicator set {Xj} (j = 1, 2, …, n), which are used to evaluate the objects, and xij, which is the standardized value of the jth indicator of object i,
where pij is the proportion of object i on the jth indicator, ej is the information entropy of the jth indicator, gj is the diversity factor of indicator j, and wj is the entropy weight of the jth indicator.
In this paper, for example, the objective weight coefficients from the experimental data were Q1 = 0.5 and Q2 = 0.5. In comparison, literature [18] sets the weight coefficients that represented cognition, spatial structure and characteristic attributes to 0.4, 0.2 and 0.4, respectively, solely through expert grading. Referring to these weight coefficients, we initially set the subjective weight coefficients for the check-in totals and local accessibility at a 2:1 ratio—that is, P1 = 0.67 and P2 = 0.33. When we put these into Formula (6), we derived initial weight coefficients of w1 = 0.6 and w2 = 0.4. After constant adjustment, we finally set these values to w1 = 0.7 and w2 = 0.3, which were the optimal weights after much experimentation. These values created results that better conformed to the reference data.
4.3. Entire Extraction Method
On the whole, landmarks at different scales can be extracted separately in our method. However, this approach may lead to some repetitive extraction (because the same feature can be a landmark at more than one scale), usually for POIs that are truly famous at small and medium scales. Moreover, these landmarks can also be regarded as spatial reference points at a large scale, which coincides with our definition of landmarks at each scale. Additionally, when extracting landmarks at a large scale, polygonal and linear POIs must first be filtered out because their large areas can lead to uncertainties in position references.
5. Study Area and Data Sources
The Futian and Luohu districts were chosen to be the study area. In 2011, we obtained POI data (including names and locations of POIs) from malls to act as the data source. At large scales, we also extracted landmarks category by category by using the category “malls” as our POI data. We chose these areas as examples to conduct an experiment to extract mall landmarks at a large scale from the POIs.
Futian and Luohu are coastal districts in southern Shenzhen, China. These districts are the most prosperous districts in Shenzhen and include several busy business areas that are famous among local inhabitants. In total, 1008 mall POIs were present. These POIs had obvious spatial clusters in the Huaqiangbei sub-district, Dongmen sub-district, and central Futian sub-district.
Other data included an electronic map of these two districts (including land use types and road grades) and check-in data from Sina Weibo (names, locations and check-in totals for various check-in points). The land use types included buildings, roads, ground, vegetation and river systems. The roads were divided into motorways, subways, expressways, trunk roads, sub-trunk roads, branch roads and interior roads. The check-in totals were matched to the POIs based on their names and locations.
The landmarks from the online electronic map service were chosen to be the reference data for this experiment. The landmarks were manually extracted from the total POIs by asking local residents to choose landmarks or by sending staff to record impressive spatial features during travel, considering spatial knowledge representation and spatial cognition based on our study’s emphasis. Concretely, we took mall landmarks at a 1:5000 scale as references to verify the experimental results. Fifty landmarks were recorded in total.
6. Results and Discussion
In this experiment, the local accessibility of POIs was calculated using a search radius of 250 m based on the building and road density in the study area. Next, hot spot analysis was performed. We selected 4 hot spot regions with z-scores higher than 1.65 (Figure 5). These hot spot regions included the Dongmen/Nanhu/Guiyuan sub-districts, central Futian sub-district, Xiangmihu sub-district and other regions (including portions of the Huaqiangbei/Nanyuan sub-districts and the Lianhua/Huafu sub-districts), covering the prosperous Dongmen, Renminnan, and central Futian trading areas. We obtained 235 mall POIs from these hot spot regions, which were then sorted by their salience based on Formula (4) with w1 = 0.7 and w2 = 0.3.
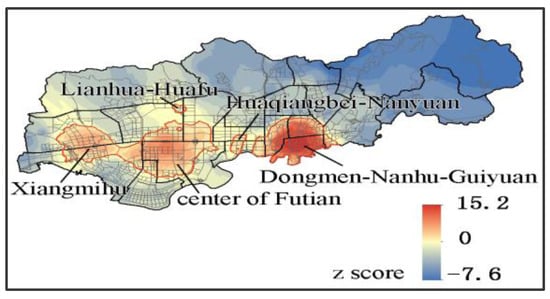
Figure 5.
Local Accessibility Hot Spot Analysis Map of Malls.
The top-ranked POIs were filtered separately from each hot spot region to avoid excessive landmark concentrations. As a quantitative index, “salience” cannot be a cutoff point for determining whether a POI “is” or “is not” a landmark; thus, we must determine the number of landmarks according to a quantity threshold for landmark extraction and then extract a corresponding number of POIs in sequence. In this paper, we chose 50 as the required number of landmarks, which was the same as the number of reference landmarks. Finally, we extracted the top 20% POIs from each hot spot region, a total of 45, as the mall landmarks at large scale.
These 45 top-ranked POIs included several shopping centers, such as Jinguanghua Square, the MIXC, Maoye Department Store, COCO Park, and chain hypermarkets such as Wal-Mart and China Resources Vanguard. These POIs had common characteristics that included popularity, large crowds, and high accessibility, making them appropriate for consideration as landmarks. A subset of these landmarks is listed in Table 4 in order of saliency value for each region. Compared to the reference data, 35 of the 45 (78%) extracted landmarks matched the reference landmarks, showing a good extraction result.
Table 4.
POIs ranked by Salience.
The results also showed the following characteristic deficiencies:
- Filtering landmarks by hot spot regions of local accessibility omitted some potential landmarks with high check-in totals and may not have been suitable to some evenly scattered facilities. For instance, some shopping malls with very large areas, such as the KK Mall, had corresponding POIs at the center of the building, far from roads. Another instance involved evenly scattered gas stations. These features were not clustered with other POIs and thus were not located in hot spot regions with high local accessibility; therefore, despite their high check-in totals, these locations were not extracted as landmarks.
- The landmarks that were extracted by this method were relatively over-concentrated (Figure 6) compared to the reference landmarks. The landmarks that we extracted were mostly grouped in the Dongmen and Nanhu sub-districts because of the large numbers of POIs in these areas. After extracting landmarks from each cluster at the same percentage rate (20%), the landmarks that were selected from these areas still formed a large number. This phenomenon of landmark concentration can be explained by inhomogeneity and subjectivity [34]. Although this result conforms to the representation of spatial knowledge, it is not beneficial for practical landmark extraction in fields such as navigation.
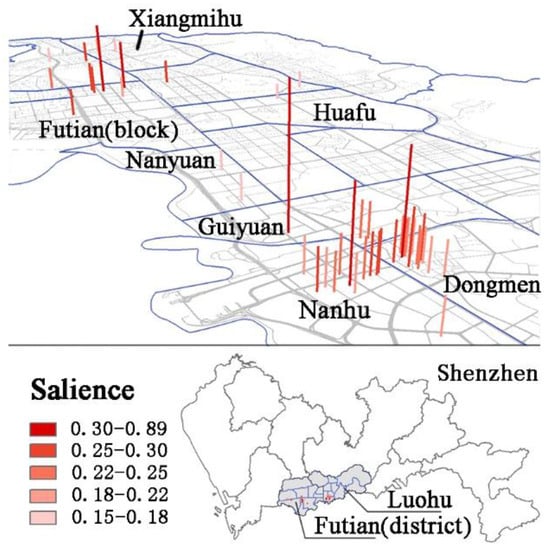 Figure 6. Mall Landmarks in the Luohu and Futian Districts.
 - The extraction results conformed better to the cognition of young people than to the cognition of others. Because of the bias of check-in data, POIs with high check-in totals were usually shopping malls that young people frequent, which increased the probability of these POIs being extracted as landmarks.
7. Conclusions
7.1. Main Contributions
- A systematic definition for landmarks at multi-scales from the perspective of representation of spatial knowledge
- A category reference for landmarks extraction at small- and medium-scales
- Salience indicators and extraction methods for landmarks at large scale, based on basic geographic information databases
This article proposed a systematic and explicit definition for multiple-scale urban landmarks and an extraction method for urban landmarks that is based on basic geographic information databases. At small and medium scales, landmarks can be qualitatively extracted by the category references that are provided in this paper. We proposed an automatic extraction model for large-scale urban landmarks that considers both check-in totals and the local accessibility, with high-saliency urban landmarks selected by hot spot analysis. The results of an experiment showed that the model’s extraction compared well with reality.
This model has the following advantages. Category references at small and medium scales have the advantage of comprehensive extraction. This approach is not limited to point elements and can extract linear and polygonal elements as landmarks, which conforms better to people’s cognition and their habits of spatial knowledge representation. Moreover, using data sources for a large-scale urban landmark extraction model is more reliable than other methods, and indices that reflect public cognition and spatial structure from both subjective and objective aspects can be easily obtained and measured, making this mode simpler and faster than traditional methods.
7.2. Future Work
Still, some limits exist with this extraction model as is mentioned in Section 6. Future studies should be undertaken:
- Detailed threshold limits for landmarks extraction at small- and medium-scales are needed in future work, including threshold limits for each category, and also for different city size or under other special circumstances
- Other salience indicators to be added, such as geometric indicators
Clear distinctions between each scale and more detailed and specific threshold limits for landmarks at small and medium scales (beyond the category references) need to be drawn. For a large-scale urban landmark automatic extraction model, landmarks with high popularity but inconvenient accessibility or that are evenly scattered may be omitted when adopting the spatial clustering method and using hot spots to filter the POIs. Younger people are more apt to check the Internet, so the extraction outcome may match only the cognition of the young. To make this model more efficient and intelligent, our subsequent studies of this topic will focus on establishing more thorough saliency evaluation indices for landmarks, for example, by adding geometric indices to reflect singularity salience.
Acknowledgments
This work was supported by the National Natural Science Foundation of China under grant numbers 41201403 and J1103409; Also supported by National Key Research and Development Program of China under grant number 2016YFC0803106.
Author Contributions
Min Weng conceived and designed the experiments, Mengjun Kang analyzed the data, and Qin Xiong wrote the paper. All the authors were involved in manuscript revisions.
Conflicts of Interest
The authors declare that they have no competing financial interests.
References
- Sorrows, M.E.; Hirtle, S.C. The nature of landmarks for real and electronic spaces spatial information theory. In Cognitive and Computational Foundations of Geographic Information Science; Springer: Berlin/Heidelberg, Germany, 1999; pp. 37–50. [Google Scholar]
- Lynch, K. The image of the city. J. Aesthet. Art Crit. 1960, 24, 46–68. [Google Scholar]
- Raubal, M.; Winter, S. Enriching wayfinding instructions with local landmarks. Geogr. Inf. Sci. 2002, 2478, 234–259. [Google Scholar]
- Winter, S.; Tomko, M.; Elias, B.; Sester, M. Landmark hierarchies in context. Envir. Plan. B Plan. Des. 2008, 35, 381. [Google Scholar] [CrossRef]
- Presson, C.C.; Montello, D.R. Points of reference in spatial cognition: Stalking the elusive landmark. Br. J. Dev. Psychol. 1988, 6, 378–381. [Google Scholar] [CrossRef]
- Zhang, X.; Li, Q.; Fang, Z. An approach of generating landmark chain for pedestrian navigation applications. Geomat. Inf. Sci. Wuhan Univ. 2010, 35, 1240–1244. [Google Scholar]
- Michon, P.E.; Denis, M. When and Why Are Visual Landmarks Used in Giving Directions? Springer: Berlin/Heidelber, Germany, 2001. [Google Scholar]
- Golledge, R.G. Human Wayfinding and Cognitive Maps; Johns Hopkins University Press: Baltimore, MD, USA, 1999; pp. 5–45. [Google Scholar]
- Deakin, A.K. Landmarks as navigational aids on street maps. Cartogr. Geogr. Inf. Sci. 1996, 23, 21–36. [Google Scholar] [CrossRef]
- Tomko, M.; Winter, S. Pragmatic construction of destination descriptions for urban environments. Spat. Cognit. Comput. 2009, 9, 1–29. [Google Scholar] [CrossRef]
- Klippel, A.; Winter, S. Structural salience of landmarks for route directions. Comput. Sci. 2005, 33, 347–362. [Google Scholar]
- Nothegger, C.; Winter, S.; Raubal, M. Selection of salient features for route directions. Spat. Cognit. Comput. 2004, 4, 113–136. [Google Scholar] [CrossRef]
- Haken, H.; Portugali, J. The face of the city is its information. J. Environ. Psychol. 2003, 23, 385–408. [Google Scholar] [CrossRef]
- Caduff, D.; Timpf, S. On the assessment of landmark salience for human navigation. Cognit. Process. 2008, 9, 249–267. [Google Scholar] [CrossRef] [PubMed]
- Wang, M.; Hu, Q.; Li, Q.; Qin, L. Extracting hierarchical landmark from check-in data. Chin. J. Comput. 2016, 39, 405–413. [Google Scholar]
- Li, L.; Mao, K.; Tan, Y. Hierarchy landmarks multi-granularity description method for route guidance. Acta Geod. Cartogr. Sin. 2014, 43, 105–112. [Google Scholar]
- Fang, Z.; Li, Q.; Zhang, X.; Shaw, S.L. A GIS data model for landmark-based pedestrian navigation. Int. J. Geogr. Inf. Sci. 2012, 26, 817–838. [Google Scholar] [CrossRef]
- Zhao, W.; Li, Q.; Li, B. Extracting hierarchical landmarks from urban POI data. J. Remote Sens. 2011, 15, 973–988. [Google Scholar]
- Elias, B. Extracting landmarks with data mining methods. Lect. Notes Comput. Sci. 2003, 2825, 375–389. [Google Scholar]
- Tezuka, T.; Tanaka, K. Landmark extraction: A web mining approach. In Spatial Information Theory; Springer: Berlin/Heidelberg, Germany, 2005; pp. 379–396. [Google Scholar]
- Joan, S.; Vidal-Calleja, T.; Civera, J.; Montiel, J.; Montiel, J.M.M. Impact of landmark parametrization on monocular EKF-SLAM with points and lines. Int. J. Comput. Vis. 2012, 97, 339–368. [Google Scholar]
- Lovelace, K.L.; Hegarty, M.; Montello, D.R. Elements of Good Route Directions in Familiar and Unfamiliar Environments; Springer: Berlin/Heidelberg, Germany, 1999. [Google Scholar]
- Ai, T.; Cheng, J. Key issues of multi-scale representation of spatial data. Geomat. Inf. Sci. Wuhan Univ. 2005, 30, 377–382. [Google Scholar]
- AQSIQ. Specifications for Feature Classification and Codes of Fundamental Geographic Information; Standards Press of China: Beijing, China, 2005; Volume GB/T 13923-2006. [Google Scholar]
- Elias, B.; Brenner, C. Automatic Generation and Application of Landmarks in Navigation Data Sets; Springer: Berlin/Heidelberg, Germany, 2005. [Google Scholar]
- Montello, D.R. Cognition of Geographic Information; CRC Press: Duluth, MN, USA, 2005; Volume 4, pp. 61–91. [Google Scholar]
- Lloyd, R. Spatial Cognition: Geographic Environments; Kluwer Academic Pulishers: Dordrecht, The Netherlands, 1997. [Google Scholar]
- MOHURD. Code for Design of Urban Road Engineering; China Architecture & Building Press: Beijing, China, 2012; Volume CJJ 37-2012. [Google Scholar]
- Getis, A.; Ord, J.K. The analysis of spatial association by use of distance statistics. Geogr. Anal. 1992, 24, 189–206. [Google Scholar] [CrossRef]
- Wang, M.J.; Zhang, X.X.; Huo, T.T. Spatial correlation patterns of sites cognition rate in Beijing. Acta Geogr. Sin. 2009, 64, 1243–1254. [Google Scholar]
- Shannon, C.E. A Mathematical Theory of Communication; University of Illinois Press: Champaign, IL, USA, 1948; Volume 5, pp. 3–55. [Google Scholar]
- Yicheng, Y. Technology and Application of Comprehensive Evaluation System; Metallurgical Industry Press: Beijing, China, 2006. [Google Scholar]
- Qi, Y.; Wen, F.; Wang, K.; Li, L.; Singh, S. A fuzzy comprehensive evaluation and entropy weight decision-making based method for power network structure assessment. Int. J. Eng. Sci. Technol. 2010, 2, 92–99. [Google Scholar] [CrossRef]
- Ai, T. Maps adaptable to represent spatial cognition. J. Remote Sens. 2008, 12, 22. [Google Scholar]
© 2017 by the authors. Licensee MDPI, Basel, Switzerland. This article is an open access article distributed under the terms and conditions of the Creative Commons Attribution (CC BY) license ( http://creativecommons.org/licenses/by/4.0/).