
Land Cover Extraction from High Resolution ZY-3 Satellite Imagery Using Ontology-Based Method


Abstract
:1. Introduction
2. Data and Methods
2.1. Data
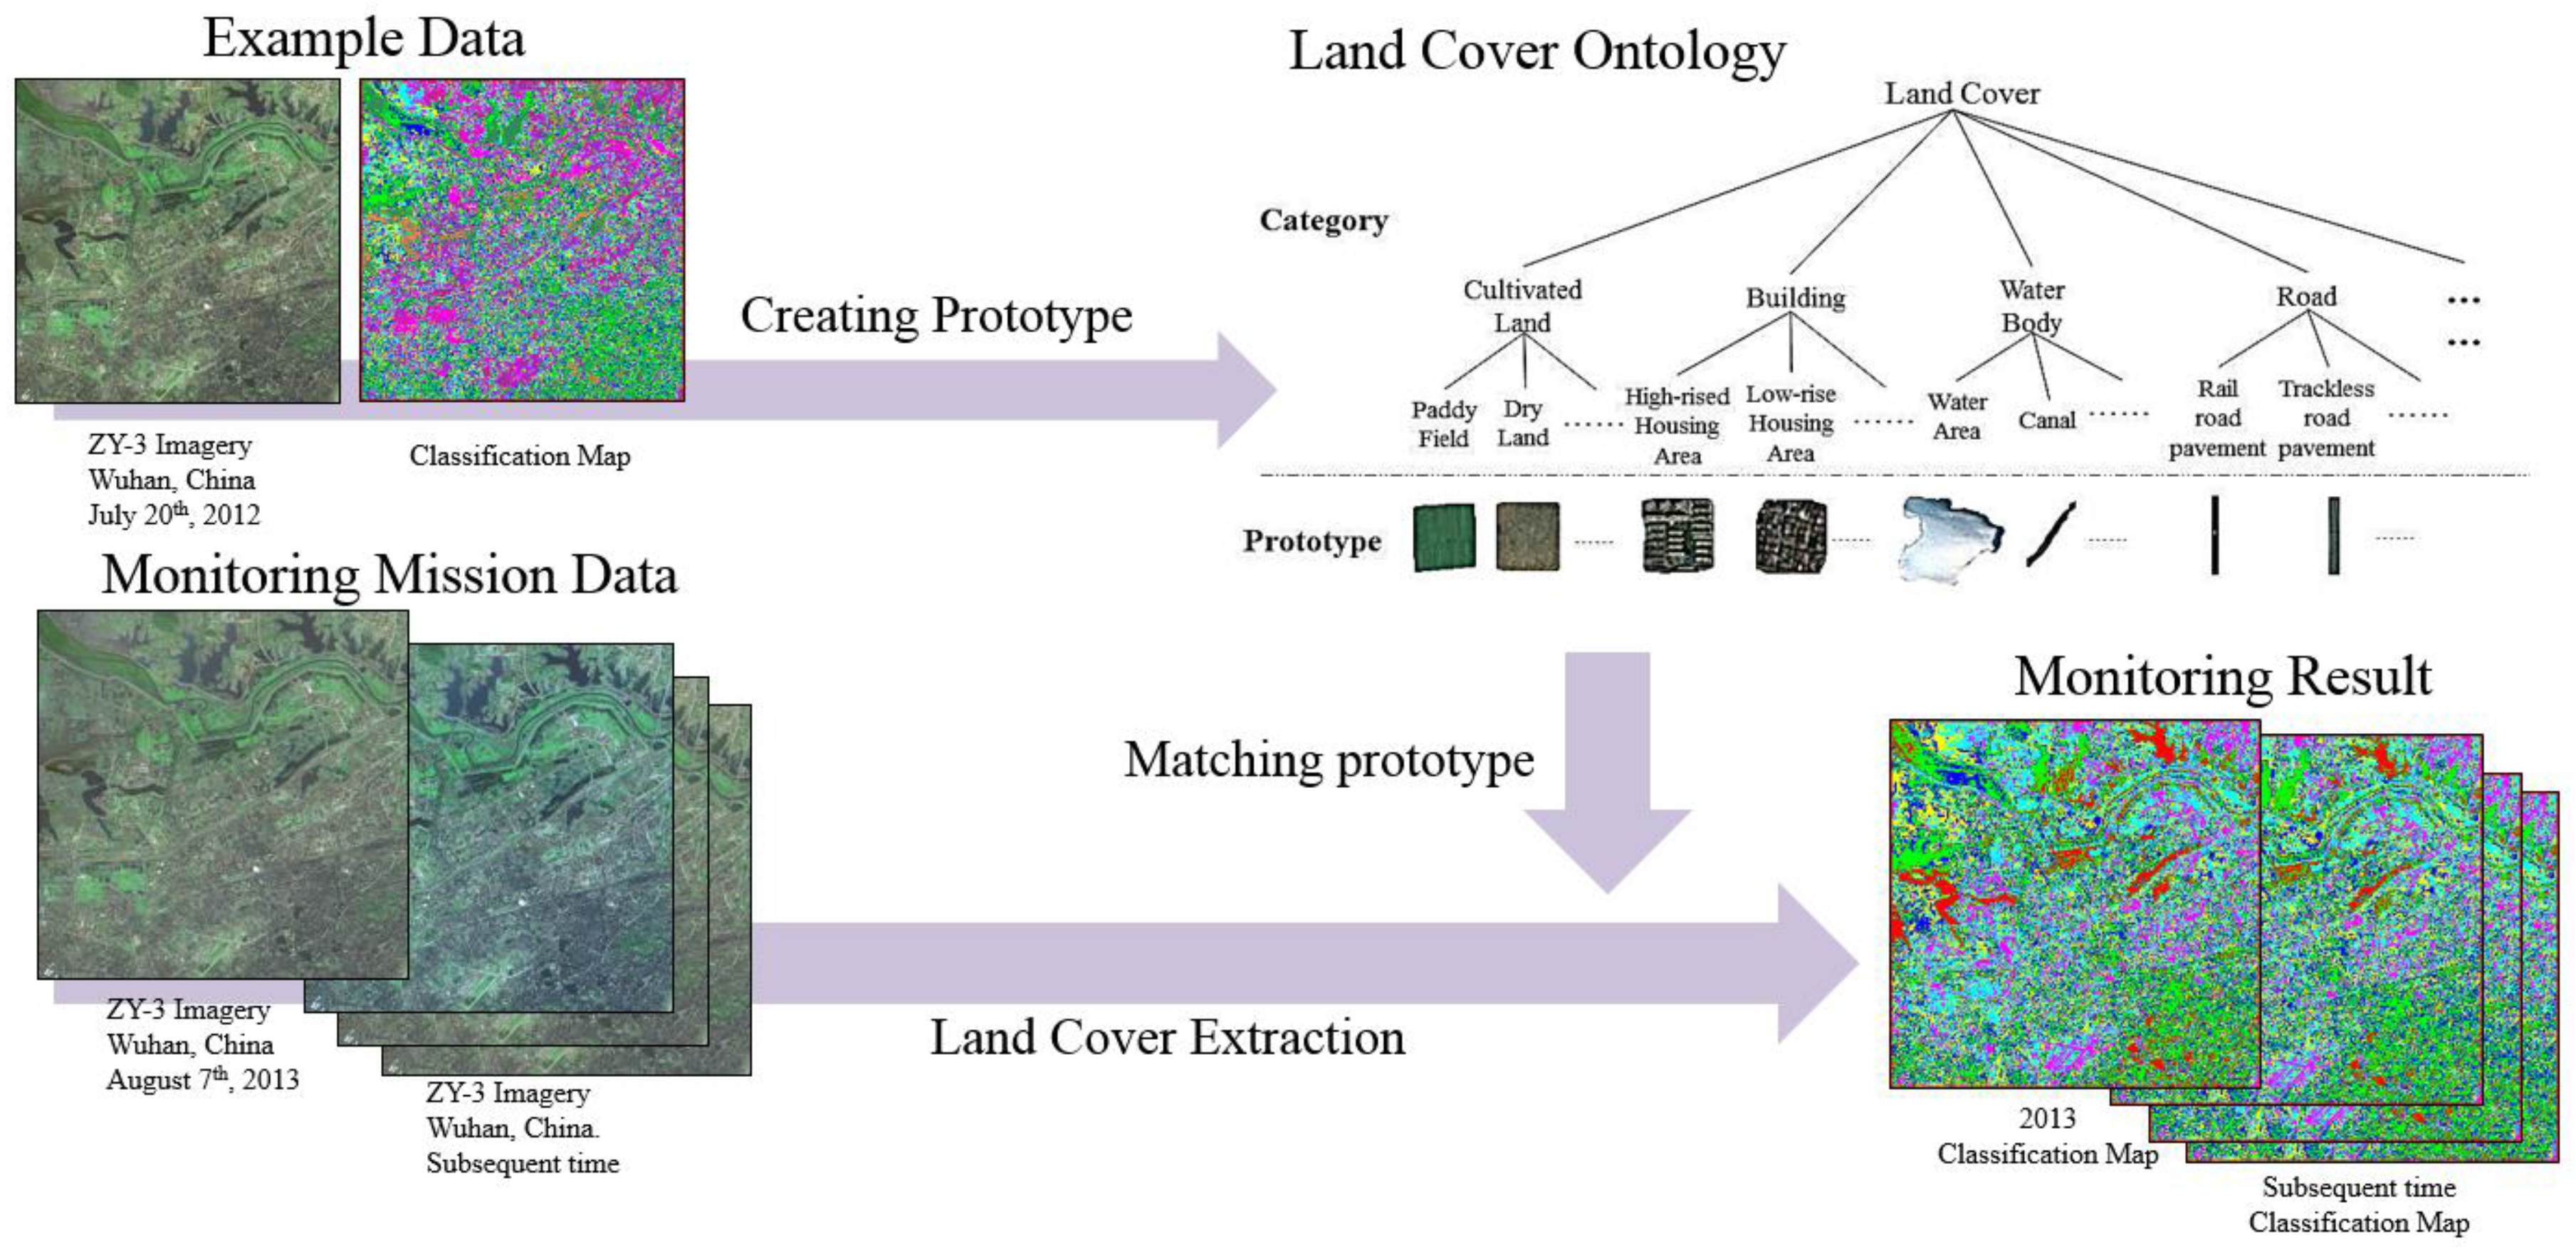
2.2. Methods
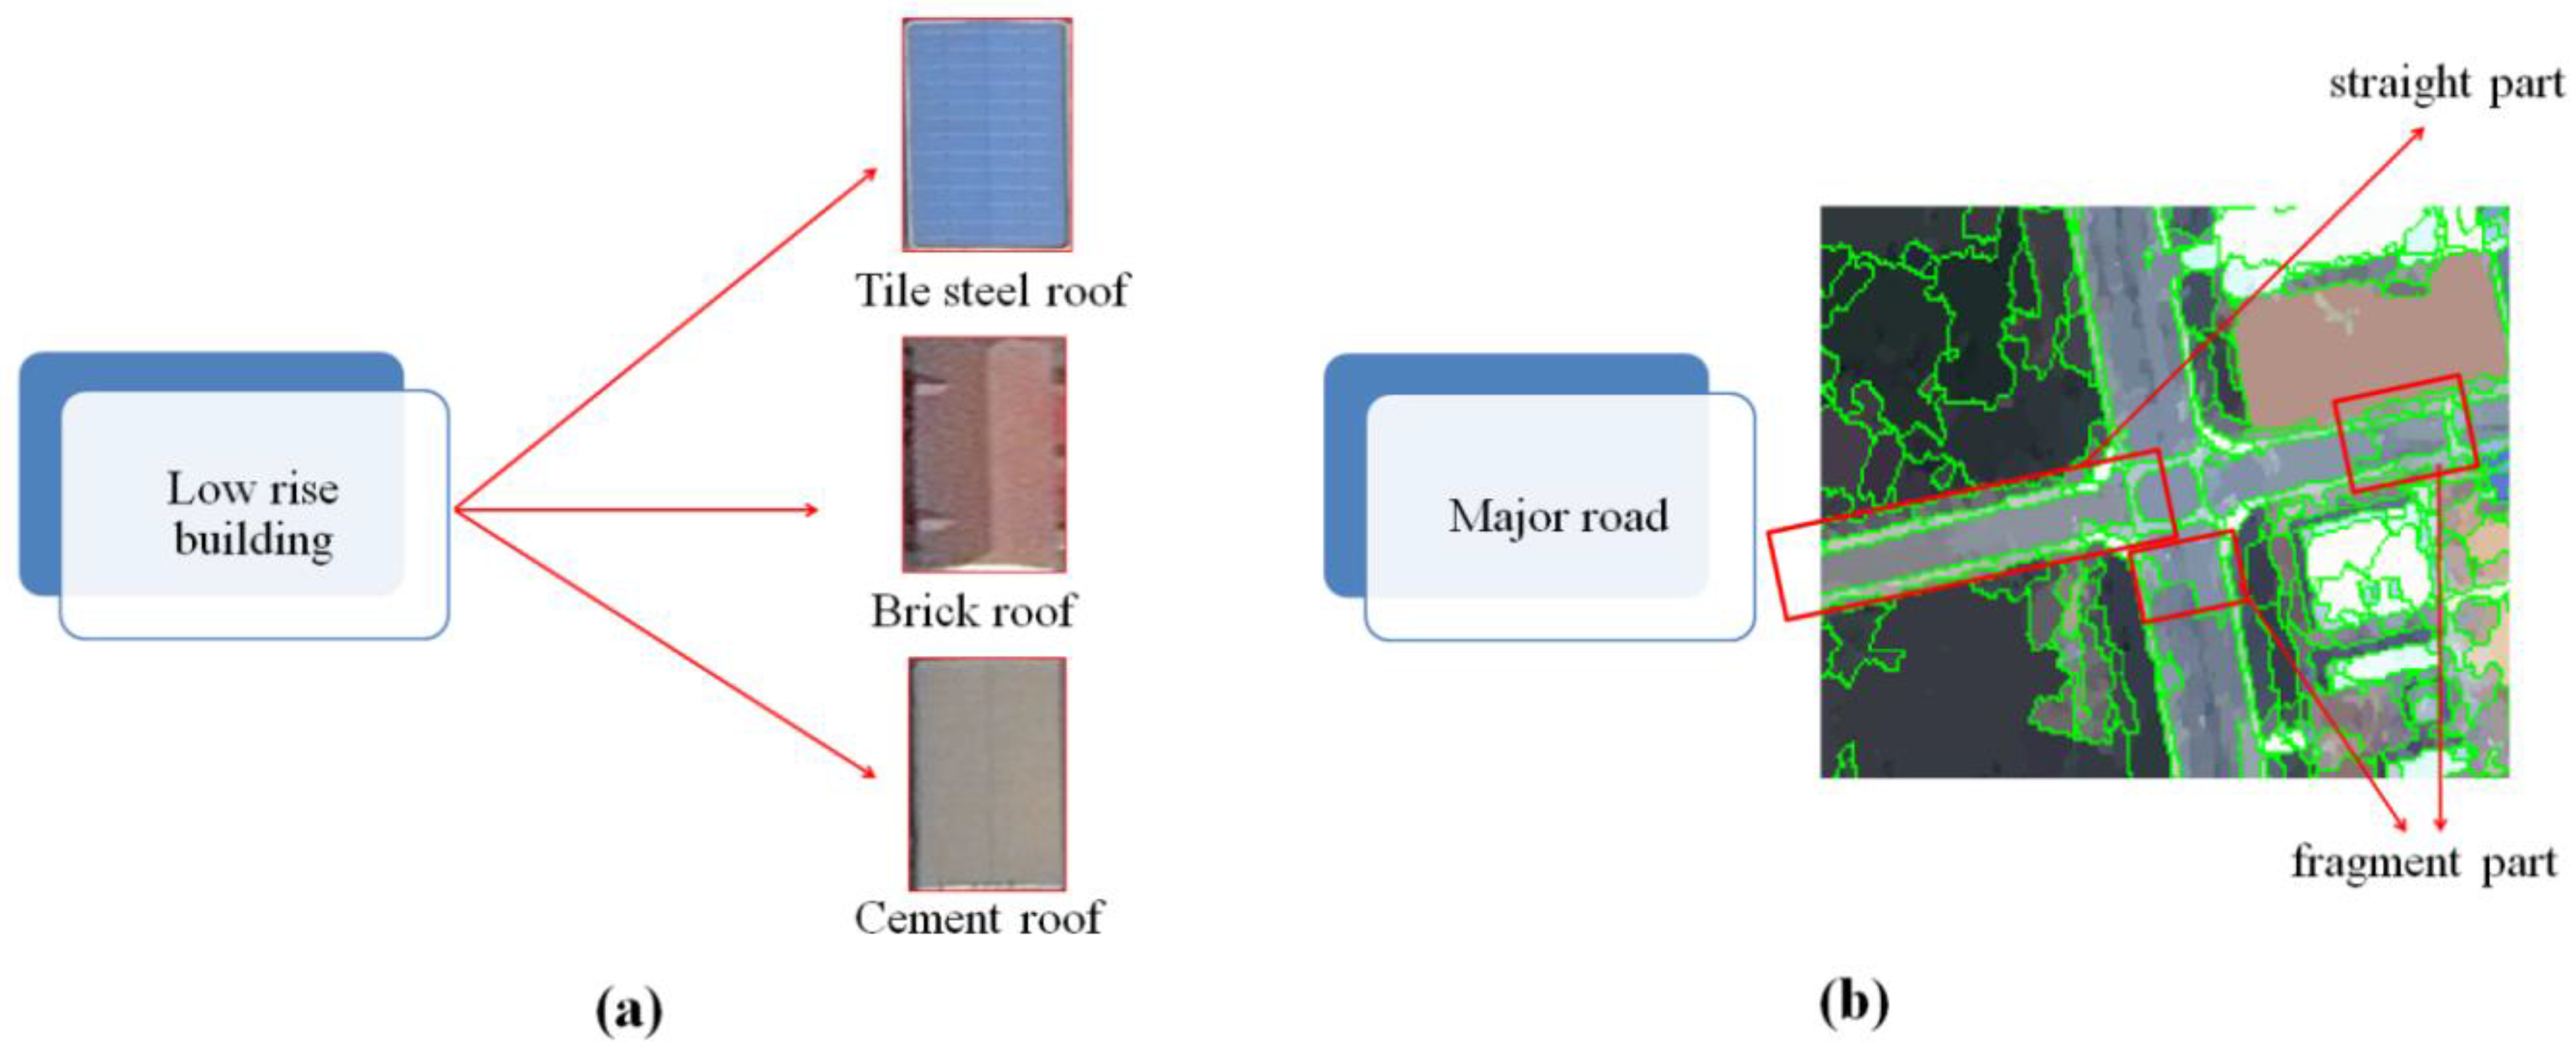
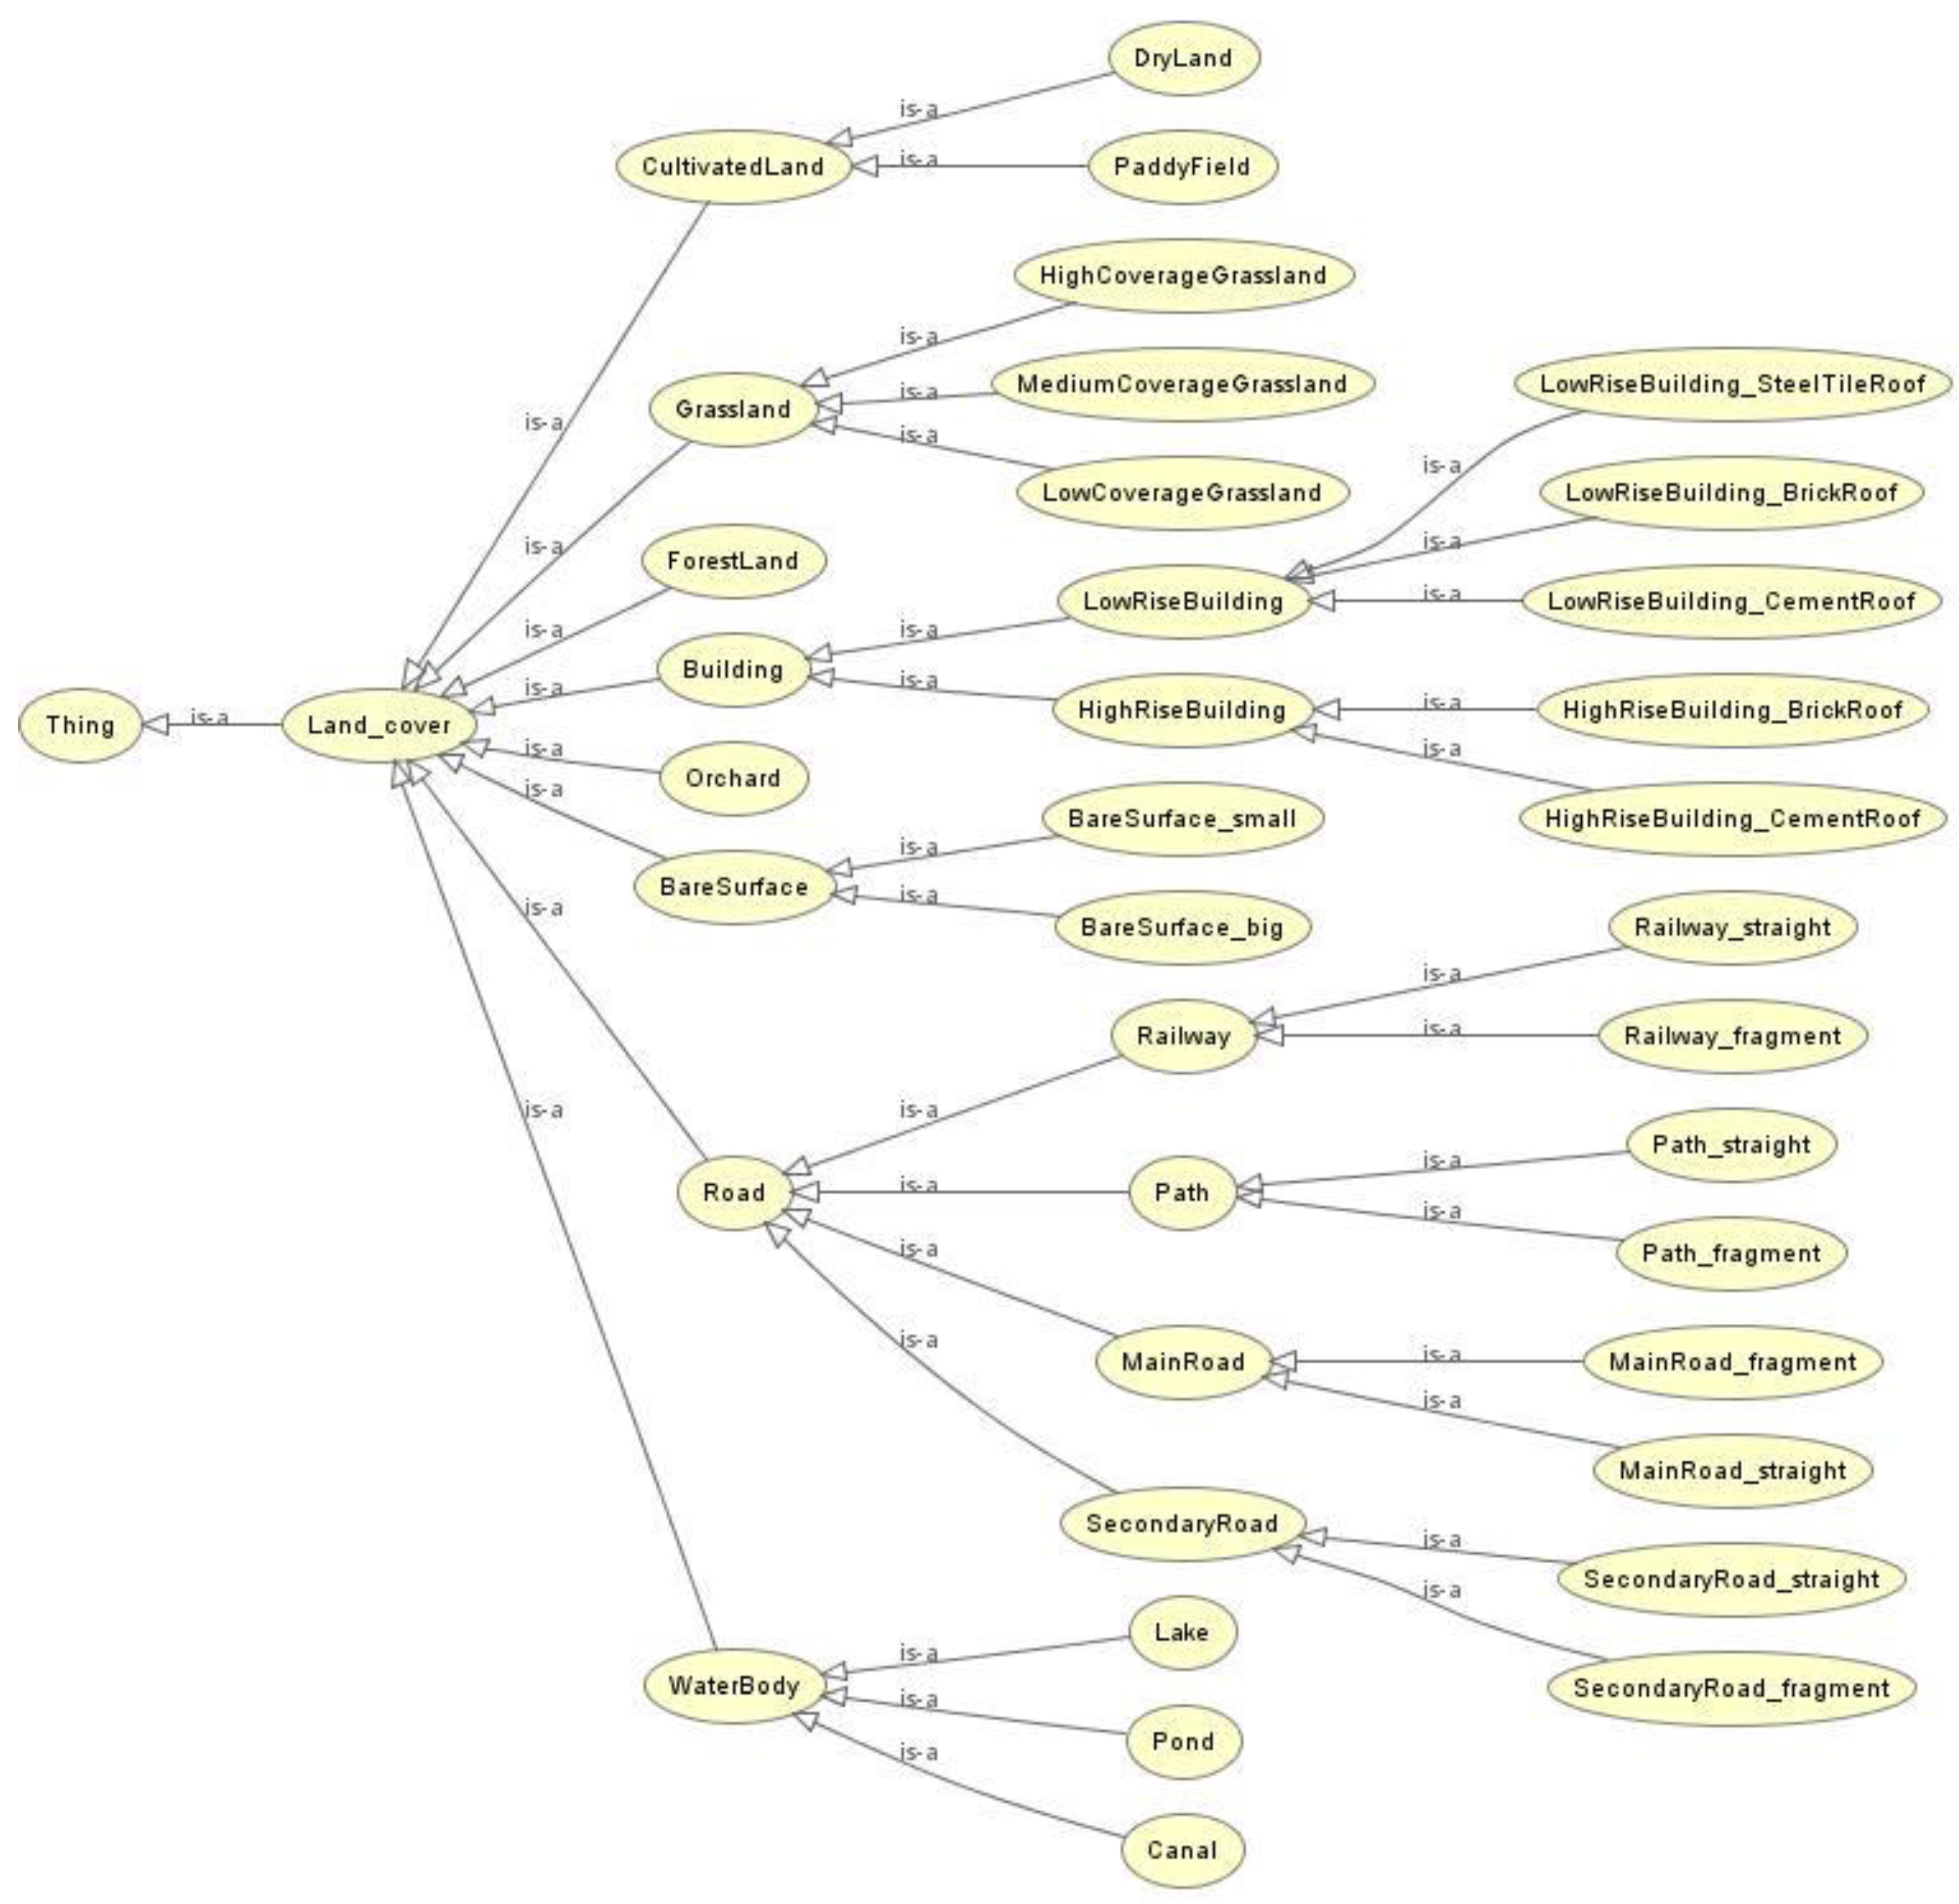
2.2.1. Land Cover Hierarchy
2.2.2. Land Cover Properties
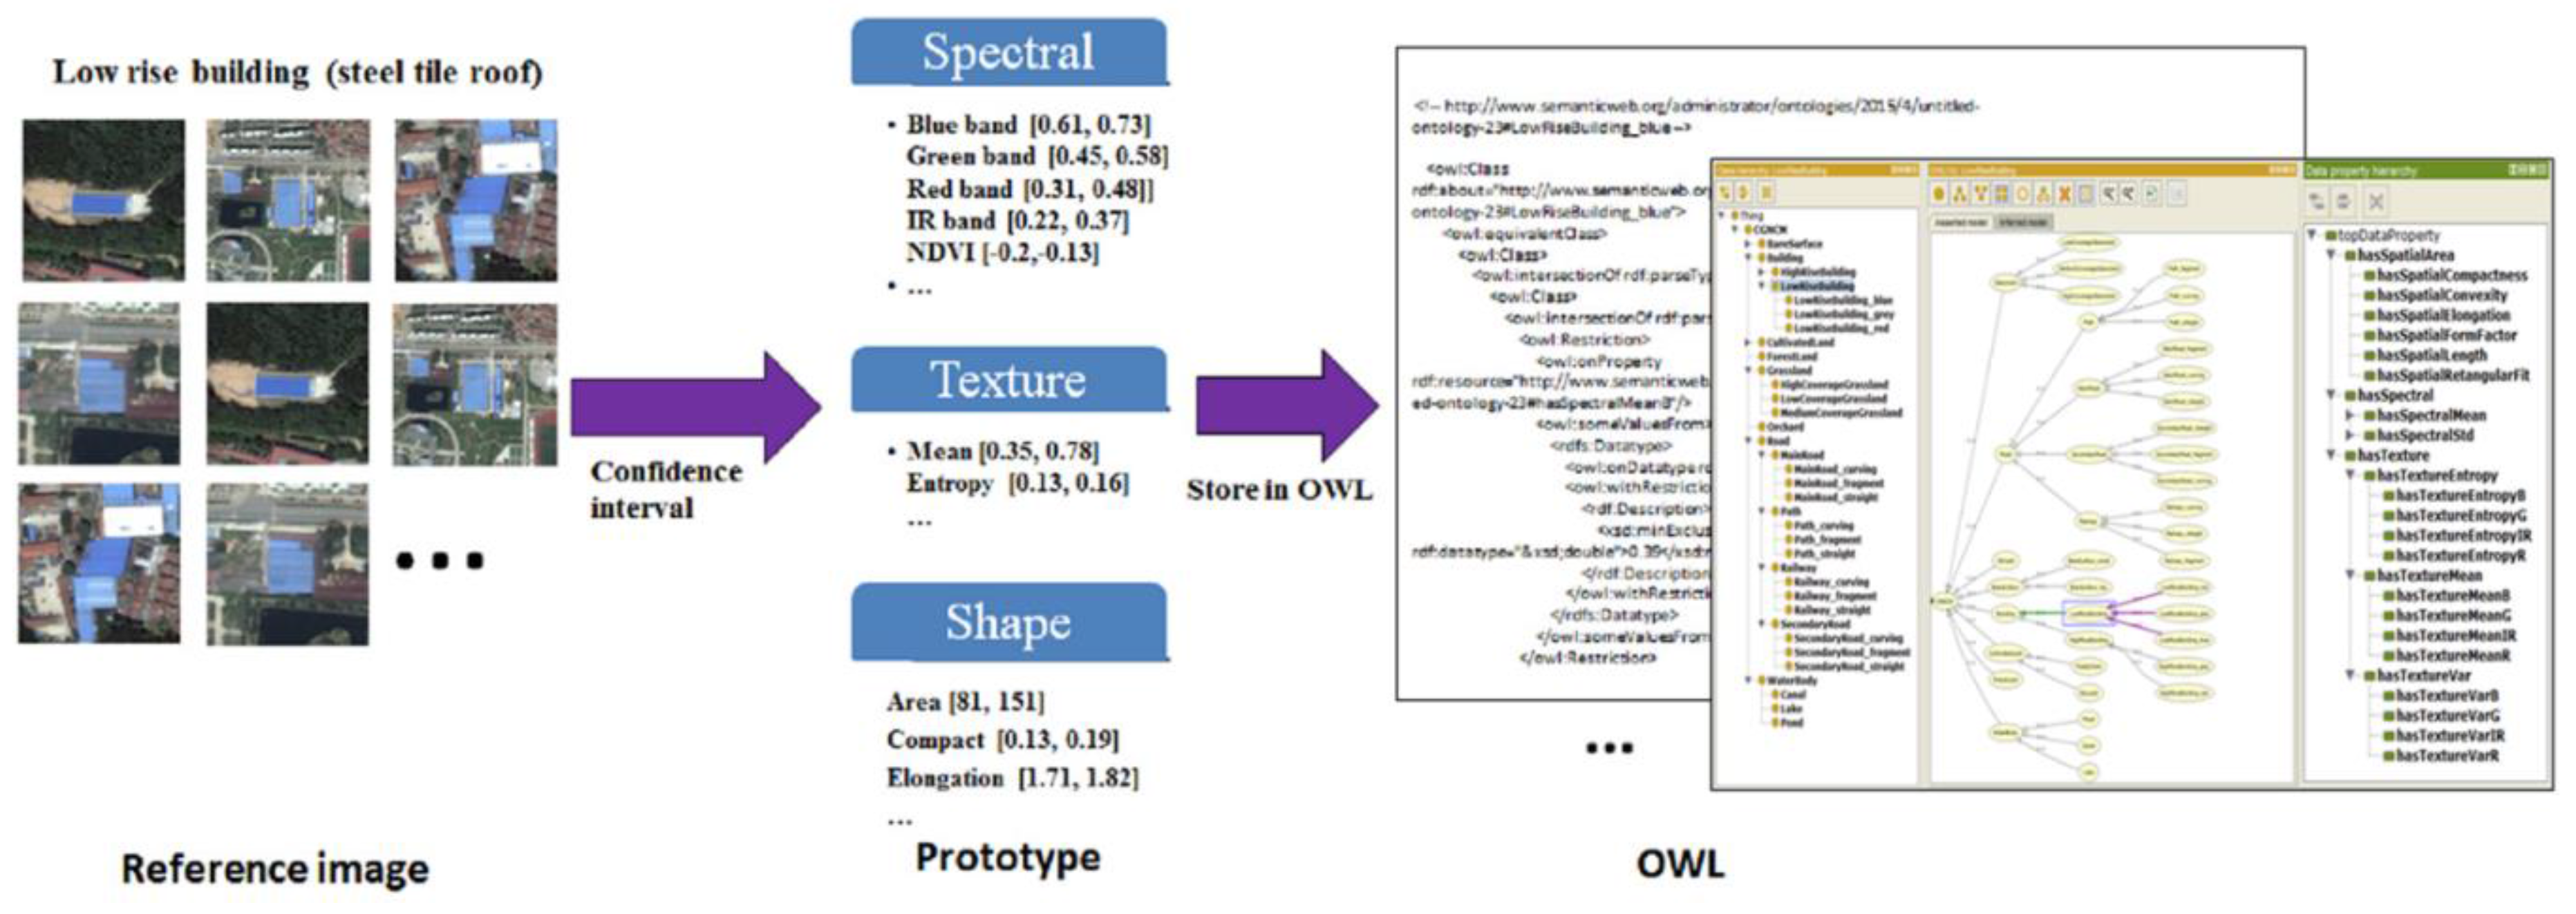
2.2.3. Create Land Cover Class Prototype
2.2.4. Land Cover Extraction
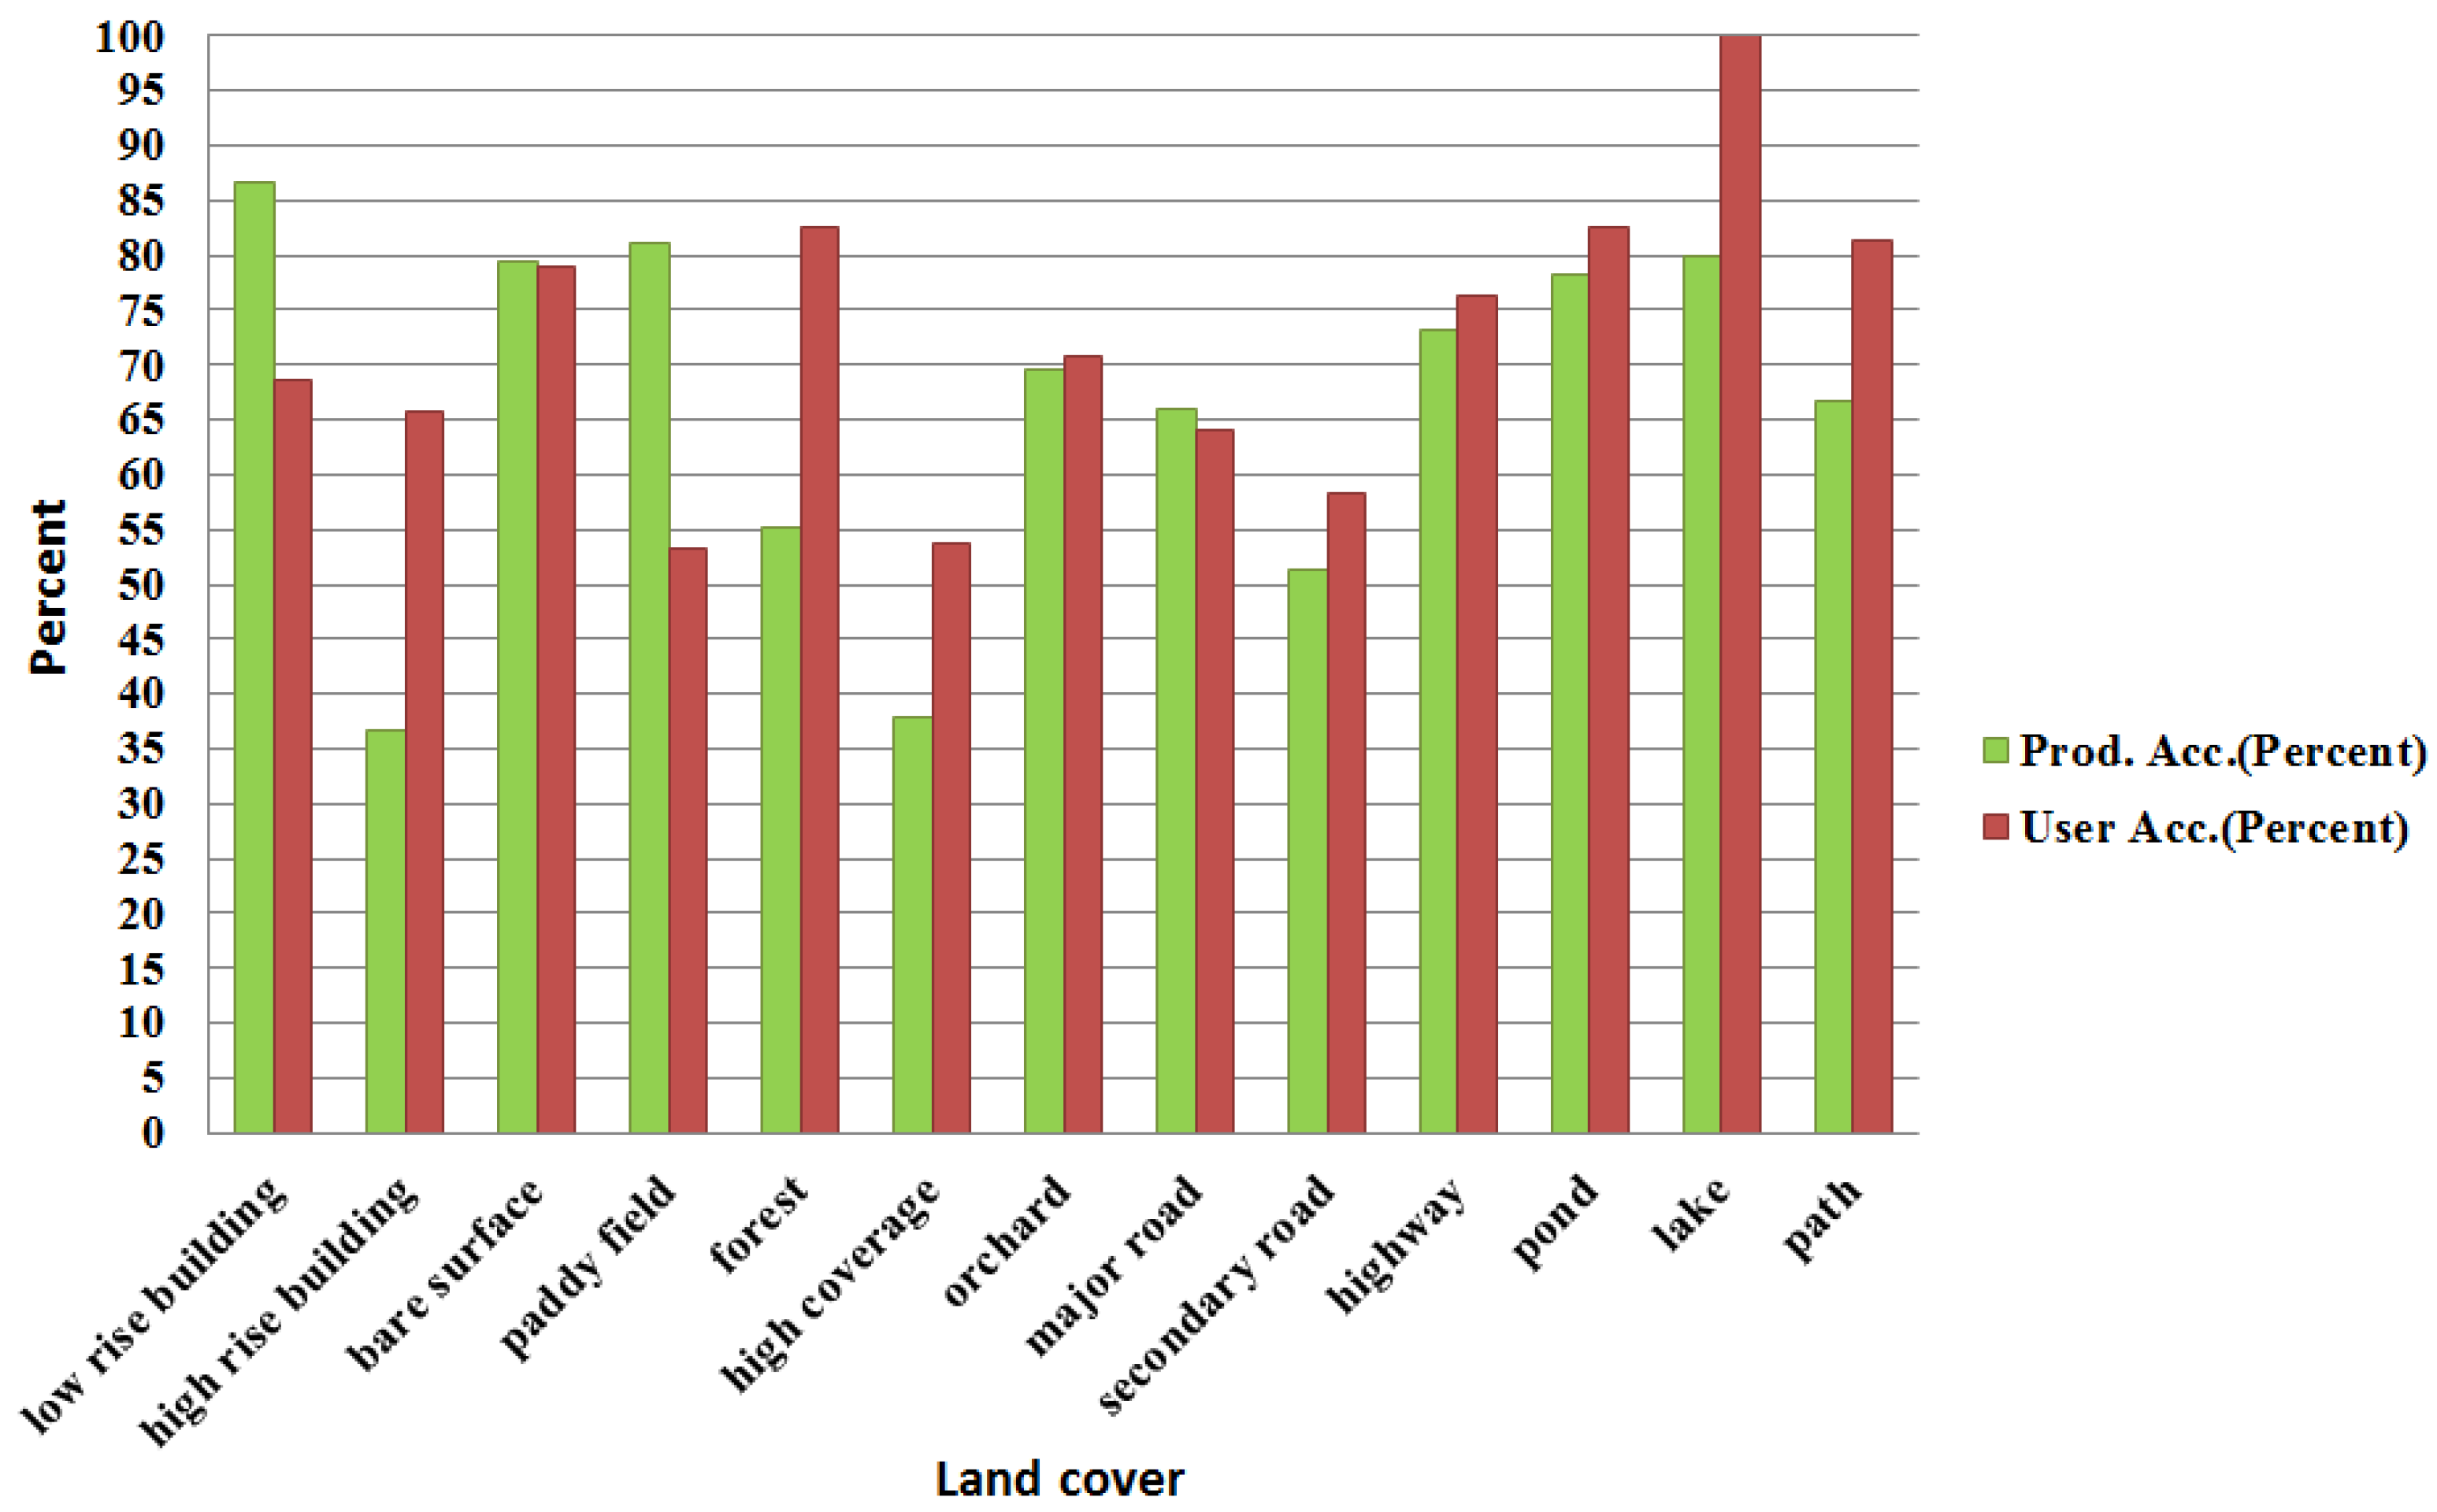
2.2.5. Accuracy Assessment
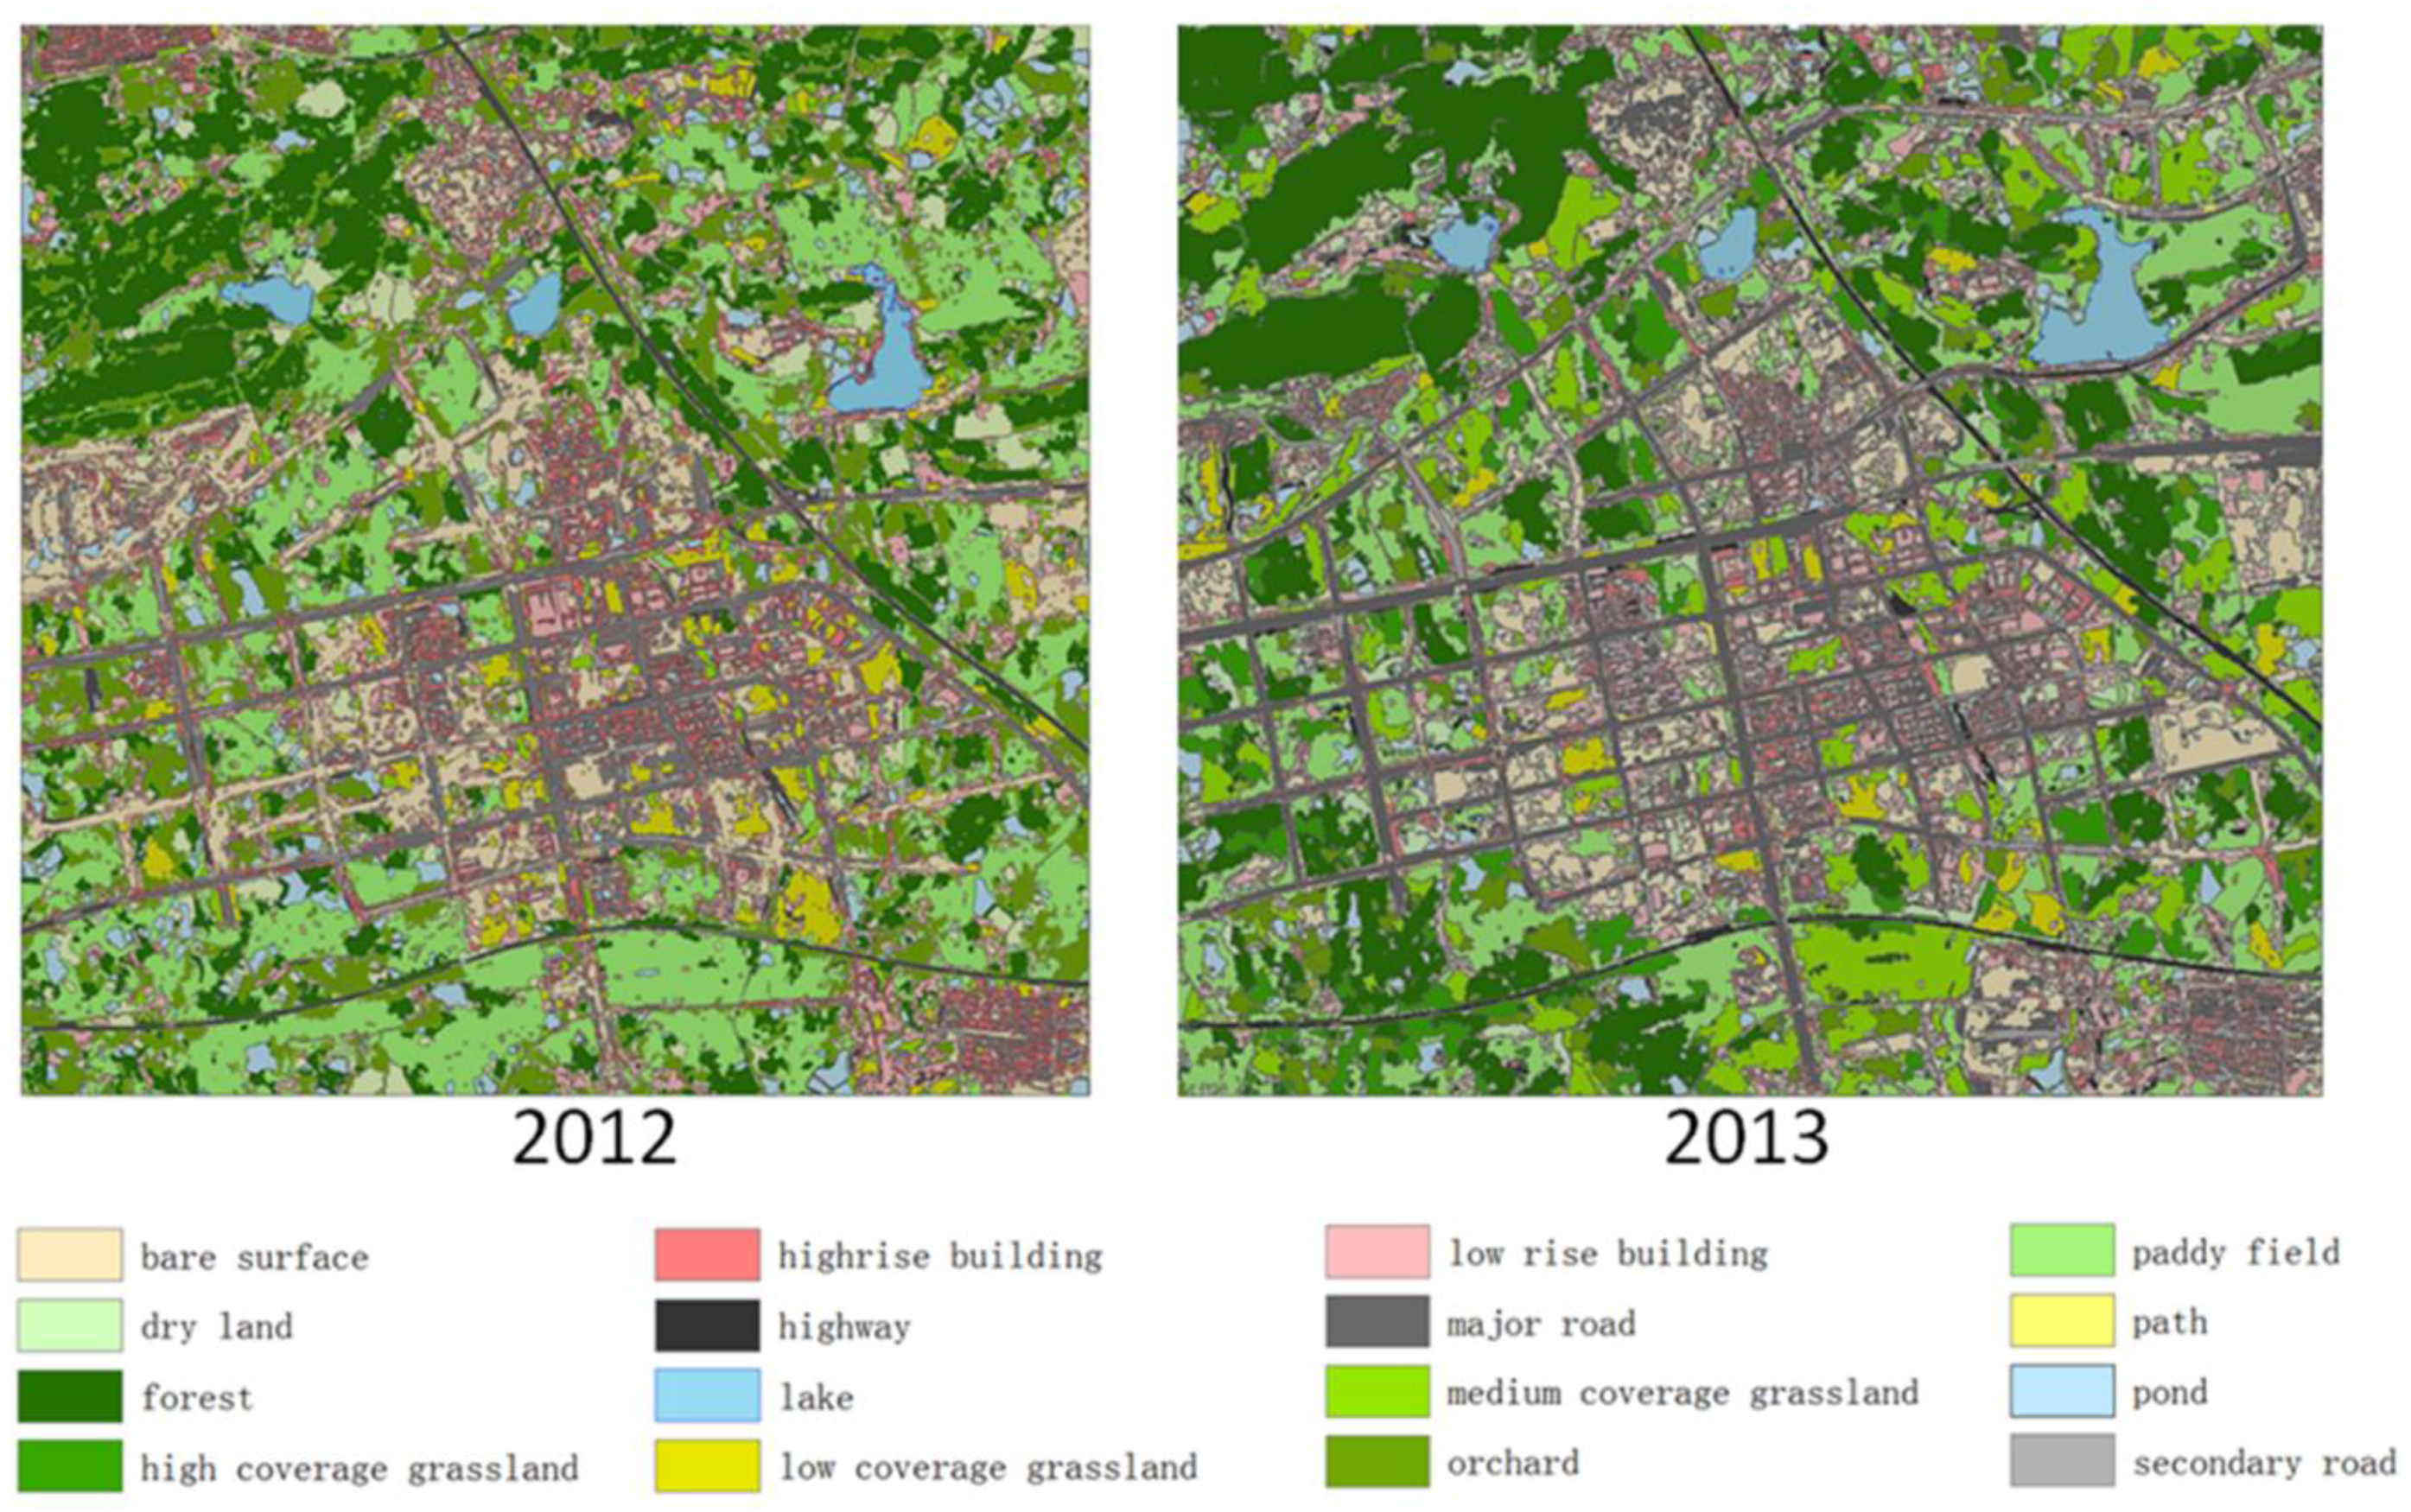
3. Results and Discussion
4. Conclusions
Acknowledgments
Author Contributions
Conflicts of Interest
References
- Andres, S.; Arvor, D.; Pierkot, C. The towards an ontological approach for classifying remote sensing images. In Proceeding of 8th International Conference on Signal Image Technology & Internet Based Systems (Sitis 2012), Naples, FL, USA, 25 November 2012; pp. 825–832.
- Li, D.; Sui, H.; Shan, J. Discussion on key technologies of geogrpahic national condition monitoring. Geomat. Inf. Sci. Wuhan Univ. 2012, 37, 505–512. [Google Scholar]
- Zhou, Q.; Sun, B. Analysis of spatio-temporal pattern and driving force of land cover change using multi-temporal remote sensing images. Sci. China Technol. Sci. 2010, 53, 111–119. [Google Scholar] [CrossRef]
- Ahmed, B.; Ahmed, R. Modeling urban land cover growth dynamics using multi‑temporal satellite images: A case study of dhaka, bangladesh. ISPRS Int. J. Geo-Inf. 2012, 1, 3–31. [Google Scholar] [CrossRef]
- Blaschke, T.; Hay, G.J.; Kelly, M.; Lang, S.; Hofmann, P.; Addink, E.; Feitosa, R.Q.; van der Meer, F.; van der Werff, H.; van Coillie, F.; et al. Geographic object-based image analysis—Towards a new paradigm. ISPRS J. Photogramm. Remote Sens. 2014, 87, 180–191. [Google Scholar] [CrossRef] [PubMed]
- Forestier, G.; Puissant, A.; Wemmert, C.; Gancarski, P. Knowledge-based region labeling for remote sensing image interpretation. Comput. Environ. Urban Syst. 2012, 36, 470–480. [Google Scholar] [CrossRef]
- Baraldi, A.; Boschetti, L. Operational automatic remote sensing image understanding systems: Beyond geographic object-based and object-oriented image analysis (GEOBIA/GEOOIA). Part 1: Introduction. Remote Sens. 2012, 4, 2694–2735. [Google Scholar] [CrossRef]
- Arvor, D.; Durieux, L.; Andres, S.; Laporte, M.A. Advances in geographic object-based image analysis with ontologies: A review of main contributions and limitations from a remote sensing perspective. ISPRS J. Photogramm. Remote Sens. 2013, 82, 125–137. [Google Scholar] [CrossRef]
- Agarwal, P. Contested nature of place: Lnowledge mapping for resolving ontological distinctions between geographical concepts. In Geographic Information Science, Proceedings; Egenhofer, M.J., Freksa, C., Miller, H.J., Eds.; Springer-Verlag Berlin: Berlin, Germany, 2004; pp. 1–21. [Google Scholar]
- Fonseca, F.T.; Egenhofer, M.J.; Agouris, P.; Câmara, G. Using ontologies for integrated geographic information systems. Trans. GIS 2002, 6, 231–257. [Google Scholar] [CrossRef]
- Forestier, G.; Wemmert, C.; Puissant, A. Coastal image interpretation using background knowledge and semantics. Comput. Geosci. 2013, 54, 88–96. [Google Scholar] [CrossRef]
- Durand, N.; Derivaux, S.; Forestier, G.; Wemmert, C.; Gancarski, P.; Boussaid, O.; Puissant, A. Ontology-based object recognition for remote sensing image interpretation. In Proceedings of the 19th IEEE International Conference on Tools with Artificial Intelligence (ICTAI 2007), Patras, Greece, 29–31 October 2007; pp. 472–479.
- Hashimoto, S.; Tadono, T.; Onosato, M.; Hori, M.; Moriyama, T.; IEEE. A Framework of Ontology-Based Knowledge Information Processing for Change Detection in Remote Sensing Data; IEEE: New York, NY, USA, 2011; pp. 3927–3930. [Google Scholar]
- Jensen, J.R. Remote Sensing of the Environment: An Earth Resource Perspective; Pearson Prentice Hall: Upper Saddle River, NJ, USA, 2009. [Google Scholar]
- Wang, H.; Li, L.; Mei, Y.; Song, P.C. Concepts' Relationship of Geo-Ontology; Publishing House Electronics Industry: Beijing, China, 2008; pp. 217–221. [Google Scholar]
- Tonjes, R.; Growe, S.; Buckner, J.; Liedtke, C.E. Knowledge-based interpretation of remote sensing images using semantic nets. Photogramm. Eng. Remote Sens. 1999, 65, 811–821. [Google Scholar]
- Rejichi, S.; Chaabane, F.; Tupin, F. Expert knowledge-based method for satellite image time series analysis and interpretation. IEEE J. Sel. Top. Appl. Earth Obs. Remote Sens. 2015, 8, 2138–2150. [Google Scholar] [CrossRef]
- Galotti, K.M. Cognitive Psychology in and out of the Laboratory; SAGE: Thousand Oaks, CA, USA, 2013. [Google Scholar]
- Medin, D.L.; Smith, E.E. Concepts and concept formation. Annu. Rev. psychol. 1984, 35, 113–138. [Google Scholar] [CrossRef] [PubMed]
- Li, L.; Luo, H.; She, M.Y.; Zhu, H.H. User-oriented image quality assessment of zy-3 satellite imagery. IEEE J. Sel. Top. Appl. Earth Observ. Remote Sens. 2014, 7, 4601–4609. [Google Scholar] [CrossRef]
- Song, C.; Woodcock, C.E.; Seto, K.C.; Lenney, M.P.; Macomber, S.A. Classification and change detection using Landsat TM data: When and how to correct atmospheric effects? Remote Sens. Environ. 2001, 75, 230–244. [Google Scholar] [CrossRef]
- Li, L.; Wang., H. Classification of fundamental geographic information based on formal ontology. Geomat. Inf. Sci. Wuhan Univ. 2006, 31, 253–256. [Google Scholar]
- Puissant, A.; Durand, N.; Sheeren, D.; Weber, C.; Gancarski, P. Urban ontology for semantic interpretation of multi-source images, 2nd. In Proceeding of Workshop Ontologies for Urban Development: Conceptual Models for Practitioners, Castello del Valentino, Turin, Italy, 18 October 2007.
- ITT-Visual Information Solutions. ENVI EX User Guide; ITT-Visual Information Solutions: Boulder, CO, USA, 2010. [Google Scholar]
- Jansen, L.J.M.; Carrai, G.; Morandini, L.; Cerutti, P.O.; Spisni, A. Analysis of the spatio-temporal and semantic aspects of land-cover/use change dynamics 1991–2001 in albania at national and district levels. Environ. Monit. Assess. 2006, 119, 107–136. [Google Scholar] [CrossRef] [PubMed]
- Lang, S. Object-based image analysis for remote sensing applications: Modeling reality–dealing with complexity. In Object-Based Image Analysis; Blaschke, T., Lang, S., Hay, G., Eds.; Springer: Berlin/Heidelberg, Germany, 2008; pp. 3–27. [Google Scholar]
- Agarwal, P. Ontological considerations in giscience. Int. J. Geogr. Inf. Sci. 2005, 19, 501–536. [Google Scholar] [CrossRef]
- Mark, D.; Smith, B.; Egenhofer, M.; Hirtle, S. Ontological foundations for geographic information science. Res. Chall. Geogr. Inf. Sci. 2004, 28, 335–350. [Google Scholar]


| Producer’s Accuracy (Percent) | User’s Accuracy (Percent) | Producer’s Accuracy (Pixels) | User’s Accuracy (Pixels) | |
|---|---|---|---|---|
| low rise building | 86.52 | 68.63 | 1,055,969/1,220,546 | 1,055,969/1,538,703 |
| high rise building | 36.69 | 65.77 | 142,552/388,494 | 142,552/216,754 |
| bare surface | 79.32 | 78.93 | 600,345/756,900 | 600,345/760,630 |
| paddy field | 81.18 | 53.27 | 1,494,710/1,841,225 | 1,494,710/2,805,795 |
| forest | 55.13 | 82.66 | 374,772/679,774 | 374,772/453,379 |
| grassland | 37.94 | 53.64 | 344,088/906,900 | 344,088/641,489 |
| orchard | 69.66 | 70.84 | 847,717/1,217,009 | 847,717/1,196,624 |
| major road | 65.88 | 64.14 | 275,216/417,722 | 275,216/429,090 |
| secondary road | 51.35 | 58.19 | 170,437/331,885 | 170,437/292,911 |
| highway | 73.09 | 76.34 | 101,251/138,538 | 101,251/132,637 |
| pond | 78.31 | 82.62 | 321,176/410,127 | 321,176/388,728 |
| lake | 79.81 | 100 | 66,633/83,489 | 66,633/66,633 |
| path | 66.77 | 81.26 | 62,265/93,256 | 62,265/76,627 |
| Low-Rise Building | High-Rise Building | Bare Surface | Dry Land | Paddy Field | Forest | Grassland | Orchard | Major Road | Secondary Road | Highway | Pond | Lake | Path | |
|---|---|---|---|---|---|---|---|---|---|---|---|---|---|---|
| low-rise building | 1,055,969 | 86,974 | 25,106 | 83,868 | 63,052 | 0 | 56,957 | 49,357 | 38,384 | 26,738 | 8898 | 27,893 | 0 | 15,507 |
| high-rise building | 16,715 | 142,552 | 5970 | 0 | 0 | 0 | 2664 | 550 | 10,268 | 34,816 | 1126 | 1402 | 0 | 691 |
| bare surface | 25,421 | 6768 | 600,345 | 0 | 0 | 0 | 37,728 | 0 | 33,920 | 55,464 | 800 | 0 | 0 | 184 |
| dry land | 0 | 0 | 0 | 337,591 | 0 | 0 | 0 | 0 | 0 | 0 | 0 | 0 | 0 | 0 |
| paddy field | 7895 | 0 | 0 | 0 | 1,494,710 | 237,658 | 406,394 | 274,889 | 0 | 0 | 3752 | 42,225 | 0 | 681 |
| forest | 0 | 0 | 0 | 0 | 39,514 | 37,4772 | 8343 | 30,750 | 0 | 0 | 0 | 0 | 0 | 0 |
| grassland | 77,049 | 55,646 | 75,471 | 30,484 | 13,411 | 0 | 344,088 | 13,728 | 13,271 | 1846 | 1963 | 14,532 | 0 | 0 |
| orchard | 2494 | 0 | 0 | 46,076 | 219,525 | 67,344 | 11,508 | 847,717 | 0 | 0 | 0 | 229 | 0 | 1731 |
| major road | 16,548 | 56,146 | 17,421 | 0 | 0 | 0 | 12,872 | 0 | 275,216 | 39,783 | 8505 | 2599 | 0 | 0 |
| secondary road | 4398 | 33,695 | 32,587 | 0 | 0 | 0 | 1133 | 0 | 38,221 | 170,437 | 5288 | 71 | 0 | 7081 |
| highway | 766 | 0 | 0 | 4225 | 0 | 0 | 14,583 | 0 | 5527 | 1169 | 101,251 | 0 | 0 | 5116 |
| pond | 12,612 | 6713 | 0 | 4453 | 11,013 | 0 | 10,630 | 0 | 1789 | 63 | 3423 | 32,1176 | 16856 | 0 |
| lake | 0 | 0 | 0 | 0 | 0 | 0 | 0 | 0 | 0 | 0 | 0 | 0 | 66633 | 0 |
| path | 679 | 0 | 0 | 7438 | 0 | 0 | 0 | 18 | 1126 | 1569 | 3532 | 0 | 0 | 62265 |
| Initial State (2012) | |||||||||||||||
|---|---|---|---|---|---|---|---|---|---|---|---|---|---|---|---|
| Low-Rise Building | High-Rise Building | Bare Surface | Dry Land | Paddy Field | Forest | Grassland | Orchard | Major Road | Secondary Road | Highway | Pond | Lake | Path | ||
| Final State (2013) | low-rise building | 3,810,250 | 28,401 | 489,732 | 135,472 | 845,799 | 15,592 | 19,078 | 901 | 134 | 363 | 14 | 97,099 | 451 | 4568 |
| high-rise building | 43,259 | 491,031 | 290,012 | 356 | 133,422 | 43,890 | 10,656 | 821 | 491 | 773 | 29 | 24,712 | 32 | 4380 | |
| bare surface | 35,460 | 27,072 | 889,621 | 213 | 47,620 | 8876 | 8899 | 1101 | 8098 | 2501 | 101 | 104,231 | 5892 | 5411 | |
| dry land | 49 | 23 | 245 | 1,198,031 | 7801 | 3667 | 9297 | 459 | 219 | 0 | 33 | 3871 | 678 | 54 | |
| paddy field | 32 | 88 | 21 | 810 | 4,911,230 | 10,092 | 1320 | 710,472 | 41 | 0 | 9 | 9290 | 4431 | 8803 | |
| forest | 0 | 97 | 7901 | 112 | 22,143 | 1,098,044 | 78,912 | 121,010 | 191 | 0 | 231 | 8451 | 65 | 763 | |
| grassland | 4862 | 2450 | 17,209 | 121,936 | 53,644 | 121,449 | 1,209,092 | 54,912 | 541 | 7384 | 302 | 1190 | 99 | 8112 | |
| orchard | 1132 | 551 | 3221 | 67,540 | 67,452 | 269,376 | 46,032 | 2,199,817 | 881 | 0 | 13 | 567 | 12 | 342 | |
| major road | 208,754 | 19,786 | 684,218 | 23,100 | 11,846 | 1456 | 50,211 | 341 | 800,842 | 159,132 | 871 | 10,396 | 3321 | 6601 | |
| secondary road | 148,883 | 34,592 | 468,902 | 450 | 10,002 | 778 | 4532 | 667 | 45,101 | 181,413 | 877 | 34,582 | 7643 | 4531 | |
| highway | 3064 | 5152 | 199,802 | 16,900 | 5687 | 908 | 10,123 | 109 | 781 | 4676 | 359,901 | 50,391 | 243 | 3901 | |
| pond | 16 | 887 | 490 | 17,812 | 1024 | 33 | 3451 | 0 | 0 | 252 | 45 | 978,601 | 32,321 | 51 | |
| lake | 0 | 0 | 248 | 119 | 45 | 8 | 211 | 8 | 0 | 0 | 0 | 3451 | 266,532 | 0 | |
| path | 3679 | 341 | 6824 | 678 | 3290 | 108 | 1199 | 890 | 41 | 6276 | 46 | 89 | 32 | 249,060 | |
| Class changes | 449,190 | 119,440 | 2,168,825 | 385,498 | 1,209,775 | 476,233 | 243,921 | 891,691 | 56,519 | 181,357 | 2571 | 348,320 | 55,220 | 47,517 | |
| Image difference | 1,188,414 | 433,393 | –1,913,350 | −359,102 | −464,366 | −236,357 | 150,169 | −434,572 | 1,123,514 | 580,183 | 299,166 | −291,938 | −51,130 | −24,024 | |
© 2016 by the authors; licensee MDPI, Basel, Switzerland. This article is an open access article distributed under the terms and conditions of the Creative Commons by Attribution (CC-BY) license (http://creativecommons.org/licenses/by/4.0/).
Share and Cite
Luo, H.; Li, L.; Zhu, H.; Kuai, X.; Zhang, Z.; Liu, Y. Land Cover Extraction from High Resolution ZY-3 Satellite Imagery Using Ontology-Based Method. ISPRS Int. J. Geo-Inf. 2016, 5, 31. https://doi.org/10.3390/ijgi5030031
Luo H, Li L, Zhu H, Kuai X, Zhang Z, Liu Y. Land Cover Extraction from High Resolution ZY-3 Satellite Imagery Using Ontology-Based Method. ISPRS International Journal of Geo-Information. 2016; 5(3):31. https://doi.org/10.3390/ijgi5030031
Chicago/Turabian StyleLuo, Heng, Lin Li, Haihong Zhu, Xi Kuai, Zhijun Zhang, and Yu Liu. 2016. "Land Cover Extraction from High Resolution ZY-3 Satellite Imagery Using Ontology-Based Method" ISPRS International Journal of Geo-Information 5, no. 3: 31. https://doi.org/10.3390/ijgi5030031
APA StyleLuo, H., Li, L., Zhu, H., Kuai, X., Zhang, Z., & Liu, Y. (2016). Land Cover Extraction from High Resolution ZY-3 Satellite Imagery Using Ontology-Based Method. ISPRS International Journal of Geo-Information, 5(3), 31. https://doi.org/10.3390/ijgi5030031