Abstract
In recent years, cellular floating vehicle data (CFVD) has been a popular traffic information estimation technique to analyze cellular network data and to provide real-time traffic information with higher coverage and lower cost. Therefore, this study proposes vehicle positioning and speed estimation methods to capture CFVD and to track mobile stations (MS) for intelligent transportation systems (ITS). Three features of CFVD, which include the IDs, sequence, and cell dwell time of connected cells from the signals of MS communication, are extracted and analyzed. The feature of sequence can be used to judge urban road direction, and the feature of cell dwell time can be applied to discriminate proximal urban roads. The experiment results show the accuracy of the proposed vehicle positioning method, which is 100% better than other popular machine learning methods (e.g., naive Bayes classification, decision tree, support vector machine, and back-propagation neural network). Furthermore, the accuracy of the proposed method with all features (i.e., the IDs, sequence, and cell dwell time of connected cells) is 83.81% for speed estimation. Therefore, the proposed methods based on CFVD are suitable for detecting the status of urban road traffic.
1. Introduction
In the last few years, a technical explosion has revolutionized and supported transportation management and control for intelligent transportation systems (ITS). ITS can estimate and obtain traffic information (e.g., traffic flow, traffic density, and vehicle speed) to road users and managers for the improvement of service levels of the road network. The traffic information can be collected and estimated by three approaches, which include: (1) vehicle detection (VD) [1,2,3]; (2) global positioning system (GPS)-equipped probe car reporting [4,5,6,7]; and (3) cellular floating vehicle data (CFVD) [8]. However, vehicle data (VD) has high establishment and maintenance costs. GPS-equipped probe car reporting has a low accuracy rate when the penetration rate of GPS-equipped probe cars is too low. The CFVD can be obtained from mobile phones, which have high penetration in many countries [9], and some studies pointed that CFVD could be used to estimate traffic status with high accuracy [10,11,12,13,14,15,16,17,18,19,20,21,22,23,24,25,26,27]. Collecting traffic information using CFVD is economic and low cost.
For traffic information estimation based on CFVD, some studies proposed methods to analyze the signals of received signal strength indications (RSSIs), handoffs (HOs), call arrivals (CAs), normal location updates (NLUs), periodical location updates (PLUs), routing area updates (RAUs), and tracking area updates (TAUs). These studies illustrated that higher accuracies of traffic information estimation were performed by using CFVD for highways [10,11,12,13,14,15,16,17,18,19,20,21,22,23,24,25,26,27]. However, these studies assumed that vehicles can be tracked to the correct route, but the determination of the correct route driven by the user of a mobile station (MS) is difficult and has not been investigated, especially for urban roads.
Therefore, this study proposes a vehicle positioning method to capture CFVD and to track MSs for ITS. Three features of CFVD, which include the IDs, sequence, and cell dwell time of connected cells from the signals of MS communications, are extracted and analyzed. The feature of sequence can be used to judge urban road direction, and the feature of cell dwell time can be applied to discriminate proximal urban roads. Furthermore, this study proposes a vehicle speed estimation method to analyze these three features of CFVD (e.g., IDs, sequence, and cell dwell time of connected cells) for obtaining the real-time estimated vehicle speed.
The rest of this study is organized as follows: the literature reviews of cellular network architecture, CFVD, and traffic information estimation are presented in Section 2; Section 3 proposes a vehicle positioning method based on CFVD to analyze the signals of a mobile phone in a car which is driven on urban roads; a speed estimation method is proposed to measure the speed of the mobile phone in a car according to CFVD in Section 4; the experimental results and discussions are illustrated in Section 5; and Section 6 gives conclusions and discusses future work.
2. Research Background and Related Work
In this section, three subsections, which include cellular networks, CFVD, and traffic information estimation, are discussed for the estimation of traffic information based on CFVD.
2.1. Cellular Networks
This subsection describes the signals and interfaces of cellular networks, which include Global System for Mobile Communications (GSM), General Packet Radio Service (GPRS), Universal Mobile Telecommunications System (UMTS), and Long-Term Evolution (LTE). For circuit-switching networks, MSs can perform the signals of HOs, CAs, NLUs, and PLUs through the A-interface in GSM and through the IuCS-interface in UMTS. For packet-switching networks, MSs can obtain the signals of RAUs through the Gb-interface in GPRS and through the IuPS-interface in UMTS, and the signals of TAUs can be transmitted between MSs and the core network through the S1-MME-interface in LTE [10,11,12,13,14,15,16,17,18,19,20,21,22,23,24,25,26,27]. Therefore, a network monitor system can be implemented to capture the cellular network signals via the A-interface, the IuCS-interface, the Gb-interface, the IuPS-interface, and the S1-MME-interface for CFVD.
2.2. CFVD
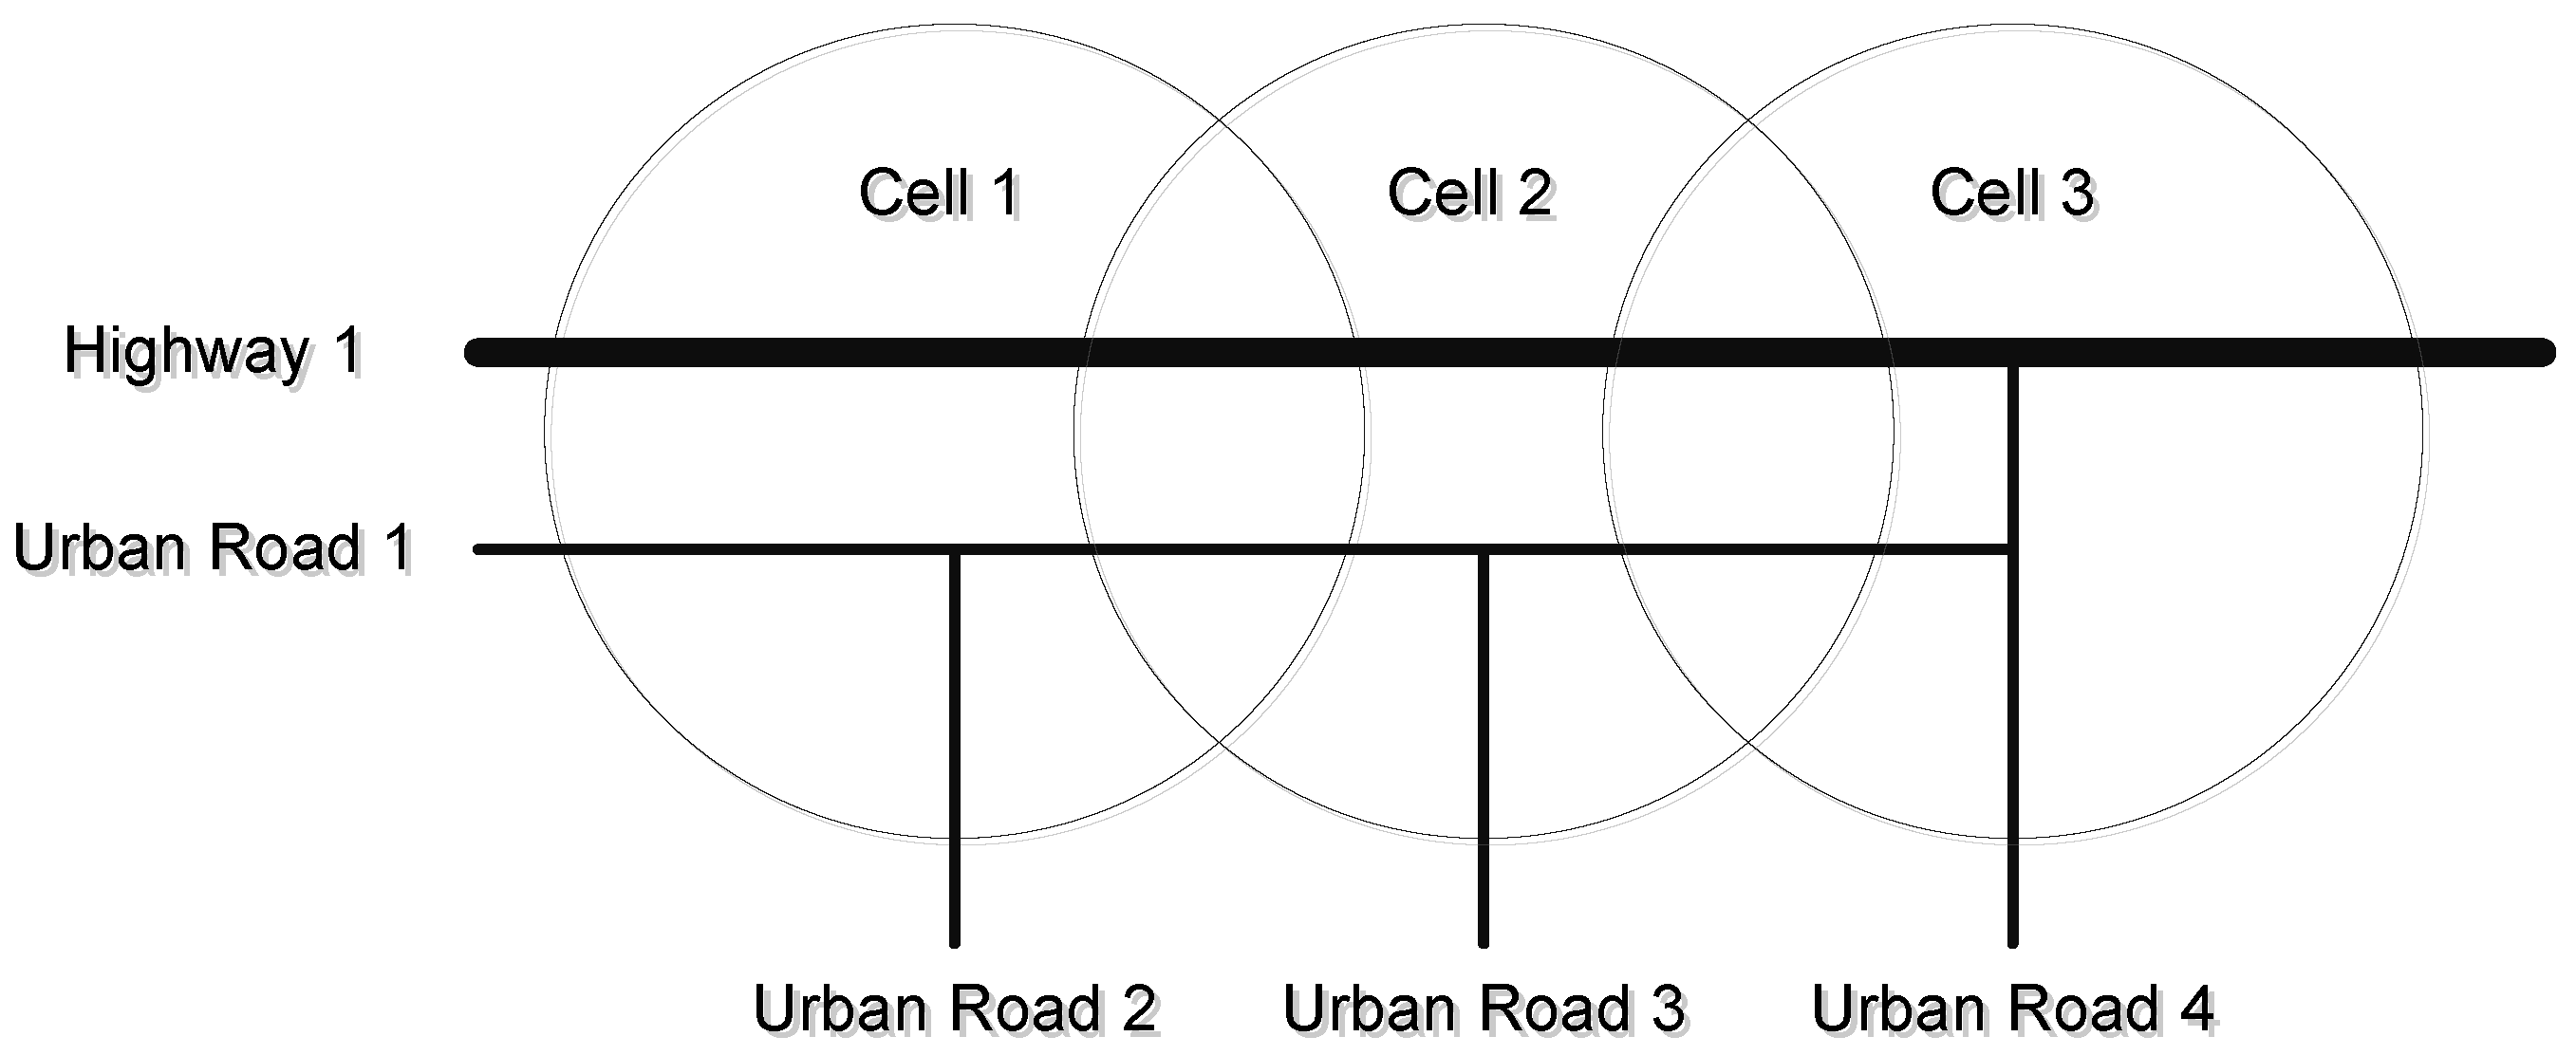
In recent years, CFVD has been analyzed to estimate traffic flow, traffic density, and vehicle speed in some studies. For instance, the signals of HOs from GSM and UMTS could be used to analyze the cell dwell time in cells and to estimate vehicle speed and travel time [8,11,12,16,25,26,28]. Figure 1 shows a case study of CFVD for highway and urban roads. One highway (i.e., Highway 1) and four urban roads (i.e., Urban Road 1, Urban Road 2, Urban Road 3, and Urban Road 4) are covered by three cells (i.e., Cell 1, Cell 2, and Cell 3). When a MS performs a call and moves from Cell 1 to Cell 2, a HO signal is generated and recorded. Moreover, the MS keeps moving from Cell 2 to Cell 3, another HO signal is also generated and recorded. These two HO signals can be analyzed to obtain the cell dwell time of Cell 2. Then the vehicle speed and travel time of Highway 1 can be estimated in accordance with the cell dwell time [8,11,12,16,25,26,28].
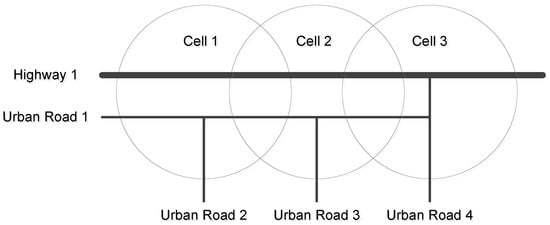
Figure 1.
The case study of CFVD for highway and urban roads.
Although the previous studies provided high accuracies of traffic information estimation, they focused on highways and assumed that vehicles can be tracked to the correct route. In practical environments, a cell usually covers only one highway, and a cell may cover several urban roads. For instance, Cell 1 covers Highway 1, Urban Road 1, and Urban Road 2. Therefore, the determination of the correct route driven by the MS user is difficult, especially for urban roads.
Some studies proposed a route classification method based on vehicular mobility patterns [12,29,30]. The route classification method recorded the list of cells which covered a same road. For example, the list of cells for Urban Road 1 in Figure 1 is {Cell 1, Cell 2, and Cell 3}. The method could estimate the similarity of the cell list of a route and the list of connected cells of a MS for determining the route which is driven by the MS user [12,29,30]. However, the previous method could not determine the road direction, and the proximal urban roads might lead to lower accuracy of route classification.
2.3. Traffic Information Estimation
For traffic information estimation, the amount of HOs and NLUs could be collected and analyzed for traffic flow estimation [8,10,14,17], and the amount of CAs and PLUs could be retrieved and used for traffic density estimation [8,10,14,15]. Then the vehicle speed can be estimated in accordance with the estimated traffic flow and the estimated traffic density. Furthermore, some studies proposed mobile positioning methods to measure and analyze RSSIs between the MS and base stations (BSs) to determine the location of the MS [20,21,22,23]. The time difference and the distance between two locations of the same MS can be measured for vehicle speed estimation and travel time estimation. The estimated traffic information-based CFVD can be referred and analyzed to develop traffic control strategies for governments.
3. Vehicle Positioning Method
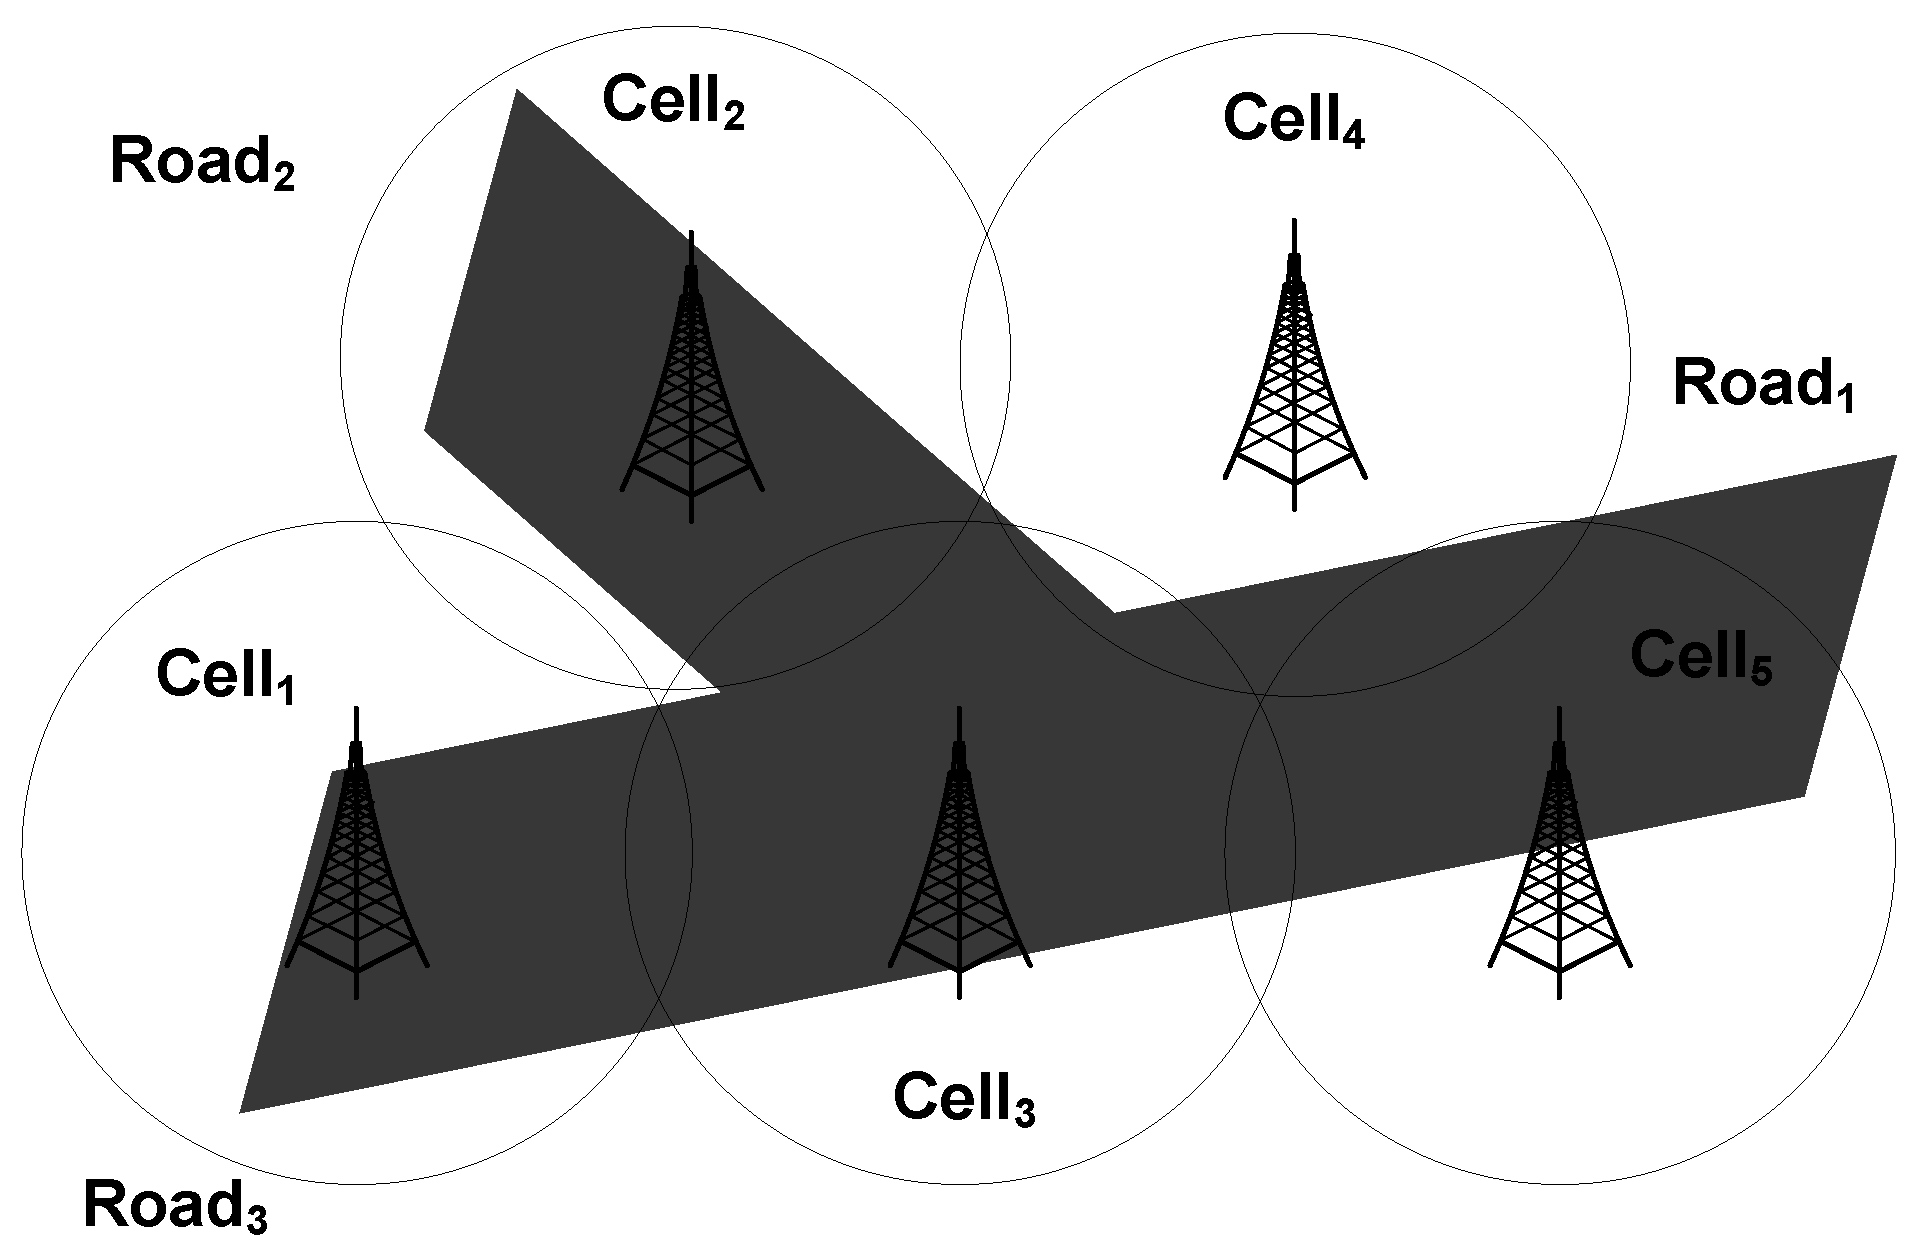
A vehicle positioning method is proposed to collect and analyze CFVD (e.g., the IDs, sequence, and cell dwell time of connected cells) from the signals of MS communications (e.g., call arrivals and handoffs) for determining urban road segments which are driven by MS users in their cars. For instance, Figure 2 shows a case study of an urban road network and cell coverage. There are five cells (i.e., Cell1 to Cell5) and three urban road segments (i.e., Road1 to Road3) in this case. When the MS moves and performs handoff signals, the road segments which are driven by the MS user in their car can be tracked according to the IDs, sequence, and cell dwell time of connected cells. In this case, Cell5, Cell4, Cell3, and Cell2 may be connected by a MS when the MS moves through Road1 to Road2; Cell5, Cell4, Cell3, and Cell1 may be connected by a MS when the MS moves through Road1 to Road3.
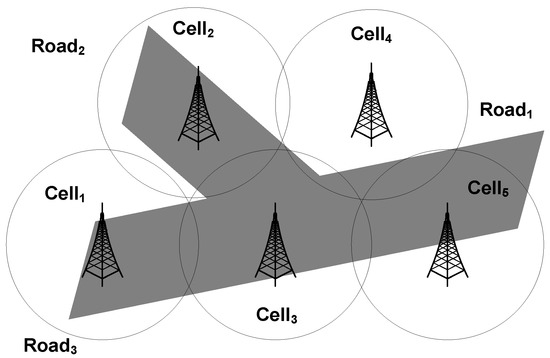
Figure 2.
The case study of an urban road network and cell coverage.
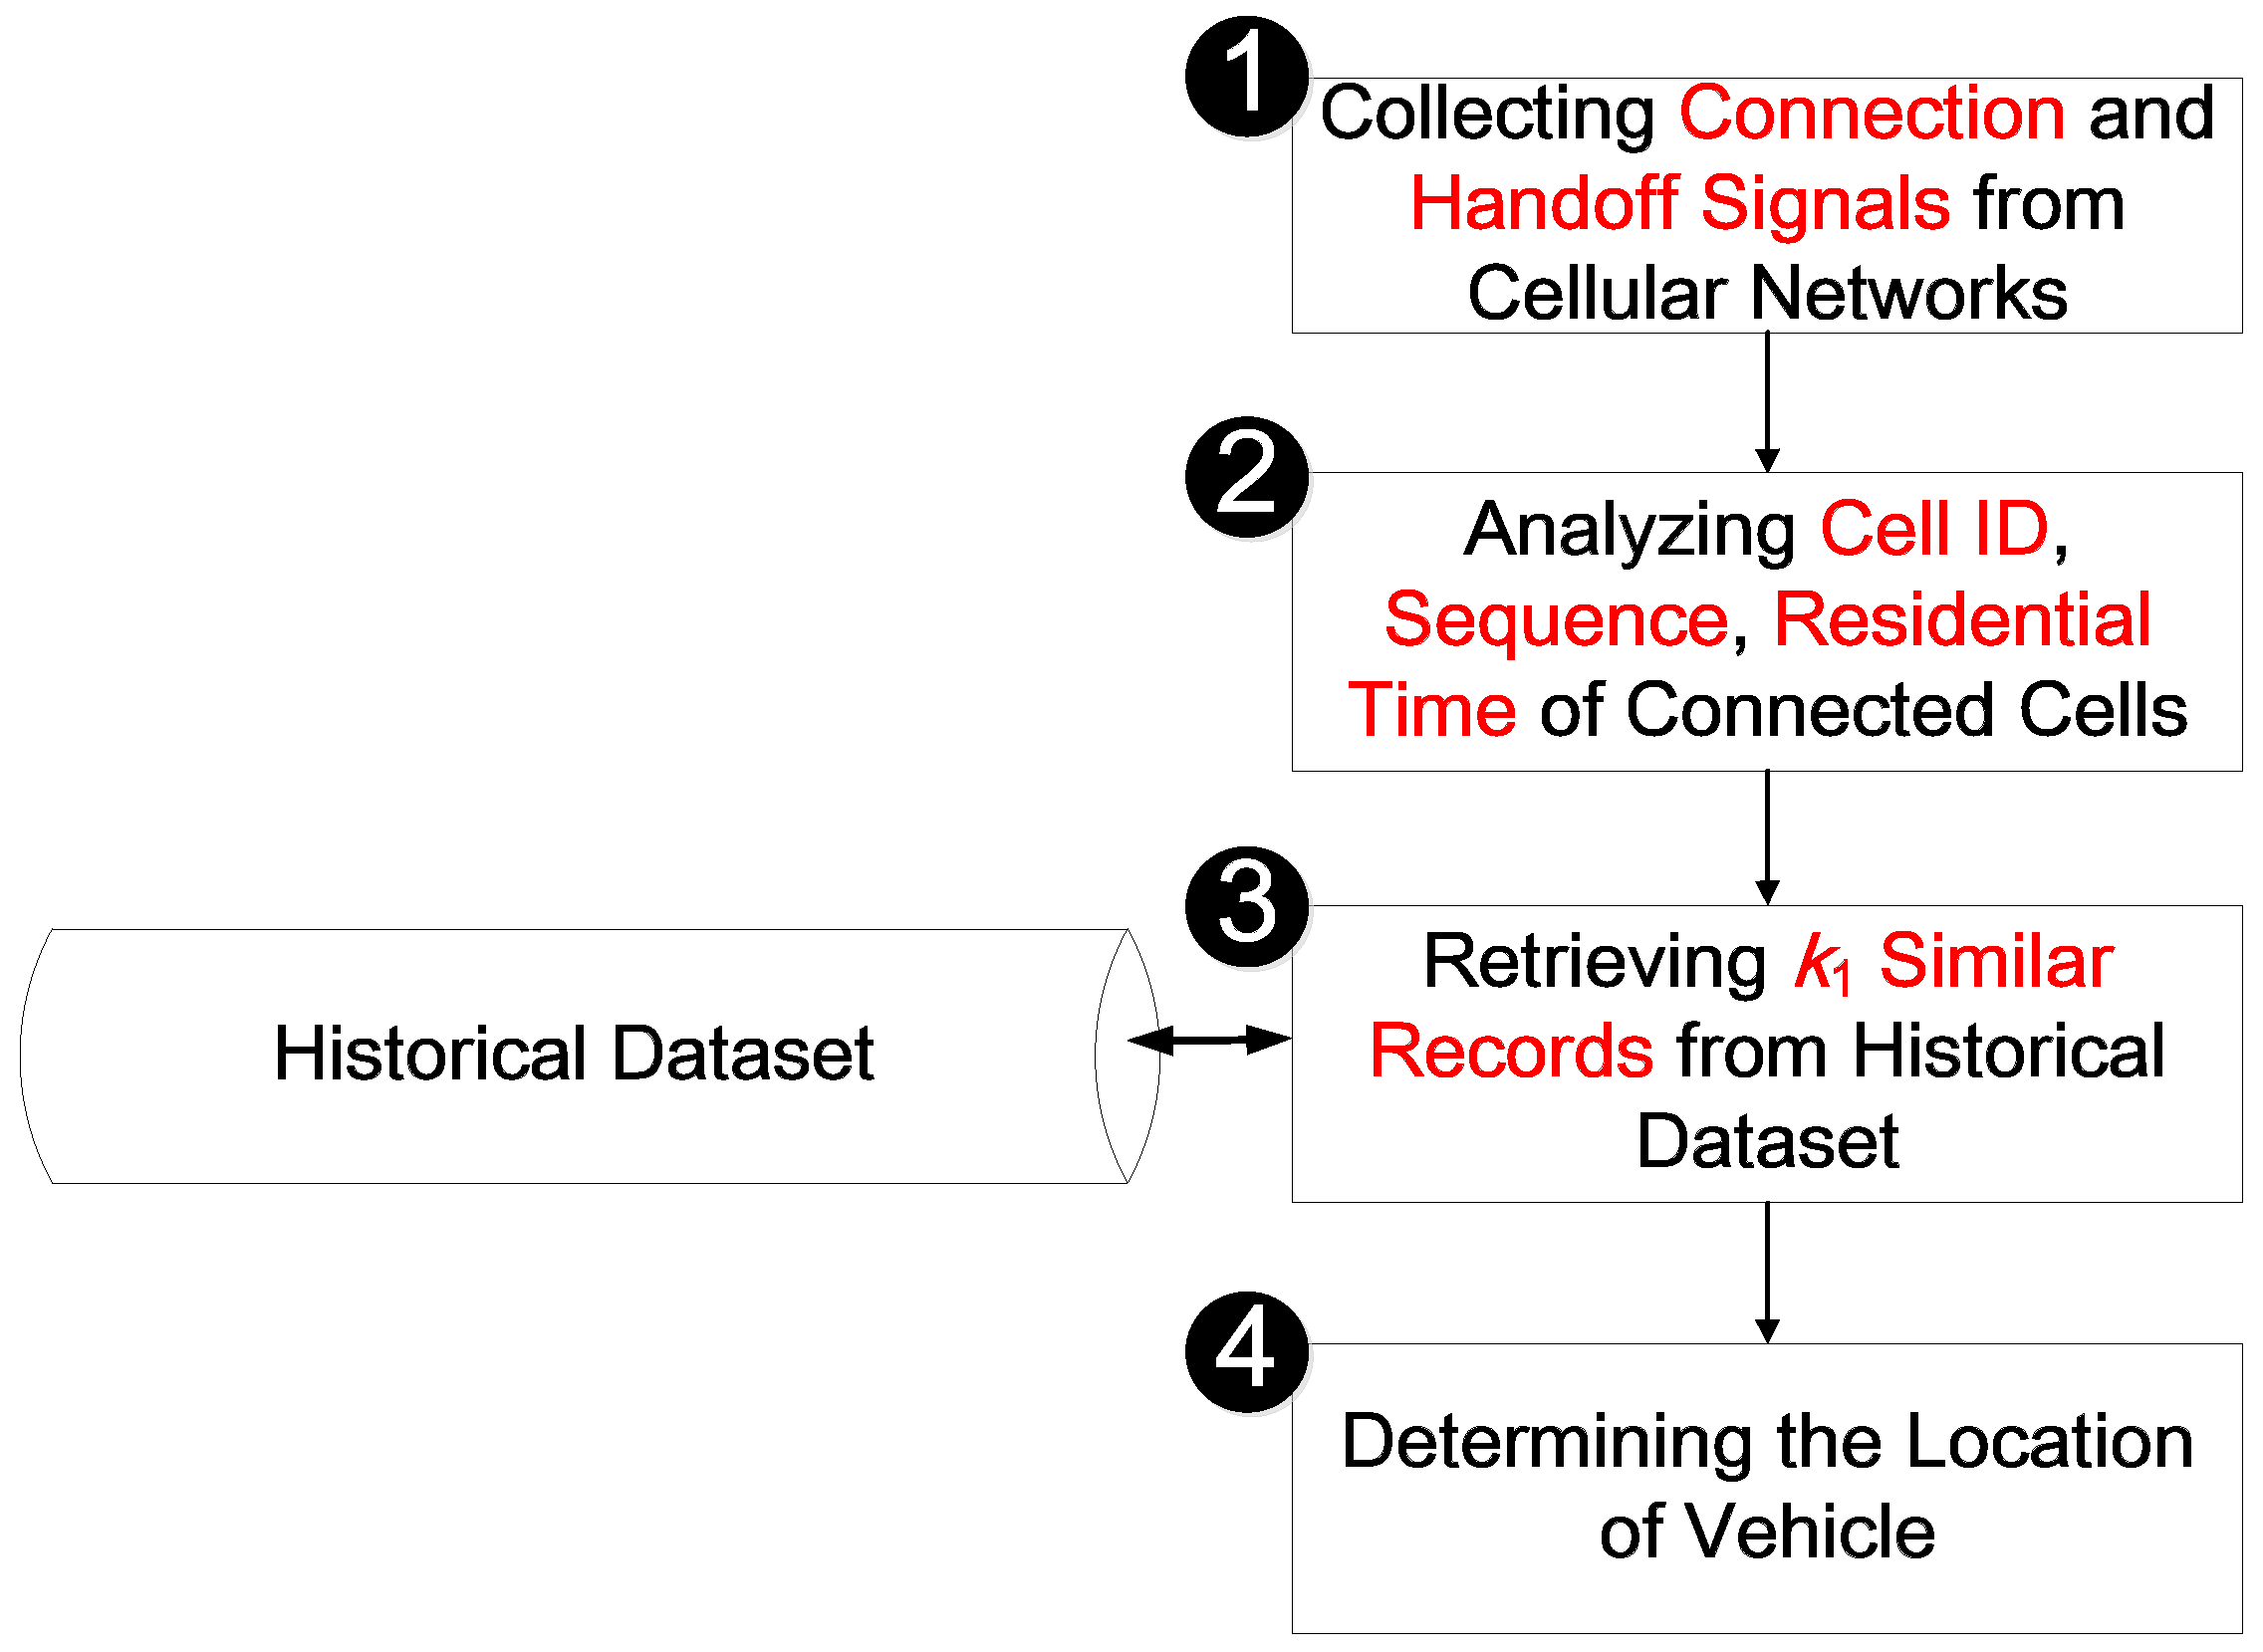
Therefore, the proposed vehicle positioning method is designed to analyze CFVD and to apply the k-nearest neighbor algorithm (kNN) for determining the location of the vehicle. This method includes four steps (shown in Figure 3) which include: (1) collecting connection and handoff signals from cellular networks; (2) analyzing cell ID, sequence, and cell dwell time of connected cells; (3) retrieving k1 similar records from a historical dataset; and (4) determining the location of the vehicle. The details of each step are presented in following subsections.
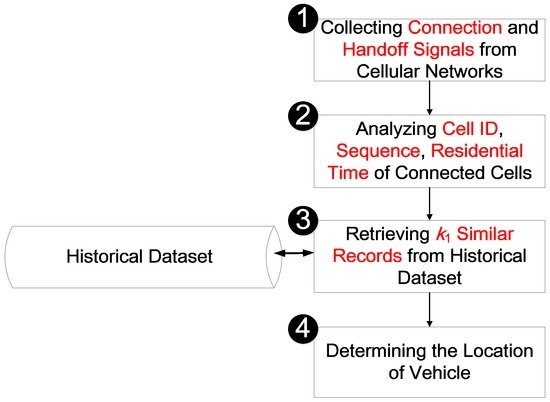
Figure 3.
The steps of vehicle positioning method.
3.1. Collecting Connection and Handoff Signals from Cellular Networks
Step 1 captures and collects the cell IDs and timestamps from cellular network signals (e.g., call arrivals and handoffs) which are obtained by MS and core networks via A and IuCS interfaces. This study applies an international mobile subscriber identity (IMSI) as the ID of the MS for tracking each MS. For instance, a call was performed by IMSI1 at PM 16:08:02 on 18 May 2016, and the cellular network signals during this call were collected and showed in Table 1. When this MS moved from Cell1 to Cell2, a handoff procedure was performed at PM 16:10:35. However, cell oscillation might occur between 16:10:35 and 16:11:07. Then, the MS kept moving and entered the coverage of Cell3, and a handoff signal was generated at PM 16:15:58. Finally, a call complete procedure was performed at 16:18:39. These signals can be captured and used as CFVD for vehicle positioning and speed estimation.

Table 1.
The cellular network signals during a call performed by IMSI1 on 18 May 2016.
3.2. Analyzing Cell ID, Sequence, and Cell Dwell Time of Connected Cells
Step 2 can analyze the records (i.e., cell IDs and timestamps) from Step 1 and extract three features, which include the cell IDs, sequence, and cell dwell time of connected cells. This study assumes that n cells are available in experimental environments. The extraction processes of each feature are illustrated in the following subsections.
3.2.1. Cell ID
For the feature analysis of cell ID, this study sets the value of Celli (ci) as 1 if Celli is connected during a call, but otherwise the value of cell is 0. The feature of cell ID, which can be presented as a vector space model (C), is defined in Equation (1). For example, Cell1, Cell2, and Cell3 are connected by IMSI1 in Table 1, so the values of c1, c2, and c3 are 1 (shown in Equation (2)).
3.2.2. Sequence
For the judgment of urban road direction, the handoff sequence is an important feature, so this study analyzes the sequence of connected cells for determining the road segment driven by a MS user. When Celli is firstly connected, the value of Celli (oi) is given with a higher weight value. Then the feature of sequence which can be presented as a vector space model (O) is defined in Equation (3). Furthermore, this study only considers the first x connected cells, and a vector set of weight values (A) for the feature of sequence is defined in Equation (4). For instance, this study set the value of x as 3, and Equation (5) is adopted to set the values of A (i.e., a1 = 1; a2 = 0.5; a3 = 0.25). In the case of IMSI1 in Table 1, Cell1 is firstly connected, so the value of Cell1 (o1) is given as 1 (i.e., a1). Then Cell2 is secondly connected, and the value of Cell2 (o2) is adopted as 0.5 (i.e., a2). Finally, this study set the value of Cell3 (o3) as 0.25 (i.e., a3) and the values of other cells as 0 (shown in Equation (6)).
3.2.3. Cell Dwell Time
For the discrimination of proximal urban roads, the cell dwell time is an important feature, so this study analyzes the cell dwell time of each connected cell during the same call. However, cell oscillation may occur, especially in a city. Therefore, the total cell dwell time of each cell is considered and summarized. Then, the feature of cell dwell time, which can be presented as a vector space model (T), is defined in Equation (7). Moreover, this study only considers the first y cells with longer cell dwell time, and a vector set of weight values (B) for the feature of cell dwell time is defined in Equation (8). For example, cell oscillation might occur between 16:10:35 and 16:11:07 in Table 1. Therefore, the total cell dwell time of Cell1 is 174 s (i.e., 174 = 153 + 21), and the total cell dwell time of Cell2 is 302 s (i.e., 302 = 11 + 291). Then, the cell dwell time of Cell3 is 161 s. In this study, the value of y is adopted as 3, and Equation (9) is adopted to set the values of B (i.e., b1 = 1; b2 = 0.5; b3 = 0.25). The cell dwell time of Cell2 is the longest in the case of Table 1, so the value of Cell2 (t2) is given as 1 (i.e., b1). Then, the values of Cell3 (t3) and Cell1 (t1) are adopted as 0.5 (i.e., b2) and 0.25 (i.e., b3), respectively. Finally, this study sets the values of other cells as 0 (shown in Equation (10)).
3.2.4. Combination
This study considers the features of cell ID, sequence, and cell dwell time simultaneously and combines vector space models of C, O, and T into the vector set of R (shown in Equation (11)). For instance, the records of IMSI1 can be modeled in Equation (12):
3.3. Retrieving k1 Similar Records from a Historical Dataset
In this study, m calls are transformed in accordance with Equation (11) and stored in a historical database. These m records are defined as historical dataset H (shown in Equation (13)). Furthermore, the driven road segment of each historical record is labeled in the database. When a new call is performed and completed, the vector set of this call (r) (shown in Equation (14)) is transformed according to Equation (11) and compared with each record in historical dataset H by Equation (15). Then the most similar historical record with the distance g1 can be retrieved in accordance with Equation (16), and Step 3 retrieves k1 similar records from the historical dataset for vehicle positioning.
3.4. Determining the Location of a Vehicle
For the determination of vehicle location, Step 4 applies a majority rule to analyze the k1 similar records, which include the corresponding driven road segment from Step 3. For instance, a case study of a historical dataset and a new record is given in Table 2. There are five cells (i.e., n = 5) and six historical records (i.e., m = 6), and the value of k1 is adopted as 3 in this case. Equation (15) is used to calculate the distance between dataset r (i.e., a new record) and each historical record. The result shows that the k1 similar records are h1, h2, and h4, so Road1 is supported by two records (i.e., h1 and h2). Therefore, the driven road segment of this new record is determined as Road1.
Table 2.
A case study of historical dataset and a new record.
4. Speed Estimation Method
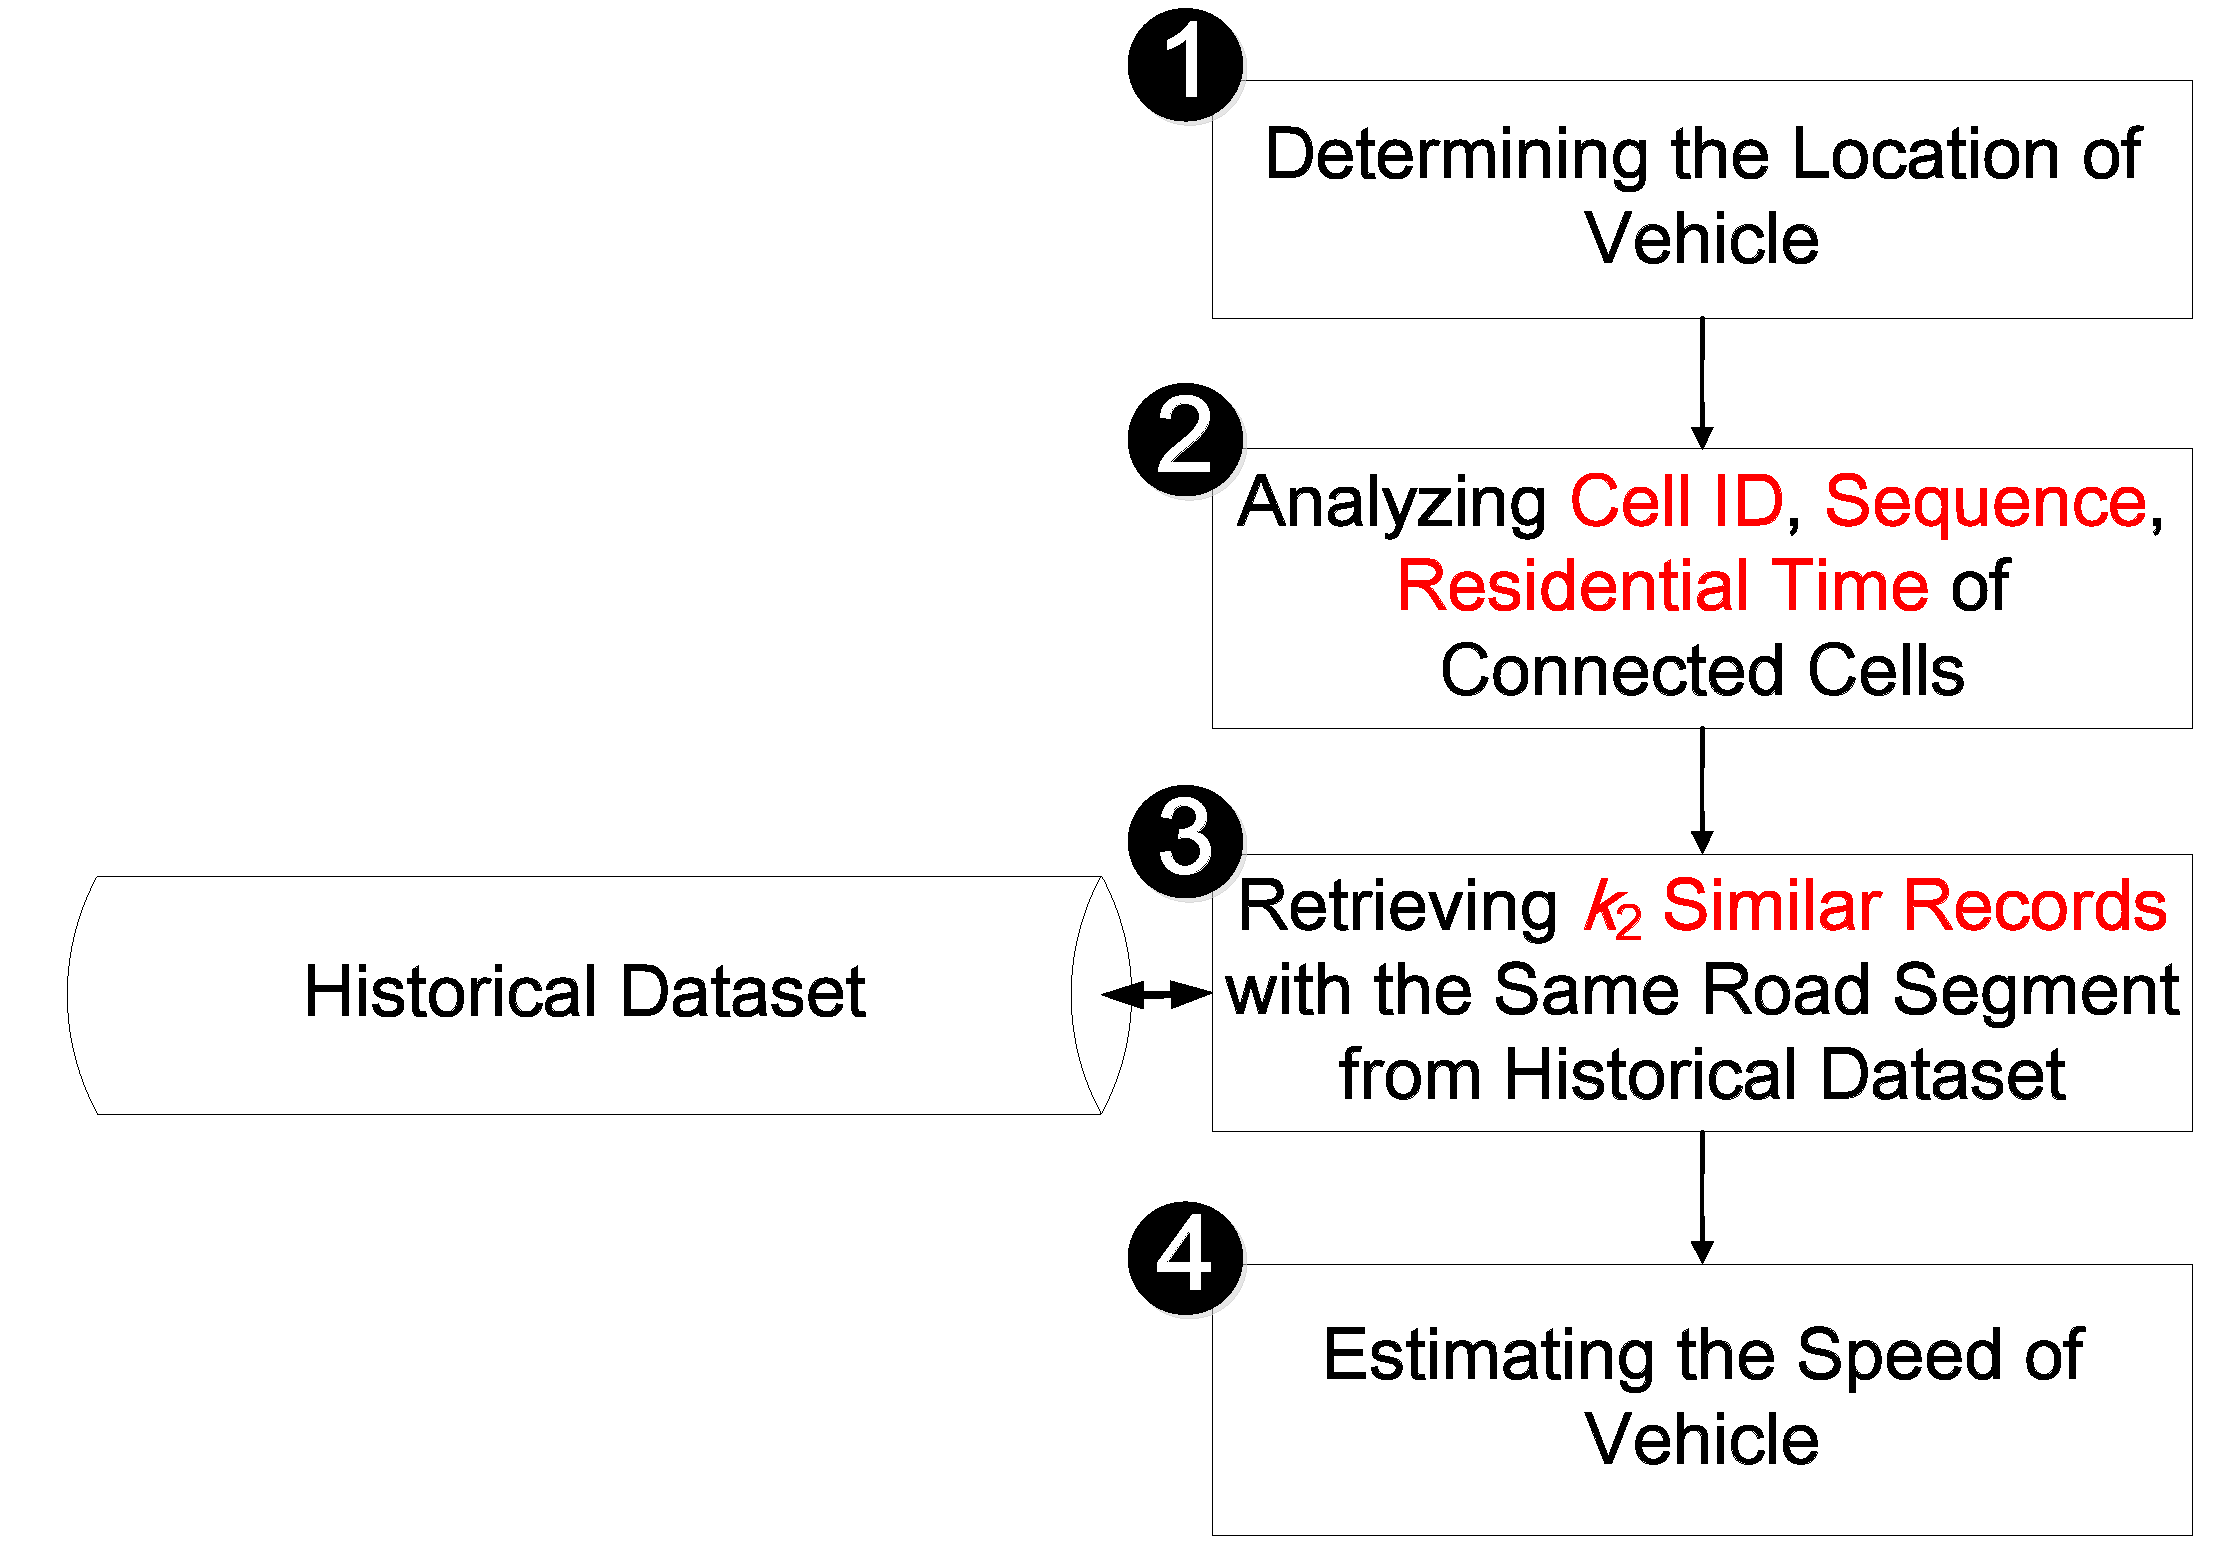
This study proposes a method and applies the k-nearest neighbor algorithm to extract the features of CFVD (e.g., the IDs, sequence, and cell dwell time of connected cells) and to estimate vehicle speed. The proposed method includes four steps (shown in Figure 4) which include: (1) determining the location of a vehicle; (2) analyzing cell ID, sequence, and cell dwell time of connected cells; (3) retrieving k2 similar records with the same road segment from historical dataset; and (4) estimating the speed of a vehicle. The details of each step are presented in following subsections.
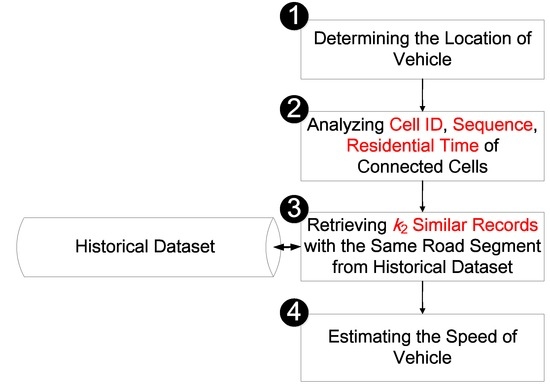
Figure 4.
The steps of speed estimation method.
4.1. Determining the Location of Vehicle
Step 1 determines the driven road segment of the MS in accordance with CFVD and the proposed vehicle positioning method in Section 3. This study only considers and analyzes the historical records with the same road segment to estimate vehicle speed. For example, when a new record is determined as Roadl, the historical records with Roadl are considered in the following steps.
4.2. Analyzing Cell ID, Sequence, and Cell Dwell Time of Connected Cells
Step 2 adopts Equations (1), (3) and (7) to extract the features of historical records and new records which include the IDs, sequence, and cell dwell time of connected cells. Each record can be transformed as a vector space model (shown in Equation (11)). Historical records are presented as a vector set H, and a new record is presented as a vector set r in accordance with Equations (13) and (14).
4.3. Retrieving k2 Similar Records with the Same Road from Historical Dataset
Step 3 retrieves k2 similar records with the same road segment from a historical dataset according to Equation (15). Furthermore, the vehicle speed of each historical record is labeled in a database. For instance, in the case of Table 2, the new record r is determined as Road1, so three historical records (i.e., h1, h2, and h3) are considered to be analyzed for vehicle speed estimation. If the value of k2 is adopted as 2 in this case, the records h1 and h2 are retrieved as the k2 similar records.
4.4. Estimating the Speed of a Vehicle
Step 4 applies a weighted mean method to analyze the k2 similar records for vehicle speed estimation. In this study, new record r is determined as Roadl, and the distance between this record and the more similar record with vehicle speed v1 is defined as p1 in Equation (17). Moreover, the distance between this record and the j-th most similar record with vehicle speed vj is defined as pj. Then the vehicle speed of this record is estimated as u by Equation (18). For example, the k2 similar records are h1 and h2 in Table 2 when the value of k2 is 2. The value of d(r, h1) is 0 (i.e., p1 = 0), and the value of d(r, h2) is about 0.707 (i.e., p2 = 0). Then, Equation (18) is adopted to estimate the vehicle speed of the new record r as 60 km/h (shown in Equation (19)).
5. Experimental Results and Discussions
The collection of CFVD and the information of urban road networks are presented in Section 5.1. The collected CFVD is used to evaluate the proposed vehicle positioning method and speed estimation method in Section 5.2 and Section 5.3, respectively.
5.1. Experimental Environment
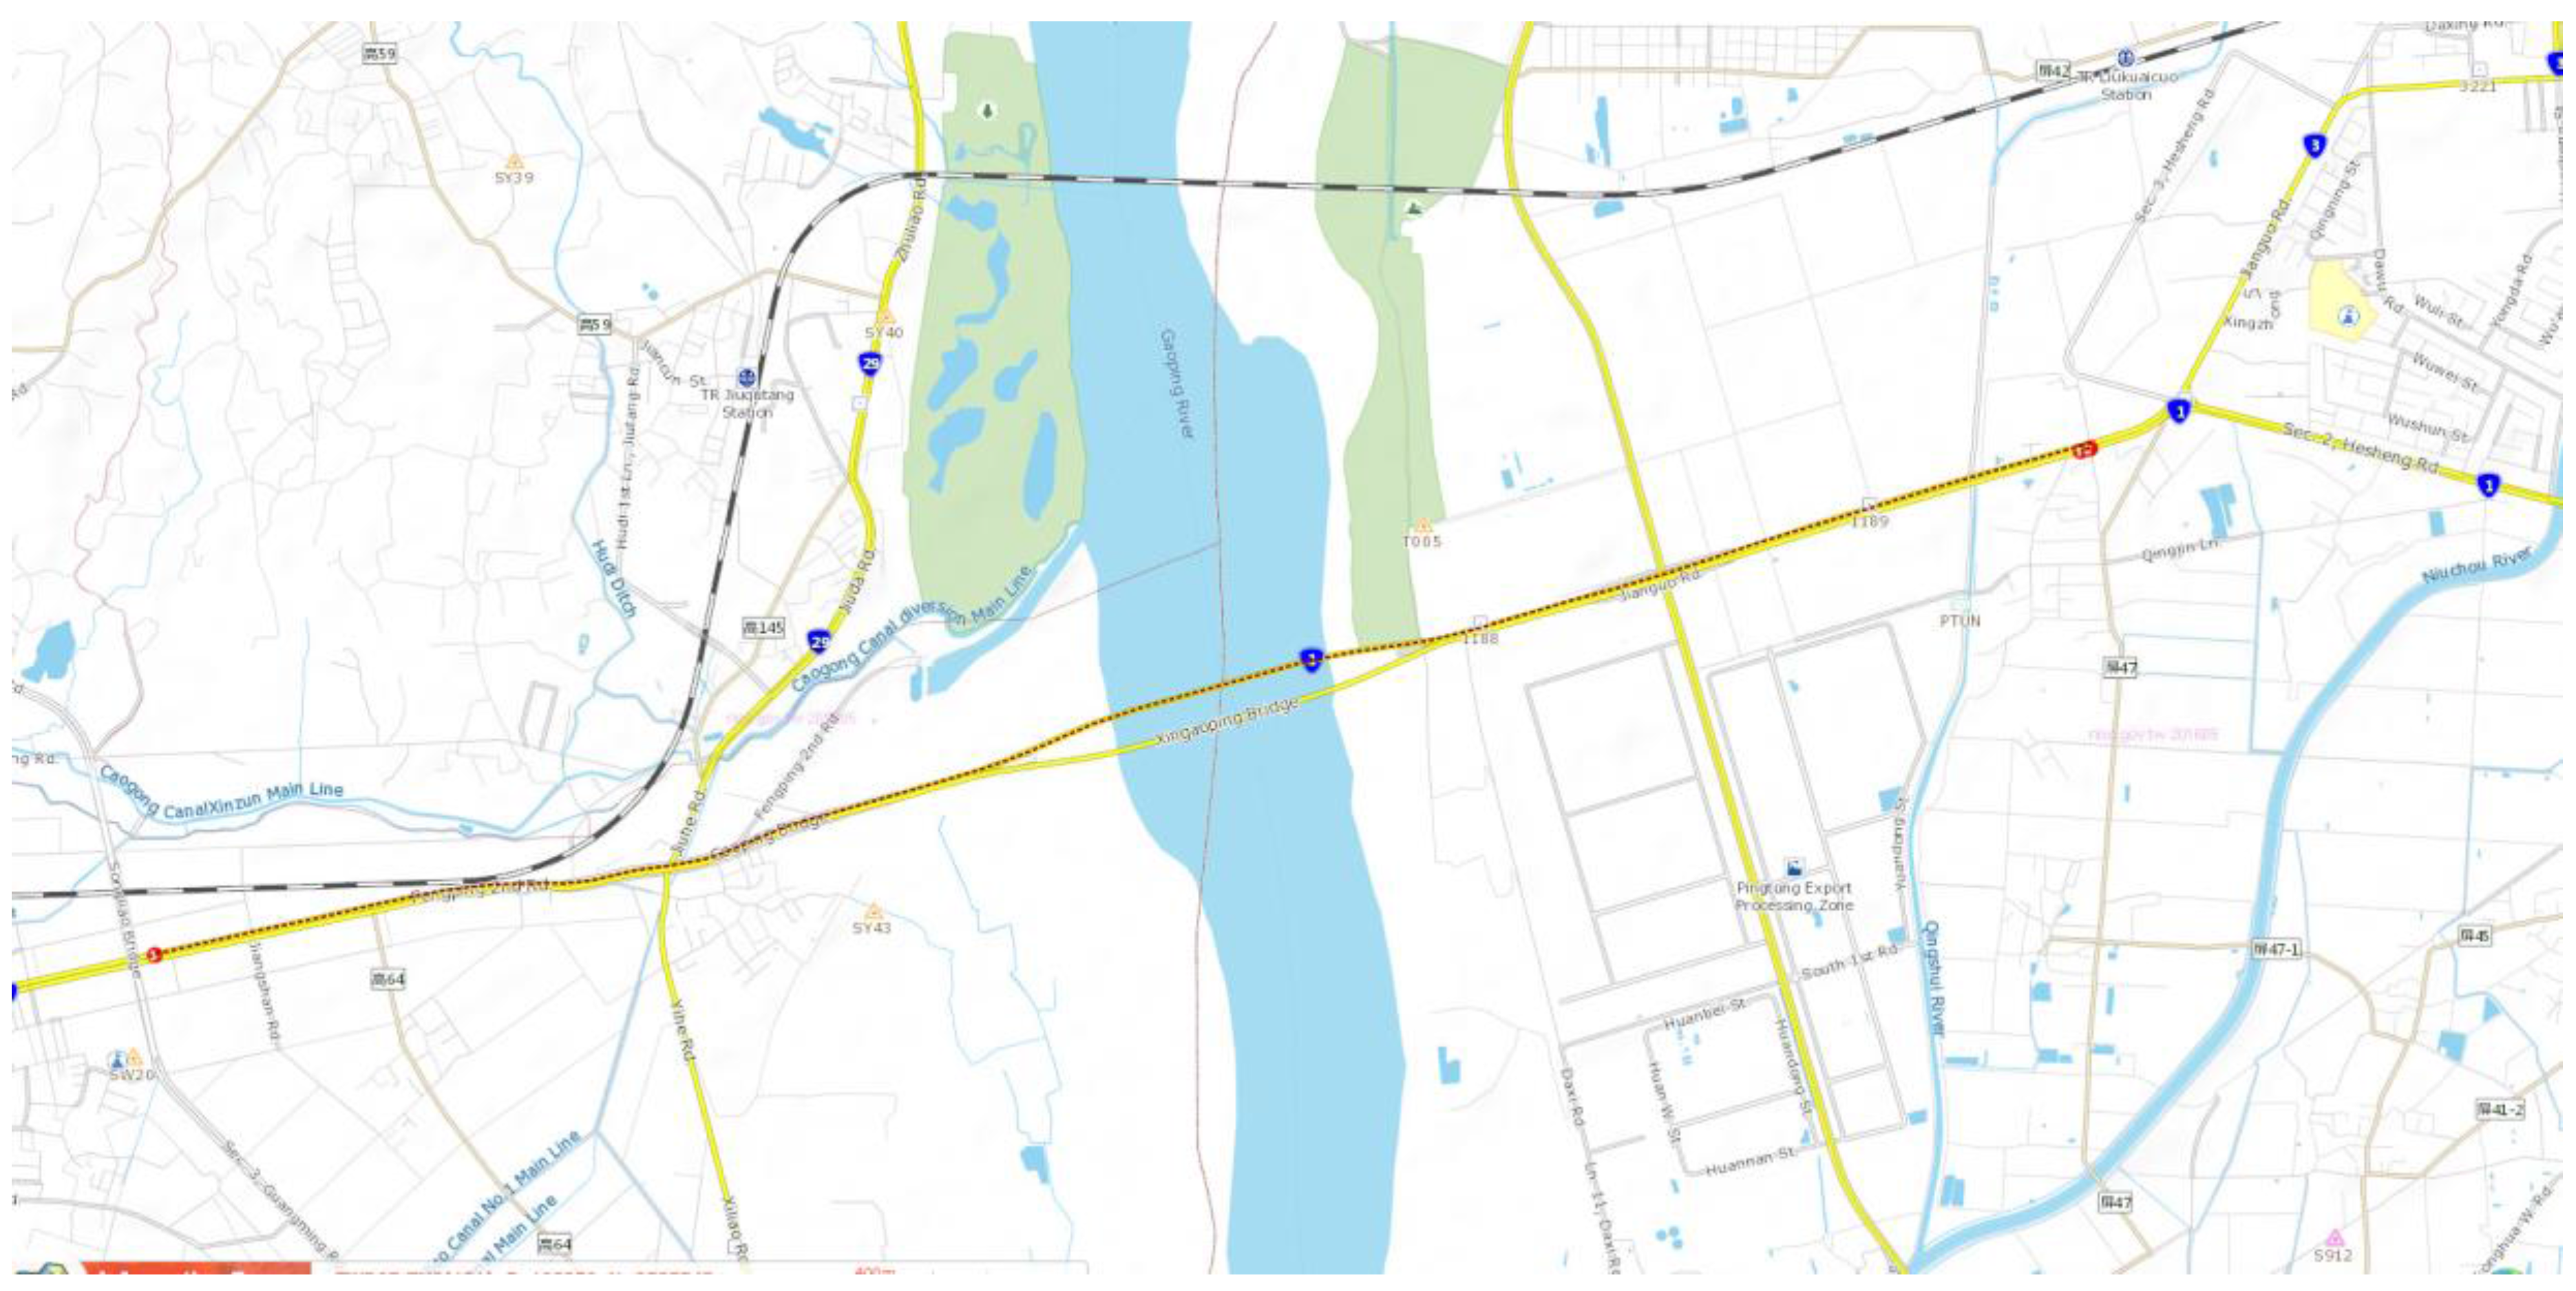
In experimental environments, a MS (e.g., HTC (Taoyuan, Taiwan) M8 running the Android 2.2.2platform) is carried in a car to perform call procedures when the car is driven on urban roads, and the cellular network signals of these calls can be captured for the collection of CFVD. Six urban road segments in Kaohsiung and Pingtung in Taiwan (shown in Figure 5) are driven in 27 runs. There are 64 different base stations (BSs) (i.e., n = 64) detected on these road segments in Taiwan.
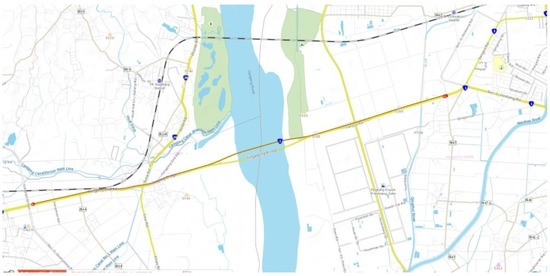
Figure 5.
The urban road segments in the experimental environment.
For the evaluations of the vehicle positioning method and speed estimation method, some popular machine learning methods (e.g., kNN, naive Bayes classification (NB), decision tree (DT), support vector machine (SVM), and back-propagation neural network (BPNN) [31,32]), are implemented and compared by using the R language [33,34] and Rstudio [35] to analyze collected CFVD in experiments. This study uses the packages of class [36], e1071 [37], party [38], and neuralnet [39] to implement kNN, NB, DT, SVM, and BPNN algorithms, respectively. Furthermore, the k-fold cross-validation method [31,32] is used to analyze each test run. In the i-th iteration, the data of the i-th run is selected as the test corpus, and the other test runs are collectively used to be training data for performance analyses.
5.2. The Evaluation of Vehicle Positioning Method
For the evaluation of the vehicle positioning method, this study considers different features and machine learning methods to analyze CFVD. Considering cell ID and kNN first; it can be observed that its performance of vehicle positioning is 51.85% (shown in Table 3). The cause of several errors is direction misjudgment when only the feature of cell ID is considered. Then, the features of cell ID and sequence are considered for the judgment of urban road direction, and the results show that the accuracy of the vehicle positioning method is improved to 92.59%. However, some proximal urban roads cannot be discriminated by using the features of cell ID and sequence. Finally, this study analyzes all features (i.e., the IDs, sequence, and cell dwell time of connected cells) to determine the driven road segment of the MS user, and the accuracy can be improved to 100%. Therefore, the feature of cell dwell time can support for the discrimination of proximal urban roads.
Table 3.
The comparisons of the proposed method with different features for vehicle positioning.
For the comparisons of different machine learning methods, all features are considered and analyzed to determine the driven road segment. Four factors, which include precision, recall, F1 − measure (shown in Equation (20)), and accuracy are used to evaluate the performance of each method. Table 4 shows that the performance of the proposed method is higher than other methods.
Table 4.
The comparisons of different machine learning methods with all features for vehicle positioning.
For the comparisons of different parameters, this study designs five cases which include {1, 0, 0}, {1, 0.5, 0}, {1, 1, 1}, {1, 0.67, 0.33}, and {1, 0.5, 0.25} for the values of A and B. Furthermore, Euclidean distance, Minkowski distance, and Mahalanobis distance are considered for the proposed method. The experimental results of these cases (in Table 5) indicated that the parameters A and B can be adapted as {1, 0.5, 0.25} to obtain a higher accuracy of vehicle positioning.
Table 5.
The comparisons of different parameters for vehicle positioning.
5.3. The Evaluation of the Speed Estimation Method
For the evaluation of the speed estimation method, this study considers different features after determining the driven road segment of the MS user. Table 6 shows the results of the proposed speed estimation method with different features. These experimental results indicate that cell dwell time is the most important feature, and the accuracy of vehicle estimation with all features can be improved to 83.81%. Therefore, the proposed method based on CFVD is suitable for detecting the status of urban road traffic.
Table 6.
The comparisons of the proposed method with different features for speed estimation.
6. Conclusions and Future Work
Several studies of CFVD focused on the traffic information estimation for freeways. Furthermore, these studies assumed that the cellular network signals from the moving MSs on roads can be filtered. However, a cell may cover several road segments of urban roads, so the assumption may not be realized on urban roads.
Therefore, this study proposes vehicle positioning and speed estimation methods to capture CFVD and to track MSs for intelligent transportation systems. Three features of CFVD, which include the IDs, sequence, and cell dwell time of connected cells from the signals of MS communications, are extracted and analyzed. The feature of sequence can be used to judge the urban road direction, and the feature of cell dwell time can be applied to discriminate proximal urban roads. The experiment results show that the accuracy of the proposed vehicle positioning method is better than other popular machine learning methods (e.g., NB, DT, SVM, and BPNN). Furthermore, the accuracy of the proposed method with all features (i.e., the IDs, sequence, and cell dwell time of connected cells) is 83.81% for speed estimation.
However, cell oscillation problems may disturb the cell dwell time of each cell and vehicle speed estimation. This study summarizes the total cell dwell time of each cell to solve these problems, but these problems may occur in accordance with some environment factors. Therefore, the environmental factors may be analyzed to filter out cell oscillation in future work.
Acknowledgments
The research is supported by the Ministry of Science and Technology of Taiwan under the grant No. MOST 104-2221-E-110-041.
Author Contributions
Wei-Kuang Lai and Ting-Huan Kuo proposed and designed the vehicle positioning and speed estimation methods based on CFVD. Ting-Huan Kuo performed the proposed methods and reported the experimental results. All of the authors have read and approved this manuscript.
Conflicts of Interest
The authors declare no conflict of interest.
References
- Jang, J.; Byun, S. Evaluation of traffic data accuracy using Korea detector testbed. IET Intell. Transp. Syst. 2011, 5, 286–293. [Google Scholar] [CrossRef]
- Ramezani, A.; Moshiri, B.; Kian, A.R.; Aarabi, B.N.; Abdulhai, B. Distributed maximum likelihood estimation for flow and speed density prediction in distributed traffic detectors with Gaussian mixture model assumption. IET Intell. Transp. Syst. 2012, 6, 215–222. [Google Scholar] [CrossRef]
- Middleton, D.; Parker, R. Vehicle Detector Evaluation; Report No. FHWA/TX-03 /2119-1; Texas Transportation Institute, Texas Department of Transportation: Austin, TX, USA, 2002.
- Chen, W.J.; Chen, C.H.; Lin, B.Y.; Lo, C.C. A traffic information prediction system based on global position system-equipped probe car reporting. Adv. Sci. Lett. 2012, 16, 117–124. [Google Scholar] [CrossRef]
- Hunter, T.; Herring, R.; Abbeel, P.; Bayen, A. Path and travel time inference from GPS probe vehicle data. In Proceedings of the Neural Information Processing Foundation Conference, Vancouver, BC, Canada, 5–10 December 2009.
- Cheu, R.L.; Xie, C.; Lee, D.H. Probe vehicle population and sample size for arterial speed estimation. Comput. Aided Civil Infrastruct. Eng. 2002, 17, 53–60. [Google Scholar] [CrossRef]
- Herrera, J.C.; Work, D.B.; Herring, R.; Ban, X.J.; Jacoboson, Q.; Bayen, A.M. Evaluation of traffic data obtained via GPS-enabled mobile phones: The mobile century field experiment. Transp. Res. Part C Emerg. Technol. 2010, 18, 568–583. [Google Scholar] [CrossRef]
- Caceres, N.; Wideberg, J.P.; Benitez, F.G. Review of traffic data estimations extracted from cellular networks. IET Intell. Transp. Syst. 2008, 2, 179–192. [Google Scholar] [CrossRef]
- United Marketing Research. The Investigation Report on the Digital Opportunity about Phone Users. Research, Development and Evaluation Commission, Executive Yuan, 2011. Available online: http://www.rdec.gov.tw/public/Attachment/213014313671.pdf (accessed on 20 June 2016). [Google Scholar]
- Lai, W.K.; Kuo, T.H.; Chen, C.H. Vehicle speed estimation and forecasting methods based on cellular floating vehicle data. Appl. Sci. 2016, 6, 47. [Google Scholar] [CrossRef]
- Wu, C.I.; Chen, C.H.; Lin, B.Y.; Lo, C.C. Traffic information estimation methods from handover events. J. Test. Eval. 2016, 44, 656–664. [Google Scholar] [CrossRef]
- Chang, M.F.; Chen, C.H.; Lin, Y.B.; Chia, C.Y. The frequency of CFVD speed report for highway traffic. Wirel. Commun. Mob. Comput. 2015, 15, 879–888. [Google Scholar] [CrossRef]
- Janecek, A.; Valerio, D.; Hummel, K.A.; Ricciato, F.; Hlavacs, H. The cellular network as a sensor: From mobile phone data to real-time road traffic monitoring. IEEE Trans. Intell. Transp. Syst. 2015, 16, 2551–2572. [Google Scholar] [CrossRef]
- Chen, C.H.; Chang, H.C.; Su, C.Y.; Lo, C.C.; Lin, H.F. Traffic speed estimation based on normal location updates and call arrivals from cellular networks. Simul. Model. Pract. Theory 2013, 35, 26–33. [Google Scholar] [CrossRef]
- Chang, H.C.; Chen, C.H.; Lin, B.Y.; Kung, H.Y.; Lo, C.C. Traffic information estimation using periodic location update events. Int. J. Innov. Comput. Inf. Control 2013, 9, 2031–2041. [Google Scholar]
- Maerivoet, S.; Logghe, S. Validation of travel times based on cellular floating vehicle data. In Proceedings of the 6th European Congress and Exhibition on Intelligent Transport Systems and Services, Aalborg, Denmark, 18–20 June 2007.
- Caceres, N.; Romero, L.M.; Benitez, F.G.; del Castillo, J.M. Traffic flow estimation models using cellular phone data. IET Intell. Transp. Syst. 2012, 13, 1430–1441. [Google Scholar] [CrossRef]
- Valerio, D.; Witek, T.; Ricciato, F.; Pilz, R.; Wiedermann, W. Road traffic estimation from cellular network monitoring: A hands-on investigation. In Proceedings of the IEEE 20th International Symposium on Personal, Indoor and Mobile Radio Communications, Tokyo, Japan, 13–16 September 2009.
- Valerio, D.; D’Alconzo, A.; Ricciato, F.; Wiedermann, W. Exploiting cellular networks for road traffic estimation: A survey and a research roadmap. In Proceedings of the IEEE 69th Vehicular Technology Conference, Barcelona, Spain, 26–29 April 2009.
- Chen, C.H.; Lo, C.C.; Lin, H.F. The Analysis of Speed-Reporting Rates from a cellular network based on a fingerprint-positioning algorithm. S. Afr. J. Ind. Eng. 2013, 24, 98–106. [Google Scholar] [CrossRef]
- Chen, C.H.; Lin, B.Y.; Chang, H.C.; Lo, C.C. The novel positioning algorithm based on cloud computing—A case study of intelligent transportation systems. Inf. Int. Interdiscip. J. 2012, 15, 4519–4524. [Google Scholar]
- Cheng, D.Y.; Chen, C.H.; Hsiang, C.H.; Lo, C.C.; Lin, H.F.; Lin, B.Y. The optimal sampling period of a fingerprint positioning algorithm for vehicle speed estimation. Math. Probl. Eng. 2013, 2013. [Google Scholar] [CrossRef]
- Chen, C.H.; Lin, B.Y.; Lin, C.H.; Liu, Y.S.; Lo, C.C. A green positioning algorithm for campus guidance system. Int. J. Mob. Commun. 2012, 10, 119–131. [Google Scholar] [CrossRef]
- Gundlegård, D.; Karlsson, J.M. The smartphone as enabler for road traffic information based on cellular network signaling. In Proceedings of the 16th International IEEE Conference on Intelligent Transportation Systems, Hague, The Netherlands, 6–9 October 2013.
- Gundlegard, D.; Karlsson, J.M. Handover location accuracy for travel time estimation in GSM and UMTS. IET Intell. Transp. Syst. 2009, 3, 87–94. [Google Scholar] [CrossRef]
- Gundlegard, D.; Karlsson, J.M. Route classification in travel time estimation based on cellular network signaling. In Proceedings of the 12th International IEEE Conference on Intelligent Transportation Systems, St. Louis, MO, USA, 4–7 October 2009.
- Gundlegard, D.; Karlsson, J.M. Generating road traffic information from cellular networks—New possibilities in UMTS. In Proceedings of the 6th International Conference on ITS Telecommunications, Chengdu, China, 21–23 June 2006.
- Demissie, M.G.; de Almeida Correia, G.H.; Bento, C. Intelligent road traffic status detection system through cellular networks handover information: An exploratory study. Transp. Res. Part C Emerg. Technol. 2013, 32, 76–88. [Google Scholar] [CrossRef]
- Fiadino, P.; Valerio, D.; Ricciato, F.; Hummel, K.A. Steps towards the extraction of vehicular mobility patterns from 3G signaling data. Lect. Notes Comput. Sci. 2012, 7189, 66–80. [Google Scholar]
- Becker, R.A.; Caceres, R.; Hanson, K.; Loh, J.M.; Urbanek, S.; Varshavsky, A.; Volinsky, C. Route classification using cellular handoff patterns. In Proceedings of the 13th International Conference on Ubiquitous Computing, Beijing, China, 17–21 September 2011.
- Lai, W.K.; Kuo, T.H. An urban road segment determination method based on cellular floating vehicle data for tracking mobile stations. In Proceedings of the 7th International IEEE Conference on Ubi-Media Computing and Workshops, Ulaanbaatar, Mongolia, 12–14 July 2014.
- Han, J.; Kamber, M.; Pei, J. Data Mining: Concepts and Techniques, 3rd ed.; Morgan Kaufmann Publishers: San Francisco, CA, USA, 2011. [Google Scholar]
- Ihaka, R.; Gentleman, R. R: A language for data analysis and graphics. J. Comput. Graph. Stat. 1996, 5, 299–314. [Google Scholar]
- Ripley, B.D. The R project in statistical computing. MSOR Connect. 2001, 1, 23–25. [Google Scholar] [CrossRef]
- Racine, J.S. RStudio: A platform-independent IDE for R and sweave. J. Appl. Econ. 2012, 27, 167–172. [Google Scholar] [CrossRef]
- Ripley, B.; Venables, W. Class: Functions for Classification. The Comprehensive R Archive Network 2015. Available online: https://cran.r-project.org/web/packages/class/index.html (accessed on 20 June 2016).
- Meyer, D.; Dimitriadou, E.; Hornik, K.; Weingessel, A.; Leisch, F.; Chang, C.C.; Lin, C.C. e1071: Nisc Functions of the Department of Statistics, Probability Theory Group. The Comprehensive R Archive Network 2015. Available online: https://cran.r-project.org/web/packages/e1071/index.html (accessed on 20 June 2016).
- Hothorn, T.; Hornik, K.; Strobl, C.; Zeileis, A. Party: A Laboratory for Recursive Partytioning. The Comprehensive R Archive Network 2015. Available online: https://cran.r-project.org/web/packages/party/index.html (accessed on 20 June 2016).
- Fritsch, S.; Guenther, F. Neuralnet: Training of Neural Networks. The Comprehensive R Archive Network 2012. Available online: https://cran.r-project.org/web/packages/neuralnet/index.html (accessed on 20 June 2016).
© 2016 by the authors; licensee MDPI, Basel, Switzerland. This article is an open access article distributed under the terms and conditions of the Creative Commons Attribution (CC-BY) license (http://creativecommons.org/licenses/by/4.0/).