Abstract
Spatial accessibility to education represents a key component of spatial justice, yet significant disparities persist between urban and rural areas in Romania. The present paper introduces the concept of education deserts as settlements where the population lacks proper access to education within a reasonable commuting distance and travel time, with a focus on high schools. Open-source demographic and institutional data and GIS-based spatial analysis were used in identifying education deserts across Romania. These were later evaluated based on a 20 min travel time or a 25 km distance threshold computed using OpenStreetMap API data. To assess the multidimensional nature of education deserts, a Composite Demand Index (CDI) and an Access Hardship Index (AHI) have been developed. Both were integrated into a final Education Desert Index (EDI) that captures unmet demand and spatial constraints. Results indicate that 34.3% of Romanian settlements (1092 LAU2s) and 15.2% of the high school-aged population reside in education deserts, found predominantly in the country’s North-East, South, and Centre regions. These areas coincide with rural, peripheral zones characterised by infrastructural deficits and low educational attainment. Findings reveal spatial inequities in upper secondary education provision between urban and rural communities. The present study offers a replicable methodological framework for evaluating educational accessibility and supports evidence-based policymaking aimed at reducing spatial disparities in education.
1. Introduction
1.1. Defining Education Deserts
Education is not merely a human right but also one of the most important ones. As stated in the Sustainable Development Goals, every person should have equal access to education [1], and numerous scholarly, political, or administrative projects focus on areas or population groups whose access is impeded. Recent studies implement the concept of ‘deserts’, and while in general, they are defined as areas of precipitation scarcity, where water resources are low, which therefore affects life [2,3], in population-related analysis, the term ‘desert’ has begun to be used to define areas with low access to specific services. The notion first emerged in food retail, when the USDA used ‘food deserts’ to denote areas where residents face long travel times or limited choice for obtaining healthy groceries, linking them to inequities in diet and health [4,5,6].
After being used in defining areas of food scarcity, the concept was applied to other essential services: studies showing an uneven distribution of health providers conceptualised ‘medical deserts’ or ‘pharmacy deserts’ [7,8,9,10]. European projects such as AHEAD (Action for Health and Equity Addressing Medical Deserts) defined medical deserts as endpoints of ‘medical desertification’ where populations cannot obtain timely, context-appropriate care because providers are too few or too far away and developed indicators and mapping tools to monitor at-risk territories [11,12]. These studies provided the building blocks used in our research: deserts are inherently spatial—measured in terms of distance, travel time, or reachability—and are associated with welfare losses [13,14,15].
Thus, ‘education deserts’ refers to a place where residents have no or very few educational options within a reasonable commuting radius [16]. Such studies are in an emerging phase, and as a result, the criteria used differ. However, the common element is the measure of distance—spatial accessibility [17,18]. Studies around ‘deserts’ have increased as the importance of distance in relation to accessibility has been emphasised [19,20]. At its core, the ‘desert’ framing is spatial, treating accessibility as a function of supply relative to population, modulated by distance, travel time, and costs that shape the decision of actually traversing the space to use the service [21]. The type of distance used in the analysis is also important, as street network distances and travel time produce more accurate results than other measurements, such as Euclidean or Manhattan distance [22]. An improved methodology was possible through advances in spatial analysis. The Application Programming Interface (API) codes provide a very good perspective when assessing spatial accessibility, and travel distance and travel time are more easily retrieved and integrated in the analysis when using them [23,24,25].
Educational deserts were first described in the US, focusing on higher education opportunities. Hillman and Weichman describe education deserts as commuting zones (CZs) with no college or university nearby or only one community college that provides public broad access [26]. Klasik et al. emphasise the distinction between the access desert and the match desert. The former notion follows Hillman’s definition of education deserts, while the latter examines the profile of each college according to students’ educational backgrounds [18]. Education deserts are more prevalent in rural and peri-urban spaces where low density, depopulation, and network sparseness magnify distances between homes and educational facilities [16,27,28]. These analyses highlight the opportunities (or lack thereof) available to different communities, with rurality being an attribute that limits the educational attainment of their populations [29,30].
1.2. Measuring Spatial Accessibility to Education
Spatial aspects of educational inequalities have been analysed through measurements that integrate enrolment years of schooling, and social and economic factors [31,32]. However, when assessing spatial accessibility to educational facilities, different methods and thresholds have been used to evaluate this spatial equity. Usually, studies integrate travel distance and travel time to evaluate accessibility [33]. While some studies use only travel distance [34,35,36], others also incorporate travel time [37,38,39], as it accounts for road speed limits and traffic [40].
More and more spatially orientated studies integrate GIS analysis to identify education deserts. A tool based on open data sources that measures the Euclidean distance to each primary school was used to identify education deserts throughout Ghana, and a threshold of 3 km was considered [41]. Another study used travel distance to public middle schools and demographic student data to identify education deserts within Bogor City [42]. Gonzales [17] considers a threshold of 20 miles for urban students and 40 miles for rural students when choosing a college. It is rarer to find different travel time intervals, but, for example, a K-12 schools study in Pennsylvania defines education deserts as locations farther than a 10 min walk in urban areas, a 10–15 min drive in suburban areas, and a 20 min drive in rural areas [43].
Students’ mode of transport to school depends mainly on the distance to the unit. As distance increases, students usually tend to use public transportation or private cars as well as bicycles [44,45]. However, in rural areas, where distances exceed walking distances, students rely mostly on public transportation and private cars [46]. As there is no consensus on defining the optimal distance to school, scholars have used different catchment sizes when accounting for spatial accessibility, depending on the level of education: Mei et al. [47] consider a threshold of 5 km for kindergarten, primary, and secondary schools in Shenyang, while Rekha et al. [48] consider a 30 min catchment size for K-12 schools in Tiruchirappalli and divide it into three time intervals (0–10 min, 11–20 min and 21–30 min) when making their analysis, Lotfata et al. [49] consider that 20 min of walking is reasonable when looking at public schools in Cook County and Wang et al. [37] consider a 45 min threshold by private car or public transportation for high school students in Wuhan. In a European context, distance thresholds are slightly different: in Italy, results show that the average distance to the nearest high school, depending on their profile, varies between 3 and 5 km, with maximum values reaching almost 52 km. However, there is no ‘average distance to school’ standard in the European Union; thus, in Belgium, a study showed that the average distance from home to school is 5.4 km for primary schools, 10.7 km for secondary schools, and 21.2 km for tertiary education institutions [50].
Even though the number of studies defining education deserts is small, the role that distance to educational institutions plays has been previously analysed [51,52]. Distance to school represents a real barrier to attending and graduating [53,54]. High school enrollment is a basic requirement for pursuing higher education [55]. Thus, having a limited number of high schools nearby increases the likelihood of students not enrolling in higher education [21,56].
1.3. Living Far from School
Living in an education desert has been associated with lower enrolment and completion rates [16,21,57]. In upper-secondary schooling, studies show that longer travel times diminish graduation probabilities [58]. At the same time, school closures and centralisation that lengthen commutes can increase absenteeism and dropout, especially among low-income and rural youth [59] due to the need to use multiple transport modes to reach schools [60], creating spatial injustice [20]. Besides educational outcomes, education deserts create numerous spillover effects that could propagate broader local outcomes. Frenette finds that high school students living in education deserts are less likely to enrol in higher education right after graduation [61]. This would be the case, as students living in education deserts at the high school level usually need to travel even longer distances to access higher education.
Thus, living in an education desert could lower educational attainment and implicit human capital formation and accumulation, thereby depressing local productivity and earnings [13,62]. Other literature shows that education has implications for population health [63], as better educated people exhibit better health behaviours, being less likely to engage in harmful activities such as smoking and drinking [64]. Moreover, schooling decreases the probability of arrest and incarceration, having an impact on the security of the population [65].
Living in an education desert shapes various facets of students’ lives. Regardless of the above academic, human capital, and community implications of education deserts, increased distance to school and, therefore, travel time might impose physical, social, and emotional issues [66]. For example, a longer commuting time limits the possibility of students engaging in extracurricular activities [67], but also of parents taking part in school-related activities [68]. Thus, desert-driven shortfalls impose community-wide costs.
1.4. Romanian Educational Context
The primary and secondary educational system in Romania is mainly publicly funded and mandatory, being divided into pre-school (3–5 years old), primary school (6–10 years old), gymnasium (11–14 years old), and high school (15–18 years old) [69]. Romania, compared to other similar countries in the European Union (EU), faces high national rates of early leaving with a stark rural-urban education divide. In 2024, the country recorded the highest early-leaving-from-school rate in the EU (16.8%), with almost the highest urban-rural differences [70]. OECD reviews of the Romanian educational system reveal wide socio-economic and rural-urban disparities in learning outcomes [71]. Structural factors such as underinvestment, teacher shortages in remote areas, and school network centralisation compound these disparities [72]. Complementary geostatistical work on national evaluations, baccalaureate exam outcomes, and regional development corroborates pronounced spatial clustering of poor results and lower pass rates, which align with peripheral, rural, and economically disadvantaged counties [73,74].
In Romania, the rural-urban education gap has been previously described, showing considerable discrepancies between the two, with the rural high school-aged population needing to travel longer distances to access high schools [75]. This means that the rural population, especially disadvantaged groups, seeking to access any form of education, have to put in considerably more effort to attend school [76]. These discrepancies related to rurality have been described in terms of human capital [13]. However, the exploration of education deserts in Romania has scarcely been addressed, with studies focusing rather on food, medical, or cardiovascular deserts [77,78].
The implications of distance and psychological and socio-economic factors in school dropout and early leaving from school in Romania have been listed by previous studies [79,80]. The Ministry of Education has cited the low spatial accessibility to the school network as one of the leading factors influencing early leaving from school [81]. Evidence from previous studies, in settlements surrounding Bucharest, shows that living more than 30 km from school increases the likelihood of early leaving [82].
Thus, this is the first paper that aims to address the inequalities in education provision at the high school level in Romania and to identify education deserts. This study examines high school access through a spatially oriented analysis, using travel time and distance data. Also, we consider that distance is not the only factor that generates education deserts. For this, the availability of more options for high school facilities, as well as the vulnerability of the population, were integrated in order to identify and evaluate the degree of desertification of each settlement. High school availability has drawn policymakers’ attention because equal opportunities for educational attainment boost people’s economic performance and promote local and regional development, especially in disadvantaged areas [39,83,84]. Furthermore, delimiting education deserts of any kind (of any level) is a realistic tool for policymakers to implement appropriate action in real disadvantaged areas.
2. Materials and Methods
2.1. Study Area
Romania is an EU country with a population of around 21.1 million in 2024, with a surface area of 230,170 km2. Its geography is characterised by 27% mountainous areas, with elevations ranging from 800 to 2500 m. Hills and plateaus cover 42% of the territory, while plains make up 30%. Wetlands represent approximately 5% of the total land area [85]. Romania is divided into 3181 Local Administrative Units (LAU2) and 41 counties (plus Bucharest Municipality), which are reunited into eight regions of development that do not have any administrative power but rather a statistical purpose: North-East, East, South, South-West, West, Centre, North-West and Bucharest-Ilfov (Figure 1). Approximately 54% of the population (320 LAU2) is urban, and the remaining 46% (2861 LAU2) live in rural areas. Bucharest, the capital city, has the highest number of inhabitants, followed by other major cities with around 300,000 inhabitants, such as Cluj-Napoca, Iași, and Timișoara [86].
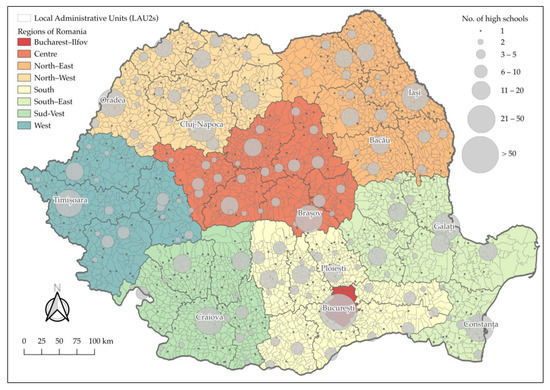
Figure 1.
The spatial distribution of the high school network in Romania.
2.1.1. The Romanian Educational System
Under Law no. 198/2023, all educational cycles are mandatory and free in Romania [87]. Education cycles comprise pre-kindergarten, kindergarten, primary school, gymnasium (lower secondary), and high school (upper secondary).
The Romanian upper secondary education system is divided into high school education (4 years) with four routes: theoretical, technological, vocational, and professional education (3 years), with the latter offering the possibility of studying for two additional years in order to take the baccalaureate exam. The high school network includes three types of facilities: national colleges, theoretical high schools, and technological high schools. National colleges are considered the highest of the three; they usually have better Baccalaureate results and offer more opportunities for students as they are more internationally connected.
Admission to high school in Romania is based on the choice of each student (and, presumably, their family) and according to their national evaluation results. The latter are processed through a computerised system [73]. Even though the results are important for admission, students in Romania tend to choose based on the distance to their preferred high school or its profile. Distance plays an important role in choosing what high school to attend. As distance increases, the likelihood of continuing with high school education decreases, so high school choice is mainly based on proximity, especially for rural students living in remote areas [88].
This study includes the accredited upper-secondary education network of high schools that consists of 1558 units. A total of 84.1% of units (n = 1310) are located in urban areas, while 15.9% (n = 248) are located in rural areas. Most of them are clustered within big cities: 133 high schools in Bucharest, 48 in Cluj-Napoca, and 40 in Timisoara (Figure 1). However, 303 institutions were excluded from the analysis because some are private units, military institutions, or are designed for students with special needs.
2.1.2. The High School-Aged Population
Because the high school location is not spatially linked to the number of high school-aged population, the rural-urban gap in education provision might represent a disadvantage for the population in rural areas. The total high school-aged population, representing the population aged between 15 and 18 years old, is equally distributed between urban with 50.6% (460,947) and rural with 49.4% (449,765). At a regional level, the North-East region has the highest number of high school-aged population—185,406 (20.4%), followed by Bucharest-Ilfov (88,769), South (130,722), and North-West (118,511).
2.2. Data Source
All data used in the design of the present paper are publicly available. Population data for all 3181 LAU2 were obtained from the official database of the National Institute of Statistics in Romania (NIS) for 2021 [89]. The high school-aged population was considered those aged 15–18 years, based on the NIS methodology [69]. Population data on educational attainment (people with high school education or higher, enrolment rate, population with no education) and other socio-economic data were accessed from the 2021 Romanian Census, as it was the most recent available data.
Data on the school network have been retrieved from the official Romanian Government database (data.gov.ro accessed on 15 October 2025). All high schools considered in the analysis were manually geocoded using QGIS 3.36 software, based on the official address of the institution available. Multiple sources were cross-referenced for minimising errors. Validation implied verifying the data provided by the Ministry of Education database, information from each county school inspectorate, and official websites of the high schools.
Geospatial data for all 3181 LAU2 settlements have been retrieved from the official platform of ANCPI (National Agency for Cadastre and Real Estate Advertising) [90]. In Romania, there is no publicly accessible database with information on census tracts, zip codes, or lower administrative units, making it impossible or unreliable to calculate population-weighted centroids. Thus, the geometric centroid of all LAU2 has been considered in this analysis.
Spatial data on travel distance and travel time have been calculated using GIS software (QGIS 3.40). The Origin-Destination Matrix used the geometric centroid of each LAU2 as a starting point for each high school. Travel distance and time were provided through the Open Route Service (ORS) plug-in, which uses OpenStreetMap (OSM) API codes, and offers a more comprehensive image of the spatial accessibility, and diminishes errors as it integrates speed limits and traffic information [77,91].
The methodology follows various steps presented in Figure 2.
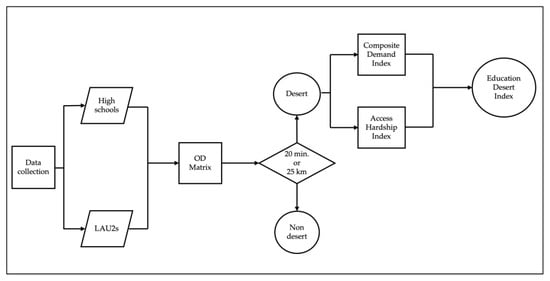
Figure 2.
The methodology flowchart.
2.3. Methods
2.3.1. Identification of Education Deserts
This study defines education deserts based on two measurement conditions: areas/LAU2 where travel time to the nearest accredited high school exceeds 20 min or areas/LAU2 where the road network distance exceeds 25 km, based on results obtained from the Origin-Destination Matrix analysis. As there are no universally agreed-upon criteria for defining education deserts, establishing a single threshold is challenging, as street networks and levels of high school accessibility vary significantly across countries and regions. The 20 min travel time threshold has been considered based on previous literature and the typical timeframe for daily activities [43,92]. The threshold is close to other studies that reported a median travel time to school of around 20 min [93]. The 25 km threshold, however, has been adopted to provide a more accurate analysis of educational spatial accessibility. Even when the quality of the roads in some rural areas is good, the distance itself becomes a burden in terms of cost and efficiency.
Students travelling to high school usually rely on a private car or public transportation when distances increase [60]. At the national level in Romania, there is no publicly available data on public transportation routes and schedules, as they are ensured by private providers. Rural areas in Romania lack adequate spatial access to public transportation, and thus people usually choose to travel by private car to access education, health care services, public institutions, or commercial services [94,95]. The API codes could not generate travel times for public transportation; thus, the private car has been considered for this analysis.
2.3.2. Evaluation of the Degree of Education Desertification
After identifying the education desert areas, we evaluated the degree of education desertification in order to have a better image of areas with less education infrastructure availability and high demand for high school education services. The evaluation was conducted through a composite index comprising two elements: the first was demand measured through the Composite Demand Index (CDI), while the second was the assessment of disparities measured through the Access Hardship Index (AHI). All these indices reflect concepts from previous studies, but the authors have calculated and implemented them for this specific research; they are original and based them on available data. As such, they can be replicated in similar statistical situations.
The CDI is based on three variables: HS (percentage of the high-school-aged population), ENR (high-school enrolment rate), and HSEA (percentage of the population that graduated from high school or above). The HS captures current potential demand for high school educational services, while the ENR reflects the degree to which this potential demand is met, with lower enrolment rates suggesting a higher unmet demand. The HSEA indicates the historical accumulation of educational attainment (at the high school level or above), with lower values highlighting structural educational deficits and higher values indicating latent demand. These variables provide a multidimensional representation of both potential and unmet demand for high school education.
Since the variables are expressed in different units and ranges, all values were normalised using min-max scaling. This procedure ensures that all indicators take values between 0 and 1 and are comparable.
The three variables were orientated to reflect high school educational demand consistently (higher values = greater demand). The HS was used directly, as higher values correspond to greater potential demand. By contrast, higher ENR and higher HSEA indicate demand that has already been satisfied; therefore, their standardised values were inverted (1 − s(x)).
The CDI was computed as the arithmetic mean of the three standardised and orientated indicators:
- the weight assigned to indicator i (in this case, all are equal to 1)
- the raw value of indicator i for unit j
- the normalisation function, which depends on the direction of the indicator (whether a higher value means a better or worse situation)
The three variables in the formula have been normalised by using the Vmax-Vmin method.
The CDI ranges between 0 and 1, with higher values indicating greater educational demand. A score close to 1 reflects LAU2s where the pressure on the high school system is more pronounced. In contrast, values closer to 0 indicate LAU2s with lower potential demand for high-school education. Intermediate values should be interpreted in relative terms, as the index is normalised across the sample: they capture differences between LAU2 rather than absolute thresholds of demand.
The AHI is based on three variables: the percentage of the population with no education (NOS), the average distance in kilometres to the three nearest high schools of each type (DIST3), and the travel time in minutes to the nearest high school (TIME). The DIST3 captures the spatial availability of educational facilities, while the TIME reflects the practical effort required to reach such services. Together, these three variables offer a multidimensional perspective on accessibility, combining historical educational outcomes with spatial and temporal barriers to high-school education.
All three indicators were normalised using min-max scaling to ensure comparability across different units of measurement. Since higher values of each variable denote lower accessibility, the index was constructed as the arithmetic mean of the standardised scores:
- the weight assigned to the indicator
- he raw value of indicator i for LAU 2 unit j
- the standardised value of indicator i for unit j obtained through a normalisation procedure
The AHI ranges from 0 to 1, with higher scores indicating greater access to high-school education. In this analysis, AHI values fall between 0.03 and 0.78, suggesting overall low to moderate levels of access. LAU2 units with values approaching 0.78 are characterised by longer travel distances and times to high schools, combined with higher shares of population without formal education, which signal more pronounced accessibility barriers. Conversely, values closer to 0.03 denote comparatively better access, with shorter distances and travel times, alongside a smaller share of the population with no studies.
The final Educational Desert Index (EDI) evaluates the degree of education desertification and is expressed as a weighted average of the CDI and the AHI. The CDI reflects potential and unmet demand (youth cohort, enrolment, attainment), while the AHI captures spatial-temporal barriers and structural deprivation (no education, distance, travel time). We made a judgement based on weight attribution to assign α = 0.4 to CDI and β = 0.6 to AHI, to emphasise the important role of accessibility in defining educational deserts. Higher EDI values denote more severe educational deserts, namely LAU2, where substantial demand coincides with limited access to high-school education.
3. Results
3.1. Education Deserts in Romania
This study delineates education deserts in Romania at all LAU2s located more than 20 min or 25 km from the nearest accredited high school. This threshold implies the bare minimum of spatial accessibility for the high school-aged population to any high school education institution. Even though the national legislation stipulates equal educational provision for all students, Figure 3 shows that this is not the case at the national level. The map shows significant education deserts overlapping LAU2s from mostly rural, remote, and isolated areas. Education deserts include 1092 LAU2s (34.3%), while the remaining 2086 LAU2s (65.6%) are mostly urban and peri-urban settlements (Table 1).
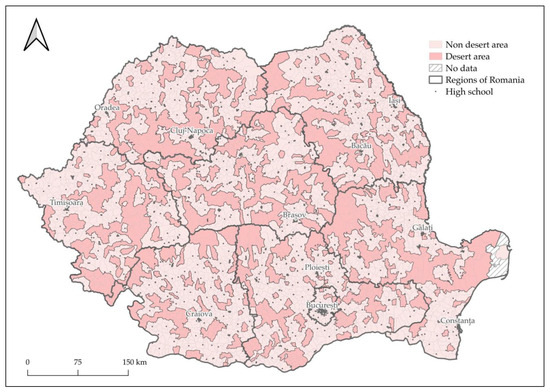
Figure 3.
The spatial distribution of education deserts in Romania.

Table 1.
The distribution of education deserts within regions in Romania.
A considerable percentage of 15.2% of the high school-aged population lives in education desert areas. Regionally, 20.3% of the high school-age population from the Centre region lives in education deserts, and 18% in the South and South-East regions. However, only 0.7% of the high school-aged population from the Bucharest-Ilfov region lives further than 20 min or 25 km away from any high school (Table 1).
3.2. Composite Demand Index
The CDI shows the degree of vulnerability of the population living in education desert areas (Figure 4). The index accounts for the demand for high school education by using the % of the high school-aged population from the total population of the LAU2. The values vary from 0.3% to 8.1%. Another variable taken into consideration is the enrolment rate, with values ranging from 0% enrolment to 171%. Values above 100% are explained by the fact that students enrolled in high school were outside of the typical age range due to reenrolment. Also, the CDI considers the percentage of the population having a high school education or above in order to quantify the need for a high school in proximity, with values ranging from 15% to 74.4%. The High (0.54–0.84), Medium (0.46–0.54), and Low (0.26–0.46) intervals of the CDI were delineated by using the quantile method.
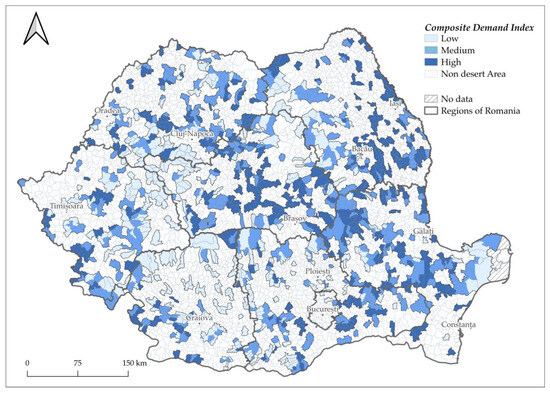
Figure 4.
Distribution of the Composite Demand Index (CDI) in Romania.
The highest shares of high school–aged populations living in high-CDI areas are in the North-East (8.7%), Centre (9.8%), and South-East (8.7%) (Table 2).
Table 2.
Population living in education deserts based on the composite demand index.
3.3. Access Hardship Index
The AHI measures the spatial degree of isolation from any high school education institution. Thus, by considering the minimum distance to the closest high school, even if it falls outside the 20 min threshold, we aim to see which LAU2s are more deprived of upper secondary education. Moreover, in addition to the proximity dimension of this index, we accounted for diversity (the mean distance to three categories of high schools) and people with no education to identify the population with limited options and who decide not to pursue any form of education due to low accessibility.
In this case, the results show that the lowest values overlap mountainous and remote rural settlements located in the East and North-East regions, as well as South-East LAU2s (Figure 5). Thus, most of the high school–aged population living in education deserts with high AHI values are located in the North-East (7.0%), followed by the Centre (8.4%) and the South-East (6.9%) (Table 3).
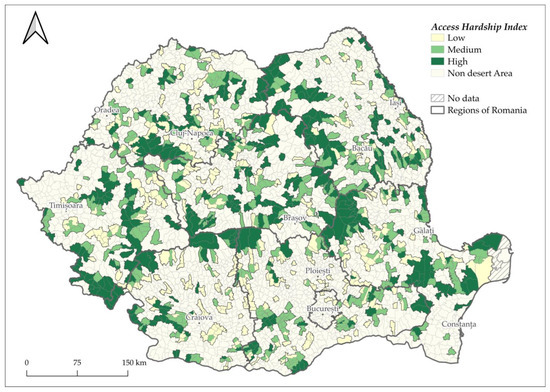
Figure 5.
Distribution of the access hardship index in Romania.
Table 3.
Population living in education deserts based on the access hardship index.
3.4. Education Desert Index
The aggregation of the CDI and AHI indicators into EDI reflects the degree of desertification among LAU2s (Figure 6). This creates a tool for seeing which communities are most vulnerable and where action should be taken as soon as possible. Thus, we identified the regions with the highest degree of educational desertification, where action should be taken in order to provide equitable access to high school education. The Education Desert Index (EDI) has been divided into three levels based on the quantile method: Low (0.202–0.324), Medium (0.324–0.371), and High (0.371–0.720).
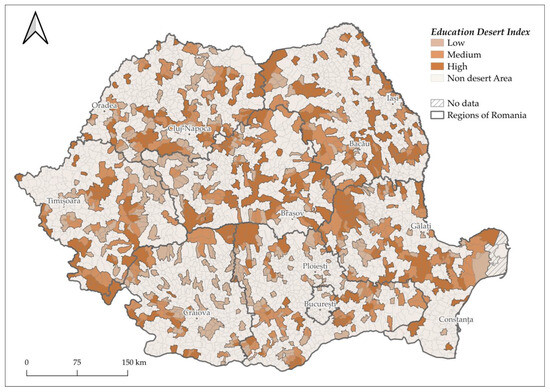
Figure 6.
The degree of education desertification in Romania.
A high share of the high school-aged population lives in education deserts with low EDI values: 7.0% in the South, 7.2% in the South-West, and 4.1% in the West (Table 4). This distribution suggests a lower degree of vulnerability in these, in part because areas with medium CDI tend to be associated with lower AHI. The opposite situation appears in mountainous LAU2s in the Centre and East, where low EDI values are associated with very low demand levels (CDI), rather than good accessibility.
Table 4.
Population living in education deserts based on the education desertification index.
4. Discussion
The Romanian educational system has been neglected, underfinanced, and poorly restructured since the fall of the communist regime [96,97]. Even though some changes and improvements have been made in recent years, the spatial allocation and provision of education facilities have remained unequal across the country, with huge disparities between urban and rural areas [75]. High school admission in Romania is based on the results of national evaluations and further student hierarchisation [73]. This deepens the educational gap because students might not be admitted to the closest high school, or a high school closer to home may not align with the educational path they want to follow.
Even though the spatial allocation of educational facilities and spatial accessibility to education may be influenced by numerous personal, psychological, or familial factors, distance remains a component that has caught specialists’ attention, as it may be the defining factor in the decision to attend high school. Long journeys to school do not affect only attendance, but also have real implications on health and well-being, as longer travel time results in students getting less sleep at night, for example [98]. This could impact cognitive functions, resulting in reduced concentration and productivity of the students during education-related activities [99].
The spatial accessibility to education remains an important problem in Romania and has been previously addressed by public authorities or by scholars [81,100]. Thus, identifying education deserts (areas with a shortage of educational facilities) represents an important step in identifying the disparities in educational provision as well as in considering the areas where action should be taken.
This study shows that most people living in education desert areas are in the North-East, Centre, South-East and South regions, and these areas usually overlap with rural mountainous, wetlands, and areas with poor road infrastructure. These regions are even more disadvantaged as they also represent the poorest regions in Romania, with very low income and high unemployment rates [101].
In order to evaluate the degree of education desertification within the existing education deserts identified, we have created a composite index (EDI). The first component of the composite demand index is CDI. Settlements with high CDI have a higher number of high school-aged population and lower enrolment rates. A CDI score close to 1 is typically due to a larger share of the high school-aged population, relatively low enrolment rates, and lower historical levels of educational attainment. In contrast, values closer to 0 point to either a smaller youth cohort, already high enrolment rates, or an adult population with higher levels of completed education. This index also integrates the population with no education, which reflects structural educational deprivation, often linked to past poor access and persisting educational vulnerability. On the other hand, low CDI values overlap settlements from the Centre and North-West regions in mountainous areas, where the number of high school-aged population is low.
The AHI takes into consideration the spatial allocation of the high school network, both from a proximity and a diversity perspective, while also accounting for the population with no education, i.e., those who are or have been deprived of any form of education. Thus, high AHI values are explained by long distances to the nearest high school (proximity) as well as limited options (diversity), quantified by the mean distance to three high school categories, or by regions with a high number of people with no education. In this case, high AHI values are identified in settlements located in mountainous areas or overlapping the Danube Delta. Conversely, low AHI values are generally observed in the South and South-West regions, where the road infrastructure density is better, and the number of high school options clustered around big cities is greater.
Finally, the composite Education Desert Index (EDI) is used to evaluate education desertification. It is an important tool that accounts for areas with high demand for high school education, but a mismatched supply and allocation of high school units. High EDI values are correlated with areas where the demand is high and accessibility is low. These areas, especially in the North-East and South-East regions, have a lower level of economic development [102]. Whereas, low EDI values are found in the South and South-West regions, where most settlements are well connected to the road network. Additionally, these values reflect large urban settlements with clusters of high schools, such as those in Bucharest, Craiova, and Ploiești. The low EDI values in the North-West and Centre regions are caused by settlements with a demographically aged population, and as such, a low number of high school-aged population, as well as low demand.
Together, these data indicate that Romanian education deserts are not simply about distance and travel time, but rather reflect transport supply, settlement dispersion and the few options available to students living in remote areas [75]. Previous studies on the identification of education deserts have found, for example, that in the United States, around 12% of the high school students live in education deserts [18]. Another study from the United States shows that almost 77.8% of the Pennsylvania state residents live in education deserts. Rodriguez-Segura & Kim (2021) addressed the issue of education deserts in developing countries by looking at the spatial accessibility to primary schools, showing that 4.7% of the population lived in an education desert in Guatemala, 40.6% in Tanzania, 11.5% in Peru, and 5.1% in South Africa [41]. In comparison, our results show that 15.2% of the high school age population live in education deserts.
Results vary considerably between countries, but comparing them is difficult as each country and its education system exists in different contexts. In Romania, only two previous studies have addressed the spatial accessibility to education facilities issue, so comparisons of the results might not offer a comprehensive image. In this case, the first study addressed the spatial accessibility to the high school network in Romania across different high school categories, showing that a student has to travel on average 13.1 km in order to access the nearest high school [75]. The other study addressed the spatial accessibility issue for the Bucharest-Ilfov region and the relationship between distance and school dropout in smaller towns around Bucharest [82]. The latter study found that longer travel times to school are linked with absenteeism and dropout from school.
Graduating from high school is an important step in accessing higher education. In Romania, entering higher education units is conditioned by promoting the National Bacalaureat exam. At the national level, students from rural areas usually encounter lower success rates in the Baccalaureate exam. A geostatistical analysis of the Baccalaureate exam between 2015 and 2022 shows that 36.51% of the students in rural areas will not pass the exam, mostly due to accessibility, motivation, and financial issues [74]. Thus, with such low success rates at the baccalaureate exam, tertiary education attainment in Romania remains below the European Union average, at only 23.2%, compared to the EU average attainment of 44.1%. In rural areas of Romania, tertiary education attainment is even worse [103]. Even though not directly causal, living in education deserts could represent an important cause.
Romania is currently undergoing significant changes to its education legislation. Under Law no. 141/2025, all educational units are subject to massive structural changes [104]. High school classrooms with fewer than 16 students will automatically be dissolved, and students will be relocated to other classes from the same institution if possible. If not, students can be relocated to other institutions, often in other localities, thereby increasing travel times and distances. As Romania has undergone population decline since 1990, in the long run, a shrinking school population could lead to the closure of more high schools, thus increasing the distance and time students have to cover in order to pursue their studies [105,106,107]. Future analysis of the effects of closing high schools should be examined, as school attendance often goes beyond an educational tool, but it also serves as a community-forming mechanism [43].
Law no. 141/2025 creates other constraints on the education system. Due to the increase in the number of hours a teacher has to teach each week, some may not find enough classes in one school and need to commute, creating problems in the quality of education they provide. As this does not represent the purpose of the present study, future studies should investigate the relationship between the rural allocation of education facilities and the quality of education offered to students.
Building on the EDI results, public policies should consider realistic mobility measures with a bolder reorganisation of the school network environment. High school students in Romania reported long distances to school as a driving factor in their decision to drop out of school [108]. Even if students in Romania are given free public transportation to school, most of the time the transportation providers are private and do not collaborate with public institution budgets, so students need to pay for their way to school or rely on a private car. In this case, public school buses provided for each high school catchment area could represent a solution, especially in underserved areas or LAU2s that are education deserts. No realistic data on the number of student dorms or beds are available at the national level; thus, they exist, but most of the time they are undersized relative to the demand, or the living conditions are below expectations. In this case, for high EDI LAU2s in the North-East, South-East, and Centre regions, public authorities could prioritise the construction and modernisation of student dormitories. In this case, guaranteed beds for rural students from education desert areas would decrease the number of students travelling long distances to school. Also, the hierarchisation of high schools in Romania usually makes the closest high school not a viable option for the educational pathway a student might want to follow. Thus, diversifying profiles in smaller local high schools and making admission more distance-oriented, especially for students living in education deserts, would decrease the gaps in spatial accessibility to the high school network. Taken together, these public policy measures would turn the mapping of the education deserts into an operational tool for public authorities, not only by describing where the deserts are located, but also by emphasising where to take action in order to close the gap in high school education provision.
Limitations of the Study
As an exploratory study and one of the few to address the spatial dimension of education in Romania, this study is prone to some limitations. Firstly, spatial accessibility has been computed from the LAU2 geometric centroid to high schools, neglecting settlement dispersion. When conducting a study at the national level in Romania, integrating numerous and varied data, the availability of data at lower scales might represent an issue, as it is lacking and/or inconsistent [109]. This happens because Romania lacks public access to census tract data or zip codes, which makes calculating the spatial accessibility of each potential high school student to school prone to routing and distance errors [110]. However, in Romania, the lack of weighted population centroids or zip codes makes the geometric centroid a viable option to be used, especially for national-scale studies.
When analysing the spatial accessibility to the high school network, the private car was considered as a mode of transportation because no other available datasets on public transportation were available. Thus, no data on public transportation at the national level could be retrieved from the OSM API codes. When analysing spatial accessibility at such a large scale, simulating public transportation accessibility could have been very difficult, as no data on routing and schedules are available from the private transportation providers. It is important to consider that spatial accessibility could be even worse than that measured in this study because, nationally, public transportation is usually slower and operates on preestablished timetables. Thus, future studies at lower scales should focus on the subject of effective public transportation for rural areas in Romania in order to access education services.
As only the Romanian National Census provides data on enrolment and educational attainment at the LAU2 level, the most recent available data had to be the one derived from the 2021 census. Future comparability for studies performed in Romania depends on census results.
5. Conclusions
The present paper aimed to evaluate the spatial accessibility to the high school network in Romania and to identify those areas most deprived of high school–level education facilities. We considered education deserts to be settlements that are more than 20 min or 25 km from any high school. These thresholds have been used in previous studies that considered similar travel times and distances to delineate education deserts.
By combining network-based travel times and distances with demographic data, we identified widespread accessibility deficits: our results show that one in six high school-aged students (15.2%) lives in an education desert and that one in three LAU2s is an education desert.
Education deserts cluster in rural and peripheral areas with a weak transport infrastructure, sparse high school options, and lower attainment.
Overall, Romania’s high school landscape exhibits pronounced, spatially patterned inequities in spatial accessibility. Beyond simple proximity, the Education Desert Index (EDI) integrates a Composite Demand Index (CDI) and an Access Hardship Index (AHI), emphasising the overlap of unmet demand with limited availability and diversity. The proposed Education Desert Index (EDI) offers a reproducible instrument to identify where unmet demand and limited availability meet and prioritise those areas in order to reduce geography-driven barriers for those in need.
The evaluation of identified education deserts offers can prioritise targeted public policies on public transport interventions, reconfiguration of the high school network to counteract unmet needs in LAU2 with high CDI values, where youth cohorts are large, but attainment and enrollment are low, and even the construction and modernisation of the school dormitories. In the context of the expected closure of underpopulated high schools, our findings highlight that without compensatory mobility policies, the risks of spatial exclusion for students from high-EDI LAU2s will only deepen.
Future work should look at incorporating multimodal transportation means in assessing the spatial accessibility to education units and linking to outcomes such as attendance, dropout, or Baccalaureate success to quantify mechanisms and stimulate policy scenarios. Also, extending the framework to other levels of education, such as primary and lower secondary, with age-appropriate thresholds, would provide an even more comprehensive view of the extent of educational desertification in Romania.
Author Contributions
Conceptualization, Angelo-Andi Petre, Liliana Dumitrache and Alexandra Cioclu; methodology, Angelo-Andi Petre, Liliana Dumitrache and Alexandra Cioclu; software, Angelo-Andi Petre and Alexandra Cioclu; validation, Angelo-Andi Petre, Liliana Dumitrache and Alina Mareci; formal analysis, Angelo-Andi Petre and Alexandra Cioclu; investigation, Angelo-Andi Petre, Liliana Dumitrache and Alexandra Cioclu; resources, Angelo-Andi Petre; data curation, Angelo-Andi Petre, Alina Mareci and Alexandra Cioclu; writing—original draft preparation, Angelo-Andi Petre and Alexandra Cioclu; writing—review and editing, Liliana Dumitrache and Alina Mareci; visualisation, Angelo-Andi Petre and Alexandra Cioclu; supervision, Angelo-Andi Petre and Liliana Dumitrache. All authors have read and agreed to the published version of the manuscript.
Funding
This research received no external funding.
Data Availability Statement
The data presented in this study are available upon request from the corresponding authors.
Conflicts of Interest
The authors declare no conflicts of interest.
References
- Žalėnienė, I.; Pereira, P. Higher Education for Sustainability: A Global Perspective. Geogr. Sustain. 2021, 2, 99–106. [Google Scholar] [CrossRef]
- Mayhew, S. A Dictionary of Geography, 5th ed.; Oxford University Press: Oxford, UK, 2015; ISBN 978-0-19-968085-6. [Google Scholar]
- Hallett, L.F.; McDermott, D. Quantifying the Extent and Cost of Food Deserts in Lawrence, Kansas, USA. Appl. Geogr. 2011, 31, 1210–1215. [Google Scholar] [CrossRef]
- Allcott, H.; Diamond, R.; Dubé, J.-P.; Handbury, J.; Rahkovsky, I.; Schnell, M. Food Deserts and the Causes of Nutritional Inequality. Q. J. Econ. 2019, 134, 1793–1844. [Google Scholar] [CrossRef]
- Ploeg, M.V.; Breneman, V.; Farrigan, T.; Hamrick, K.; Hopkins, D.; Kaufman, P.; Lin, B.-H.; Nord, M.; Smith, T.; Williams, R.; et al. Access to Affordable and Nutritious Food: Measuring and Understanding Food Deserts and Their Consequences; Diane Publishing: Darby, PA, USA, 2010. [Google Scholar]
- Beaulac, J.; Kristjansson, E.; Cummins, S. A Systematic Review of Food Deserts, 1966–2007. Prev. Chronic Dis. 2009, 6, A105. [Google Scholar]
- Mathis, W.S.; Berenbrok, L.A.; Kahn, P.A.; Appolon, G.; Tang, S.; Hernandez, I. Vulnerability Index Approach to Identify Pharmacy Deserts and Keystone Pharmacies. JAMA Netw. Open 2025, 8, e250715. [Google Scholar] [CrossRef]
- Qato, D.M.; Daviglus, M.L.; Wilder, J.; Lee, T.; Qato, D.; Lambert, B. ‘Pharmacy Deserts’ Are Prevalent in Chicago’s Predominantly Minority Communities, Raising Medication Access Concerns. Health Aff. 2014, 33, 1958–1965. [Google Scholar] [CrossRef]
- Catalano, G.; Khan, M.M.M.; Chatzipanagiotou, O.P.; Pawlik, T.M. Pharmacy Accessibility and Social Vulnerability. JAMA Netw. Open 2024, 7, e2429755. [Google Scholar] [CrossRef]
- Dubas-Jakóbczyk, K.; Gonzalez, A.I.; Domagała, A.; Astier-Peña, M.P.; Vicente, V.C.; Planet, A.; Quadrado, A.; Serrano, R.M.; Abellán, I.S.; Ramos, A.; et al. Medical Deserts in Spain—Insights from an International Project. Health Plan. Manag. 2024, 39, 708–721. [Google Scholar] [CrossRef]
- AHEAD. National Policy Dialogue: Romania-Policy Options for Addressing Medical Deserts. 2023. Available online: https://ahead.health/wp-content/uploads/2023/07/AHEAD_Romania-policy-brief_English_REUPLOAD-1.pdf (accessed on 20 September 2025).
- Brînzac, M.G.; Kuhlmann, E.; Dussault, G.; Ungureanu, M.I.; Cherecheș, R.M.; Baba, C.O. Defining Medical Deserts—An International Consensus-Building Exercise. Eur. J. Public Health 2023, 33, 785–788. [Google Scholar] [CrossRef]
- Petre, A.A. Spatial Distribution of Human Capital in Romania. Hum. Geogr.—J. Stud. Res. Hum. Geogr. 2021, 16, 229–241. [Google Scholar] [CrossRef]
- Widener, M.J.; Shannon, J. When Are Food Deserts? Integrating Time into Research on Food Accessibility. Health Place 2014, 30, 1–3. [Google Scholar] [CrossRef]
- Abel, J.R.; Deitz, R. Do Colleges and Universities Increase Their Region’s Human Capital? J. Econ. Geogr. 2012, 12, 667–691. [Google Scholar] [CrossRef]
- Hillman, N.W. Geography of College Opportunity: The Case of Education Deserts. Am. Educ. Res. J. 2016, 53, 987–1021. [Google Scholar] [CrossRef]
- González Canché, M.S. Nearby College Enrollment and Geographical Skills Mismatch: (Re) Conceptualizing Student Out-Migration in the American Higher Education System. J. High. Educ. 2018, 89, 892–934. [Google Scholar] [CrossRef]
- Klasik, D.; Blagg, K.; Pekor, Z. Out of the Education Desert: How Limited Local College Options Are Associated with Inequity in Postsecondary Opportunities. Soc. Sci. 2018, 7, 165. [Google Scholar] [CrossRef]
- Muhaimin, A.A.; Gamal, A.; Setianto, M.A.S.; Larasati, W.L. The Spatial Justice of School Distribution in Jakarta. Heliyon 2022, 8, e11369. [Google Scholar] [CrossRef]
- Tieken, M.C.; Auldridge-Reveles, T.R. Rethinking the School Closure Research: School Closure as Spatial Injustice. Rev. Educ. Res. 2019, 89, 917–953. [Google Scholar] [CrossRef]
- Turley, R.N.L. College Proximity: Mapping Access to Opportunity. Sociol. Educ. 2009, 82, 126–146. [Google Scholar] [CrossRef]
- Tatit, P.; Adhinugraha, K.; Taniar, D. Navigating the Maps: Euclidean vs. Road Network Distances in Spatial Queries. Algorithms 2024, 17, 29. [Google Scholar] [CrossRef]
- Zheng, Z.; Xia, H.; Ambinakudige, S.; Qin, Y.; Li, Y.; Xie, Z.; Zhang, L.; Gu, H. Spatial Accessibility to Hospitals Based on Web Mapping API: An Empirical Study in Kaifeng, China. Sustainability 2019, 11, 1160. [Google Scholar] [CrossRef]
- Wang, J.; Su, Y.; Chen, Z.; Tang, L.; Wang, G.; Wang, J. Assessing the Spatial Accessibility of Urban Medical Facilities in Multi-Level and Multi-Period Scales Based on Web Mapping API and an Improved Potential Model. IJGI 2022, 11, 545. [Google Scholar] [CrossRef]
- Liu, A.; Kelobonye, K.; Zhou, Z.; Xu, Q.; Xu, Z.; Han, L. School Commuting Mode Shift: A Scenario Analysis for Active School Commuting Using GIS and Online Map API. IJGI 2020, 9, 520. [Google Scholar] [CrossRef]
- Hillman, N.; Weichman, T. Education Deserts: The Continued Significance of “Place” in the Twenty-First Century; Viewpoints: Voices from the Field; American Council on Education: Washington, DC, USA, 2016. [Google Scholar]
- Yang, Y.; Sun, Y.; Yang, Y. Analysis of Spatial Accessibility for Rural School Redistricting in West China: A Case Study of the Primary Schools in Zhenyuan County, Yunnan Province. In Proceedings of the 2017 4th International Conference on Information Science and Control Engineering (ICISCE), Changsha, China, 21–23 July 2017; IEEE: Changsha, China, 2017; pp. 193–197. [Google Scholar]
- Zhu, Y.; Zinda, J.A.; Liu, Q.; Wang, Y.; Fu, B.; Li, M. Accessibility of Primary Schools in Rural Areas and the Impact of Topography: A Case Study in Nanjiang County, China. Land 2023, 12, 1134. [Google Scholar] [CrossRef]
- Vitale Brovarone, E.; Cotella, G. Improving Rural Accessibility: A Multilayer Approach. Sustainability 2020, 12, 2876. [Google Scholar] [CrossRef]
- Allen, J.M.; Wright, S.; Cranston, N.; Watson, J.; Beswick, K.; Hay, I. Raising Levels of School Student Engagement and Retention in Rural, Regional and Disadvantaged Areas: Is It a Lost Cause? Int. J. Incl. Educ. 2018, 22, 409–425. [Google Scholar] [CrossRef]
- Xiang, L.; Stillwell, J.; Burns, L.; Heppenstall, A.; Norman, P. A Geodemographic Classification of Sub-Districts to Identify Education Inequality in Central Beijing. Comput. Environ. Urban Syst. 2018, 70, 59–70. [Google Scholar] [CrossRef]
- Xiang, L.; Stillwell, J.; Burns, L.; Heppenstall, A. Measuring and Assessing Regional Education Inequalities in China under Changing Policy Regimes. Appl. Spat. Anal. 2020, 13, 91–112. [Google Scholar] [CrossRef]
- Ogryzek, M.; Podawca, K.; Cienciała, A. Geospatial Tools in the Analyses of Land Use in the Perspective of the Accessibility of Selected Educational Services in Poland. Land Use Policy 2022, 122, 106373. [Google Scholar] [CrossRef]
- Andersson, E.; Malmberg, B.; Östh, J. Travel-to-School Distances in Sweden 2000–2006: Changing School Geography with Equality Implications. J. Transp. Geogr. 2012, 23, 35–43. [Google Scholar] [CrossRef]
- Gao, Y.; He, Q.; Liu, Y.; Zhang, L.; Wang, H.; Cai, E. Imbalance in Spatial Accessibility to Primary and Secondary Schools in China: Guidance for Education Sustainability. Sustainability 2016, 8, 1236. [Google Scholar] [CrossRef]
- Xu, Y.; Song, W.; Liu, C. Social-Spatial Accessibility to Urban Educational Resources under the School District System: A Case Study of Public Primary Schools in Nanjing, China. Sustainability 2018, 10, 2305. [Google Scholar] [CrossRef]
- Wang, Y.; Liu, Y.; Xing, L.; Zhang, Z. An Improved Accessibility-Based Model to Evaluate Educational Equity: A Case Study in the City of Wuhan. IJGI 2021, 10, 458. [Google Scholar] [CrossRef]
- Jiang, L.; Chen, J.; Tian, Y.; Luo, J. Spatial Pattern and Influencing Factors of Basic Education Resources in Rural Areas around Metropolises—A Case Study of Wuhan City’s New Urban Districts. IJGI 2022, 11, 576. [Google Scholar] [CrossRef]
- Yao, L.; Lv, M.; Li, T.; Wang, D.; Cao, X. Exploring the Evolution of the Accessibility of Educational Facilities and Its Influencing Factors in Mountainous Areas: A Case Study of the Rocky Desertification Area in Yunnan, Guangxi, and Guizhou. IJGI 2022, 11, 296. [Google Scholar] [CrossRef]
- Weiss, D.J.; Nelson, A.; Gibson, H.S.; Temperley, W.; Peedell, S.; Lieber, A.; Hancher, M.; Poyart, E.; Belchior, S.; Fullman, N.; et al. A Global Map of Travel Time to Cities to Assess Inequalities in Accessibility in 2015. Nature 2018, 553, 333–336. [Google Scholar] [CrossRef]
- Rodriguez-Segura, D.; Kim, B.H. The Last Mile in School Access: Mapping Education Deserts in Developing Countries. Dev. Eng. 2021, 6, 100064. [Google Scholar] [CrossRef]
- Asnawi, S.; Dimyati, M.; Yusuf, R. Education Deserts Mapping of Public Middle Schools in Bogor City: A Step Towards Educational Equity. IOP Conf. Ser. Earth Environ. Sci. 2024, 1353, 012037. [Google Scholar] [CrossRef]
- Alexander, M.; Massaro, V.A. School Deserts: Visualizing the Death of the Neighborhood School. Policy Futures Educ. 2020, 18, 787–805. [Google Scholar] [CrossRef]
- Ewing, R.; Schroeer, W.; Greene, W. School Location and Student Travel Analysis of Factors Affecting Mode Choice. Transp. Res. Rec. J. Transp. Res. Board 2004, 1895, 55–63. [Google Scholar] [CrossRef]
- Pooley, C.G.; Turnbull, J.; Adams, M. Journey to School in Britain since the 1940s: Continuity and Change. Area 2005, 37, 43–53. [Google Scholar] [CrossRef]
- Müller, S.; Tscharaktschiew, S.; Haase, K. Travel-to-School Mode Choice Modelling and Patterns of School Choice in Urban Areas. J. Transp. Geogr. 2008, 16, 342–357. [Google Scholar] [CrossRef]
- Mei, D.; Xiu, C.; Feng, X.; Wei, Y. Study of the School–Residence Spatial Relationship and the Characteristics of Travel-to-School Distance in Shenyang. Sustainability 2019, 11, 4432. [Google Scholar] [CrossRef]
- Rekha, R.S.; Radhakrishnan, N.; Mathew, S. Spatial Accessibility Analysis of Schools Using Geospatial Techniques. Spat. Inf. Res. 2020, 28, 699–708. [Google Scholar] [CrossRef]
- Lotfata, A.; Tao, R.; Su, Y. Evaluating the Walking Accessibility of Cook County’s Public Schools to Use as Open Space. Int. J. Urban Sci. 2023, 27, 1–18. [Google Scholar] [CrossRef]
- Marique, A.-F.; Dujardin, S.; Teller, J.; Reiter, S. School Commuting: The Relationship between Energy Consumption and Urban Form. J. Transp. Geogr. 2013, 26, 1–11. [Google Scholar] [CrossRef]
- Arretche, M. The Geography of Access to Basic Services in Brazil. In Paths of Inequality in Brazil; Arretche, M., Ed.; Springer International Publishing: Cham, Switzerland, 2019; pp. 137–161. ISBN 978-3-319-78183-9. [Google Scholar]
- Chairassamee, N.; Chancharoenchai, K.; Saraithong, W. Getting There: How Commuting Time and Distance Impact Students’ Health. PLoS ONE 2024, 19, e0314687. [Google Scholar] [CrossRef]
- Hamnett, C.; Butler, T. ‘Geography Matters’: The Role Distance Plays in Reproducing Educational Inequality in East London. Trans. Inst. Br. Geogr. 2011, 36, 479–500. [Google Scholar] [CrossRef]
- Das, B.; Das, A. Is Distance to Secondary School a Barrier to Secondary and Higher Education in India? Millenn. Asia 2023, 14, 102–126. [Google Scholar] [CrossRef]
- Yue, Z.; Zhao, K. Understanding the Effectiveness of Higher Education System: Evidences from Market Outcomes of Early University Graduates in Seven European Countries. Sustainability 2020, 12, 7761. [Google Scholar] [CrossRef]
- Park, P.N.; Sanders, S.R.; Cope, M.R.; Muirbrook, K.A.; Ward, C. New Perspectives on the Community Impact of Rural Education Deserts. Sustainability 2021, 13, 12124. [Google Scholar] [CrossRef]
- Gibbons, S.; Vignoles, A. Geography, Choice and Participation in Higher Education in England. Reg. Sci. Urban Econ. 2012, 42, 98–113. [Google Scholar] [CrossRef]
- Falch, T.; Lujala, P.; Strøm, B. Geographical Constraints and Educational Attainment. Reg. Sci. Urban Econ. 2013, 43, 164–176. [Google Scholar] [CrossRef]
- Engberg, J.; Gill, B.; Zamarro, G.; Zimmer, R. Closing Schools in a Shrinking District: Do Student Outcomes Depend on Which Schools Are Closed? J. Urban Econ. 2012, 71, 189–203. [Google Scholar] [CrossRef]
- Mandic, S.; Sandretto, S.; Hopkins, D.; Wilson, G.; Kidd, G.; García Bengoechea, E. School Choice, Distance to School and Travel to School Patterns among Adolescents. J. Transp. Health 2023, 33, 101704. [Google Scholar] [CrossRef]
- Frenette, M. Too Far to Go On? Distance to School and University Participation. Educ. Econ. 2006, 14, 31–58. [Google Scholar] [CrossRef]
- Schultz, T.W. Capital Formation by Education. J. Political Econ. 1960, 68, 571–583. [Google Scholar] [CrossRef]
- Long, Y.; Jia, C.; Luo, X.; Sun, Y.; Zuo, W.; Wu, Y.; Wu, Y.; Kaierdebieke, A.; Lin, Z. The Impact of Higher Education on Health Literacy: A Comparative Study between Urban and Rural China. Sustainability 2022, 14, 12142. [Google Scholar] [CrossRef]
- Cutler, D.M.; Lleras-Muney, A. Understanding Differences in Health Behaviors by Education. J. Health Econ. 2010, 29, 1–28. [Google Scholar] [CrossRef]
- Lochner, L.; Moretti, E. The Effect of Education on Crime: Evidence from Prison Inmates, Arrests, and Self-Reports. Am. Econ. Rev. 2004, 94, 155–189. [Google Scholar] [CrossRef]
- Vitale, M.; Millward, H.; Spinney, J. School Siting and Mode Choices for School Travel: Rural–Urban Contrasts in Halifax, Nova Scotia, Canada. Case Stud. Transp. Policy 2019, 7, 64–72. [Google Scholar] [CrossRef]
- Kirshner, B.; Gaertner, M.; Pozzoboni, K. Tracing Transitions: The Effect of High School Closure on Displaced Students. Educ. Eval. Policy Anal. 2010, 32, 407–429. [Google Scholar] [CrossRef]
- Bell, C.A. Space and Place: Urban Parents’ Geographical Preferences for Schools. Urban Rev. 2007, 39, 375–404. [Google Scholar] [CrossRef]
- Institutul National de Statistică. Populația Școlară. 2024. Available online: https://insse.ro/cms/sites/default/files/com_presa/com_pdf/sistemul_educational_2024_r.pdf (accessed on 15 September 2025).
- EUROSTAT Early Leavers from Education and Training. Statistics Explained. Available online: https://ec.europa.eu/eurostat/statistics-explained/SEPDF/cache/1150.pdf (accessed on 10 October 2025).
- OECD. Education at a Glance 2024 Sources, Methodologies and Technical Notes; OECD Publishing: Paris, France, 2024. [Google Scholar]
- OECD. Responsive School Systems: Connecting Facilities, Sectors and Programmes for Student Success; OECD Reviews of School Resources; OECD Publishing: Paris, France, 2018; ISBN 978-92-64-30669-1. [Google Scholar]
- Muntele, I.; Istrate, M.; Bunduc, F. Educational Disparities in Romania. A Multilevel Analysis of the National Assessment Examination Succes Rate. Rom. J. Geogr. 2020, 64, 43–55. [Google Scholar]
- Buza, V.; Tușa, E. Disparities in School Performance in Romania. A Geostatistical Analysis of Baccalaureate Results between 2015–2022. RREM 2024, 16, 391–428. [Google Scholar] [CrossRef]
- Petre, A.A.; Dumitrache, L.; Mareci, A.; Cioclu, A. The Urban–Rural Education Divide: A GIS-Based Assessment of the Spatial Accessibility of High Schools in Romania. IJGI 2025, 14, 183. [Google Scholar] [CrossRef]
- Mareci, A.; Dumitrache, L.; Nae, M.; Tudoricu, A.; Cioclu, A. A Qualitative Exploration of Experiences of Asylum Seekers and People with Refugee Backgrounds in Accessing the Education System in Romania. Sustainability 2023, 15, 4120. [Google Scholar] [CrossRef]
- Petre, A.A.; Mirea, I.A. Spatial Accessibility to Supermarkets in Dâmbovița County. In Foodscapes; Kühne, O., Fischer, J.D., Sedelmeier, T., Hochschild, V., Staniscia, B., Manetti, C., Dumitrache, L., Talos, A.-M., Menéndez Rexach, A., De Marcos Fernández, A., Eds.; RaumFragen: Stadt—Region—Landschaft; Springer Fachmedien Wiesbaden: Wiesbaden, Germany, 2023; pp. 89–104. ISBN 978-3-658-41498-6. [Google Scholar]
- Cioclu, A.; Dumitrache, L.; Mareci, A.; Nae, M. Tackling Cardiovascular Care Deserts in Romania: Expanding Population Access in Underserved Areas. Healthcare 2024, 12, 2577. [Google Scholar] [CrossRef]
- Alexa, S.; Baciu, E.-L. School Dropout and Early School Leaving in Romania: Tendencies and Risk Factors. RREM 2021, 13, 18–38. [Google Scholar] [CrossRef]
- Miron, M.; Mistrean, L. A Comparative Analysis of School Dropout Causes in Rural and Urban Romania. ESM 2024, 2, 134–144. [Google Scholar] [CrossRef]
- Ministry of Education. Strategia Privind Reducerea Părăsirii Timpurii a Școlii În România. Available online: https://www.edu.ro/sites/default/files/_fi%C8%99iere/Invatamant-Preuniversitar/2015/Strategie-PTS/Strategia-PTS-2015.pdf (accessed on 24 September 2025).
- Petre, F.-B.; Teodorescu, C.; Cioclu, A. School Dropout in Satellite Towns around Bucharest, Romania. Soc. Sci. 2024, 13, 285. [Google Scholar] [CrossRef]
- Huang, Q.; Cui, X.; Ma, L. The Equity of Basic Educational Facilities from the Perspective of Space. Sustainability 2023, 15, 12031. [Google Scholar] [CrossRef]
- Huang, C.; Feng, Y.; Wei, Y.; Sun, D.; Li, X.; Zhong, F. Assessing Regional Public Service Facility Accessibility Using Multisource Geospatial Data: A Case Study of Underdeveloped Areas in China. Remote Sens. 2024, 16, 409. [Google Scholar] [CrossRef]
- Ielenicz, M.; Pătru, I.; Săndulache, I.; Răzvan, O.; Comănescu, L. România: Carpații: Caracteristici Generale (Partea I); Bucharest University Press: Bucharest, Romania, 2009. [Google Scholar]
- Suditu, B.; Nae, M.; Neguţ, S.; Dumitrache, L.; Gheorghilaş, A. Suburban Landscapes in Romania from ‘Forting-Up’ to ‘Informal-Up’ and Limits of Public Action. Eur. J. Sci. Theol. 2014, 10, 125–138. [Google Scholar]
- Romanian Parliament. Law No. 198/2023 Law on Pre-University Education; Modified and Updated by the Government Emergency Ordinance 156/2024; Monitorul Oficial 613/2023; Monitorul Oficial Publishing House: Bucharest, Romania, 2023. [Google Scholar]
- Kerekes, K.; Pirău, H.; Kis, B.-Á.; Ábrahám, B. Factors Influencing Educational Choices of Romanian Rural Youth. Stud. Agr. Econ. 2017, 119, 130–138. [Google Scholar] [CrossRef]
- National Institute of Statistics (NIS). Tempo Online Statistics. 2025. Available online: http://statistici.insse.ro:8077/tempo-online/#/pages/tables/insse-table (accessed on 10 September 2025).
- National Agency for Cadastre and Real Estate Advertising (ANCPI). Geoportal ANCPI. Available online: https://geoportal.ancpi.ro/portal/home/ (accessed on 10 September 2025).
- Campos-Sánchez, F.S.; Abarca-Álvarez, F.J.; Molina-García, J.; Chillón, P. A GIS-Based Method for Analysing the Association Between School-Built Environment and Home-School Route Measures with Active Commuting to School in Urban Children and Adolescents. Int. J. Environ. Res. Public Health 2020, 17, 2295. [Google Scholar] [CrossRef]
- Charreire, H.; Casey, R.; Salze, P.; Simon, C.; Chaix, B.; Banos, A.; Badariotti, D.; Weber, C.; Oppert, J.-M. Measuring the Food Environment Using Geographical Information Systems: A Methodological Review. Public Health Nutr. 2010, 13, 1773–1785. [Google Scholar] [CrossRef] [PubMed]
- Verma, V.R.; Dash, U. Geographical Accessibility and Spatial Coverage Modelling of Public Health Care Network in Rural and Remote India. PLoS ONE 2020, 15, e0239326. [Google Scholar] [CrossRef]
- Popescu, A.; Tindeche, C.; Mărcuță, A.; Mărcuță, L. Rural Areas in Romania—Discrepancies Versus Urban Areas and European Union. Scientific Papers. Series “Management, Economic Engineering in Agriculture and rural development”. 2022, 22. Available online: https://www.cabidigitallibrary.org/doi/pdf/10.5555/20220202805 (accessed on 8 December 2025).
- Tarulescu, R.; Tarulescu, S.; Chiru, A.; Covaciu, D.; Butnariu, S.; Szigeti, R.; Niculescu, M. Study on the Implementation of an Efficient Rural Public Transport System. In CONAT 2024 International Congress of Automotive and Transport Engineering; Chiru, A., Covaciu, D., Eds.; Proceedings in Automotive Engineering; Springer Nature: Cham, Switzerland, 2025; pp. 50–61. ISBN 978-3-031-77634-2. [Google Scholar]
- Marga, A. Reform of Education in Romania in the 1990s: A Retrospective. High. Educ. Eur. 2002, 27, 123–135. [Google Scholar] [CrossRef]
- Anchan, J.P.; Fullan, M.; Polyzoi, E. (Eds.) Change Forces in Post-Communist Eastern Europe; Routledge: Oxfordshire, UK, 2003; ISBN 978-1-134-40100-0. [Google Scholar]
- Pegado, A.; Roberto, M.S.; Luz, R.; Pereira, C.; Alvarez, M.-J. Portuguese College Students’ Perceptions of Barriers to Healthy Sleep and Strategies to Overcome Them: A Mix Method Study. SAGE Open 2025, 15, 21582440251355368. [Google Scholar] [CrossRef]
- Hyndych, A.; El-Abassi, R.; Mader, E.C. The Role of Sleep and the Effects of Sleep Loss on Cognitive, Affective, and Behavioral Processes. Cureus 2025, 17, 1–12. [Google Scholar] [CrossRef] [PubMed]
- Buza, V. Spatial Dimensions of Illiteracy in Romania, 1992–2011. Front. Sociol. 2022, 7, 953870. [Google Scholar] [CrossRef]
- Antonescu, D.; Florescu, I.C. The Dynamics of Regional Inequalities in Romania. Comparative Analysis between the Major Crises—Financial and Sanitary. Cent. Eur. J. Geogr. Sustain. Dev. 2024, 6, 5–29. [Google Scholar] [CrossRef]
- Fina, S. Unequal Romania: Regional Socio-Economic Disparities in Romania. In Friedrich-Ebert-Stiftung Romania; Friedrich Ebert Stiftung: Bonn, Germany; Berlin, Germany, 2021; Available online: https://library.fes.de/pdf-files/bueros/bukarest/18052-20210623.pdf (accessed on 10 October 2025).
- Zamfir, A.-M. Urban Rural Educational Inequalities and Human Capital Polarization in Romania. Rev. Rom. Pentru Educ. Multidimens. 2017, 9, 157–165. [Google Scholar] [CrossRef]
- Law No. 141/2025 on Certain Fiscal and Bugetary Measures; Monitorul Oficial 699/2025; Monitorul Oficial Publishing House: Bucharest, Romania, 2025.
- Otovescu, C.; Otovescu, A. The Depopulation of Romania—Is It an Irreversible Process? Rev. de Cercet. si Interv. Soc. 2019, 65, 370–388. [Google Scholar] [CrossRef]
- Muntele, I.; Istrate, M.; Athes, H.; Bănică, A. An Overview of Population Dynamics in Romanian Carpathians (1912–2021): Factors, Spatial Patterns and Urban–Rural Disparities. Land 2023, 12, 1756. [Google Scholar] [CrossRef]
- Egelund, N.; Laustsen, H. School Closure: What Are the Consequences for the Local Society? Scand. J. Educ. Res. 2006, 50, 429–439. [Google Scholar] [CrossRef]
- Ivan, L.; Pricopie, R.; Frunzaru, V.; Cismaru, D.; Corbu, N. The Risk of Dropping Education for Romanian High School Students. Structural Factors and Educational Policies. Procedia—Soc. Behav. Sci. 2012, 46, 2312–2321. [Google Scholar] [CrossRef]
- Nagy, J.A.; Benedek, J.; Ivan, K. Measuring Sustainable Development Goals at a Local Level: A Case of a Metropolitan Area in Romania. Sustainability 2018, 10, 3962. [Google Scholar] [CrossRef]
- Dumitrache, L.; Nae, M.; Simion, G.; Taloș, A.-M. Modelling Potential Geographical Access of the Population to Public Hospitals and Quality Health Care in Romania. Int. J. Environ. Res. Public Health 2020, 17, 8487. [Google Scholar] [CrossRef]
Disclaimer/Publisher’s Note: The statements, opinions and data contained in all publications are solely those of the individual author(s) and contributor(s) and not of MDPI and/or the editor(s). MDPI and/or the editor(s) disclaim responsibility for any injury to people or property resulting from any ideas, methods, instructions or products referred to in the content. |
© 2025 by the authors. Published by MDPI on behalf of the International Society for Photogrammetry and Remote Sensing. Licensee MDPI, Basel, Switzerland. This article is an open access article distributed under the terms and conditions of the Creative Commons Attribution (CC BY) license (https://creativecommons.org/licenses/by/4.0/).