Abstract
Market services industries are closely related to residents’ lives, and its spatial distribution has an important impact on satisfying residents’ consumption needs and promoting economic development. In recent years, with the rapid development of urban–rural integration and the gradual implementation of a rural revitalization strategy, rural areas around metropolises have become the “frontier” of urban geographic expansion, causing the rural market services industries to specialize, commercialize, and modernize. Taking Wuhan as a case study, the spatial distribution characteristics and influencing factors of the market services industries were measured using the average nearest neighbor index, the kernel density estimate, the spatial correlation analysis, and the Geodetector method. The results are as follows. (1) The market services industries in Wuhan’s new urban districts, as a whole and individually, showed characteristics of agglomeration. The market services industries overall formed two high-density areas and multiple agglomeration areas, and the high-density areas of different types of market services industries showed characteristics of partial spatial overlap. (2) There was a significant positive spatial correlation in market services industries, as a whole and individually. Among them, the life services industry had the strongest spatial correlation, while the accommodation services industry had the weakest. (3) Market demand and traffic conditions were the core factors influencing the distribution of the market services industries in Wuhan’s new urban districts, followed by urbanization and economic levels; and tourism conditions had a lower impact. Each detector had a different impact on the spatial distribution of different market services industries, and the interaction research showed that the spatial distribution of the market services industries was the result of a combination of multiple factors. This research provides a future development direction for market service industries in rural areas.
1. Introduction
With the rapid development of globalization and technology information, the industrial structure of China has gradually transformed from “secondary-industry-oriented” to “service-industry-oriented”, and the service industry has increasingly become the engine of regional economic growth. As a branch of the service industry, the distribution and location selection of the market services industries, which are closely related to the daily life of residents, have always been important research fields in geography. ‘Market services industries’ refers to the industries that directly provide residents with material and spiritual services, and they have the characteristics of wide distribution, fierce competition, and complex formats. The spatial distribution not only reflects the law of industry location selection, but also affects the living standards of residents. In recent years, as the relationship between urban and rural areas in China has shifted from rural areas dominated by urban areas to urban–rural integration, the rural areas around metropolises have become node areas with specific complex values that extend from the urban center. Affected by this, the rural economy has begun to transform to specialization, commercialization, and modernization, and various types of market services industries have gradually emerged in rural areas. Studying the spatial distribution of rural market services industries is of vital for optimizing commercial land use, rationally allocating resources, stimulating economic growth, and increasing employment opportunities.
At present, there is a substantial amount of research concerning various types of market services, mainly focusing on the following aspects: location selection and optimization [1,2,3], the recognition and evolution of spatial characteristics [4,5,6,7,8,9,10,11,12], accessibility and spatial equality [7,13,14,15,16,17], influencing factors of spatial distribution [2,18,19,20], policy supply and present allocation, etc. [21,22,23,24,25]. In terms of research scale, the current research covers macro-, meso-, and microgeographic scales, e.g., country, city cluster, province, and city scales, and is carried out based on different geographic statistical units, but most studies are concentrated in economically developed urban areas, and the research on underdeveloped areas and rural areas is relatively lacking. In terms of research methods, spatial analysis methods, neural network analysis models, weighted evaluation methods, and 2SFCA have mainly been used to explore the spatial structure, optimization, and location selection of the market services industries [15,26,27,28,29]; geographic weighted regression, the Geodetector method, the Pearson correlation coefficient matrix, ordinal logistic regression, etc., are used to explore the influencing factors [19,30,31,32,33,34,35,36]. Based on the above studies, we found the following: (1) Research on the market services industries is mostly concentrated on a single type of market services industry, such as retail, catering, finance, leisure and entertainment, and there is relatively little research on the spatial distribution of all market service industries. (2) Most existing research is concentrated in urban areas; research on towns and rural areas is scarce. (3) The data used in the analysis of influencing factors are relatively simple, and most of them are economic data published by statistical departments. It is difficult to accurately characterize the distribution characteristics and laws of the market services industries.
In recent years, big data and geographical conditions census data have provided new opportunities for refined geography research. POI data (point of interest), as a type of big data, represent geographical entities in daily life (shopping malls, convenience stores, hospitals, schools, etc.) and have the characteristics of diversification, high accuracy, fast update speed, and large quantity. Moreover, they can accurately reflect the social and economic activities and their relationship with geographic locations, which is of great significance to the study of human–land relationships [37]. Nowadays, POI data are applied to the division of urban functional areas [38,39,40], city center and boundary identification [41,42], industry cluster analysis [43,44], points of interest recommendations [45,46], etc., but the refined research applied to the rural market services industries is rare. Geographical condition census data include not only detailed spatial data, but also a large amount of nonspatial data. The data are authoritative and accurate, providing a reliable basis for the research on the spatial distribution and influencing factors of the rural market services industries in terms of microlocation and microscale.
Regarding rural areas surrounding metropolises, the development level of the market services industries in Wuhan’s new urban districts is relatively lagging. A scientific understanding of the spatial distribution of the market services industries and their influencing factors plays an important role in optimizing spatial distribution and improving the comprehensive level of the market services industries. Based on POI data and geographical condition census data, this article uses nearest neighbor index, kernel density, and spatial autocorrelation methods to analyze the characteristics of the market services industries in Wuhan’s new urban districts. Based on this, the Geodetector method is used to explore the factors affecting the spatial distribution of the market services industries in Wuhan’s new urban districts. This research provides a future development direction for the market services industries in rural areas. Moreover, it has important theoretical and practical significance for understanding the spatial distribution rules and influence mechanism of the market services industries in rural areas in China.
This article is organized as follows (Figure 1). The first section explains the significance and goal of studying the rural market services industries. The second section introduces the research area, the data source, and the methodology. The third section analyzes the characteristics and influencing factors of the spatial distribution of the rural market services industries in Wuhan’s new urban districts. Based on the previous research, the fourth section discusses the practical meaning of these findings and states the limitations of our research. The last section contains the conclusions and discussion.
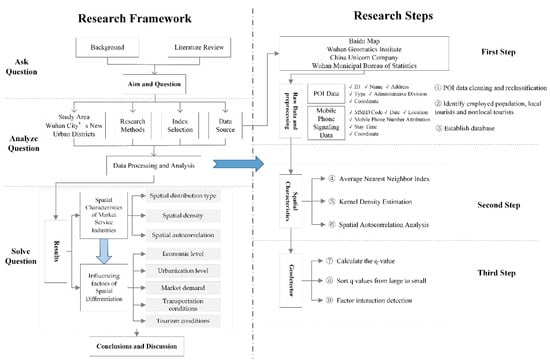
Figure 1.
Research framework and steps.
2. Materials and Methods
2.1. Research Area
Wuhan is located in center of the hinterland of China, the eastern part of Hubei Province, and at the intersection of the Yangtze River and Hanjiang River. It is the central city of central China, the capital of Hubei province, a national historic and cultural city, and one of the 14 megacities in China. Wuhan has 13 municipal districts, including seven central urban districts and six new urban districts. This article studies the current situation of the market services industries in rural area, and the central urban districts are mainly economically developed urban built-up areas; therefore, the research area comprises new urban districts dominated by rural areas, including Huangpi District, Xinzhou District, and Jiangxia District, Dongxihu District, Hannan District, and Caidian District (Figure 2). The new urban districts consist of 2206 administrative villages with a total area of 7614 km2. As of 2019, the permanent population of the new urban districts was 4.177 million, of which 2.166 million was the agriculture population, which accounts for 55.95% of the total population. The GDP of Wuhan city was 636.72 billion yuan, of which the primary industry was 36.718 billion yuan, the secondary industry was 342.543 billion yuan, and the tertiary industry was 257.459 billion yuan. In the whole year, the total retail sales of consumer goods in Wuhan’s new urban districts amounted to 239.048 billion yuan, and the disposable income was 21,462 yuan. Wuhan city has a solid foundation in the market services industries, especially after entering the 21st century. Wuhan’s market services industries have made great progress and have become an important economic pillar. The rural area of new urban districts is vast, and it is obviously driven by the radiation of the central urban area. Therefore, selecting the new urban districts as a typical case study has representative significance for studying the development of the market services industries in the rural areas surrounding the metropolis.
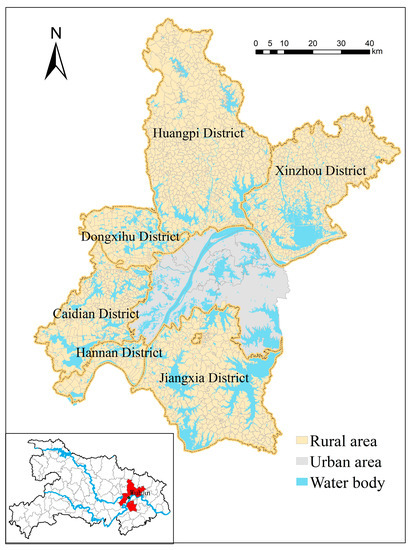
Figure 2.
Location of the research area.
2.2. Data Source
The data used in this study mainly included POI data on the market services industries in Wuhan, data on basic geographic information in Wuhan, data on mobile phone signaling and data on socioeconomic development. Data details are as follows.
2.2.1. POI Data on Market Services Industries in Wuhan
This dataset was derived from the Baidu Maps website (http://lbsyun.baidu.com/, accessed on 31 March 2019). The data of the market services industries in Wuhan city’s new urban districts mainly included the ID, name, address, type, administrative division, and coordinates. Referring to the “Industrial Classification for National Economic Activities” established by the People’s Republic of China, after a series of preprocessing, e.g., cleaning, double checking, and reclassification of the original data, as of 31 March 2019, we obtained a total of 40,635 market services industries’ POI data and divided them into six types of market services industries: shopping, life, catering, leisure, financial, and accommodation services (Figure 3, Table 1).
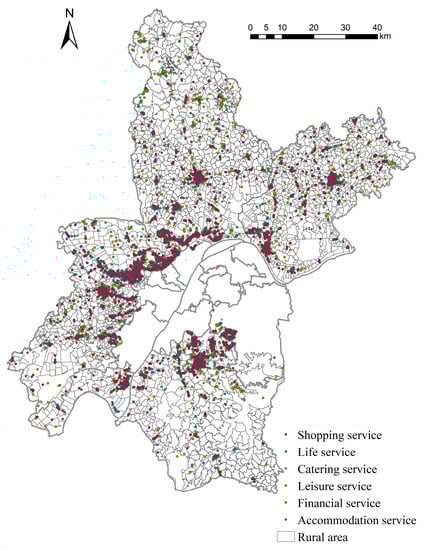
Figure 3.
Geospatial distribution map of market services industries in Wuhan city’s new urban districts.

Table 1.
The classification and statistics of market services industries’ POI data in Wuhan city’s new urban districts.
2.2.2. Data on Basic Geographic Conditions in Wuhan
The data on basic geographic conditions came from the Wuhan Geomatics Institute. According to the basic geographic conditions data, the total number of the administrative villages identified in Wuhan city’s new urban districts was 2206 in 2019, and details are stored in text and table formats. In addition, the data also included land, population, traffic conditions, etc. There are technical and procedural regulations concerning every step of data collection, including filed surveys, data checking, data entry into the database, and statistical analysis. Data of the basic geographic information of Wuhan are kept in the format of ArcGIS vector data. The obtained data of basic geographic conditions were geospatially matched with the data of market services industries in Wuhan. Table 2 presents the basic geographical condition data used in this study.
Table 2.
List of Wuhan geographical conditions census data used in this study.
2.2.3. Mobile Phone Signaling Data
The mobile phone signaling data were provided by China Unicom Company in June 2019, including the MSIID code, date, location, mobile phone number attribution, and stay time. The data regarding the employed population, local tourists, and nonlocal tourists were obtained through mobile phone signaling data. If mobile phone users were connected to the same base station for more than 4 h between 08:00 and 17:00 for 3 consecutive working days, they were identified as an employed population [47]; if mobile users received signals of more than 1 h from different base stations within the same scenic spot three times in a day, they were identified as tourists [48,49], and local and nonlocal tourists were distinguished by mobile phone number attribution.
2.2.4. Data on Social and Economic Development
This dataset was derived from the Wuhan Statistical Yearbook 2019, Wuhan Census of the Geographical Conditions Report 2019. Permanent resident population data are from the survey of “Actual Housing and Actual Population” in Wuhan in 2019.
2.3. Research Methods
2.3.1. Average Nearest Neighbor Index
The average nearest neighbor index is an index that indicates the mutual proximity of point elements in geographic space, and can well-reflect the spatial distribution characteristics [50]. In this study, the average nearest neighbor index was used to determine the distribution of types of market services industry in Wuhan’s new urban districts. The index value was calculated as follows:
where is the nearest neighbor index of market services industries, is the theoretical nearest distance of market services industry points, is the area of administrative region in Wuhan’s new urban districts, and is the number of market services industry points. indicates that market services industry points generally show a random distribution, whereas indicates an agglomerated distribution, and indicates a uniform distribution.
2.3.2. Kernel Density Estimation
Although the nearest neighbor index can reflect the spatial distribution type of market services industries, it fails to observe their spatial dispersion or agglomeration characteristics. Kernel density estimation is a method to study the probability of occurrence of points at different locations in space [51]. In this study, kernel density estimation was used to identify the spatial distribution density of the market services industry points as follows:
where is the kernel density function of market services industries, is the location of market services industry points, is the market services industry points set to be estimated, is the bandwidth for the search radius distance (), is the number of market services industry points in the range of bandwidth, and is the dimensionality of market services industries.
2.3.3. Spatial Autocorrelation Analysis
Spatial autocorrelation analysis is used to explore the spatial agglomeration and correlation of the number of market services industries in different administrative villages [52]. In this study, Moran’s I index is used to analyze the global spatial correlation characteristics, and local Moran’s I index is used to analyze the spatial correlation degree between area and surrounding areas.
Moran’s I index is used to measure the spatial correlation model, which is obtained by the following formula [53]:
where and are the number of rural market services industries in the geographic units of area and , and is the spatial weight matrix. Moran’s I > 0 indicates a positive spatial correlation, which means that market services industries in Wuhan’s new urban districts are geospatially agglomerated, and the larger the value, the more obvious agglomeration of market services industries; Moran’s I < 0 indicates a negative spatial correlation, which means that rural market services industries in Wuhan’s new urban districts exhibit significant spatial differences in geospace; and Moran’s I = 0 indicates that the distribution of market services industries in Wuhan’s new urban districts is random.
The local Moran’s I index for an area measures the association between a value at and values of its nearby areas, defined as [54]:
where is the variance, and other notations are the same as in Formula (3). Note that the summation over does not include the area itself, that is, . A positive means either a high value surrounded by high values (high-high) or a low value surrounded by low values (low-low). A negative means either a low value surrounded by high values (low–high) or a high value surrounded by low values (high–low).
2.3.4. The Geodetector Method
Geodetector is a new statistical method for detecting spatial differentiation and revealing the driving factors [55].
- Factor Detection
A factor detector detects the spatial heterogeneity of the dependent variable and the power of determinant of the independent variables on the dependent variable. The value is measured by the value.
where is the layer of independent variable , and are the number of sample units in layer and the total region , respectively. Moreover, and are the variance in the layer and the variance in the region. The value lies in [0, 1]. The larger the value of , the stronger the explanatory power of this factor on the differentiation of market services industries, and vice versa. If factor completely controls the distribution of market services industries, the value equals 1; if the factor is completely unrelated to the distribution of market services industries, the value equals 0.
- 2.
- Interaction Detection
An interaction detector is mainly used to identify the interaction between different factors, that is, to evaluate whether the two factors will increase or decrease the explanatory power of market services industries or whether the influences of such factors on market services industries are independent of each other. The classification of related interaction types is shown in Table 3.
Table 3.
Types of interaction between two covariates.
- 3.
- Construction of the Detection Indicator System
The spatial distribution of the market services industries is affected by many factors such as economy, society, infrastructure, and policy, and the impact power of different factors is also different. Most existing studies consider the built-up area, population size, GDP, urbanization level, etc., all to be factors that affect the spatial distribution of market services industries [33,34,35,36]. Taking into account the actual conditions of Wuhan city’s new urban districts and the data available based on the degree of difficulty, 10 indicators were selected as factors influencing the spatial distribution characteristics of the market services industries based on the principles of scientificity, representativeness, and accessibility (Table 4).
Table 4.
The detection indicator system for influencing factors.
3. Results
3.1. Spatial Differentiation Characteristics
3.1.1. Spatial Differentiation Characteristics of All Market Services Industries
The nearest neighbor index of market services industries in Wuhan’s new urban districts was 0.1998 and passed the significance test, indicating an agglomerated distribution. The spatial agglomeration characteristics of market services industries are discussed through kernel density mapping. Figure 4 illustrates that the kernel density of market services industries in Wuhan’s new urban districts had two high-density areas and multiple agglomeration areas. The high-density values were mainly distributed in the southeast of Dongxihu District and the north of Jiangxia District, such as Wenjiawan Community and Kaipingli Community. The kernel density of the center of this area was 233.95–481.09/km2; the agglomeration areas were located in central Huangpi District, northern Jiangxia and Caidian District, and southern and central Xinzhou District, such as Yangyuan Community and Panjiatian Community. The kernel density of the center of this area was 90.57–233.94/km2. The market services industries in most other areas were relatively sparse. In general, the high-density areas and agglomeration areas were either adjacent to the central urban districts or located in the administrative and economic centers of new districts. The construction of infrastructure in these areas was relatively complete, and these areas gathered a large population and were greatly affected by the radiation of the central urban districts.
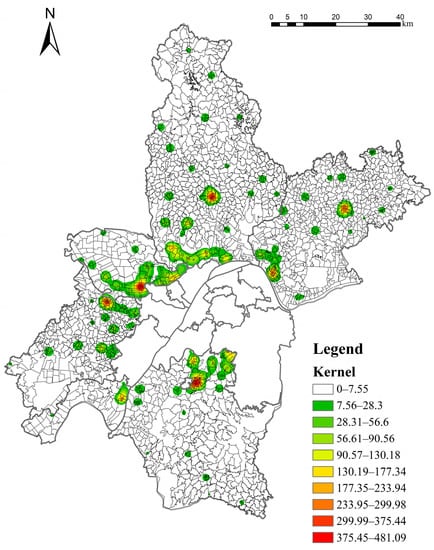
Figure 4.
Kernel density of market services industries in Wuhan city’s new urban districts.
Moran’s I index of the market services industries was 0.5646 > 0, indicating that market services industries were spatially positively correlated. Taking the administrative village as a unit, the number of market services industries in each administrative village was counted, and the local Moran’s I was calculated. The results show that the number of H-H areas was 183, accounting for 8.3% of the total; these 183 H-H areas were basically distributed in the east of Dongxihu District, the south of Huangpi District, the north of Jiangxia District, and the northeast of Hannan District. The number of L-L areas was 219, accounting for 9.93% of the total (the highest number); these 219 L-L areas were widely distributed along the edge of the new urban districts. The number of L-H areas was 42, and they were mainly distributed around the H-H areas, accounting for 1.90% of the total. The number of H-L areas was five (the lowest number), and they were scattered across Huangpi District, Xinzhou District and Jiangxia District, only accounting for 0.23% of the total. Furthermore, 79.65% of the areas were not significant, thus showing a trend of random distribution (Figure 5).
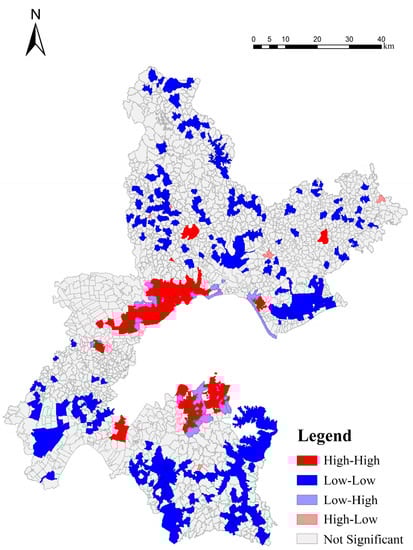
Figure 5.
LISA map of market services industries in Wuhan city’s new urban districts.
3.1.2. Spatial Differentiation Characteristics for Different Types of Market Services Industries
The nearest neighbor index values of different types of market services industries are summarized in Table 5. The ascending order of the values of market services industries was catering services (0.126), life services (0.141), financial services (0.157), shopping services (0.171), accommodation services (0.199), and leisure services (0.301). The results were all less than 1, with different levels of agglomeration. Among them, the catering services industry had the smallest value, with the highest degree of agglomeration, and the leisure services industry had the lowest degree of spatial agglomeration.
Table 5.
The nearest neighbor index of different types of market services industries in Wuhan city’s new urban districts.
The kernel density result showed that different types of market services industries in Wuhan’s new urban districts had formed kernel centers with different densities (Figure 6). Further analysis showed the following: (1) The high-density areas of each type of market services industry presented the characteristics of partial spatial overlap, and they were concentrated in the east of Dongxihu District, the north of Jiangxia District, and the center of Huangpi District. (2) From the perspective of the kernel density levels of different market services industries, the kernel density levels of the life and catering services industries had comparative advantages, while the density levels of the leisure, financial, and accommodation services industries were much lower than those of other market services industries. The kernel density of the shopping market services industry was at an intermediate level. (3) The areas with higher kernel density values for shopping, life, and financial services were more widely distributed than the other three types, which is related to the nature of the services industries and China’s policy of promoting financial service in rural areas. (4) In terms of regional differences, no administrative district formed a complete kernel density grading system in all types of market services industries. There were three types of market services industries that had formed a complete kernel density rating system in Dongxihu District; namely, the catering, leisure, and financial services industries. Four types of market services industries formed a complete kernel density rating system in Jiangxia District. However, the kernel density grading system of the remaining four districts is incomplete.
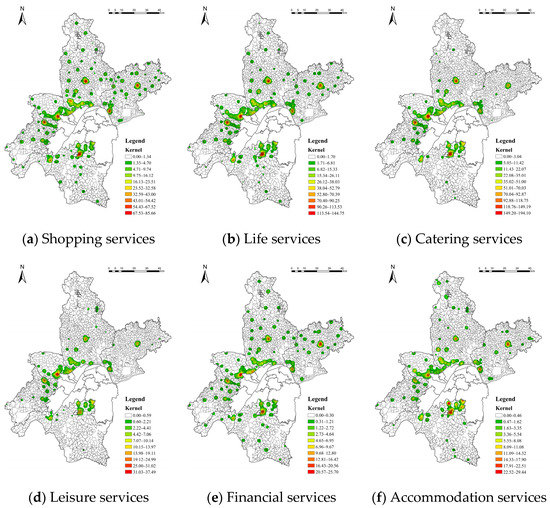
Figure 6.
Kernel density of different types of market services industries in Wuhan city’s new urban districts.
Moran’s I index of all types of market services industries had positive index values in the range of 0.1861 to 0.6036, and passed the significant test at the 5% level, indicating positive spatial correlation. The largest value of Moran’s I index was 0.6036 for the life services industry, which had the most obvious spatial correlation, while the smallest value of Moran’s I index was 0.1861 for the accommodation services industry, which had the weakest spatial correlation (Table 6).
Table 6.
The Moran’s I index of different types of market services industries in Wuhan city’s new urban districts.
Combining the LISA map (Figure 7), we found the following: (1) The spatial correlation patterns of different types of market services industries were mainly positively correlated. The largest proportion of the H-H areas was the life services industry (10.11%), and the smallest proportion was the accommodation services industry (5.3%). The largest proportion of the L-L areas was the financial services industry (4.4%), and the smallest proportion was the catering services industry (2.63%). (2) The distributions of spatial clustering in the different types were basically the same; i.e., the H-H and L-L areas were agglomerated, while the H-L and L-H areas were scattered. (3) The spatial clustering of shopping, life, and catering services were distributed across all districts, while the spatial clustering of leisure, finance, and accommodation services were mainly concentrated in the central and southern parts of the new districts, and the northern part was not significant.
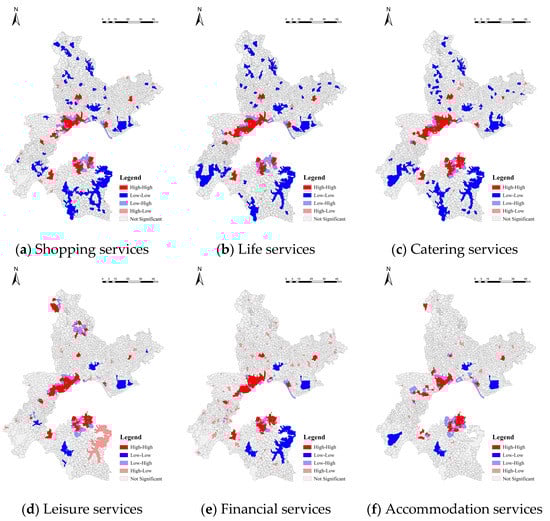
Figure 7.
LISA map of different types of market services industries in Wuhan city’s new urban districts.
3.2. Factors Influencing Spatial Characteristics
3.2.1. Factor Detection Results
- (1)
- Factors Influencing the Distribution of All Market Service Industries
The distribution maps of influencing factors are displayed in Figure 8. According to the calculation using the Geodetector model, each detection factor had a positive impact on the spatial distribution of the market services industries, and a descending order of influence power was employed population (0.492), permanent population (0.467), population density (0.461), coverage percentage of the public transport (0.423), road density (0.338), proportion of built-up area (0.291), GDP per capita (0.183), disposable income (0.181), local visitors (0.164), and nonlocal visitors (0.155). The influence force was ranked by intensity in the order of market demand > transportation conditions > urbanization level > economic level > tourism conditions.
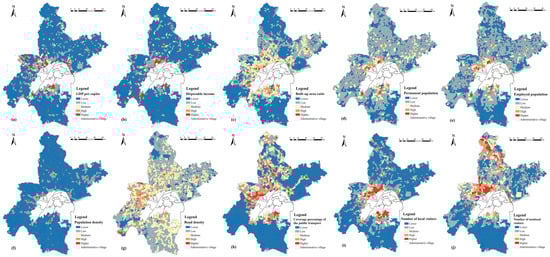
Figure 8.
Distribution of influencing factors in Wuhan city’s new urban districts: (a) GDP per capita; (b) disposable income; (c) built-up area ratio; (d) permanent population; (e) employed population; (f) population density; (g) road density; (h) coverage percentage of the public transport; (i) number of local visitors; (j) number of nonlocal visitors.
Market demand had the strongest explanatory force for the distribution of the market services industries, indicating that this was the core factor influencing their spatial distribution. The market services industries were generally located around the residential area and business area, forming a 15-min life circle and providing people with products and services to meet their material and spiritual needs. At the same time, the market services industries also provided employment. For example, the core business district of Wenyuan Community in Jiangxia District has concentrated large-scale corporate companies such as COFCO and office buildings, which incubates important market service industries, e.g., Zhongbai Plaza, Wanhui Mall, Marriott Century Day Shopping Mall, and Walmart. In summary, market demand was the most important factor affecting the spatial distribution of the market services industries. Whether it was a residential-oriented area or an employment-oriented area, the market services industries were denser, and the development was more mature.
The explanatory power of transportation conditions was relatively high, indicating that the higher the traffic accessibility, the denser the market services industries. To further explain the spatial relationship between transportation and the distribution of the market services industries, the ArcGIS 10.2 proximity analysis tool was used to draw a 300-m buffer zone of bus stations and main roads (including township roads, county roads, and national roads), and the spatial join tool was used to count the number of market services industries in the buffer zone (Figure 9). The results showed that 38,528 market services industries were located in the 300-m buffer zone of bus stations, accounting for 94.81% of the total, and 39,958 market services industries were located in the 300-m buffer zone of main roads, accounting for 98.33% of the total. Good transportation conditions promote the circulation and connection of various factors, and reduce time costs for consumers. At the same time, market services industries can also expand their service radius with good traffic conditions, increasing the number of consumers and obtaining greater economic benefits. Additionally, the explanatory power of public transportation coverage was slightly higher than that of road density. This was due to the limited number of cars owned by households in Wuhan’s rural areas and because public transportation is the main mode of travel. With the implementation of the rural revitalization strategy and “the 13th Five-Year Plan for Modern Comprehensive Transportation System Development”, Wuhan’s new urban districts had fully completed the project goal of “Public Transport Covers All Villages”, which can meet the basic consumption and travel needs of rural residents.
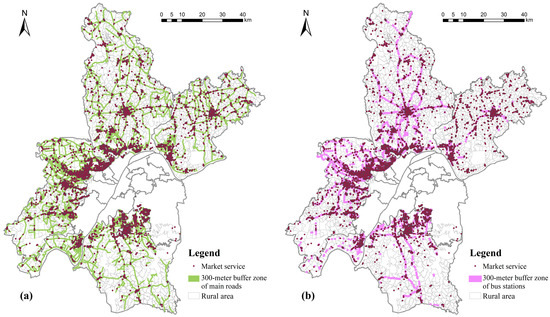
Figure 9.
The relationship between the distribution of market service industry and transportation conditions: (a) main roads; (b) bus stations.
The economic level and urbanization level affected the spatial distribution of the market services industries to a certain extent. The market services industries, as service-oriented industries that directly face service targets, have a higher need for agglomerated customers. A high level of urbanization indicates a high quality of urban life, which guides the rapid flow of population across districts and attracts more immigrants. The low dependence degree of the market services industries on the economic level showed that it did not overly affect their spatial distribution. The economic level mostly affects the level of the market services industries, but the impact on the quantity is not significant.
Tourism conditions had the lowest explanatory power. This is because the research area mainly comprises the rural population, whose tourism awareness is relatively weak and whose daily life consists of agricultural production activities. In addition, except for Huangpi District, the districts lack resources to attract tourists, so their influence on the spatial distribution of market service industries is limited.
- (2)
- Factors Influencing the Distribution of Different Types of Market Services Industries
Geodetector was used to measure the explanation power of detection factors on the spatial distribution of different types of market services industries, and the results are shown in Table 7. The influence of each factor on the spatial differentiation of various market services industries is different. The permanent population and population density were the main reasons for the spatial distribution of the life services industry, which mainly provided residents with services closely related to their daily lives. The permanent population and population density reflect the market scale and determines the economic benefits of the life services industry. The employed population had the greatest explanatory power for life and financial services, indicating that employed population had a greater demand for these types of market services. At the same time, the life and financial service industries had also created relatively more jobs that attracted an influx of the employed population, which led to the agglomeration of market services industries.
Table 7.
Factor detection results of factors influencing the spatial characteristics of different types of market services industries in Wuhan city’s new urban districts.
Per capita GDP and disposable income had the greatest explanatory power for the spatial distribution of the financial services industry. Statistical results showed that 68.28% of the financial services industries were located in the administrative villages with a per capita GDP of over 100,000 yuan. The bank loans provided by the financial services industry can meet the liquidity needs of companies, which, in turn, can be fed back to the financial services industry. In total, 39.97% of the financial services industries were distributed across the administrative villages with a disposable income of more than 15,000 yuan. The income level determines the ability of rural residents to pursue higher-level needs. When people’s income reaches a certain level, they are willing to purchase commercial insurance and manage their finances to meet safety requirements.
Road density and public station coverage had the greatest explanatory power for the spatial distribution of the shopping services industry, followed by the life services industry. Compared with the shopping services industry, the life services industry generally has a smaller service radius. Rural residents can arrive at life services points by walking or by electric bicycle. For higher-level shopping needs, travel distances are generally longer, and shopping activities mainly rely on public transport and roads for their service functions.
The built-up area ratio had the greatest explanatory power for the spatial distribution of the accommodation service industry. This is because, whether it is run in other building’s functional areas or independently operated in detached building, the development of the accommodation service industry depends on regional infrastructure facilities, i.e., the water and power supply, sewage treatment, fire protection, and other facilities. In areas where the built-up area ratio is relatively high, a complete infrastructure can greatly reduce the operating costs of the accommodation services industry and can lead to greater operating benefits.
Both local tourists and nonlocal tourists had the greatest explanatory power for the spatial distribution of the leisure services industry. As tourism has become a part of people’s lifestyles, tourist destinations are not limited to scenic spots; they include the daily leisure and entertainment spaces of residents. The leisure activities of tourists and local residents have been integrated, which has promoted the development of the leisure service industry. The explanatory power of nonlocal tourists was higher than that of local tourists, because most of the local tourists are short-distance, single-day travelers, and very few are rural leisure tourists that require accommodation during the holidays.
3.2.2. Interaction Detection Results
The interaction detection results are shown in Table 8 (due to limited space, only the top three interaction values are listed). The following was found: (1) The interaction detection results of the market services industries, as a whole and individually, were nonlinear-enhanced or double-factor-enhanced, indicating that the influence of interactions on the spatial distribution of market services industries is greater than that of single factors. (2) The interaction factors that ranked first in each market services industry further determined that the market demand and urbanization level were core factors influencing its spatial distribution. (3) The explanatory power of factors with a smaller value was greatly improved after the interaction, e.g., in the shopping services industry and in the catering services industry.
Table 8.
Interaction detection results of factors influencing the spatial characteristics of different types of market services industries in Wuhan city’s new urban districts.
The interaction detection results of the market services industries, either as a whole or individually, did not show a nonlinear weakening, a single-factor nonlinear weakening, or independence, indicating that the spatial distribution of the market services industries in Wuhan’s new urban districts was not caused by a single factor, and was the result of the combined effect of different influencing factors.
4. Discussion
4.1. The Spatial Distribution Characteristics of Market Services Industries in the Rural Area Surrounding the Metropolis and Nonmetropolis Are Different
Due to the relatively slow development of nonmetropolitan areas, the population and market services industries are still concentrated in central urban districts. However, because of rising rents and land prices, as well as increasing traffic and environmental pressures in metropolises, surrounding rural areas have become important spillover areas for functions, industries, and populations of central urban districts, relying on their superior geographic locations. As one of the metropolises in China, Wuhan city is in an advanced stage of urban development, with a strong urbanization drive and a strong land demand. In the process of spatial structural adjustments of central urban districts, some industries, populations, and functions have been transferred to surrounding rural areas, leading to upgrades to the industrial structure, optimization of the spatial structure, and transformation of land use in the surrounding rural areas, thereby promoting the agglomeration and development of market services industries.
4.2. Spatial Characteristics Promote Top-Level System Design of the Market Services Industries
Kernel density estimation and spatial autocorrelation can discern the development status and agglomeration patterns of different types of market services industries, and analyze the spatial distribution characteristics of market services industries in Wuhan’s new urban districts. At present, the spatial distribution of the market services industries presents a distinct center–periphery structure, but due to the limited diffusion, the spatial distribution of the market service industry is uneven. From the top-level system design, the Wuhan Municipal Government needs to cultivate new market services industry agglomeration centers, especially in the edge areas; be the fulcrum of service-industry clusters to drive the development of surrounding areas; achieve the strategic goal of coordinated and balanced development of the market services industry; and realize the shaping of market services industries on rural spatial structure.
4.3. Influencing Factors Are an Important Basis for Formulating the Development Policy of Market Services Industries
As a surrounding area of a metropolis, Wuhan’s new urban districts are in a period of rapid urbanization and economic development. Providing high-quality and convenient market services for rural residents is an important issue in the process of rural revitalization. This research studies the factors influencing the spatial distribution of market services industries in Wuhan’s new urban districts, which provides an important basis for the government to formulate development policies for the market services industries. According to the results of this research, the Wuhan Municipal Government can optimize the spatial distribution of market services industries in three ways. ① Strengthen the radiation scope of the subcities of Optics Valley, Chegu, Airport Economic Zone, and Yangtze River New Area. Based on the degree of population agglomeration, a “15-min life circle” equipped with daily life needs such as shopping, life, catering, leisure, and other services should be created. At the same time, the convenience of market services can also be used as an attraction, as it will benefit most of the population. ② Construct an efficient and convenient rural road network that is compatible with the land-use layout, accelerate the construction of the subway rail network, and improve the coverage rate of rail transit. ③ Strengthen the construction of rural water conservancy, energy, information, and other municipal infrastructures, improve planning and construction standards, and address the shortcomings of rural facilities.
4.4. The Application of Big Data Removes the Need for Reliance on Traditional Statistical Data
In this research, big data, such as POI data and mobile phone signaling data, were applied to the study of spatial distribution and influencing factors of the rural market services industries, removing the need for reliance on traditional statistical data, and providing new opportunities for the spatial analysis of socioeconomic phenomena in the field of humanities and economic geography. The combination of big data and statistical yearbook data reflects the cross-application of big data and traditional data. It not only provides new solutions for the analysis of socio-economic phenomena and laws in the field of human–economic geography, but also improves the accuracy of research on rural geography.
4.5. Limitations of the Study
Some limitations exist in our study. For example, this research only uses 2019 data to analyze the spatial pattern and influencing factors of the rural market services industries in Wuhan’s new urban districts, and lacks research on its temporal and spatial laws. With the further implementation of the rural revitalization strategy and the reform of the household registration system, the vitality and attractiveness of rural areas have been stimulated, which will inevitably bring new opportunities and challenges to rural development. The existing rural market services industries are likely to conflict with the growing needs of rural residents. Future research needs to obtain dynamic data to predict and simulate the future development of rural market services.
Moreover, due to the lack of rural statistical data, many influencing factors have not been adopted. For example, market demand is the dominant factor influencing the spatial distribution of market services industries. In the future, educational level, gender structure, occupation, etc., can be included in the index system to explore the specific impact mechanism on the market services industries.
5. Conclusions
This study analyzed the characteristics and influencing mechanism of the spatial distribution of rural market services industries in Wuhan’s new urban districts by using different methods such as ArcGIS spatial analysis and Geodetector. The main conclusions are as follows:
- (1)
- The market services industries in Wuhan’s new urban districts, as a whole and individually, showed characteristics of agglomeration, but the degree of agglomeration was different. In terms of industry type, the catering services industry had the highest degree of spatial agglomeration, and the leisure services industry had the lowest. The market services industries, as a whole and individually, had formed kernel centers with different levels of density. The high-density areas of each type of market services industry presented the characteristics of partial spatial overlap, and the high-density areas of each market services industry were concentrated in the east of Dongxihu District, the north of Jiangxia District, and the center of Huangpi District. No administrative district had formed a complete kernel density grading system in all types of market services industries.
- (2)
- There was a significant positive spatial correlation in the market services industries, as a whole and individually. Among them, the life services industry had the strongest spatial correlation, while the accommodation services industry had the weakest spatial correlation. The distributions of spatial clustering in different types were basically the same, i.e., the H-H and L-L areas were agglomerated, while the H-L and L-H areas were scattered. The spatial clustering of shopping, life, and catering services was distributed across all districts, while the spatial clustering of leisure, finance, and accommodation services was mainly concentrated in the central and southern parts of the new districts, and the northern part was not significant.
- (3)
- Market demand and traffic conditions were the core factors influencing the distribution of the market services industries in Wuhan’s new urban districts, followed by urbanization and economic levels, and tourism conditions had a lower impact. Each factor had a different impact on the spatial distribution of different market services industries. The interaction detection results of the market services industries, as a whole and individually, were nonlinear-enhanced or double-factor-enhanced, indicating that the influence of interactions on the spatial distribution of market services industries was greater than that of a single factor.
Author Contributions
This paper was written with the contribution of all authors as follows: Conceptualization, Liang Jiang; Data curation, Jie Chen and Liang Jiang; Funding acquisition, Jing Luo and Ye Tian; Investigation, Liang Jiang and Guolei Chen; Methodology, Jie Chen and Liang Jiang; Project administration, Jing Luo and Lingling Tian; Supervision, Jing Luo; Visualization, Liang Jiang; Writing—original draft, Jie Chen, Liang Jiang and Ye Tian; Writing—review & editing, Jie Chen and Liang Jiang. All authors have read and agreed to the published version of the manuscript.
Funding
This research was supported by the National Natural Science Foundation of China (No. 41871176, No. 41801177, No. 42001185), the Humanities and Social Science Foundation of Ministry of Education of China (No. 20YJCZH147).
Institutional Review Board Statement
Not applicable.
Informed Consent Statement
Not applicable.
Data Availability Statement
Publicly available dataset was analyzed in this study. The POI data of market service industries was available online from http://lbsyun.baidu.com/ (accessed on 31 March 2019).
Acknowledgments
Thanks to the Wuhan Geomatics Institute (WGI) for contributions during data collection. Meanwhile, we are grateful for the comments and contributions of the anonymous reviewers and the members of the editorial team.
Conflicts of Interest
The authors declare no conflict of interests.
References
- Salvaneschi, L. Location, Location, Location; The Oasis Press: Grants Pass, OR, USA, 1996. [Google Scholar]
- Wassmer, R. Fiscalisation of land use, urban growth boundaries and non-central retail sprawl in the Western United States. Urban Stud. 2002, 39, 1307–1327. [Google Scholar] [CrossRef]
- Singla, V.; Rai, H. Application of analytical hierarchy process in examining retail location alternatives. Int. J. Bus. Data Anal. 2020, 1, 242–256. [Google Scholar] [CrossRef]
- Coffey, W.J.; Drolet, R.; Polese, M. The intra-metropolitan location of high order services: Patterns, factors and mobility in Montreal. Pap. Reg. Sci. J. RASI 1996, 3, 293–323. [Google Scholar] [CrossRef]
- Morland, K.; Wing, S.; Diez Roux, A.; Poole, C. Neighborhood characteristics associated with the location of food stores and food service places. Am. J. Prev. Med. 2002, 22, 23–29. [Google Scholar] [CrossRef]
- Ozuduru, B.H.; Varol, C. Spatial statistics methods in retail location research: A case study of Ankara, Turkey. Procedia Environ. Sci. 2011, 7, 287–292. [Google Scholar] [CrossRef] [Green Version]
- Salze, P.; Banos, A.; Oppert, J.; Charreire, H.; Casey, R.; Simon, C.; Chaix, B.; Badariotti, D.; Weber, C. Estimating spatial accessibility to facilities on the regional scale: An extended commuting-based interaction potential model. Int. J. Health Geogr. 2011, 10, 2. [Google Scholar] [CrossRef] [PubMed] [Green Version]
- Drennan, M.P.; Kelly, H.F. Measuring urban agglomeration economies with office rents. J. Econ. Geogr. 2011, 11, 481–507. [Google Scholar] [CrossRef]
- Prayag, G.; Landré, M.; Ryan, C. Restaurant location in Hamilton, New Zealand: Clustering patterns from 1996 to 2008. Int. J. Contemp. Hosp. M 2012, 24, 430–450. [Google Scholar] [CrossRef]
- Watkins, A.R. The spatial distribution of economic activity in Melbourne, 1971–2006. Urban Geogr. 2014, 35, 1041–1065. [Google Scholar] [CrossRef]
- Zhang, J.; Liu, Y.; Song, B. Study on the Spatial Distribution Characteristics of Life Service Industry in the Main Urban Area of Zhengzhou City Based on POI Data. World Reg. Stud. 2021. Available online: https://kns.cnki.net/kcms/detail/detail.aspx?dbcode=CAPJ&dbname=CAPJLAST&filename=SJDJ20210914000&uniplatform=NZKPT&v=H6EtwLxfIANuPlx6SKe8skCl8JLxdaRKnZQc3QtMDUfyjN-OOPxzr0npkwiJblMg (accessed on 1 December 2021).
- Li, J.; Liang, Y.; Li, X. Spatial distribution and influencing factors of modern service industry in fast-growing city of underdeveloped areas: A case study of Zhengzhou based on POI and questionnaire data. Econ. Geogr. 2021, 41, 145–154. [Google Scholar] [CrossRef]
- Larsen, K.; Gilliland, J. Mapping the evolution of ‘food deserts’ in a Canadian city: Supermarket accessibility in London, Ontario, 1961–2005. Int. J. Health Geogr. 2008, 7, 16. [Google Scholar] [CrossRef] [Green Version]
- Jiang, H.; Xu, J.; Qi, Y.; Chen, J. The quantitative analysis of large scale supermarkets location based on time accessibility and Gasa rules. Geogr. Res.-Aust. 2010, 29, 1056–1068. [Google Scholar]
- Wang, H. Modeling analysis of accessibility in city catering industry based on 2SFCA and Model Builder. Geomat. Spat. Inf. Technol. 2015, 38, 126–128. [Google Scholar]
- Ishikawa, M.; Yokoyama, T.; Nakaya, T.; Fukuda, Y.; Takemi, Y.; Kusama, K.; Yoshiike, N.; Nozue, M.; Yoshiba, K.; Murayama, N. Food accessibility and perceptions of shopping difficulty among elderly people living alone in Japan. J. Nutr. Health Aging 2016, 20, 904–911. [Google Scholar] [CrossRef] [PubMed]
- Hosseini, A.; Farhadi, E.; Hussaini, F.; Pourahmad, A.; Seraj Akbari, N. Analysis of spatial (in)equality of urban facilities in Tehran: An integration of spatial accessibility. Environ. Dev. Sustain. 2021, 1–29. [Google Scholar] [CrossRef]
- Raeon, F. The ABC’s of Site Selection: How to Pick Winners and Avoid Losers; Xlibris US: Bloomington, ID, USA, 2010. [Google Scholar]
- Romero, V.; Solis, E.; Urena, J.M.D. Beyond the metropolis: New employment centers and historic administrative cities in the Madrid global city region. Urban Geogr. 2014, 35, 889–915. [Google Scholar] [CrossRef]
- Wang, N.; Wu, J.; Peng, Z. Spatial pattern and influencing factors of the consumer service industry in Shenzhen based on multisource big data. Trop. Geogr. 2021, 41, 956–967. [Google Scholar] [CrossRef]
- Tang, X.; Leng, K. Analysis on the transfer trend and countermeasures of modern service industry in China. Sci. Technol. Prog. Policy 2006, 12, 108–110. [Google Scholar]
- Lorch, B.; Hernandez, T. The transformation of shopping mall space in Canada: An analysis of selected leasing site plans between 1996 and 2006. Geogr. Res. Forum 2008, 28, 21–41. [Google Scholar]
- Ji, M. The operation, prospect and countermeasure of Jilin province′s service industry under the new background. J. Commer. Econ. 2017, 19, 156–158. [Google Scholar]
- Idris, F.; Naqshbandi, M.M. Exploring competitive priorities in the service sector: Evidence from India. Int. J. Qual. Serv. Sci. 2018, 11, 167–186. [Google Scholar] [CrossRef]
- Zhu, S.; Liu, C. Analysis on the impact of COVID-19 on China′s life service industry. Times Econ. Trade 2020, 16, 52–53. [Google Scholar]
- Liu, Z.; Mao, Y. Research on location selection method of commercial bank network based on GIS and neural network. J. Bus. Econ. 2004, 9, 55–59. [Google Scholar]
- Hermelin, B. The urbanization and suburbanization of the service economy: Producer services and specialization in Stockholm. Geogr. Annaler. Ser. B Hum. Geogr. 2007, 89, 59–74. [Google Scholar] [CrossRef]
- Liu, S.; Xu, M.; Wang, L. Study on the location of modern business based on analysising the layout of KFC in Changsha. Econ. Geogr. 2009, 29, 2039–2043. [Google Scholar]
- Scoppa, M.; Peponis, J. Distributed attraction: The effects of street network connectivity upon the distribution of retail frontage in the city of Buenos Aires. Environ. Plan. B Plan. Des. 2015, 2, 354–378. [Google Scholar] [CrossRef]
- Black, W. Retail geography. Econ. Geogr. 1982, 58, 303. [Google Scholar] [CrossRef]
- Illeris, S. The Service Economy: A Geographical Approach; John Wiley and Sons Ltd.: Hoboken, NJ, USA, 1996. [Google Scholar]
- He, W.; Li, E.; Cui, Z.; Zhang, D. Spatial layout and influencing factors of commercial retail in main urban districts of Kaifeng. Econ. Geogr. 2018, 38, 158–167. [Google Scholar] [CrossRef]
- Yan, L.; Han, H.; Chen, W.; Song, J. Distribution and influence factors of lodging industry in Beijing City. Econ. Geogr. 2014, 34, 94–101. [Google Scholar]
- Moulaert, F.; Djellal, F. Information Technology Consultancy Firms: Economies of Agglomeration from a Wide-area Perspective. Urban Stud. 1995, 32, 105–122. [Google Scholar] [CrossRef]
- Wang, S.; Hao, F.; Jiang, L. Locations and their determinants of large-scale commercial sites in Changchun, China. Acta Geogr. Sin. 2015, 70, 893–905. [Google Scholar] [CrossRef]
- Fu, C.; Zhou, S.; Yan, X.; Liu, L.; Chen, W. Spatio-temporal characteristics and influencing factors of consumer behavior in retailing centers: A case study of Guangzhou in Guangdong Province. Acta Geogr. Sin. 2017, 72, 603–617. [Google Scholar] [CrossRef]
- Hazas, M.; Krumm, J.; Strang, T. Location- and Context-Awareness; Springer: Berlin, Germany, 2006. [Google Scholar]
- Long, Y.; Shen, Z. Geospatial Analysis to Support, Urban Planning in Beijing; Springer International Publishing: Beijing, China, 2015. [Google Scholar]
- Ran, Z.; Zhou, G.; Wu, J.; Tang, C.; Yuan, Z. Study on spatial pattern of consumer service industry in Changsha based on POI data. World Reg. Stud. 2019, 28, 163–172. [Google Scholar] [CrossRef]
- Fu, C.; Tu, X.; Huang, A. Identification and characterization of Production—Living—Ecological space in a central urban area based on POI data: A case study for Wuhan, China. Sustainability 2021, 13, 7691. [Google Scholar] [CrossRef]
- Lüscher, P.; Weibel, R. Exploiting empirical knowledge for automatic delineation of city centres from large-scale topographic databases. Comput. Environ. Urban Syst. 2013, 37, 18–34. [Google Scholar] [CrossRef] [Green Version]
- Liang, Z.; Huang, J.; Wei, F.; Shen, J.; Li, S. Identifying the spatial range of urban agglomerations in China based on night light remote sensing and POI data. Geogr. Res. 2020, 39, 92–102. [Google Scholar] [CrossRef]
- Jiao, L.; Li, Z.; Xu, G.; Zhang, B.; Dong, T.; Gu, Y. The characteristics and patterns of spatially aggregated elements in urban areas of Wuhan. Acta Geogr. Sin. 2017, 72, 1432–1443. [Google Scholar] [CrossRef]
- Gil, E.; Ahn, Y.; Kwon, Y. Tourist attraction and points of interest (POIs) using search engine data: Case of Seoul. Sustainability 2020, 12, 7060. [Google Scholar] [CrossRef]
- Ying, H.; Wu, J.; Xu, G.; Liu, Y.; Liang, T.; Zhang, X.; Xiong, H. Time-aware metric embedding with asymmetric projection for successive POI recommendation. World Wide Web 2019, 22, 2209–2224. [Google Scholar] [CrossRef]
- Davtalab, M.; Alesheikh, A.A. A POI recommendation approach integrating social spatio-temporal information into probabilistic matrix factorization. Knowl. Inf. Syst. 2021, 63, 65–85. [Google Scholar] [CrossRef]
- Liang, D.; Xinyi, N.; Xiaodong, S. Measuring the employment center system in Shanghai central city: A study using mobile phone signaling data. Acta Geogr. Sin. 2016, 71, 484–499. [Google Scholar]
- Ahas, R.; Aasa, A.; Mark, Ü.; Pae, T.; Kull, A. Seasonal tourism spaces in Estonia: Case study with mobile positioning data. Tour. Manag. 2007, 28, 898–910. [Google Scholar] [CrossRef]
- Tiru, M.; Kuusik, A.; Lamp, M.; Ahas, R. LBS in marketing and tourism management: Measuring destination loyalty with mobile positioning data. J. Locat. Based Serv. 2010, 4, 120–140. [Google Scholar] [CrossRef]
- Rzeszewski, M.; Beluch, L. Spatial characteristics of Twitter users—Toward the understanding of geosocial media production. ISPRS Int. J. Geo-Inf. 2017, 6, 236. [Google Scholar] [CrossRef] [Green Version]
- Zuo, Y.; Chen, H.; Pan, J.; Si, Y.; Law, R.; Zhang, M. Spatial distribution pattern and influencing factors of sports tourism resources in China. ISPRS Int. J. Geo-Inf. 2021, 10, 428. [Google Scholar] [CrossRef]
- Getis, A. Spatial Autocorrelation. In Handbook of Applied Spatial Analysis; Fischer, M.M., Getis, A., Eds.; Springer: Berlin, Germany, 2010. [Google Scholar]
- Chen, G.; Luo, J.; Zhang, C.; Jiang, L.; Tian, L.; Chen, G. Characteristics and influencing factors of spatial differentiation of urban black and odorous waters in China. Sustainability 2018, 10, 4747. [Google Scholar] [CrossRef] [Green Version]
- Wang, F. Quantitative Methods and Socio-Economic Applications in GIS; CRC Press: Boca Raton, FL, USA, 2014. [Google Scholar]
- Wang, J.; Xu, C. Geodetector: Principle and prospective. Acta Geogr. Sin. 2017, 72, 116–134. [Google Scholar] [CrossRef]
Publisher’s Note: MDPI stays neutral with regard to jurisdictional claims in published maps and institutional affiliations. |
© 2022 by the authors. Licensee MDPI, Basel, Switzerland. This article is an open access article distributed under the terms and conditions of the Creative Commons Attribution (CC BY) license (https://creativecommons.org/licenses/by/4.0/).