

Dynamics of the Burlan and Pomacochas Lakes Using SAR Data in GEE, Machine Learning Classifiers, and Regression Methods

 , ,
, ,  ,
,  and
and
Abstract
:1. Introduction
2. Materials and Methods
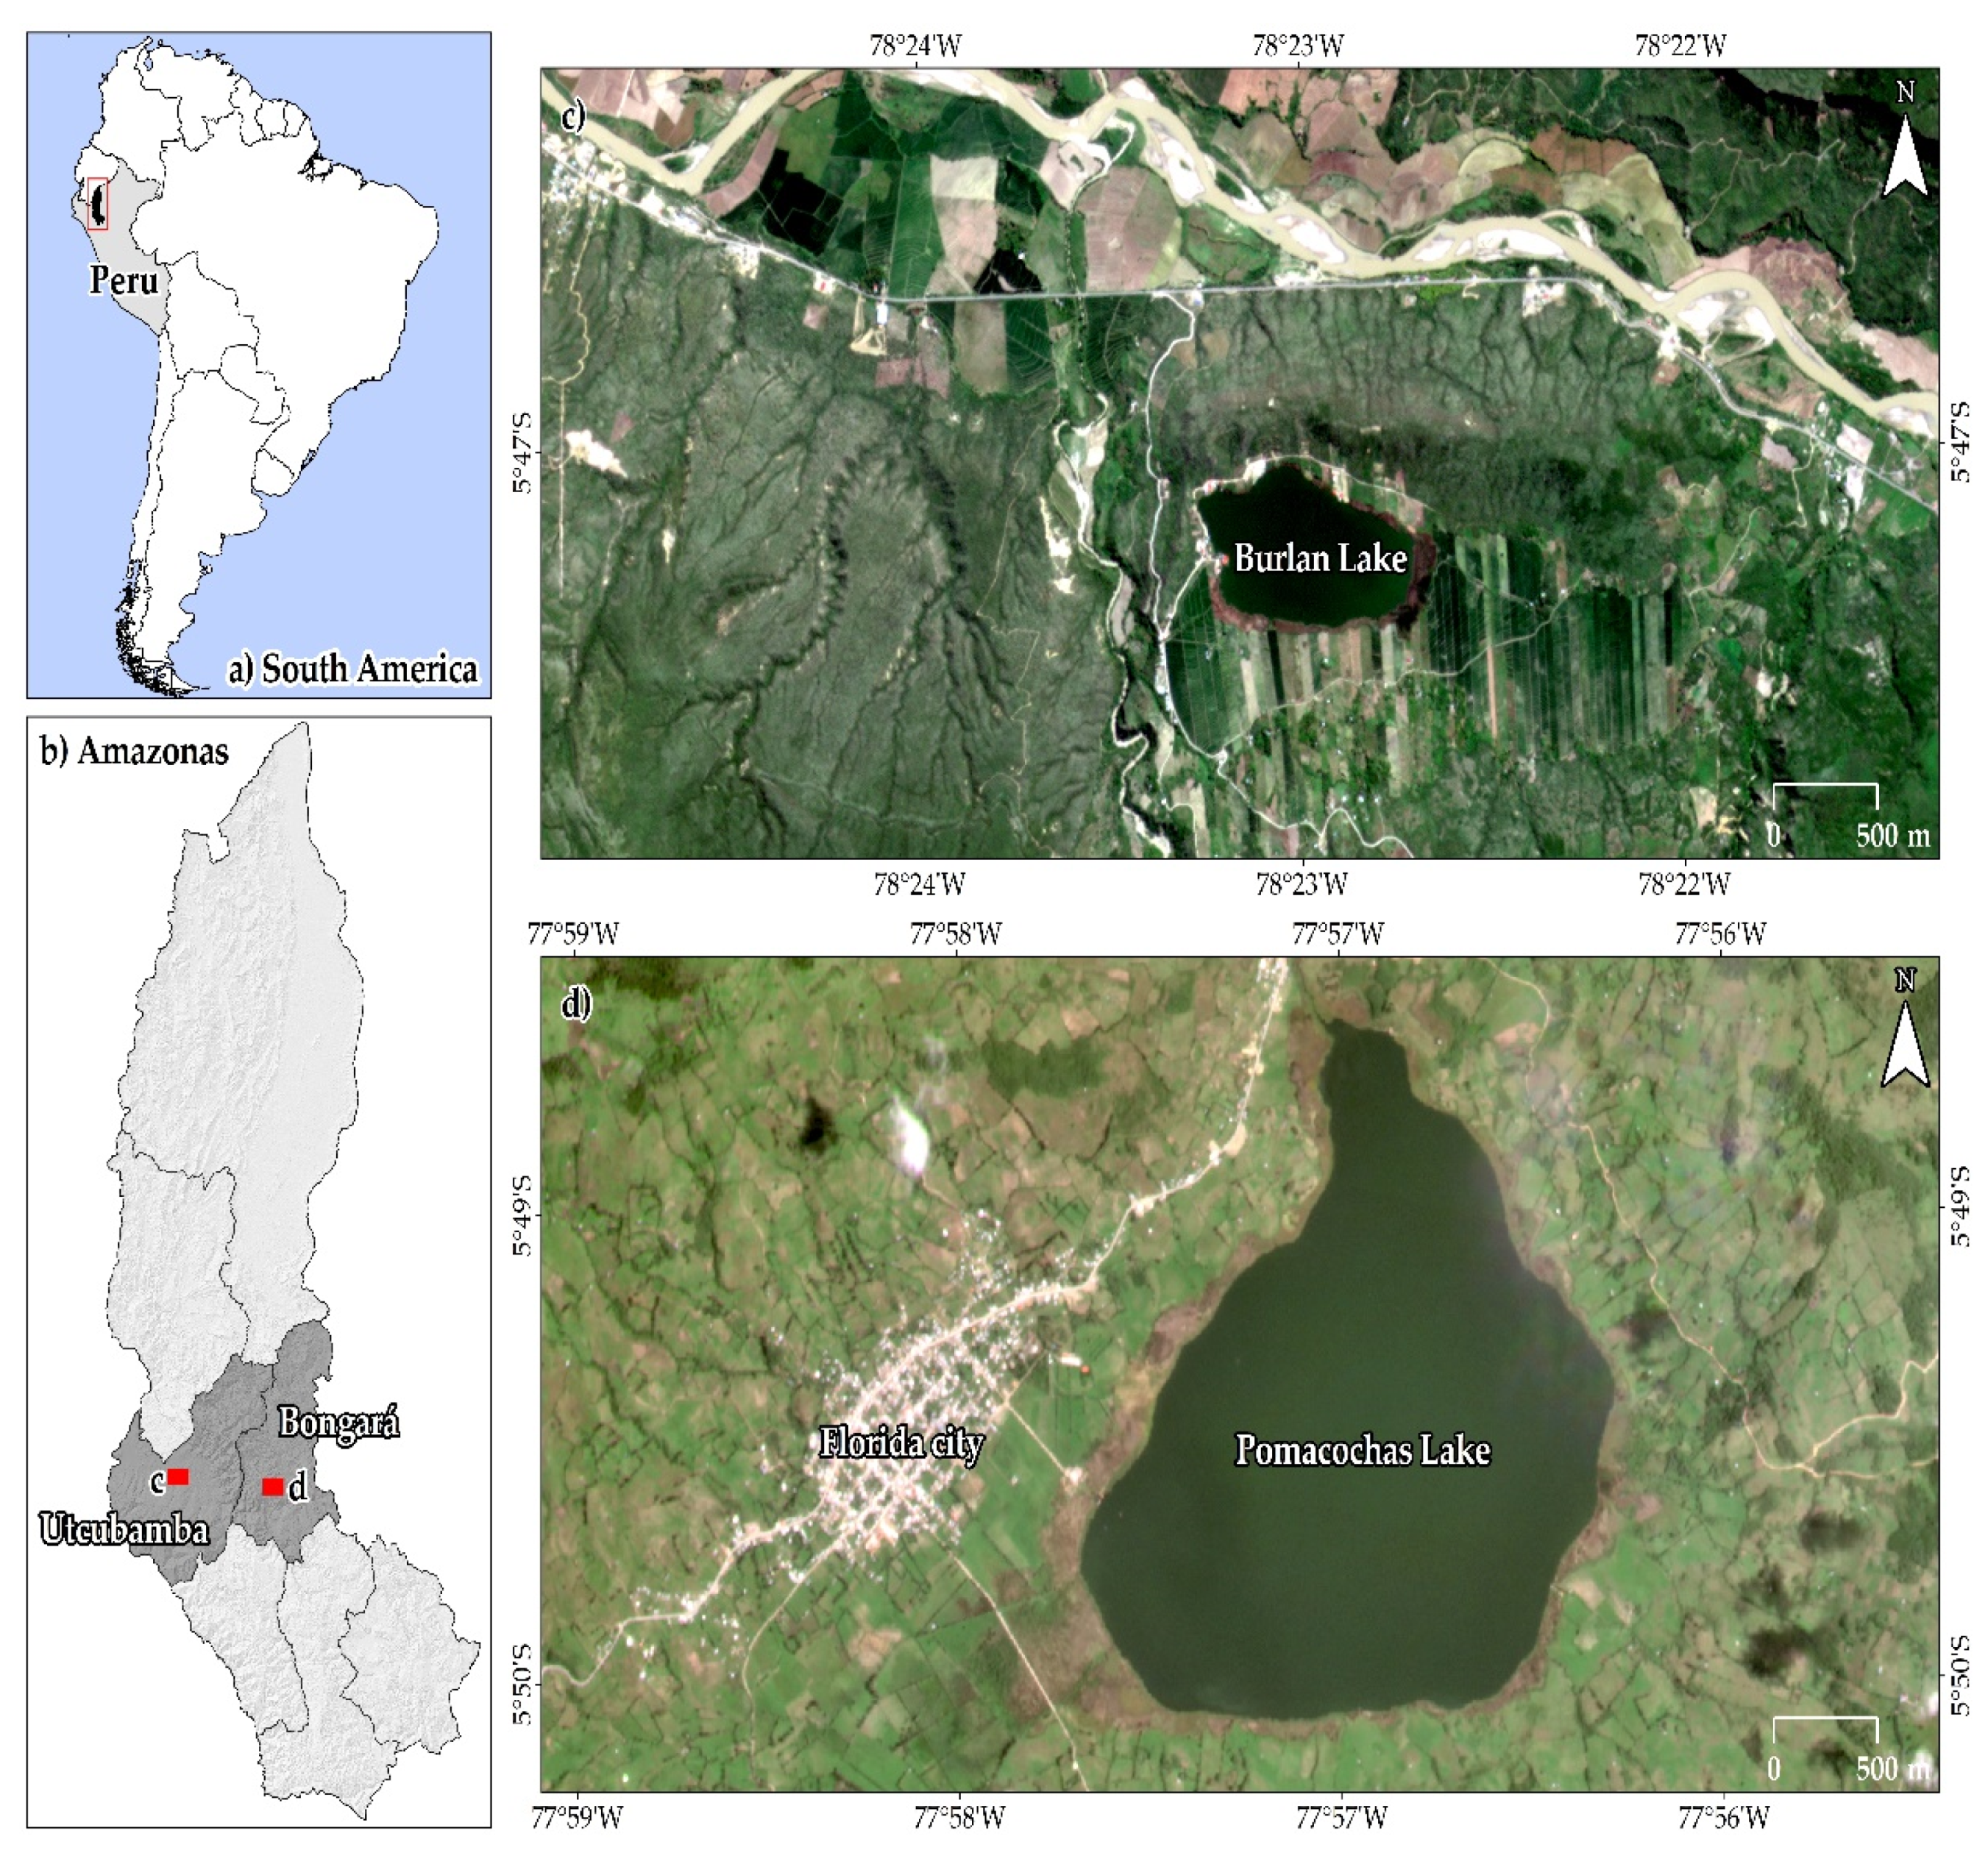
2.1. Study Area
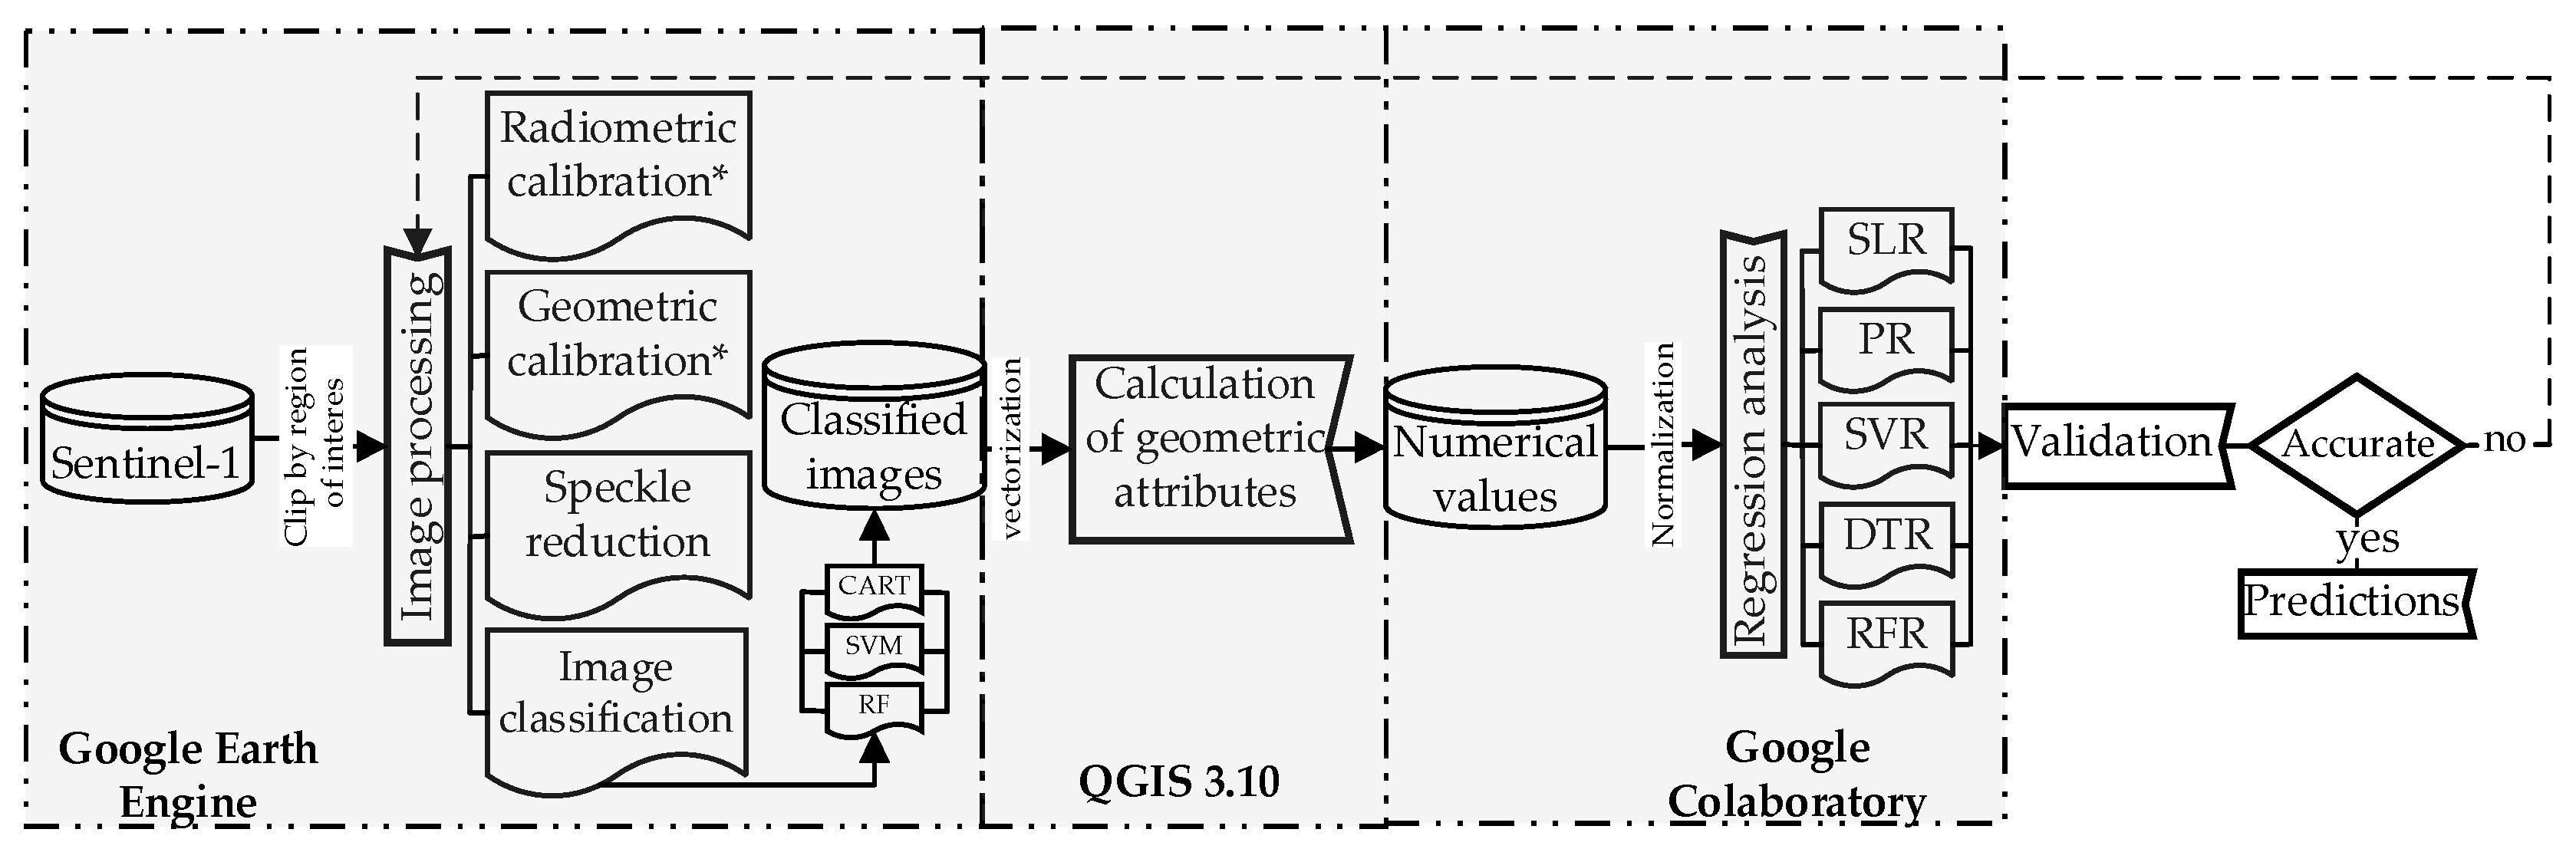
2.2. Methodological Scheme
2.3. SAR Dataset and Training Points
2.4. SAR Image Processing
2.5. Calculation of the Geometric Attributes
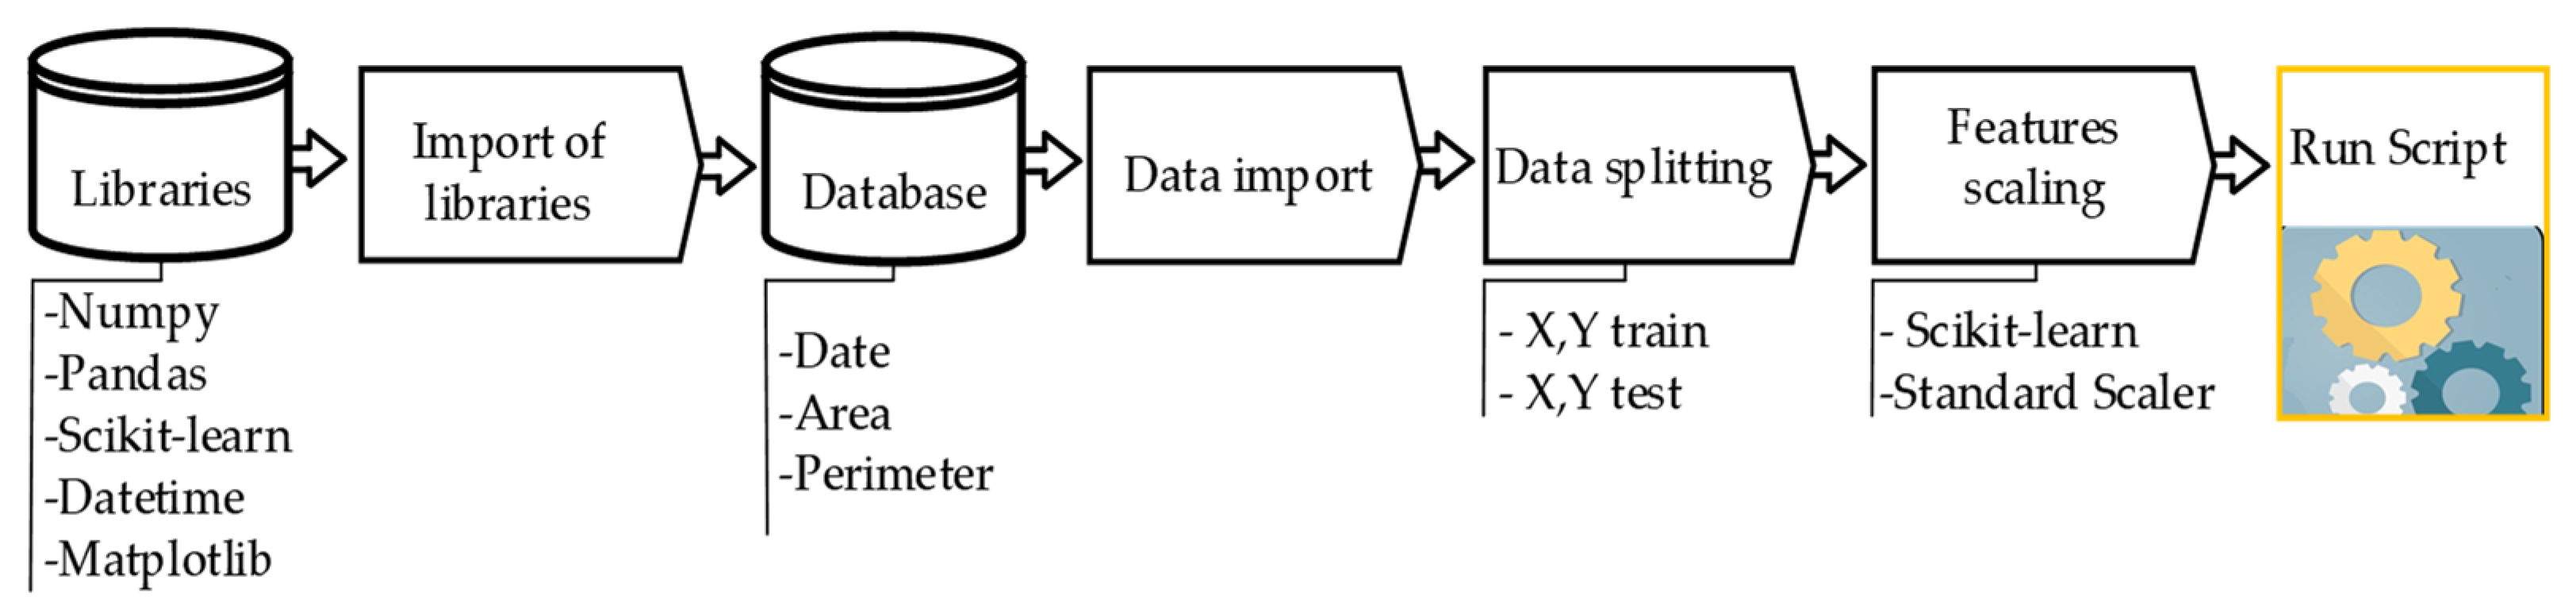
2.6. Regression Analysis
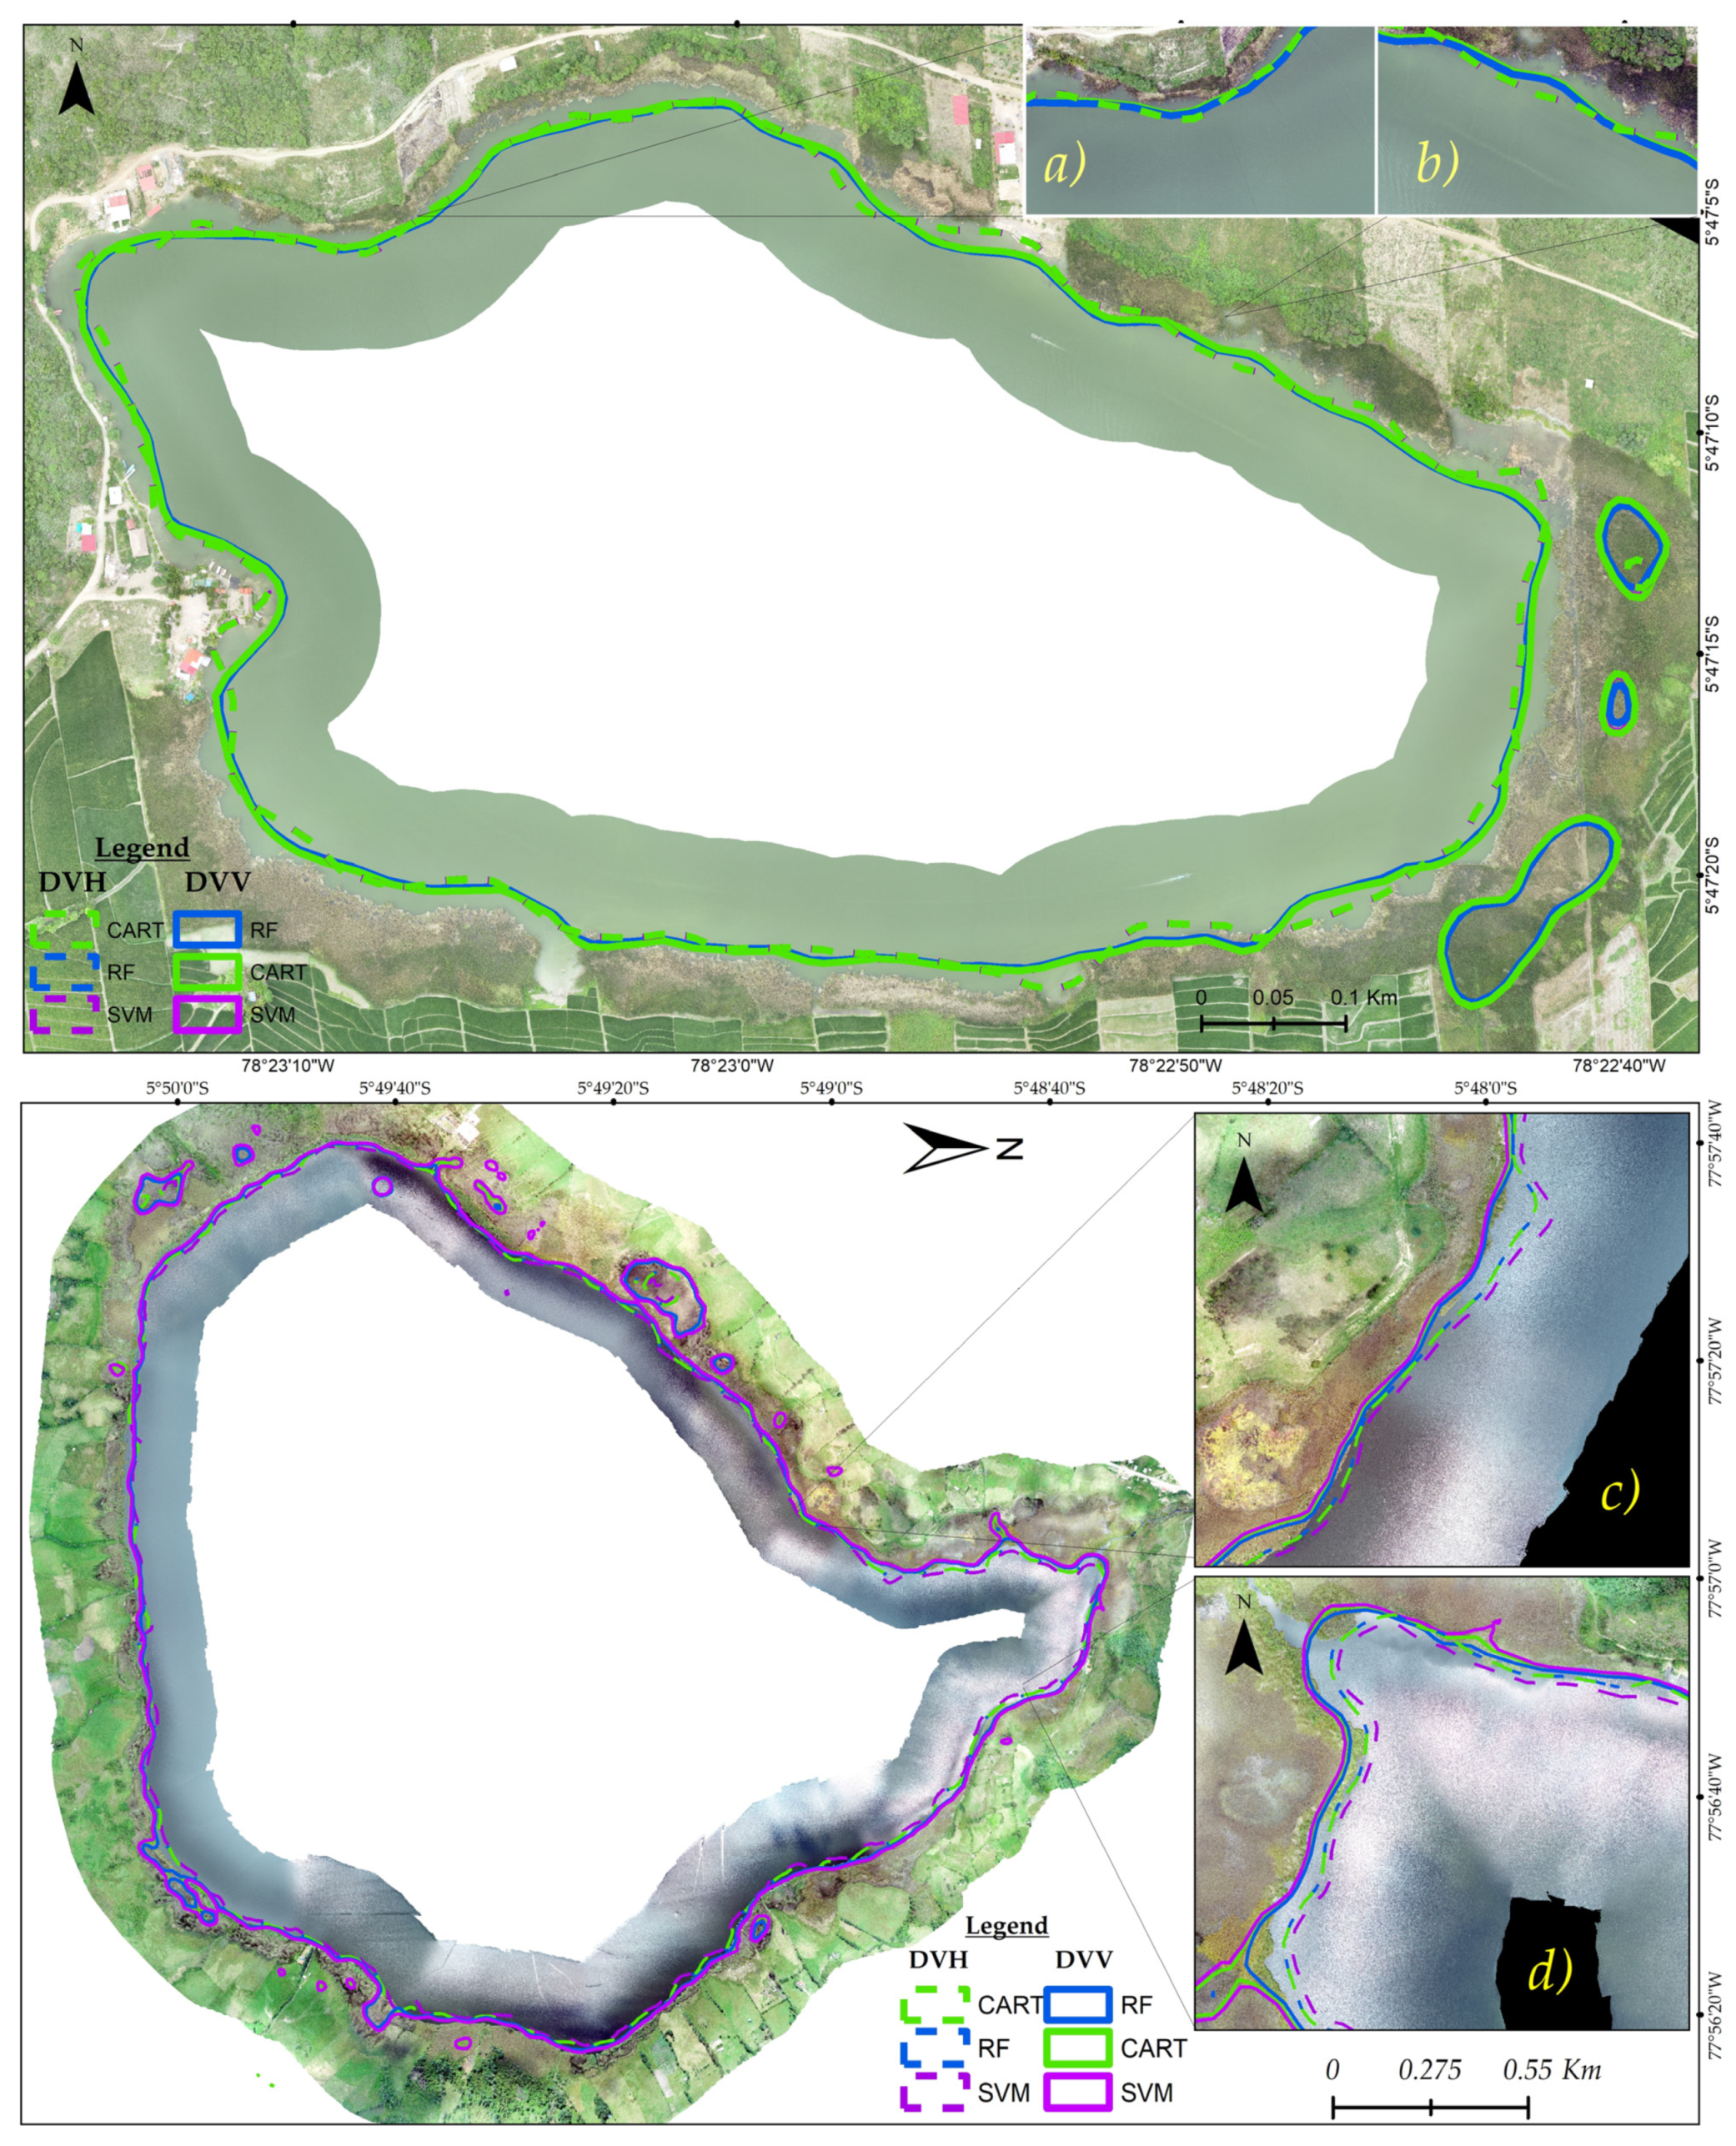
2.7. Field Data and Validation
3. Results
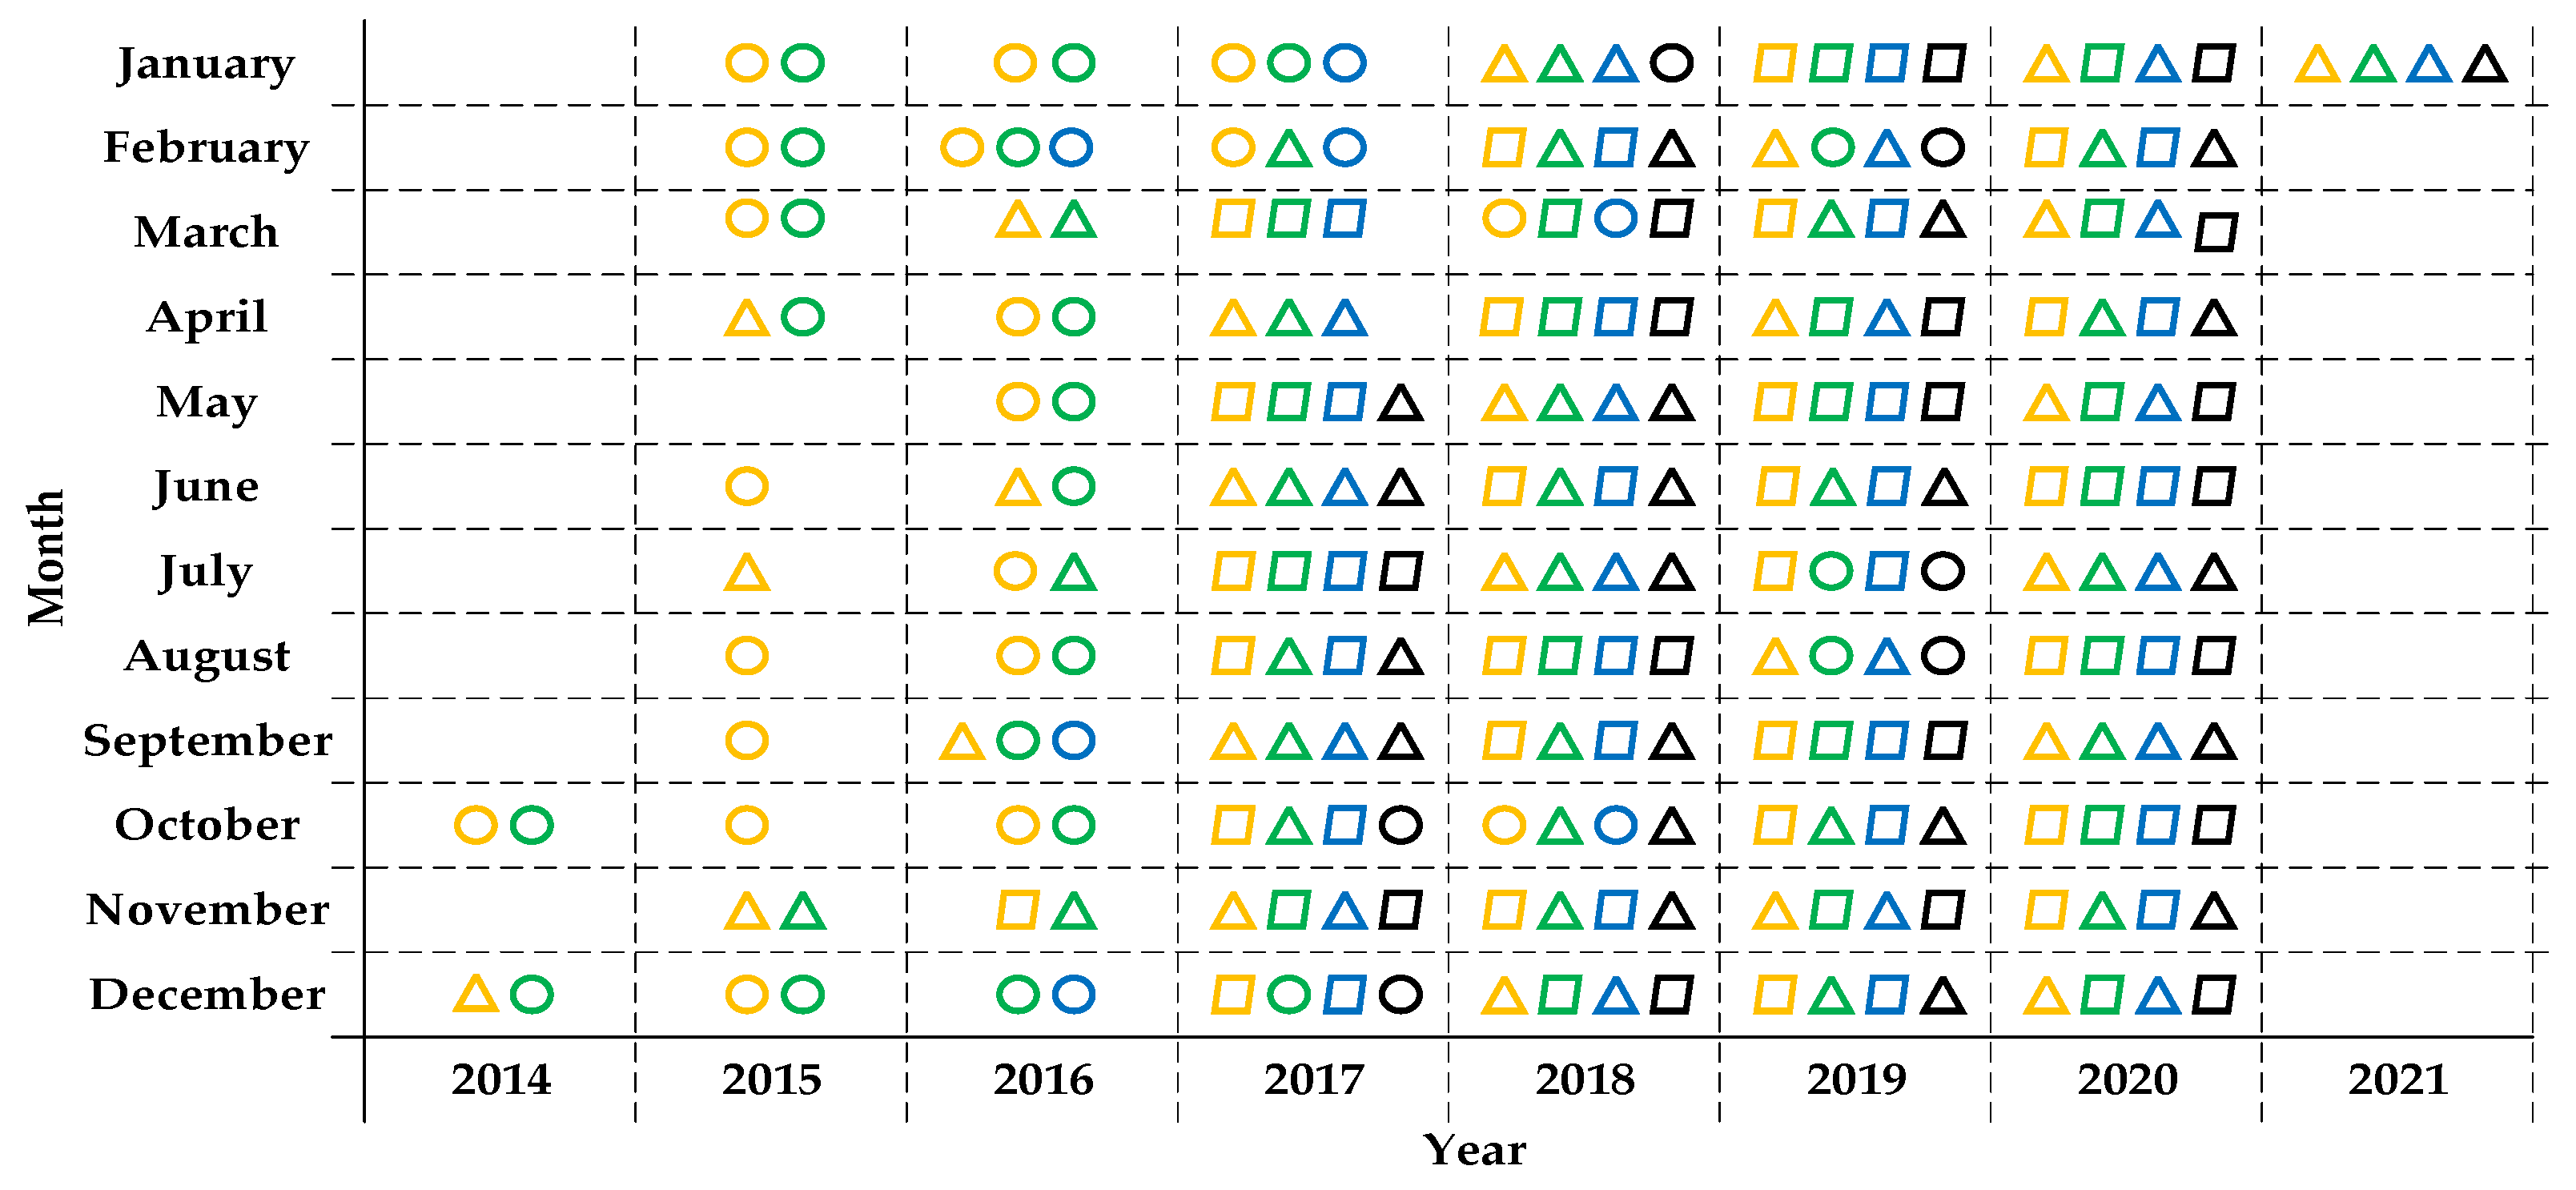
3.1. Distribution and Availability of SAR Data
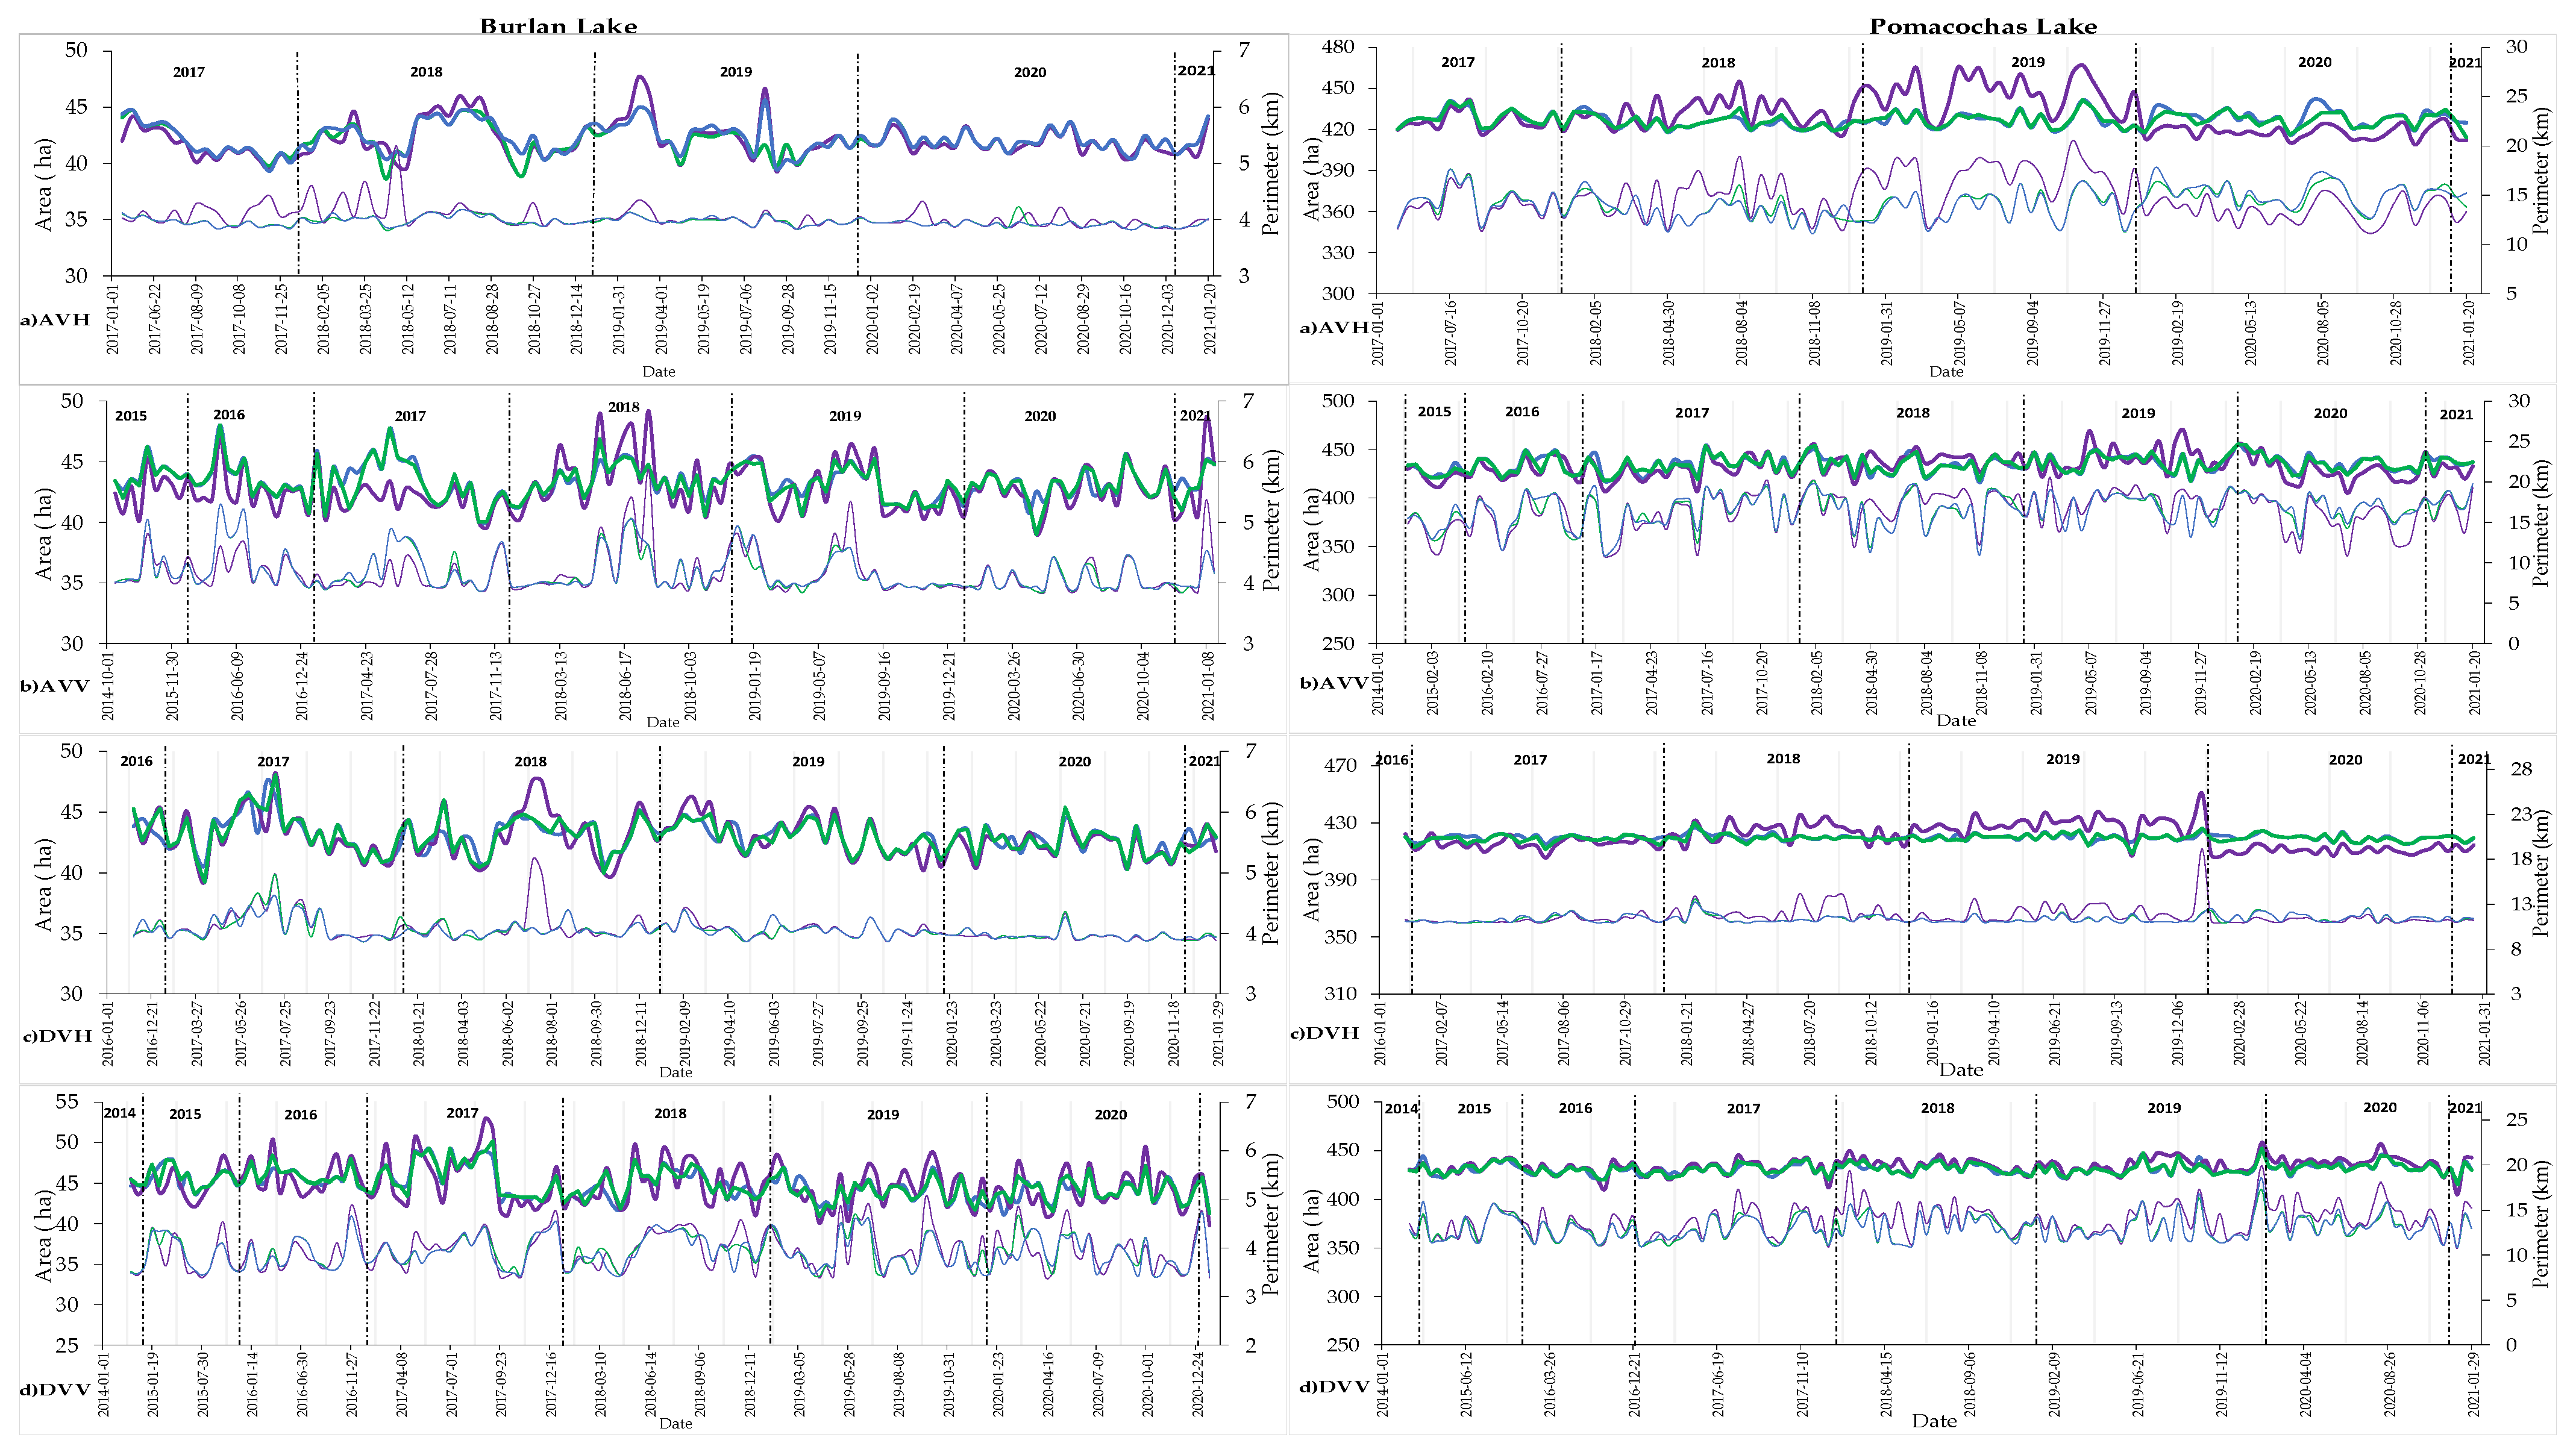
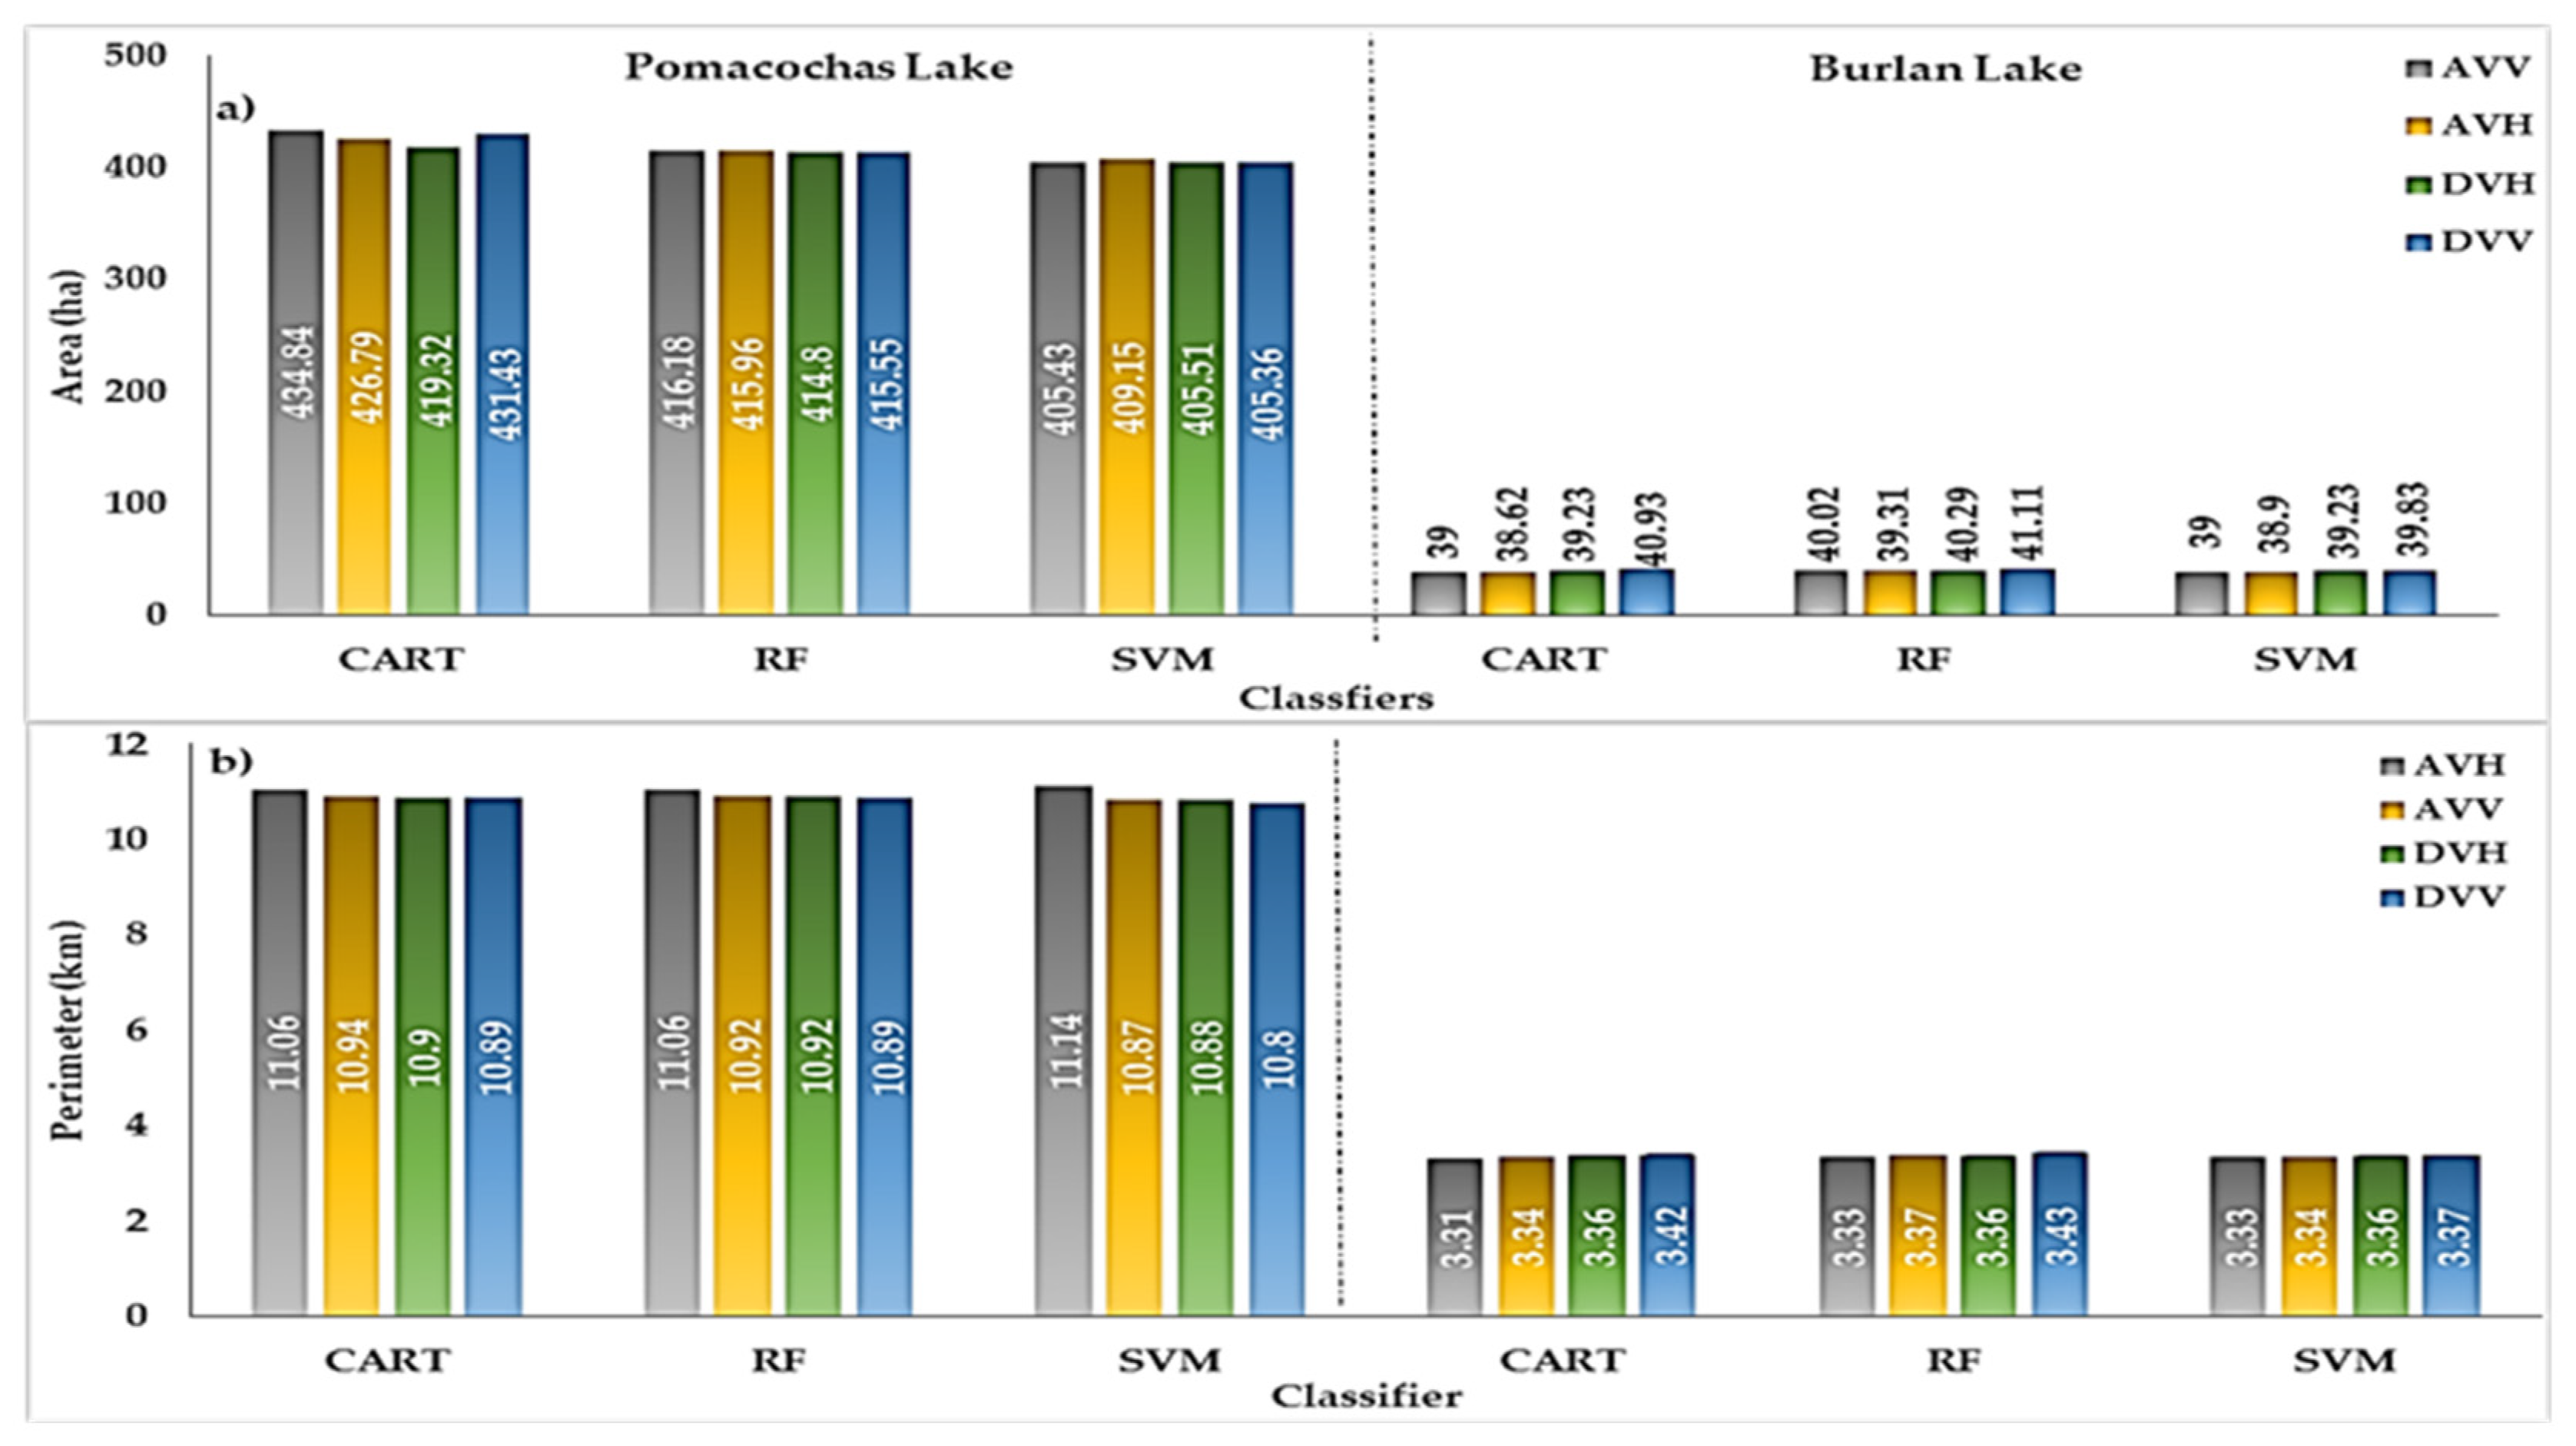
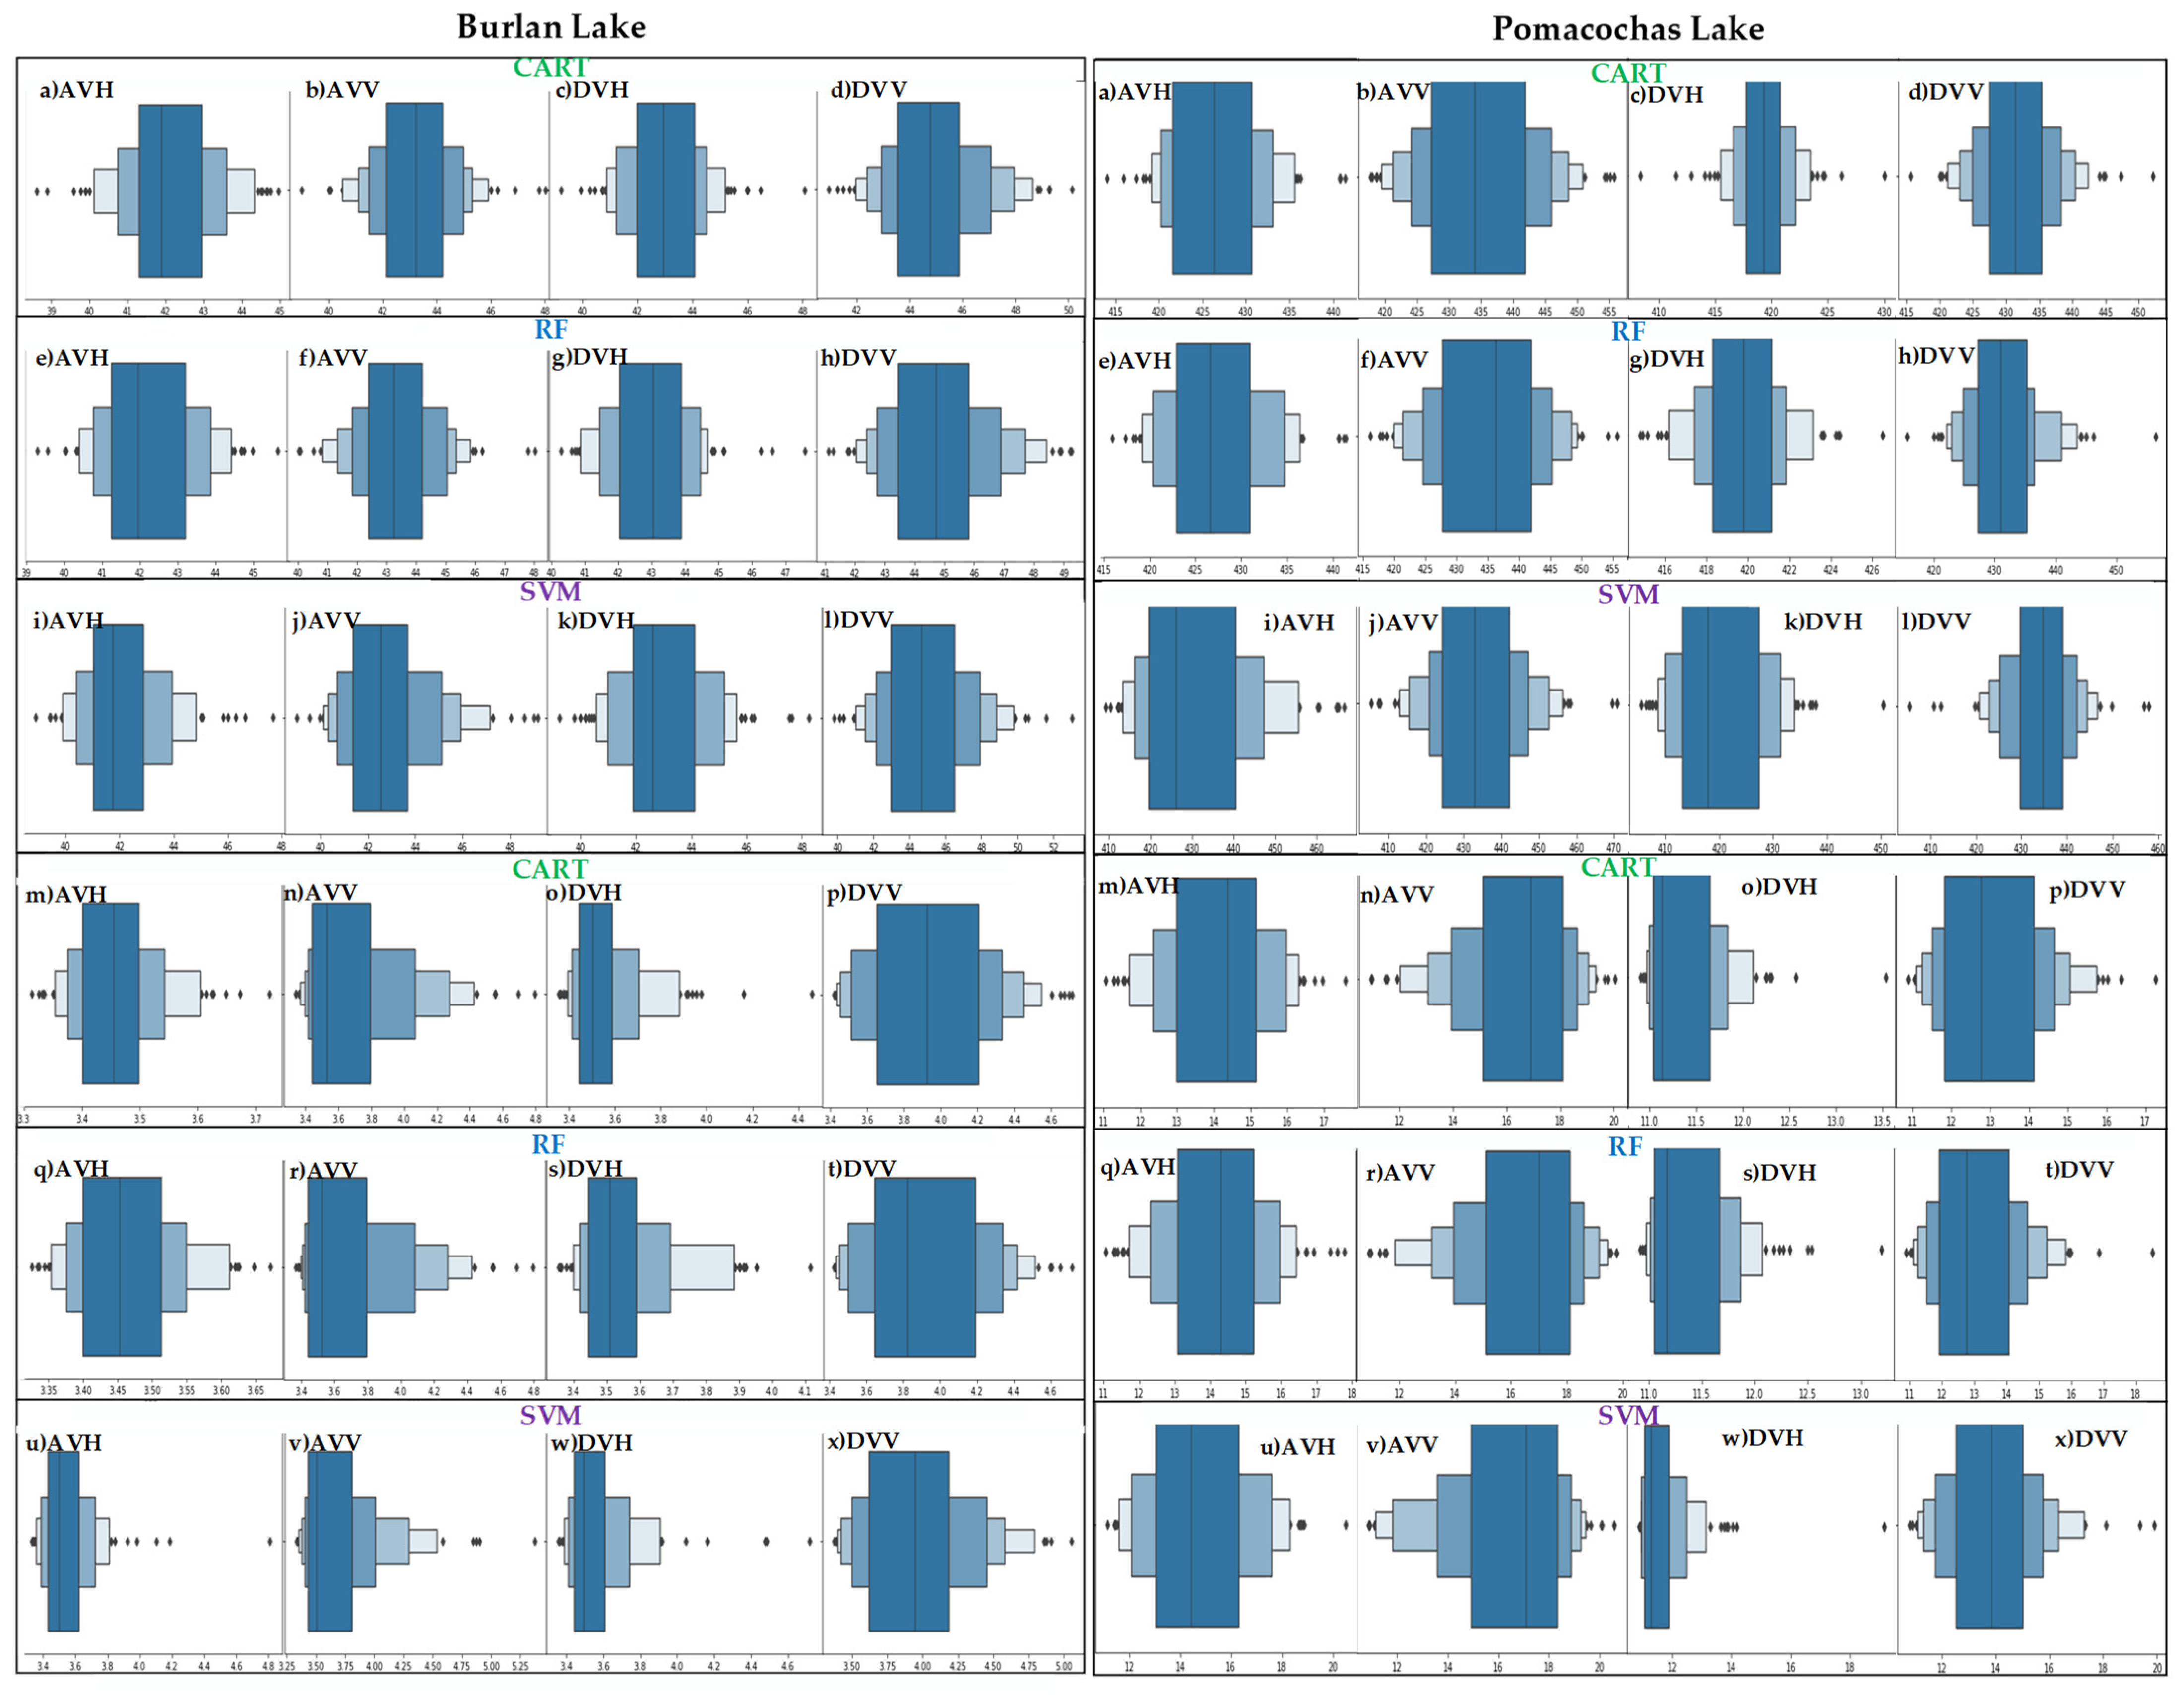
3.2. Obtaining the Geometric Attributes
3.3. Data Analysis and Prediction
3.3.1. Data Normalization
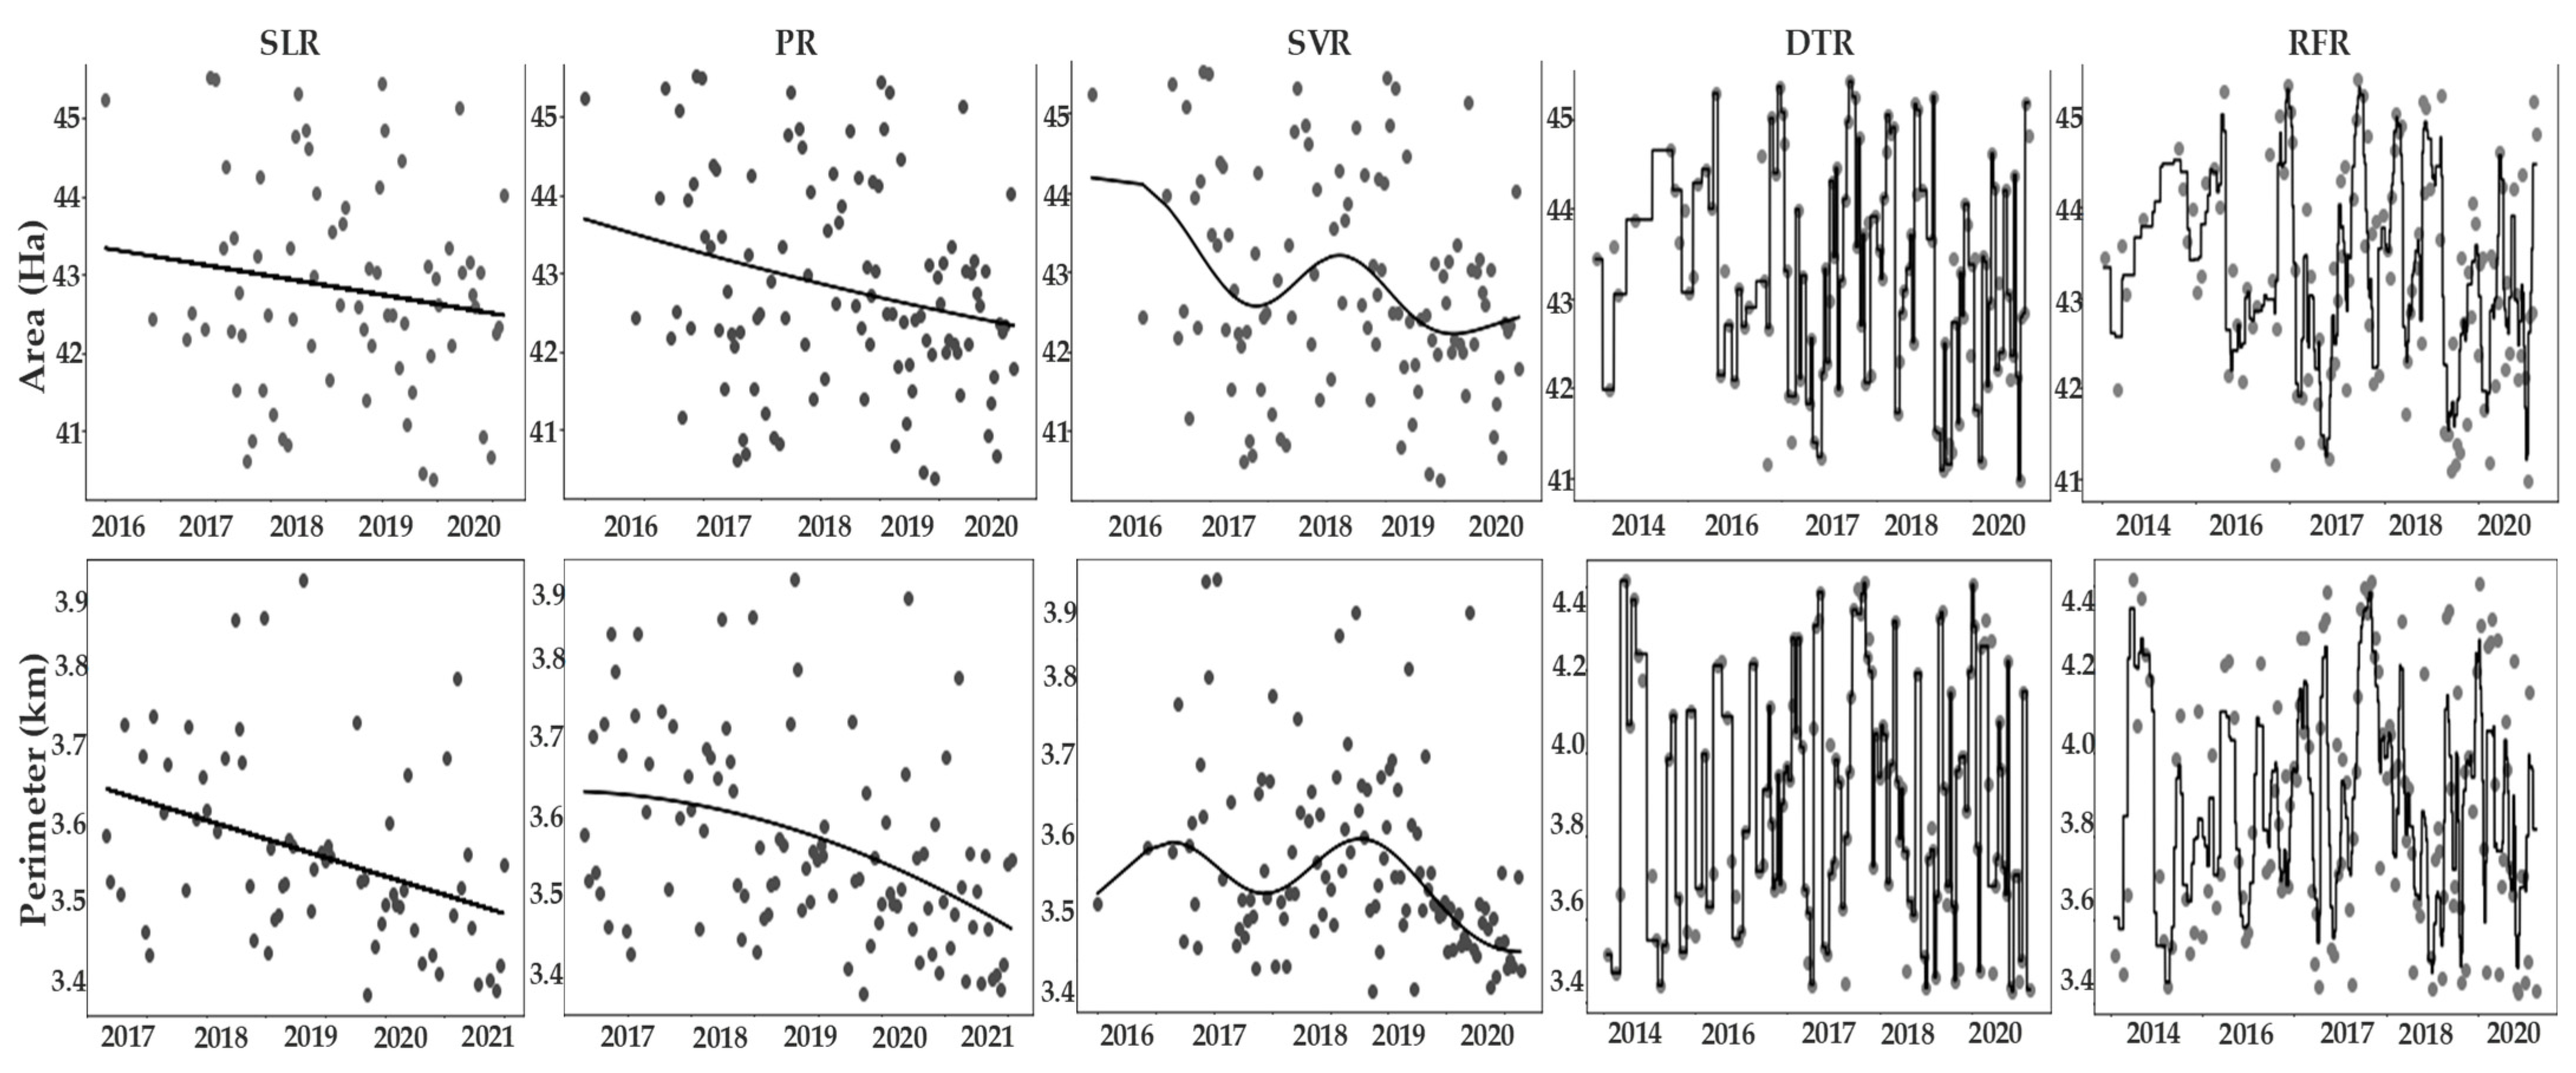
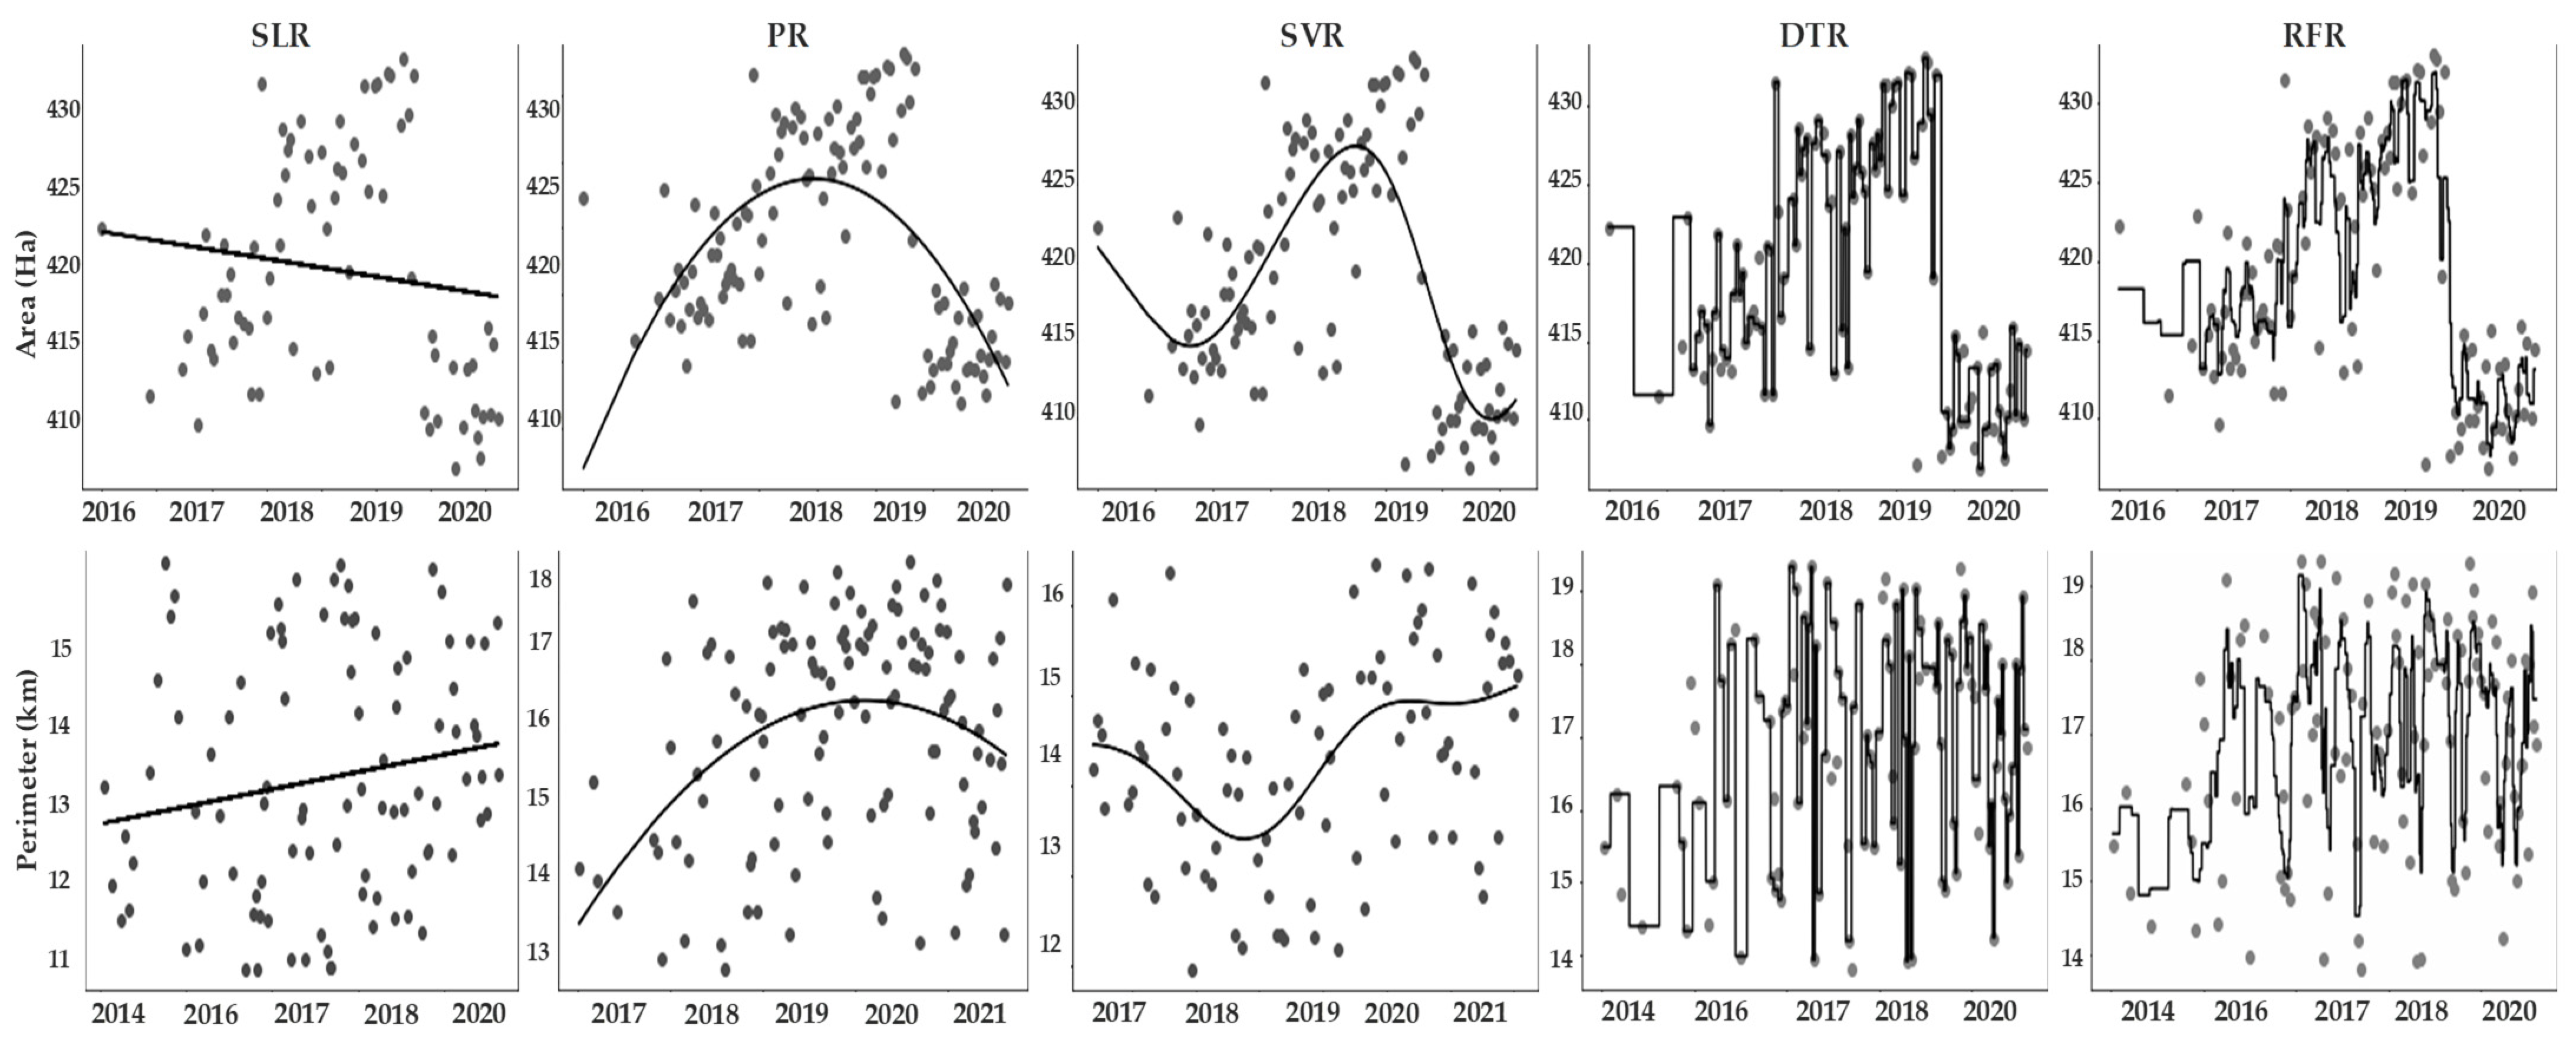
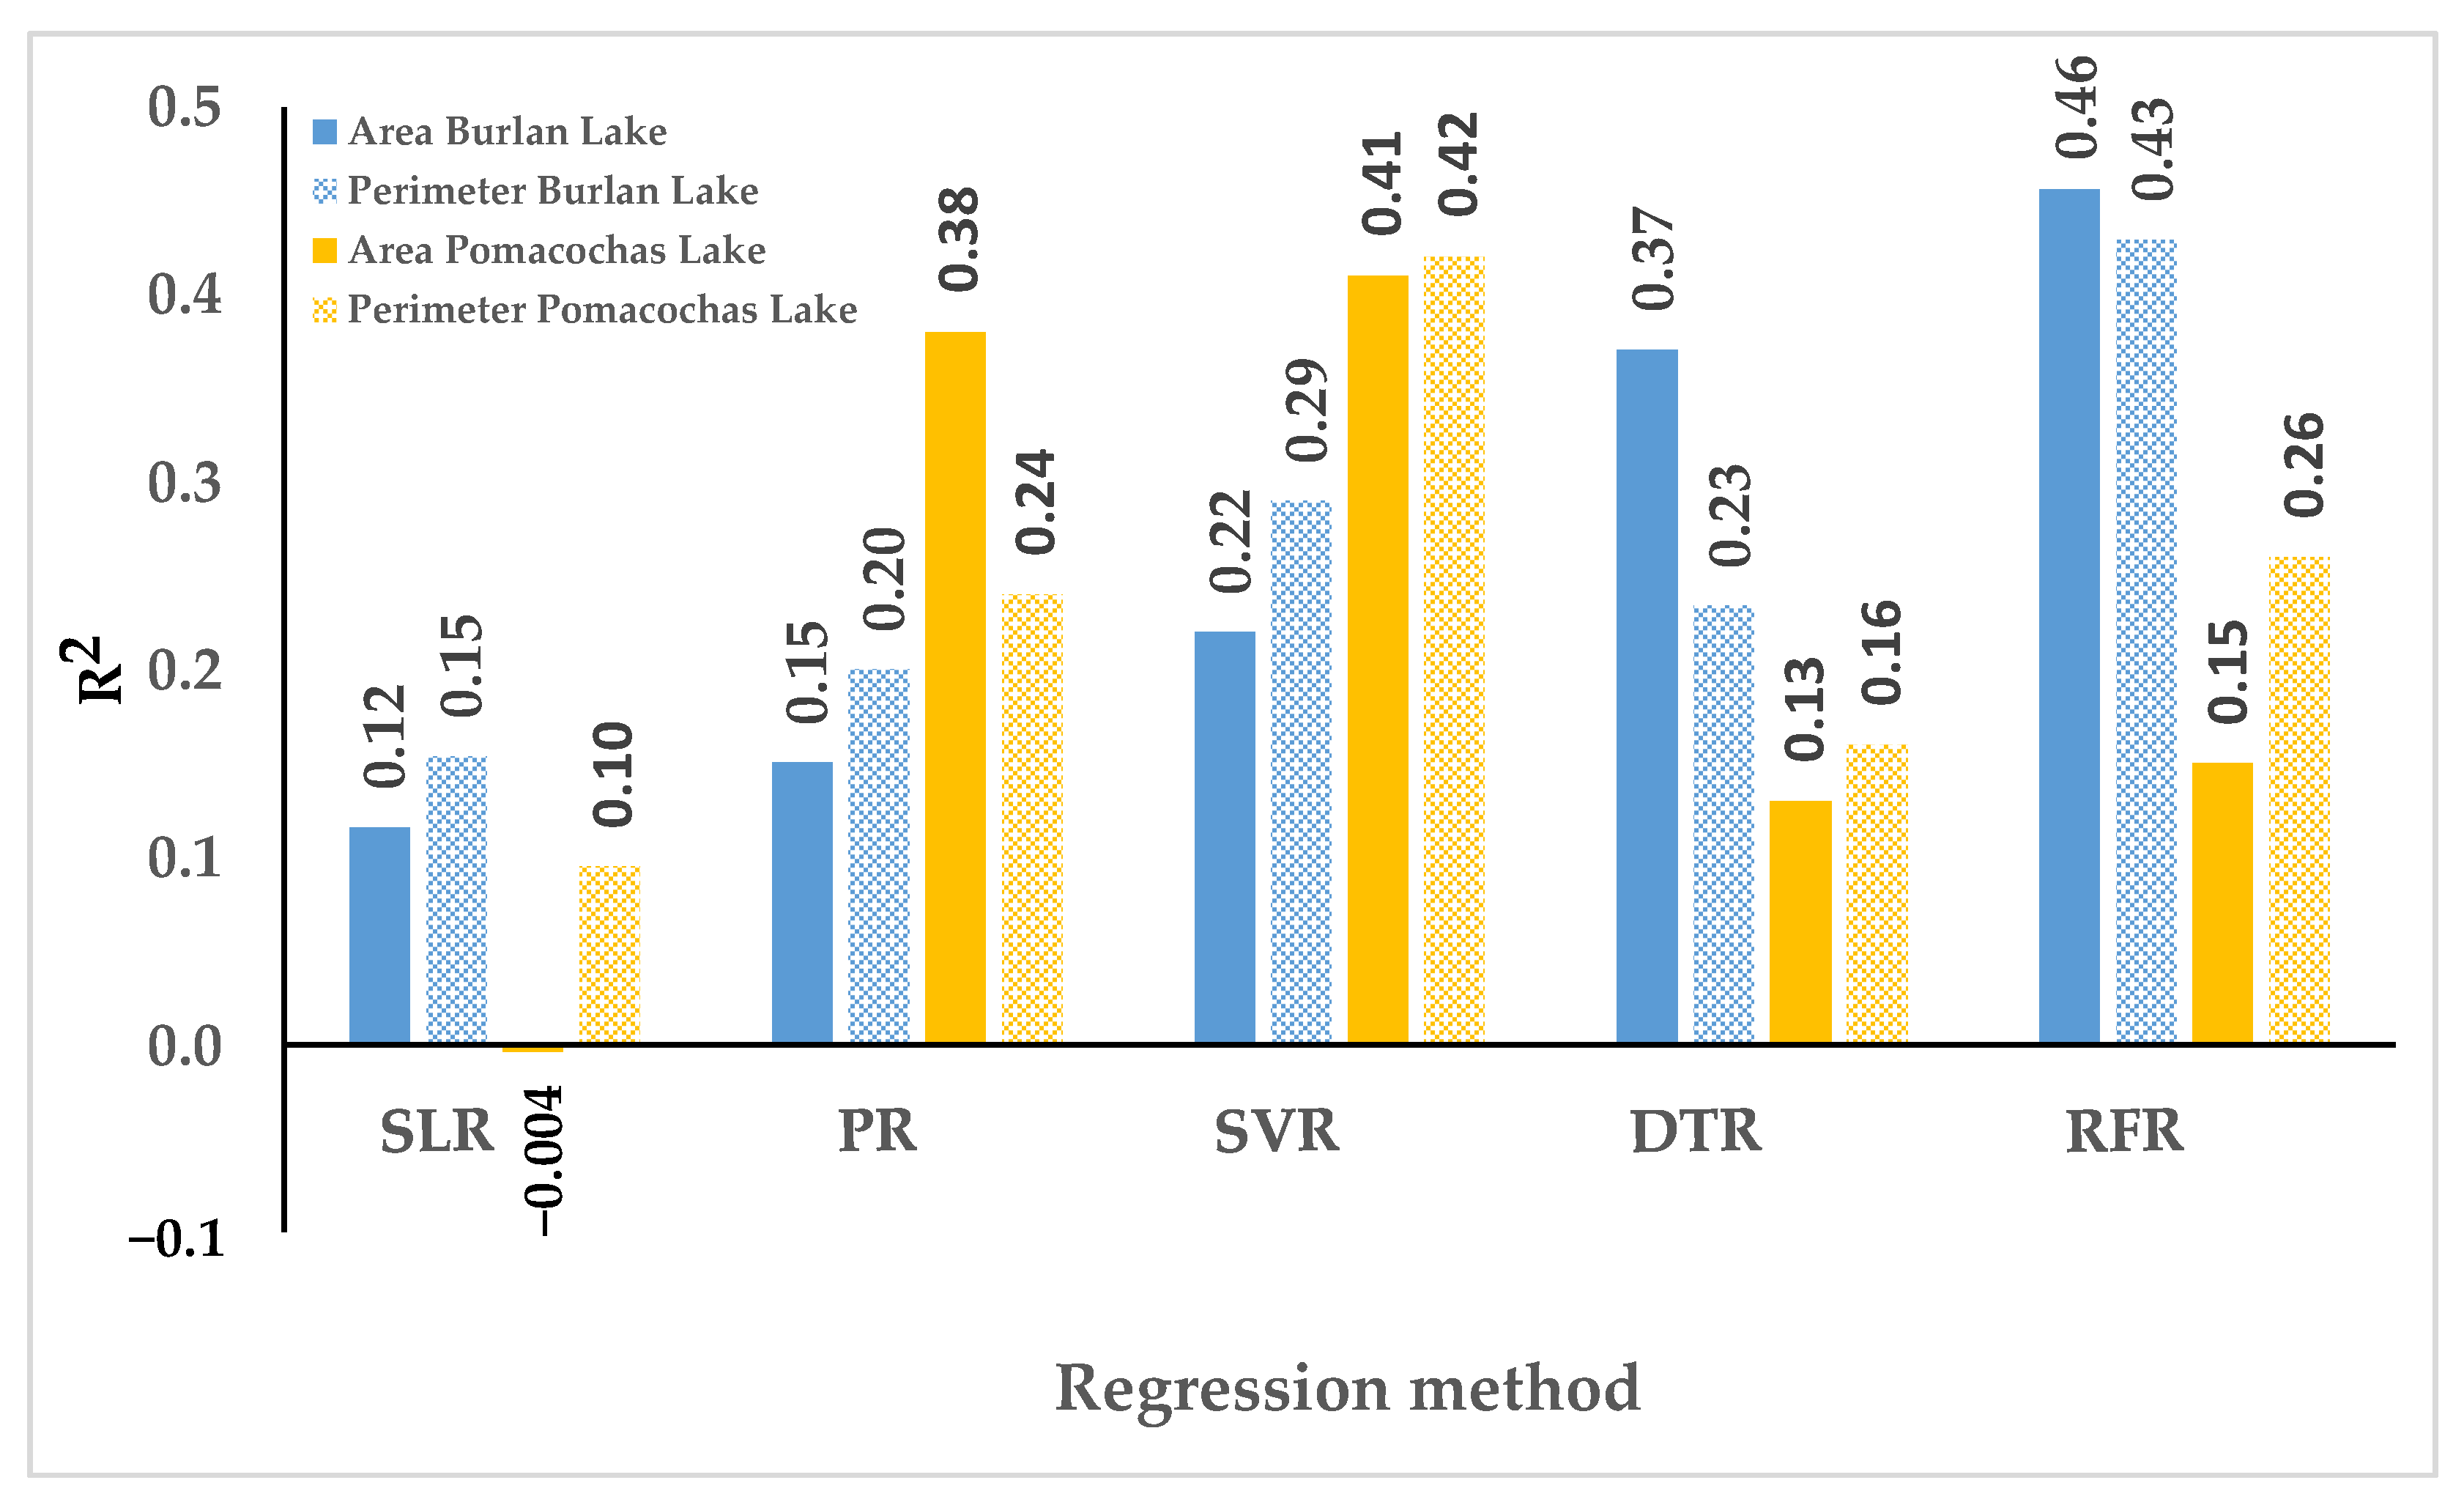
3.3.2. Regression Methods
3.3.3. Validation
4. Discussion
5. Conclusions
Supplementary Materials
Author Contributions
Funding
Data Availability Statement
Acknowledgments
Conflicts of Interest
References
- USGS Where Is Earth’s Water? Available online: https://www.usgs.gov/special-topic/water-science-school/science/where-earths-water?qt-science_center_objects=0#qt-science_center_objects (accessed on 10 April 2021).
- Meyer, M.F.; Labou, S.G.; Cramer, A.N.; Brousil, M.R.; Luff, B.T. The global lake area, climate, and population dataset. Sci. Data 2020, 7, 1–12. [Google Scholar] [CrossRef]
- Messager, M.L.; Lehner, B.; Grill, G.; Nedeva, I.; Schmitt, O. Estimating the volume and age of water stored in global lakes using a geo-statistical approach. Nat. Commun. 2016, 7, 13603. [Google Scholar] [CrossRef] [PubMed]
- Lee, Z.; Shang, S.; Qi, L.; Yan, J.; Lin, G. A semi-analytical scheme to estimate Secchi-disk depth from Landsat-8 measurements. Remote Sens. Environ. 2016, 177, 101–106. [Google Scholar] [CrossRef]
- Liu, J.; Yang, H.; Gosling, S.N.; Kummu, M.; Flörke, M.; Pfister, S.; Hanasaki, N.; Wada, Y.; Zhang, X.; Zheng, C.; et al. Water scarcity assessments in the past, present, and future. Earth’s Future 2017, 5, 545–559. [Google Scholar] [CrossRef]
- Li, S.; Tan, H.; Liu, Z.; Zhou, Z.; Liu, Y.; Zhang, W.; Liu, K.; Qin, B. Mapping High Mountain Lakes Using Space-Borne Near-Nadir SAR Observations. Remote Sens. 2018, 10, 1418. [Google Scholar] [CrossRef] [Green Version]
- Bioresita, F.; Puissant, A.; Stumpf, A.; Malet, J.P. Fusion of Sentinel-1 and Sentinel-2 image time series for permanent and temporary surface water mapping. Int. J. Remote Sens. 2019, 40, 9026–9049. [Google Scholar] [CrossRef]
- Liao, H.-Y.; Wen, T.-H. Extracting urban water bodies from high-resolution radar images: Measuring the urban surface morphology to control for radar’s double-bounce effect. Int. J. Appl. Earth Obs. Geoinf. 2020, 85, 102003. [Google Scholar] [CrossRef]
- Barasa, B.; Wanyama, J. Freshwater lake inundation monitoring using Sentinel-1 SAR imagery in Eastern Uganda. Ann. GIS 2020, 26, 191–200. [Google Scholar] [CrossRef] [Green Version]
- Musa, Z.N.; Popescu, I.; Mynett, A. A review of applications of satellite SAR, optical, altimetry and DEM data for surface water modelling, mapping and parameter estimation. Hydrol. Earth Syst. Sci. 2015, 19, 3755–3769. [Google Scholar] [CrossRef] [Green Version]
- Brisco, B. Mapping and Monitoring Surface Water and Wetlands with Synthetic Aperture Radar. Remote Sens. Wetl. Appl. Adv. 2015, 119–136. Available online: https://www.researchgate.net/profile/B-Brisco/publication/271765042_Remote_Sensing_of_Wetlands_Applications_and_Advances/links/59e4b1e1a6fdcc7154e140aa/Remote-Sensing-of-Wetlands-Applications-and-Advances.pdf (accessed on 15 October 2022).
- Dewan, A.M.; Kankam-Yeboah, K.; Nishigaki, M. Using Synthetic Aperture Radar (SAR) Data for Mapping River Water Flooding in an Urban Landscape: A Case Study of Greater Dhaka, Bangladesh. J. Jpn. Soc. Hydrol. Water Resour. 2006, 19, 44–54. [Google Scholar] [CrossRef]
- Nath, R.K.; Deb, S.K. Water-Body Area Extraction From High Resolution Satellite Images-An Introduction, Review, and Comparison. Int. J. Image Process. 2010, 3, 353–372. [Google Scholar]
- Zeng, L.; Schmitt, M.; Li, L.; Zhu, X.X. Analysing changes of the poyang lake water area using sentinel-1 synthetic aperture radar imagery. Int. J. Remote Sens. 2017, 38, 7041–7069. [Google Scholar] [CrossRef]
- Ding, X.W.; Li, X.F. Monitoring of the water-area variations of Lake Dongting in China with ENVISAT ASAR images. Int. J. Appl. Earth Obs. Geoinf. 2011, 13, 894–901. [Google Scholar] [CrossRef]
- Costa, M.P.F.; Telmer, K.H. Utilizing SAR imagery and aquatic vegetation to map fresh and brackish lakes in the Brazilian Pantanal wetland. Remote Sens. Environ. 2006, 105, 204–213. [Google Scholar] [CrossRef]
- Grunblatt, J.; Atwood, D. Mapping lakes for winter liquid water availability using SAR on the north slope of alaska. Int. J. Appl. Earth Obs. Geoinf. 2014, 27, 63–69. [Google Scholar] [CrossRef]
- Nery, T.; Sadler, R.; Solis-Aulestia, M.; White, B.; Polyakov, M.; Chalak, M. Comparing supervised algorithms in Land Use and Land Cover classification of a Landsat time-series. In Proceedings of the International Geoscience and Remote Sensing Symposium (IGARSS), Beijing, China, 10–15 July 2016; Institute of Electrical and Electronics Engineers Inc.: Piscataway, NJ, USA, 2016; pp. 5165–5168. [Google Scholar]
- Shetty, S. Analysis of Machine Learning Classifiers for LULC Classification on Google Earth Engine Analysis of Machine Learning Classifiers for LULC Classification on Google Earth Engine. Master’s Thesis, Universidad de Twente, Enschede, The Netherlands, 2019. [Google Scholar]
- Liaw, A.; Wiener, M. Classification and Regression by randomForest. R News 2002, 2, 18–22. [Google Scholar]
- Schapire, R.E.; Freund, Y.; Bartlett, P.; Lee, W.S. Boosting the margin: A new explanation for the effectiveness of voting methods. Ann. Stat. 1998, 26, 1651–1686. [Google Scholar] [CrossRef]
- Breiman, L. Bagging Predictors. Mach. Learn. 1996, 2, 123–140. [Google Scholar] [CrossRef] [Green Version]
- Gorelick, N.; Hancher, M.; Dixon, M.; Ilyushchenko, S.; Thau, D.; Moore, R. Google Earth Engine: Planetary-scale geospatial analysis for everyone. Remote Sens. Environ. 2017, 202, 18–27. [Google Scholar] [CrossRef]
- Tamiminia, H.; Salehi, B.; Mahdianpari, M.; Quackenbush, L.; Adeli, S.; Brisco, B. Google Earth Engine for geo-big data applications: A meta-analysis and systematic review. ISPRS J. Photogramm. Remote Sens. 2020, 164, 152–170. [Google Scholar] [CrossRef]
- Brownlee, J. Master Machine Learning Algorithms, 2016. Available online: https://machinelearningmastery.com/master-machine-learning-algorithms/(accessed on 15 October 2020).
- SENAMHI Mapa Climático del Perú. Available online: https://www.senamhi.gob.pe/?p=mapa-climatico-del-peru (accessed on 22 October 2020).
- Barboza-Castillo, E.; Maicelo-Quintana, J.L.; Vigo-Mestanza, C.; Castro-Silupú, J.; Oliva-Cruz, S.M. Análisis morfométrico y batimétrico del lago Pomacochas (Perú). Indes 2016, 2, 90–97. [Google Scholar] [CrossRef]
- ESA Sentinel-1. Available online: https://sentinel.esa.int/web/sentinel/missions/sentinel-1 (accessed on 12 January 2021).
- GEE Sentinel-1 Algorithms. Available online: https://developers.google.com/earth-engine/guides/sentinel1 (accessed on 15 January 2021).
- Maitre, H. (Ed.) Processing of Synthetic Aperture Radar Images; ISTE Ltd Jhon Wiley & Sons, Inc.: Hoboken, NJ, USA, 2008; ISBN 978-1-84821-024-0. [Google Scholar]
- GEE ee.Image.focal_median. Available online: https://developers.google.com/earth-engine/apidocs/ee-image-focal_median#javascript (accessed on 15 January 2021).
- GEE Supervised Classification. Available online: https://developers.google.com/earth-engine/guides/classification (accessed on 22 January 2021).
- Breiman, L. Random forests. Mach. Learn. 2001, 45, 5–32. [Google Scholar] [CrossRef]
- Breiman, L.; Jerome, F.; Stone, C.J.; Olshen, R.A. Classification and Regresion Trees; Taylor & Francis Group: Abingdon, UK, 1984; ISBN 978-0-412-04841-8. [Google Scholar]
- Burges, C.J.C. A tutorial on support vector machines for pattern recognition. Data Min. Knowl. Discov. 1998, 2, 121–167. [Google Scholar] [CrossRef]
- Hsu, C.-W.; Chang, C.-C.; Lin, C.-J. A Practical Guide to Support Vector Classification 2003; Available online: https://www.bibsonomy.org/bibtex/2c04ef97dc3c3de168e684c3e4abe061b/jil (accessed on 15 October 2021).
- Stehman, S.V. Selecting and interpreting measures of thematic classification accuracy. Remote Sens. Environ. 1997, 62, 77–89. [Google Scholar] [CrossRef]
- Pedregosa, F.; Varoquaux, G.; Gramfort, A.; Michael, V.; Thirion, B.; Grisel, O.; Blondel, M.; Prettenhofer, P.; Weiss, R.; Dubourg, V.; et al. Scikit-learn: Machine Learning in Python. J. Mach. Learn. Res. 2011, 12, 2825–2830. [Google Scholar]
- Altman, N.; Krzywinski, M. Association, correlation and causation. Nat. Methods 2015, 12, 899–900. [Google Scholar] [CrossRef] [PubMed] [Green Version]
- Altman, N.; Krzywinski, M. Simple linear regression. Nat. Methods 2015, 12, 999–1000. [Google Scholar] [CrossRef] [PubMed]
- sklearn.linear_model.LinearRegression. Available online: https://scikit-learn.org/stable/modules/generated/sklearn.linear_model.LinearRegression.html (accessed on 25 January 2021).
- sklearn.preprocessing.PolynomialFeatures. Available online: https://scikit-learn.org/stable/modules/generated/sklearn.preprocessing.PolynomialFeatures.html (accessed on 25 January 2021).
- sklearn.preprocessing.StandardScaler. Available online: https://scikit-learn.org/stable/modules/generated/sklearn.preprocessing.StandardScaler.html (accessed on 26 January 2021).
- Vapnik, V.N. The Nature of Statistical Learning Theory; Springer: New York, NY, USA, 2000. [Google Scholar]
- sklearn.svm.SVR. Available online: https://scikit-learn.org/stable/modules/generated/sklearn.svm.SVR.html (accessed on 25 January 2021).
- Support Vector Regression (SVR) Using Linear and Non-Linear Kernels—Scikit-Learn 1.1.2 Documentation. Available online: https://scikit-learn.org/stable/auto_examples/svm/plot_svm_regression.html#sphx-glr-auto-examples-svm-plot-svm-regression-py (accessed on 5 October 2022).
- sklearn.ensemble.RandomForestRegressor. Available online: https://scikit-learn.org/stable/modules/generated/sklearn.ensemble.RandomForestRegressor.html#examples-using-sklearn-ensemble-randomforestregressor (accessed on 25 January 2021).
- sklearn.tree.DecisionTreeRegressor . Available online: https://scikit-learn.org/stable/modules/generated/sklearn.tree.DecisionTreeRegressor.html (accessed on 25 January 2021).
- Metrics and Scoring: Quantifying the Quality of Predictions. Available online: https://scikit-learn.org/stable/modules/model_evaluation.html#regression-metrics (accessed on 26 January 2021).
- seaborn.boxenplot. Available online: https://seaborn.pydata.org/generated/seaborn.boxenplot.html#seaborn.boxenplot (accessed on 25 March 2021).
- Hofmann, H.; Kafadar, K.; Wickham, H. Letter-value plots: Boxplots for large data. Am. Stat. 2011, 22. [Google Scholar] [CrossRef]
- Strozzi, T.; Wiesmann, A.; Kääb, A.; Joshi, S.; Mool, P. Glacial lake mapping with very high resolution satellite SAR data. Nat. Hazards Earth Syst. Sci. 2012, 12, 2487–2498. [Google Scholar] [CrossRef] [Green Version]
- Jiang, Z.; Jiang, W.; Ling, Z.; Wang, X.; Peng, K.; Wang, C. Surface Water Extraction and Dynamic Analysis of Baiyangdian Lake Based on the Google Earth Engine Platform Using Sentinel-1 for Reporting SDG 6.6.1 Indicators. Water 2021, 13, 138. [Google Scholar] [CrossRef]
- European Space Agency Radiometric Calibration of Level-1 Products. Available online: https://sentinel.esa.int/web/sentinel/radiometric-calibration-of-level-1-products (accessed on 26 September 2021).
- Li, J.; Wang, S. An automatic method for mapping inland surface waterbodies with Radarsat-2 imagery. Int. J. Remote Sens. 2015, 36, 1367–1384. [Google Scholar] [CrossRef]
- Horritt, M.S.; Mason, D.C.; Luckman, A.J. Flood boundary delineation from synthetic aperture radar imagery using a statistical active contour model. Int. J. Remote Sens. 2001, 22, 2489–2507. [Google Scholar] [CrossRef]
- Indicators for the Sustainable Development Goals. Available online: https://sdg.data.gov/es/ (accessed on 24 May 2021).
- Pande-Chhetri, R.; Abd-Elrahman, A.; Liu, T.; Morton, J.; Wilhelm, V.L. Object-based classification of wetland vegetation using very high-resolution unmanned air system imagery. Eur. J. Remote Sens. 2017, 50, 564–576. [Google Scholar] [CrossRef]
- Statnikov, A.; Wang, L.; Aliferis, C.F. A comprehensive comparison of random forests and support vector machines for microarray-based cancer classification. BMC Bioinform. 2008, 9, 319. [Google Scholar] [CrossRef] [Green Version]
- Liu, M.; Wang, M.; Wang, J.; Li, D. Comparison of random forest, support vector machine and back propagation neural network for electronic tongue data classification: Application to the recognition of orange beverage and Chinese vinegar. Sens. Actuators B Chem. 2013, 177, 970–980. [Google Scholar] [CrossRef]
- Liu, T.; Abd-Elrahman, A.; Morton, J.; Wilhelm, V.L. Comparing fully convolutional networks, random forest, support vector machine, and patch-based deep convolutional neural networks for object-based wetland mapping using images from small unmanned aircraft system. GISci. Remote Sens. 2018, 55, 243–264. [Google Scholar] [CrossRef]
- Valdez-Lazalde, J.R.; González-Guillén, M.d.J.; de los Santos-Posadas, H.M. Estimación de cobertura arbórea mediante imágenes satelitales multiespectrales de alta resolución. Agrociencia 2006, 40, 383–394. [Google Scholar]
- Vila, H.; Perez Peña, J.; García, M.; Vallone, R.C.; Mastrantonio, L.; Olmedo, G.F.; Rodríguez Plaza, L.; Salcedo, C. Congreso Internacional de la AET. “Teledetección Hacia un Mejor Entendimiento de la Dinámica Global y Regional”; Estación Experimental Agropecuaria Mendoza INTA: Mendoza, Argentina, 2007. [Google Scholar]
- Moreira, A.; Prats-Iraola, P.; Younis, M.; Krieger, G.; Hajnsek, I.; Papathanassiou, K. A Tutorial on Synthetic Aperture Radar. IEEE Geosci. Remote Sens. Mag. 2013, 1, 6–43. [Google Scholar] [CrossRef] [Green Version]
- Yunis, C.R.C.; López, R.S.; Cruz, S.M.O.; Castillo, E.B.; López, J.O.S.; Trigoso, D.I.; Briceño, N.B.R. Land Suitability for Sustainable Aquaculture of Rainbow Trout (Oncorhynchus mykiss) in Molinopampa (Peru) Based on RS, GIS, and AHP. ISPRS Int. J. Geo-Inf. 2020, 9, 28. [Google Scholar] [CrossRef] [Green Version]
- Jin-Ming, Y.; Li-Gang, M.; Cheng-Zhi, L.; Yang, L.; Jian-li, D.; Sheng-Tian, Y. Temporal-spatial variations and influencing factors of Lakes in inland arid areas from 2000 to 2017: A case study in Xinjiang. Geomat. Nat. Hazards Risk 2019, 10, 519–543. [Google Scholar] [CrossRef]
- Valipour, M. Calibration of mass transfer-based models to predict reference crop evapotranspiration. Appl. Water Sci. 2017, 7, 625–635. [Google Scholar] [CrossRef] [Green Version]
- Irwin, K.; Braun, A.; Fotopoulos, G.; Roth, A.; Wessel, B. Assessing Single-Polarization and Dual-Polarization TerraSAR-X Data for Surface Water Monitoring. Remote Sens. 2018, 10, 949. [Google Scholar] [CrossRef] [Green Version]
- Scott, K.A.; Xu, L.; Pour, H.K. Retrieval of ice/water observations from synthetic aperture radar imagery for use in lake ice data assimilation. J. Great Lakes Res. 2020, 46, 1521–1532. [Google Scholar] [CrossRef]
- Vickers, H.; Malnes, E.; Høgda, K.-A. Long-Term Water Surface Area Monitoring and Derived Water Level Using Synthetic Aperture Radar (SAR) at Altevatn, a Medium-Sized Arctic Lake. Remote Sens. 2019, 11, 2780. [Google Scholar] [CrossRef]
- Zhang, H.; Zhang, Y.; Lin, H. A comparison study of impervious surfaces estimation using optical and SAR remote sensing images. Int. J. Appl. Earth Obs. Geoinf. 2012, 18, 148–156. [Google Scholar] [CrossRef]


| Lake | SAR Images Available | Water Masks Analysed | |||||||
|---|---|---|---|---|---|---|---|---|---|
| DVV 2014/10/15–2021/01/29 | AVV 2014/10/06–2021/01/20 | DVH 2016/02/07–2021/01/29 | AVH 2017/05/17–2021/01/20 | Total | CART | RF | SVM | Total | |
| Burlan | 153 | 137 | 123 | 104 | 517 | 517 | 517 | 517 | 1551 |
| Pomacochas | 153 | 137 | 123 | 104 | 517 | 517 | 517 | 517 | 1551 |
| Total | 1034 | 3102 | |||||||
| Classifier | Geometric Attribute | Burlan Lake | Pomacochas Lake | |||||||
|---|---|---|---|---|---|---|---|---|---|---|
| AVH | AVV | DVH | DVV | AVH | AVV | DVH | DVV | |||
| Classification and regression tree(CART) | Area (ha) | Minimum | 38.6 | 39 | 39.2 | 40.9 | 414 | 417.8 | 408.3 | 415.6 |
| Maximum | 45 | 48 | 48.1 | 50.2 | 441.4 | 455.8 | 430.1 | 452.2 | ||
| Average | 42.1 | 43.3 | 43 | 44.9 | 426.8 | 434.8 | 419.3 | 431.4 | ||
| Perimeter (km) | Minimum | 3.31 | 3.34 | 3.36 | 3.42 | 11.06 | 10.94 | 10.9 | 10.89 | |
| Maximum | 3.72 | 4.8 | 4.46 | 4.72 | 17.59 | 20.06 | 13.54 | 17.26 | ||
| Average | 3.46 | 3.67 | 3.55 | 3.93 | 14.16 | 16.52 | 11.36 | 13.03 | ||
| Random Forest(RF) | Area (ha) | Minimum | 39.3 | 40 | 40.3 | 41.1 | 416 | 416.2 | 414.8 | 415.6 |
| Maximum | 45.6 | 48 | 47.6 | 49.3 | 441.4 | 455.8 | 426.5 | 456.5 | ||
| Average | 42.2 | 43.3 | 43 | 44.8 | 427.2 | 435.1 | 419.7 | 431.3 | ||
| Perimeter (km) | Minimum | 3.33 | 3.37 | 3.36 | 3.43 | 11.06 | 10.92 | 10.92 | 10.89 | |
| Maximum | 3.67 | 4.8 | 4.12 | 4.72 | 17.79 | 19.79 | 13.2 | 18.52 | ||
| Average | 3.46 | 3.68 | 3.54 | 3.91 | 14.2 | 16.59 | 11.38 | 13.02 | ||
| Support Vector Machine(SVM) | Area (ha) | Minimum | 38.9 | 39 | 39.2 | 39.8 | 409.2 | 405.4 | 405.5 | 405.4 |
| Maximum | 47.7 | 49.2 | 48.3 | 53 | 466.8 | 470.8 | 450.6 | 458 | ||
| Average | 42.1 | 42.8 | 43 | 44.9 | 430.5 | 433.5 | 420.1 | 434.3 | ||
| Perimeter (km) | Minimum | 3.33 | 3.34 | 3.36 | 3.37 | 11.14 | 10.87 | 10.88 | 10.8 | |
| Maximum | 4.81 | 5.73 | 4.72 | 5.05 | 20.52 | 20.58 | 19.17 | 19.92 | ||
| Average | 3.55 | 3.66 | 3.57 | 3.95 | 14.72 | 16.43 | 11.65 | 13.86 | ||
| SLR | PR | SVR | DTR | RFR | ||
|---|---|---|---|---|---|---|
| Burlan Lake | Area | 42.46 | 42.3 | 42.43 | 45.2 | 44.47 |
| R2 | 0.12 | 0.15 | 0.22 | 0.37 | 0.46 | |
| Combination | DVH | DVH | DVH | AVV | AVV | |
| Perimeter | 3.43 | 3.41 | 3.41 | 3.43 | 3.82 | |
| R2 | 0.15 | 0.2 | 0.29 | 0.23 | 0.43 | |
| Combination | AVH | AVH | DVH | DVV | DVV | |
| Pomacochas Lake | Area | 417.8 | 408 | 411.42 | 414 | 413.1 |
| R2 | -0.004 | 0.38 | 0.41 | 0.13 | 0.15 | |
| Combination | DVH | DVH | DVH | DVH | DVH | |
| Perimeter | 13.28 | 16.5 | 15.14 | 17.1 | 17.46 | |
| R2 | 0.095 | 0.24 | 0.42 | 0.16 | 0.26 | |
| Combination | DVV | AVV | AVH | AVV | AVV |
| SAR Image | Best Regressionmethod | ∆% | RPAS | |||||||||||||
|---|---|---|---|---|---|---|---|---|---|---|---|---|---|---|---|---|
| DVV | DVH | |||||||||||||||
| CART | ∆% | RF | ∆% | SVM | ∆% | CART | ∆% | RF | ∆% | SVM | ∆% | |||||
| Burlan lake | A | 43.53 | −3.27 | 42.89 | −4.69 | 43.42 | −3.51 | 42.46 | −5.64 | 42.48 | −5.60 | 42.48 | −5.60 | 44.47 | −1.18 | 45.63 |
| P | 3.4 | −17.68 | 3.3 | −20.10 | 3.38 | −18.16 | 2.87 | −30.51 | 2.87 | −30.51 | 2.87 | −30.51 | 3.82 | −7.51 | 4.13 | |
| Pomacochas lake | A | 434.89 | 1.35 | 430.77 | 0.39 | 437.18 | 1.89 | 420.57 | −1.99 | 420.57 | −1.99 | 414.23 | −3.46 | 411.89 | −4.01 | 429.09 |
| P | 12.21 | 23.46 | 11.13 | 12.54 | 13.03 | 31.75 | 9.51 | −3.84 | 9.49 | −4.04 | 9.14 | −7.58 | 17.46 | 76.54 | 9.89 | |
Publisher’s Note: MDPI stays neutral with regard to jurisdictional claims in published maps and institutional affiliations. |
© 2022 by the authors. Licensee MDPI, Basel, Switzerland. This article is an open access article distributed under the terms and conditions of the Creative Commons Attribution (CC BY) license (https://creativecommons.org/licenses/by/4.0/).
Share and Cite
Gómez Fernández, D.; Salas López, R.; Rojas Briceño, N.B.; Silva López, J.O.; Oliva, M. Dynamics of the Burlan and Pomacochas Lakes Using SAR Data in GEE, Machine Learning Classifiers, and Regression Methods. ISPRS Int. J. Geo-Inf. 2022, 11, 534. https://doi.org/10.3390/ijgi11110534
Gómez Fernández D, Salas López R, Rojas Briceño NB, Silva López JO, Oliva M. Dynamics of the Burlan and Pomacochas Lakes Using SAR Data in GEE, Machine Learning Classifiers, and Regression Methods. ISPRS International Journal of Geo-Information. 2022; 11(11):534. https://doi.org/10.3390/ijgi11110534
Chicago/Turabian StyleGómez Fernández, Darwin, Rolando Salas López, Nilton B. Rojas Briceño, Jhonsy O. Silva López, and Manuel Oliva. 2022. "Dynamics of the Burlan and Pomacochas Lakes Using SAR Data in GEE, Machine Learning Classifiers, and Regression Methods" ISPRS International Journal of Geo-Information 11, no. 11: 534. https://doi.org/10.3390/ijgi11110534
APA StyleGómez Fernández, D., Salas López, R., Rojas Briceño, N. B., Silva López, J. O., & Oliva, M. (2022). Dynamics of the Burlan and Pomacochas Lakes Using SAR Data in GEE, Machine Learning Classifiers, and Regression Methods. ISPRS International Journal of Geo-Information, 11(11), 534. https://doi.org/10.3390/ijgi11110534