Abstract
Place types are often used to query places or retrieve data in gazetteers. Existing gazetteers do not use the same place type classification schemes, and the various typing schemes can cause difficulties in data alignment and matching. Different place types may share some level of similarities. However, previous studies have paid little attention to the place type similarities. This study proposes an analytical approach to measuring similarities between place types in multiple typing schemes based on functional signatures extracted from web-harvested place descriptions. In this study, a functional signature consists of three component signature factors: place affordance, events, and key-descriptors. The proposed approach has been tested in a case study using Twitter data. The case study finds high similarity scores between some pairs of types and summarizes the situations when high similarities could occur. The research makes two innovative contributions: First, it proposes a new analytical approach to measuring place type similarities. Second, it demonstrates the potential and benefits of using location-based social media data to better understand places.
1. Introduction
In gazetteers, place type is a crucial element used to search for places (e.g., schools in Clarke County, GA). The place type scheme used in a gazetteer refers to the classification system of places. However, different schemes exist across gazetteers, which causes challenges in aligning gazetteers at both the structural and semantic levels. Place classifications are used to describe places in different contexts such as nature or urban spaces (e.g., mountains, streams, and population-centric places such as cities). Place classifications are notably different between studies of nature and urban environments. However, the definitions of place categories are often ambiguous within urban environments, because uses vary for places according to the needs of people. Therefore, this study proposes an approach to measuring the similarity between place classifications based on functional signatures extracted from web-harvested place descriptions. In this study, functional signatures are related to people’s activities in terms of three factors: place affordances, events, and key-descriptors. The proposed approach was tested through a case study by matching place types used by local gazetteers using Twitter data.
Place categories in gazetteers are typically not standardized. They are inherently disarranged and continually evolving according to user needs [1,2]. The Geographic Names Information System (GNIS) and GeoNames are excellent examples of how one typing scheme system is adopted from another. Both the GNIS and GeoNames adopted the place classifications developed by the United States National Geospatial-Intelligence Agency (NGA), which contains a variety of place types for place names across the world. However, GNIS was developed only for US domestic place names, resulting in fewer place types at a simple level than the NGA. GeoNames includes place names from various countries using a variety of data sources. Accordingly, GeoNames adopted a basic place classification model from the NGA and introduced some additional classifications.
Another example of a place type scheme includes a feature type thesaurus (FTT), which was developed for the Alexandria Digital Library (ADL) Gazetteer [3]. The FTT contains place types at multiple levels of a hierarchy, which is markedly different from the previous examples in terms of data and structure. Non-traditional data sources such as Google Places provide place categories that focus more on urbanized areas such as supermarkets, restaurants, car dealerships, and real estate agencies. This is because the purpose of Google Places is to provide users with information about local businesses, and it uses collaborative knowledge gathered from users about places. Considering the different purposes of data sources, it might be difficult to establish a single scheme of place categories for all gazetteers. However, the similarity between place types in the same or different schemes can be measured to enrich current gazetteers by comparing thematic attributes extracted from web-harvested place descriptions.
The matching between place types should be built on thematic similarity, considering its original perspective. However, not every concept used in each system is clearly comparable among different gazetteers based on uniform categories. For example, point of interest (POI), a popular place type used in gazetteers, is ambiguous in terms of its definition and functionality. Any place entity can be classified as both a POI and another place type. Likewise, places can be referred to by multiple place types. For example, the Georgia Museum of Art is categorized as “Building” in the GNIS but grouped under “Museum” in Google Places. These examples illustrate that each place category does not reflect all the properties of a place. More importantly, some place types share similar properties.
In general, place types could relate to each other in various ways based on perspective. For example, some place types are related to each other based on their spatial relationship, which is rarely described in existing gazetteers (e.g., spatially, a university contains several buildings). In addition, taxonomies with an “is–a” relation are widely used in different typing schemes. Thus, if a place is categorized at a lower level, that place is also considered an instance of the upper level of the classifications. For example, “Building” is a parent concept of “Courthouse” in the FTT; thus, place entities classified as Courthouse are also classified as Building in the gazetteer system. On the other hand, Building and Courthouse are defined at the same level of the typing scheme used by GeoNames, which means they have separate data sets for each place type. Consequently, different schemes of taxonomies used for place classification may cause less consistent search results between gazetteers. The approach suggested in this article can be used to assess similarities between place types regardless of the hierarchies used by different data sources, such as traditional and non-traditional place databases.
This research contributes to the discourse on digital gazetteers and geographic information retrieval (GIR) by comparing place types using thematic similarities. Descriptions of places online were used to extract people’s activities, which can be specified by three factors to describe each place type: (1) place affordances, (2) events, and (3) key-descriptors. This approach includes natural language processing (NLP) [4], latent Dirichlet allocation (LDA) topic modeling [5], and cosine similarity measurement. The three factors were then combined to determine the overall similarity scores for the comparison between place types.
This study utilized Twitter data from a pilot study area, namely Athens, Georgia. However, the proposed approach can be applied to any user-generated content, such as blogs and articles that describe places. The findings with high similarity scores can be summarized into three cases:
- Place types representing population-centric places such as administrative regions and classified as Populated Place;
- Place types describing the relation of spatial containment such as POI and Populated Place;
- Place types used for similar activities such as weekend activities and relaxing such as Park and Stream.
Using only the overall similarity score is insufficient to align different place classifications because of the biased data source (e.g., user groups and topic frequency). However, the observations from the case study show the possible relations between place classifications by using people’s knowledge of places that can be added to the existing gazetteer alignment strategy.
The remainder of this article is organized as follows: Section 2 provides an overview of the related works. Section 3 introduces the proposed functional signature conceptual framework and the computational flowchart to assess place type similarities, followed by a case study using the proposed approach in Section 4. The article concludes with a summary and a discussion of future research directions in Section 5.
2. Related Work
Digital gazetteers are dictionaries of place names that are widely used in GIR [6]. In gazetteers, places are identified based on several attributes, such as given names, classifications, and spatial footprints [7]. Among place references used in gazetteers, a list of place classifications such as parks, streams, neighborhoods, and libraries are often labeled by creators. Such place classifications could be relatively subjective in describing places, incorporating human cognition and language [8]. Moreover, these schemes are constantly evolving based on needs [1,2].
For example, illustrating a hierarchical scheme of place classifications, Hill [3] proposed an FTT developed in the ADL project. Subsequently, some studies have applied the FTT as a place type classification scheme for developing their place type categories. To improve gazetteer interoperability and reasoning capability based on feature typing, Janowicz and Keßler [2] proposed a feature-type ontology by utilizing the FTT scheme. The authors demonstrated that a feature-type ontology supports extended query functionality, which addresses the relationships between feature types.
There are other classification systems with specific objectives such as the North American Industry Classification System (NAICS). The NAICS was developed to identify business establishments by federal agencies with the aims of archiving and analyzing data. Thus, it could be essential to analyze specific types of places in urban areas [9]. In addition, place typing schemes used in location-based social media applications, such as Foursquare and Yelp, are also widely used in POIs studies [10,11,12]. However, there is insufficient information about the functional relatedness of those different place types used in the same or across different schemes.
Martins, Manguinhas, and Borbinha [13] proposed a geo-temporal gazetteer web service established in the DIGMAP project for integrating data from multiple sources, such as gazetteers of official toponymic authorities or general online sources with gazetteer data. In terms of the scheme of place classifications, the authors utilized the FTT with the classification schemes from the ECAI Time Period Directory and GeoNames to facilitate data integration from external sources.
Using the instance matching approach, Brauner, Casanova, and Milidiú [14] proposed an instance-based mapping rate between distinct feature type thesauri by pre-processing common instances from two gazetteers, namely the GEOnet Names Server and the ADL Gazetteer. Several examples show that mapping different typing schemes are essential to enhancing the capability of answering queries about place information using multiple gazetteers.
Place is an abstract concept and is difficult to describe or define comprehensively and objectively [15,16,17]. There are many attempts to understand places by using place names and semantics, which are limited to an unsophisticated view of place. Papadakis et al. [18] proposed a composite approach of formalizing places to facilitate a function-based query. Their approach enables a better representation of the context that people assign to a place based on the place functionality. Our approach examines human interactions associated with different place types by focusing on people’s activities. Therefore, we reviewed a few studies focused on the thematic perspective of places, which were used to define relationships between places based on shared common themes [19]. For example, Adams [20] proposed an approach to search places based on extracted thematic topics (e.g., civil war) from web documents using LDA-based approaches.
Other research focused on historical records of places. Exploring narrative documents to detect historical events and places (e.g., 7 January 1859, in Wakulla County, Florida, as the day when the offices of Tax Assessor and Collector and Sheriff were combined) was studied as part of the Perseus Digital Library Project [21]. In addition, Mostern and Johnson [22] proposed an approach to construct a historical event gazetteer using named places and historical events and visualized the links between such events and spatial changes. Therefore, a thematic perspective of places is often used to explore similar places either alone or in combination with spatial and temporal perspectives.
While traditional gazetteers created by authorities typically describe places using a formalized set of semantics, place descriptions with regard to named places made by the general public reflect more varied aspects. A few examples of approaches that utilize place descriptions from web resources for exploring place semantics are discussed next. Purves, Edwardes, and Wood [23] proposed a framework for gathering large collections of place descriptions from two different online communities named Geograph and Flickr. The authors addressed the fact that descriptions of places collected from different environments may vary in terms of sharing spatially referenced photographs with the associated content.
Kim, Vasardani, and Winter [24] addressed the ways in which place descriptions convey human spatial knowledge beyond geographical information systems. Therefore, the same place could be described in multiple ways based on multiple place perspectives. The authors proposed a graph-based matching method for integrating spatial information extracted from various descriptions by using string, linguistic, and spatial similarities. The approaches relied on spatial semantics matching with other types of similarity to find corresponding places. Our approach for matching place categories combines place affordances and event and key-descriptor similarities. Because the proposed method focuses on people’s descriptions of their experiences in different places, the similarity of spatial relations was not used in our matching process but was described in the results of applying the approach.
3. Methods
3.1. The Conceptual Framework
The research proposes to assess the similarity between two place types based on the designed functional signature. The concept of signature has been widely used in the literature. For research on places, the concepts of spatial, temporal, and thematic signatures have been developed and applied to capture spatial, temporal, and non-spatiotemporal characteristics of places and often used to classify places into place types [20,25,26]. In this research, the concept of functional signature is proposed to capture unique functional characteristics of a place type. As shown in Figure 1, the functional signature consists of three component signature factors, including the Place Affordance, Events, and Key-descriptors. Following the original definition of affordance, which is about opportunities that an environment has to offer [27], the concept in platial research is also approached from the individual perspective, and it is associated with the relationship between places and the action capabilities of individuals [27,28]. Subscribing to this tradition, the place affordance of a place type in this study is represented by human activities at places of the type. The second component factor, Events, refers to the set of events that have taken place at places of the respective place type. In comparison, Place Affordance captures the functional characteristic of a place type from the perspective of individuals who participate activities at respective places, while Events captures the functional characteristics from the perspectives of planners and practitioners who organize activities at respective places. They are not mutually exclusive but extract characteristics from different perspectives. Some factors may contribute to both Place affordance and Events. For example, in the case of “Party”, it is part of Events characteristic when it comes to Party as a specific event being held at a particular place and time. It would be a Place affordance factor while it refers to an activity such as going out to a gathering, drinking, talking, etc. The third component factor, Key-descriptors of a place type, refers to the major terms that are frequently mentioned by people to describe the type of places. Examples are School, Food, Downtown, Park, Garden, etc. Each of the three signature characteristics is presented as a vector. Quantitative definitions of the signature characteristics and examples are presented below:
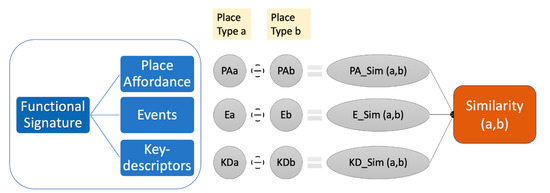
Figure 1.
The conceptual framework for assessing similarity between two place types.
- Place affordance—Major types of human activities at places of the respective place type. It can be expressed by a list of activities {A1, … Ai, …, An} where each Ai a type of activity. An example of Place Affordance for the place type Restaurant is {Eating, Drinking, Party, Entertainment, Music activity}.
- Events—Major types of events organized at places of the respective place type. It can be expressed by a list of activities {E1, … Ei, …, En} where each Ei a type of event. An example of Events for the place type Restaurant is {Anniversary, Party, …}.
- Key-descriptors—Major descriptive terms that characterize the nature of places of the respective place type. Key-descriptors extracted from place descriptions may include more detailed type descriptions (e.g., burger places) than the categories used in gazetteers, and it may also include descriptions other than categories (e.g., downtown). The key-descriptors of a place type can be expressed with a list of key terms {K1, … Ki, …, Kn}. An example might be {City, Downtown, Building, Garden, Landmark}.
Figure 1 illustrates the framework of the research design. For any two place types a and b, the three component signatures for each type are extracted from real-world data, for instance, the social media data. Then signatures of the pair of place types are compared to estimate the similarity between them from the perspective of each component. Finally, the three similarities from the component factors are summarized to give the final similarity measure between the two place types. Technical details of the workflow to achieve these objectives are explained in Section 3.2.
Apparently, the signature for a place type might vary by study areas and by data sources. It is also sensitive to the sample places chosen to represent the place type. The situation is similar to what happens when studying relationships with a statistical method. A study can choose to construct local models or a global model, and the resulting model(s) can be sensitive to the sampling strategies for data collection.
3.2. The Computational Workflow
Figure 2 shows the data and processing workflow to assess the similarity between any two place types. The assumption is that place descriptions from social media data or other web documents can reflect the actual uses of those places. Twitter data are used in the pilot study. A keyword-based extraction process is needed for indexing and classifying relevant words in the texts. The keywords are a set of place names for each place type. Then a natural language processing (NLP) technique is used to pre-process the harvested place descriptions and generate a document for each place type. Technical details of this process have been introduced in previous studies [4]. A collection of place descriptions for each place type is seen as a document, , where the document consists of place descriptions containing the contents of place names for the place type.
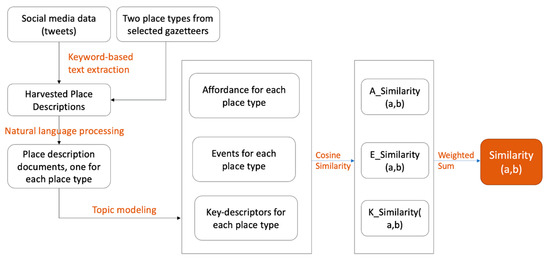
Figure 2.
The overall research design for assessing place type similarities.
In the second step, the LDA topic modeling is applied to identify the three component factors of the functional signature. LDA is a generative probabilistic model to automatically derive sets of words from a document to form latent topics. Please refer to [5] for details of the model. The input of the topic modeling model is the document for a specific place type. The document has a collection of descriptions for all places in the place type. It is represented as a mixture of latent topics in a topic model, where each topic is characterized by a set of words. LDA is conditioned on three parameters: document–topic distribution , topic–word distribution , and topic number . For a data set of tweets, the parameters are typically set as , , and and multiple parameters were tested to see if the results showed any difference. The topic coherence score can be used to determine the quality of the learned topics that are automatically generated by the model. For each document , topics were labeled for the three factors: place affordances, events, and key-descriptors by the authors based on the model results (i.e., the estimated word distribution).
In the last step, a similarity score is calculated for each of the three component factors using the cosine similarity expressed in Equation (1). The cosine similarity is a vector comparison measure widely used in information retrieval, NLP, and text mining [29,30].
In Equation (1), a and b are two n-dimensional vectors to be compared; and are components of vectors , respectively. The output similarity measure is a value between 0 and 1. A higher value means higher similarity between and . The similarity measure is calculated for place affordances, events, and key-descriptors independently to determine the degree of similarity for each functional signature component. The final similarity is obtained as a weighted sum of the three component similarity measures. This is expressed in Equation (2), where is the final similarity score; , , and are three component similarity scores; and , , and are three respective weights that are customizable based on context-contingent considerations. In the case study, for example, equal weights are taken, which means the three weights are one-third each.
4. Case Study
Study Area and Data
A pilot study using the proposed approach was conducted for Clarke County in Athens, Georgia, which is a university town to the east of Atlanta. Figure 3 shows the location of this county in the state of Georgia, USA.
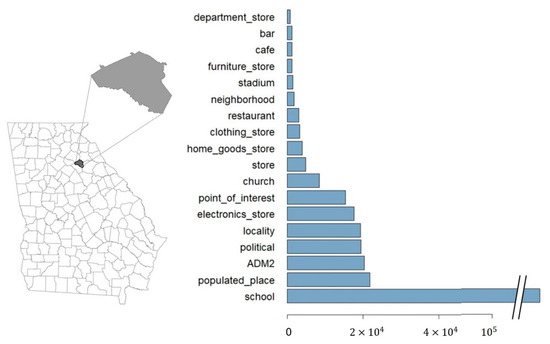
Figure 3.
The number of tweets collected for each place type in the target study area (Athens, GA, USA, on the left-hand side).
The place types are drawn from typing classifications from three gazetteers, GNIS, GeoNames, and Google Places. The GNIS, developed by the USGS, is the official repository of US domestic geographical name data. The GNIS applies the second level of classifications created by the NGA. GeoNames is a global geographic database that includes over 11 million place names worldwide. Google Places’ service provides a place-searching capability with a list of place categories and detailed information about a specific location. Place types used in Google Places include various types of business, such as clothing stores and home goods stores, which are not covered by the other two gazetteers. For the current study, these store data sets were combined under “Business” to collect sufficient relevant Twitter data for the analysis. In addition, the locality and postal code of the area were combined under “Region” for the same reason. As noted, specific types combined under Business and Region had a finer level of categories than others.
Many place types have shared meanings in different sources. However, a place could be referenced with different categories by various creators. For example, the Athens Regional Library is categorized as Building in the GNIS but as Library in GeoNames. Thus, a place may appear in multiple place types that are similar to some degree. Table 1 summarizes the statistical characteristics of the place categories in the study area using the three gazetteers.

Table 1.
Summary of statistical features of place categories in Athens, GA, USA.
The total number of places per place type may vary, partly due to actual differences and partly because places were classified differently in various gazetteers. Spatial patterns were identified based on the minimum and maximum distances between the places for each place type, along with its standard deviation. The entropy was calculated to measure the spatial relations between place categories. The entropy of the place type is defined in Equation (3):
where is the total number of place types in the area and is the number of nearest instances from the place type [25]. A larger entropy value indicates a greater variety of places around the target place type.
Twitter data were used as the source of place descriptions for this case study. The data set was collected using the bounding box of the target study area between December 2017 and January 2019. The Twitter data collected were then filtered to identify texts that described places only. Place names were collected from the three gazetteers (i.e., GNIS, GeoNames, and Google Places) by place type and used as a set of keywords to extract tweets. This dissertation assumed that the combined texts categorized by place type contained several topics that could be used as place type references. Therefore, the data sets were processed using a topic-modeling method to identify three factors (i.e., place affordances, events, and key-descriptors) based on the calculated similarity scores. Figure 3 shows the numbers of texts collected in the study area for a sample of place types. Athens is a college town in the USA, so many tweets describe topics related to the place type “School”.
5. Results
It was assumed that some properties were shared between place types based on people’s activities that can be used to measure similarities between place types. Place types identified by more than 50 relevant tweets in the study area were included for the analysis. In total, 91 place types were detected in more than one tweet. Among them, 14 place types had enough tweets and were selected for the similarity measurement.
The parameters used in the LDA model were determined through theoretical fitting. The final sets can generally describe actual states of the dataset. For example, the number of key terms and topics were tested with a larger number until the model generates unsuitable word sets using the collected data. Using LDA, the top 20 key terms for 50 topics were calculated for 14 place categories. LDA was performed for 2000 iterations using the Gibbs sampling algorithm for each data set. Then latent topics were manually labeled for the three factors: place affordances, events, and key-descriptors. Table 2 shows the similar textual patterns in topics identified for two different place types: ADM2 (second-order administrative division) and Stadium. Some place categories were described by specific features. For example, schools were frequently mentioned with building names, school activities, and sports events. Streams were often mentioned with other place types, such as rivers, creeks, dams, and parks.
Table 2.
Examples of word sets forming topics for the place categories ADM2 and Stadium.
Similarity measurement between place types necessitated a comprehensive understanding of people’s activities, considering the three factors simultaneously. For instance, topics related to football games frequently appeared and formed a large proportion of the Twitter data in the study area. This resulted in an increase in associated activities and key-descriptors used for football games for a specific time period. A full list of three factors extracted from Twitter data in the study area is described in Table 3.
Table 3.
Candidate elements in the component functional signatures (identified from Twitter data).
Similarity scores between place types were measured using cosine similarity. First, cosine similarity was calculated for each of the three factors: place affordances, events, and key-descriptors. Figure 4 shows the low-to-high similarity scores among the place types for each factor. The similarity scores for the events factor tend to have higher values than the other two factors, because the total number of events identified from the Twitter data was small. Subsequently, the overall similarity scores were calculated using Equation (2). Table 4 shows the overall similarity scores between place types with individual scores based on the three factors.
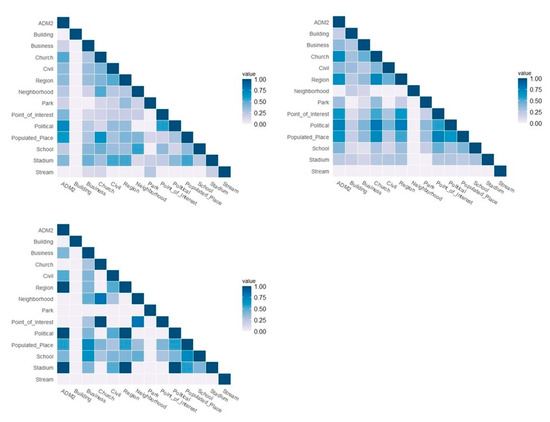
Figure 4.
Cosine similarities between place categories by individual factors: place affordances (top left), key-descriptors (top right), and events (bottom).
Table 4.
Overall similarity scores for distinct place categories, with the individual similarity scores for three factors.
Interpretation and Discussions
The results for the three factors (i.e., place affordances, events, and key-descriptors) reveal the characteristics of the study area, and these can be expanded for other case study areas in future studies. Place affordances included different kinds of activity, such as economic, social, fun, and service activities. Among 37 place affordances for 14 place types, “hiring”, “weather reporting”, and “game activity” frequently appeared for different types of place. Figure 5 shows the number of place types for which a specific kind of activity appeared. For example, hiring might not be a common place reference in existing place-name databases. However, place types for hiring activities revealed the places where hiring activities took place. Therefore, places were categorized for hiring and linked to associated information.
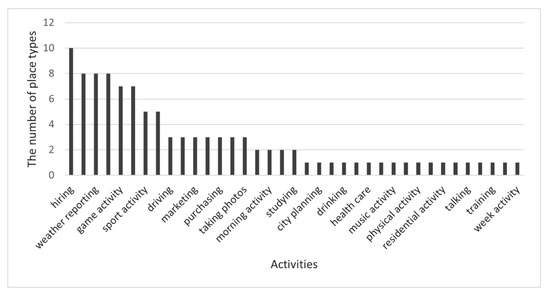
Figure 5.
Multiplicity of place types vs. activity types.
The kinds of events extracted from Twitter data in the study include sport, social, and political events. Figure 6 displays the number of place types where each kind of events took place. Because football games are of the most significant interest to students and locals, the SEC Championship and Rose Bowl frequently appeared for different place types. However, these topics are not only related to places where football players play games, such as a stadium, but also related to places where people watch games, experience tailgating, or associate them with the name of an administrative region (e.g., a football game in Athens). Therefore, the event concept could be used to find place names and associated information either independently or together with other place-related concepts (e.g., to find place names using place type and event instances).
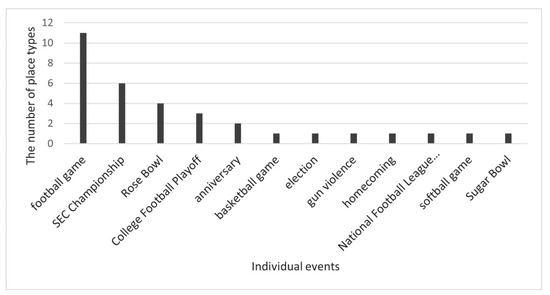
Figure 6.
Multiplicity of place types vs. event types.
Key-descriptors extracted for different place types included specific types of business that might be grouped into other place types in existing place-name databases (e.g., waffle place into restaurants). Key-descriptors were discovered mainly from places that have relatively large areas. First, places that have several buildings or facilities are good examples (e.g., schools). Secondly, administrative regions are usually referenced for any places in that area. Finally, when man-made features exist near natural environments, they are frequently mentioned together (e.g., dam and river). Therefore, place types that co-appeared more frequently together were more related to each other.
It is evident that the highest similarity scores were found between population-centric place classifications, such as ADM2, Political, Region, and Populated Place. In addition, based on people’s activities extracted from the Twitter data, patterns were discovered between two place categories based on the spatial containment relationship, such as Church and Populated Place, and two distinct place categories, such as Business and School.
- (1)
- High similarity between place groups of population-centric places
The highest similarity scores were observed between pairs of population-centric place types, such as ADM2, Political, Region, Populated Place, and Civil. Although the concepts and definitions are all different, they provide similar functionality with slightly different ranges of application. For example, Clarke County is an instance of AMD2 and Civil in GeoNames and the GNIS gazetteer, respectively. In these two gazetteers, Civil includes a broad range of administrative divisions such as a borough, county, incorporated place, and township. AMD2 covers the second level of administrative division, which is a county-level unit in the US. The definition of Political used in Google Places is not provided, but it also covers county, city, and so forth. The number of instances of these five different concepts included in the three gazetteers (i.e., GNIS, GeoNames, and Google Places) are listed in Table 5.
Table 5.
The number of instances for selected place categories in Athens, GA, USA.
These similarity patterns can be used in addition to existing alignment methods for place classification based on the highest similarity scores among population-centric place types calculated using people’s activities extracted from Twitter data. The proposed approach for matching different place categories alone may result in lower discriminatory power. However, our approach was not influenced by other alignment techniques for place types that use spatial signatures [25] or an instance-based matching approach [14]. Instead, it reveals thematic patterns and people’s daily use of places.
- (2)
- High similarity between place types with spatial containment, is–a, and part–of relationships
In the place descriptions that people create, they tend to refer to the place within the larger area unit (e.g., the University of Georgia in Athens). This pattern is well described in the similarity scores among some place types and population-centric place types. The typing schemes used in the three gazetteers (i.e., GNIS, GeoNames, and Google Places) do not describe the relation of spatial containment between the types. The limited information on semantics for place classification results in significant challenges for developing ontologies. High similarity scores among place types that show spatial containment relations could be helpful in constructing place type ontologies. Examples include high similarity scores between Populated Place and Church.
Other examples include place types, such as POI or Building, that have some levels of ambiguity in the definitions. These place categories possibly share some instances with other place types within the same or across gazetteers. For example, POI may include any place that people may consider interesting. It could be residential areas, schools, parks, restaurants, and churches. Thus, high similarity scores found between POI and other place types such as Populated Place and School is expected. Figure 7 illustrates the distribution of places of three place types, POI, Populated Place, and School in the study area. The individual places of these three place types are relatively close in terms of distances and have significant overlapping positions.
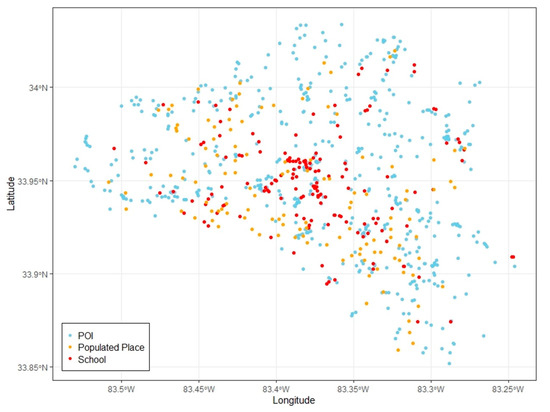
Figure 7.
Distribution of POI, Populated Place, and School locations in Athens, GA.
Building is another example that shares common properties with other place types. In the GNIS and GeoNames, Building describes a distinct place type, not including other types such as Church, Hospital, or School. However, buildings are individual structures that can be a part of other place types. For instance, Georgia Center, which was built as a multi-purpose construction serving as a hotel and a conference center, is classified under Building in the gazetteers but is, in fact, also part of a university (place type School). Therefore, individual buildings are often described with other place types (key-descriptors) in people’s descriptions of these places on social media.
- (3)
- High similarity between two distinct place type groups
Although some place types are not strongly related spatially, high similarity scores were identified between those place types according to the three factors based on people’s activities. For example, churches and neighborhoods in the study area are not close neighbors (Figure 8). However, Church and Neighborhood are frequently referred to in similar types of activities such as sport, tours, and weekend activities in the local area. Another example is the high similarity score identified between Business and School. These two types share many everyday activities such as entertainment, sport, political activities, and service activities. Key-descriptors were also observed for place types, such as gardens and schools. High similarity scores between two distinct place type groups, which are spatially separated from each other, show that they are meaningful in human behaviors and place uses. However, this case is not sufficient for direct use in gazetteer alignment processing because of the lack of spatial semantics. However, it can be used to search place names based on similar activities (functional signature) in local gazetteers. This study highlights that there are pairs of place types that share common activities.
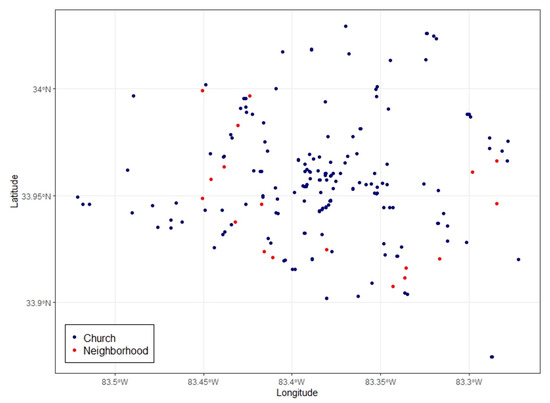
Figure 8.
Distribution of Church and Neighborhood locations in Athens, GA.
Finally, the results allow us to compare different place types across gazetteers or search local gazetteers based on people’s activities. A preliminary mapping based on the case study is illustrated in Figure 9.
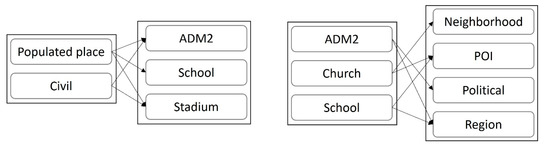
Figure 9.
Place types matching between GNIS and GeoNames (left) and GeoNames and Google Places (right) based on the thematic characteristics.
6. Conclusions
Our approach proposes a similarity measurement among place types using place descriptions created by people. The similarity scores can be calculated for three factors: place affordances, events, and key-descriptors. The three respective values are combined to obtain the overall similarity score among place types. Such a bottom–up approach using descriptions from social media data and other user-generated content is advantageous as it helps to capture the dynamic situations of how people utilize places. People’s experiences in places are not limited to the planned functions of places. People’s knowledge about places is shared through various channels, and it influences others in the way they interact with places. To demonstrate the proposed approach in a case study, we used Twitter data as a source of place descriptions because of its data availability and because Twitter has recently become the most popular social media platform for people to share their thoughts and activities. However, the proposed approach is generally applicable to other types of online sources.
The case study finds that similarity scores between place types do not show significant differences among the three factors. In other words, place types with a high similarity score based on place affordances usually also showed a high similarity score for events. However, place affordances were more related to daily activities, while events could be seasonal. We think that place affordances and key-descriptors observed for some place types could be affected by a special event in a specific timeframe (e.g., tailgating at a football game at the school). Thus, the overall similarity score is more powerful for comparing different place types than the three individual similarity measures. Overall, high similarity scores were identified among place types with overlapping functionalities, such as population-centric places, those representing spatial containment relations, or two distinct place type groups.
Compared to the existing methods for aligning place categories, our approach has a strong ability to explain the relations between place types based on people’s daily activities. The discovered functional factors and similarity scores help people to better understand part of the complex functionality of place types. Therefore, this study shows its great potential for the infusion of essential variables of place formalization for various fields such as urban planning, urban management, and location-based applications.
A major limitation of this study was the nature of the data source. Social media data are usually biased toward younger age groups and specific topics. Only place types with a sufficient amount of data could be analyzed to measure similarities. Thus, some place types may have been omitted due to sampling bias. Another existing limitation is that place types cannot be entirely quantified through the three factors, place affordance, events, and key-descriptors. There are other potential factors that can be taken into consideration such as human mobility [31,32], human dynamics, and human perceptions [33]. Future studies will focus on different typing scheme alignments using our results along with the existing matching strategies. Therefore, we aim to extend typing scheme ontologies to enrich gazetteers.
Author Contributions
Conceptualization, Doori Oh, Xiaobai A. Yao; Data curation, Doori Oh; Formal analysis, Doori Oh; Investigation, Doori Oh; Methodology, Doori Oh; Resources, Doori Oh; Supervision, Xiaobai A. Yao; Visualization, Doori Oh, Xiaobai A. Yao; Writing—original draft, Doori Oh, Xiaobai A. Yao; Writing—review & editing, Xiaobai A. Yao, Doori Oh All authors have read and agreed to the published version of the manuscript.
Funding
This research received no external funding.
Institutional Review Board Statement
Not applicable.
Informed Consent Statement
Not applicable.
Conflicts of Interest
The authors declare no conflict of interest.
References
- Hastings, J.T. Automated conflation of digital gazetteer data. Int. J. Geogr. Inf. Sci. 2008, 22, 1109–1127. [Google Scholar] [CrossRef]
- Janowicz, K.; Keßler, C. The role of ontology in improving gazetteer interaction. Int. J. Geogr. Inf. Sci. 2008, 22, 1129–1157. [Google Scholar] [CrossRef]
- Hill, L.L. Feature Type Thesaurus. Alexandria Digital Library Project. 2002. Available online: http://legacy.alexandria.ucsb.edu/gazetteer/FeatureTypes/FTT_metadata.htm (accessed on 10 June 2021).
- Abilhoa, W.D.; De Castro, L.N. A keyword extraction method from twitter messages represented as graphs. Appl. Math. Comput. 2014, 240, 308–325. [Google Scholar]
- Blei, D.M.; Ng, A.Y.; Jordan, M.I. Latent dirichlet allocation. J. Mach. Learn. Res. 2003, 3, 993–1022. [Google Scholar]
- Goodchild, M.F.; Hill, L.L. Introduction to digital gazetteer research. Int. J. Geogr. Inf. Sci. 2008, 22, 1039–1044. [Google Scholar] [CrossRef]
- Hill, L.L. Georeferencing: The Geographic Associations of Information; MIT Press: Cambridge, MA, USA, 2009. [Google Scholar]
- Mark, D.M.; Turk, A.G. Landscape categories in Yindjibarndi: Ontology, environment, and language. In International Conference on Spatial Information Theory; Springer: Berlin/Heidelberg, Germany, 2003; pp. 28–45. [Google Scholar]
- Jiang, S.; Alves, A.; Rodrigues, F.; Ferreira, J., Jr.; Pereira, F.C. Mining point-of-interest data from social networks for urban land use classification and disaggregation. Comput. Environ. Urban Syst. 2015, 53, 36–46. [Google Scholar] [CrossRef]
- Gao, S.; Janowicz, K.; Couclelis, H. Extracting urban functional regions from points of interest and human activities on location-based social networks. Trans. GIS 2017, 21, 446–467. [Google Scholar] [CrossRef]
- Liu, X.; Andris, C.; Rahimi, S. Place niche and its regional variability: Measuring spatial context patterns for points of interest with representation learning. Comput. Environ. Urban Syst. 2019, 75, 146–160. [Google Scholar] [CrossRef]
- Hao, P.-Y.; Cheang, W.-H.; Chiang, J.-H. Real-Time event embedding for POI recommendation. Neurocomputing 2019, 349, 1–11. [Google Scholar] [CrossRef]
- Martins, B.; Manguinhas, H.; Borbinha, J. Extracting and exploring the geo-temporal semantics of textual resources. In Proceedings of the 2008 IEEE International Conference on Semantic Computing, Santa Monica, CA, USA, 4–7 August 2008; pp. 1–9. [Google Scholar] [CrossRef]
- Brauner, D.F.; Casanova, M.A.; Milidiú, R.L. Towards Gazetteer Integration through an Instance-based Thesauri Mapping Approach. In Advances in Geoinformatics; Springer: Berlin/Heidelberg, Germany, 2007; pp. 235–245. [Google Scholar] [CrossRef]
- Goodchild, M.F. Formalizing Place in Geographic Information Systems. In Communities, Neighborhoods, and Health; Springer: New York, NY, USA, 2010; pp. 21–33. [Google Scholar] [CrossRef]
- Tuan, Y.F. Space and Place: The Perspective of Experience; University of Minnesota Press: Minneapolis, MN, USA, 1977. [Google Scholar]
- Winter, S.; Kuhn, W.; Krüger, A. Guest editorial: Does place have a place in geographic information science? Spat. Cogn. Comput. 2009, 9, 171–173. [Google Scholar] [CrossRef]
- Papadakis, E.; Resch, B.; Blaschke, T. Composition of place: Towards a compositional view of functional space. Cartogr. Geogr. Inf. Sci. 2019, 47, 28–45. [Google Scholar] [CrossRef]
- Adams, B.; Janowicz, K. Thematic signatures for cleansing and enriching place-related linked data. Int. J. Geogr. Inf. Sci. 2015, 29, 556–579. [Google Scholar] [CrossRef]
- Adams, B. Finding similar places using the observation-to-generalization place model. J. Geogr. Syst. 2015, 17, 137–156. [Google Scholar] [CrossRef]
- Smith, D.A. Detecting and browsing events in unstructured text. In Proceedings of the 25th Annual International ACM SIGIR Conference on Research and Development in Information Retrieval, Tampere, Finland, 11–15 August 2002; pp. 73–80. [Google Scholar]
- Mostern, R.; Johnson, I. From named place to naming event: Creating gazetteers for history. Int. J. Geogr. Inf. Sci. 2008, 22, 1091–1108. [Google Scholar] [CrossRef]
- Purves, R.; Edwardes, A.; Wood, J. Describing place through user generated content. First Monday 2011, 16. [Google Scholar] [CrossRef][Green Version]
- Kim, J.; Vasardani, M.; Winter, S. Similarity matching for integrating spatial information extracted from place descriptions. Int. J. Geogr. Inf. Sci. 2016, 31, 56–80. [Google Scholar] [CrossRef]
- Zhu, R.; Hu, Y.; Janowicz, K.; McKenzie, G. Spatial signatures for geographic feature types: Examining gazetteer ontologies using spatial statistics. Trans. GIS 2016, 20, 333–355. [Google Scholar] [CrossRef]
- McKenzie, G.; Janowicz, K.; Gao, S.; Gong, L. How where is when? On the regional variability and resolution of geosocial temporal signatures for points of interest. Comput. Environ. Urban. Syst. 2015, 54, 336–346. [Google Scholar] [CrossRef]
- Bornstein, M.H.; Gibson, J.J. The ecological approach to visual perception. J. Aesthet. Art Crit. 1980, 39, 203. [Google Scholar] [CrossRef]
- Raymond, C.M.; Kyttä, M.; Stedman, R. Sense of place, fast and slow: The potential contributions of affordance theory to sense of place. Front. Psychol. 2017, 8, 1674. [Google Scholar] [CrossRef]
- Li, B.; Han, L. Distance weighted cosine similarity measure for text classification. In International Conference on Intelligent Data Engineering and Automated Learning; Springer: Berlin/Heidelberg, Germany, 2013; pp. 611–618. [Google Scholar]
- Murphy, K.P. Machine Learning: A Probabilistic Perspective; MIT Press: Cambridge, MA, USA, 2012. [Google Scholar]
- McKenzie, G.; Romm, D. Measuring urban regional similarity through mobility signatures. Comput. Environ. Urban. Syst. 2021, 89, 101684. [Google Scholar] [CrossRef]
- Yuan, J.; Zheng, Y.; Xie, X. Discovering regions of different functions in a city using human mobility and POIs. In Proceedings of the 18th ACM SIGKDD International Conference on Knowledge Discovery and Data Mining, Beijing, China, 12–16 August 2012; pp. 186–194. [Google Scholar]
- Kang, Y.; Zhang, F.; Gao, S.; Peng, W.; Ratti, C. Human settlement value assessment from a place perspective: Considering human dynamics and perceptions in house price modeling. Cities 2021, 118, 103333. [Google Scholar] [CrossRef]
Publisher’s Note: MDPI stays neutral with regard to jurisdictional claims in published maps and institutional affiliations. |
© 2021 by the authors. Licensee MDPI, Basel, Switzerland. This article is an open access article distributed under the terms and conditions of the Creative Commons Attribution (CC BY) license (https://creativecommons.org/licenses/by/4.0/).