Abstract
This paper presents the kinematic and static analysis of two mechanisms to improve power throughput for persons with tetra- or paraplegia pedaling a performance tricycle via FES. FES, or functional electrical stimulation, activates muscles by passing small electrical currents through the muscle creating a contraction. The use of FES can build muscle in patients, relieve soreness, and promote cardiovascular health. Compared to an able-bodied rider, a cyclist stimulated via FES produces an order of magnitude less power creating some notable pedaling difficulties especially pertaining to inactive zones. An inactive zone occurs when the leg position is unable to produce enough power to propel the tricycle via muscle stimulation. An inactive zone is typically present when one leg is fully bent and the other leg is fully extended. Altering the motion of a cyclist’s legs relative to the crank position can potentially reduce inactive zones and increase power throughput. Some recently marketed bicycles showcase pedal mechanisms utilizing alternate leg motions. This work considers performance tricycle designs based on the Stephenson III and Watt II six-bar mechanisms where the legs define two of the system’s links. The architecture based on the Stephenson III is referred to throughout as the CDT due to the legs’ push acting to coupler-drive the four-bar component of the system. The architecture based on the Watt II is referred to throughout as the CRT due to the legs’ push acting to drive the rocker link of the four-bar component of the system. The unmodified or traditional recumbent tricycle (TRT) provides a benchmarks by which the designs proposed herein may be evaluated. Using knee and hip torques and angular velocities consistent with a previous study, this numerical study using a quasi-static power model of the CRT suggests a roughly 50% increase and the CDT suggests roughly a doubling in average crank power, respectively, for a typical FES cyclist.
1. Introduction
A five-bar mechanism can be used to effectively model a cyclist’s upper and lower leg actuating a conventional crank-driven bicycle [1]. When restricting the motion and torque at the cyclist’s ankle, the kinematics and dynamics are described with a four-bar model. The ubiquitous four-bar mechanism has four pairs of coordinates defining the locations of its revolute (R) joints for a total of eight design variables. A potential way to improve the performance of a system is to replace its four-bar by a six-bar mechanism. A six-bar mechanism has seven R joints resulting in 14 design parameters. The six-bar performs in a manner that is similar to the four-bar, but has extra design variables that can be used to improve the performance of the mechanism, typically supplying amplification or subtler control over forces and/or displacements. Several recent examples of using the six-bar to provide such design refinement include a furniture hinge mechanism [2], an adjustable mechanical forming press [3], a biomimetic leg mechanism [4], a body guidance mechanism [5], a hand rehabilitation robot [6], and a compact bellow globe valve design [7]. When locking the motion of the ankle, a human pedaling a bicycle is seen as a four-bar loop, with the thigh as a rocking input, the cnemis, or lower leg, as the coupler, and the crank connecting to sprocket and chain as the fully rotating output. With improved performance in mind, the thigh and cnemis can be viewed as two links of a six-bar mechanism instead of two links in a four-bar where, instead of the foot driving the output crank directly, additional links are available between foot and output crank. Two such alternates are the Watt II and the Stephenson III.
Prior work investigated the Watt II design [8], referred to therein as the CRT, short for crank-rocker tricycle. That is, the thigh and calf drive a rocker arm that moves a coupler and rotates the output crank. Together, the motion of the legs and the crank-rocker define a pair of connected four-bars as in a Watt II mechanism. The significant change to this work is to consider the leg as pushing on the coupler of a four-bar rather than its output link, producing the CDT or coupler-driven tricycle. The overall architecture resembles that of the Stephenson III. As in the work of Bazler et al. [8], the focus here is on riders using functional electrical stimulation (FES). Although FES and its use in cycling are reviewed here, that work contains a more detailed examination of these topics.
FES uses low-energy electrical pulses to artificially generate muscle contractions. This stimulation can create movement for individuals who have been paralyzed due to spinal cord injuries (SCI) or other lower-body neurological impairments [9]. Outcomes include the ability to stand, grasp objects and exercise in people with physically disabling conditions [10]. FES cycling can be a successful means of exercise and rehabilitation for these patients. A variety of physical and mental health benefits have been observed [11,12,13]. The biomechanical challenges of FES cycling can be observed in the bike race event of the Cybathlon [14,15]. The challenges arise as FES cyclists are observed to produce an order of magnitude less power than able-bodied (AB) cyclists [16], limiting FES cycling to stationary bikes or horizontal surfaces. Biomechanical studies of cycling include Hull et al. [1] and Yamazaki et al. [17] demonstrating accurate dynamic simulations for AB cyclists, Fregly et al. examining steady state pedaling [18], and Gfohler et al. developing models in SCI cyclists that relate joint torques and angles [19,20].
The pedaling power model used in this paper is derived from the results of Szecsi et al. [21] developed on stationary tricycles wherein data was collected in two phases for 16 persons with SCI. The ankle was placed in a boot to constrain the foot to a 90 angle with the cnemis and restricting motion to the sagittal plane, typical of FES cycling. Their experiments involved a passive pedaling phase followed by an active phase in which stimulation of the subject’s legs rotated the crank at a cadence of 60 rpms against a machine-controlled resistance of 30 W (15 W per leg). An inverse dynamic approach was used to determine the knee and hip moments from the pedal contact forces [22]. Their data is measured from top dead center (TDC), an absolute crank angle of 22 as used in this work. Based on their prior work showing that AB cyclists have four distinct power peaks (P1, P2, P3, and P4) during one rotation of the crank, FES cyclists were found to fall into two groups [23]. Of the 16 SCI subjects, 75% produced the power alignment with the P1 and P2 phases (the P1P2 group). The remaining 25% produced power in alignment with the P1 and P3 phases (the P1P3 group). The knee and hip joint moments, calculated from the inverse dynamics, as a function of crank angle are shown for each group in Figure 1.
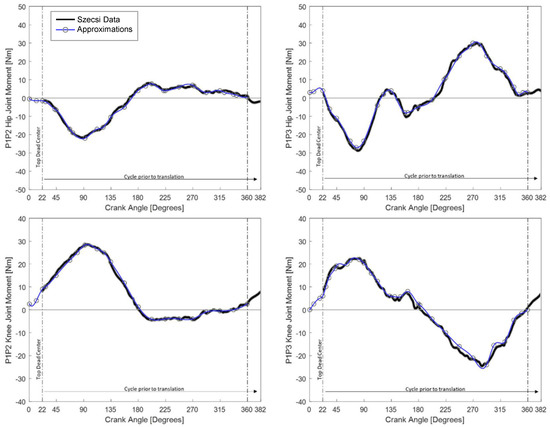
Figure 1.
Knee and hip moment data reported in Szecsi P1P2 and P1P3 groups, adapted from Ref. [21], 2014 Clarivate Analytics Web of Science, shown as the black curve. The numerical approximations are shown in blue. The curves are plotted from an absolute crank angle of 22 to correspond with Szecsi’s data, which is measured from top dead center.
The literature on riders using FES typically involves a tricycle featuring a traditional drivetrain, designed for the power stroke of an AB cyclist using voluntary movement of the lower limbs. Some innovative approaches have been attempted to address the challenges of FES cycling. An energy storage device proposed by Ibrahim et al. sought to store power in an elastic band to evenly redistribute positive power at the crank through the full duration of the pedaling sequence [24]. Shan [25] and Gfohler et al. [20] proposed ovate pedaling motion in an effort to increase power production in both AB and SCI cyclists. In line with these efforts, this work proposes that an alternative drivetrain could achieve greater power throughput than the traditional recumbent tricycle (TRT).
The contribution of this paper is to present a design methodology and recumbent tricycle architectures with the capacity to increase the power throughput for FES cycling. Previous research [8] proposed a six-bar pedalling linkage, with a coupler-rocker configuration, where analysis shows over a 50% power increase when compared to a traditional tricycle design. This paper introduces another six-bar linkage, with a coupler-driver configuration, that promises to increase power throughput by over 100%. The paper is organized as follows. The design approach is outlined in detail in Section 2, following closely the work of Bazler et al. [8]. Kinematic and quasi-static models are described in Section 3 as derived from the traditional recumbent tricycle. Section 4 discusses transferring the torque into a form that can be used in alternate tricycle deigns. Section 5 presents the considerations in the six-bar linkage-based designs, and Section 6 details its optimization. Section 7 compares the results of the three tricycle architectures. Section 8 concludes the paper.
2. Design Approach
This work investigates alternative tricycle drivetrain configurations to improve the effectiveness of FES cycling as a means of exercise and rehabilitation for persons with SCI. The investigation encompasses the following high-level tasks:
- Model the traditional recumbent tricycle (TRT). Kinematic and quasi-static models are constructed to simulate the experimental work published by Szecsi et al. The TRT includes a continuously rotating crank, which serves as the dependent variable for the published hip-joint and knee-joint moment data as shown in Figure 1. Along with the joint moment vs. crank angle data, the TRT model also accepts the tricycle dimensions and the lower limb dimensions of the cyclist.
- Power output of the P1P2 and P1P3 riders. The performance of the TRT riders is analyzed, using the respective joint moment data, over a full revolution of the crank angle . The moment at the crank center produced by one one leg is determined throughout 0 360 . The average power produced by one leg of the cyclist iswhere is the constant rotational velocity of the crank.
- Transform the muscle data. The kinematics of alternative tricycle designs will differ from the TRT. The crank angle is an inappropriate dependent variable for the exploration presented in this paper. In order to apply the joint moment data to alternative designs, the data dependency is shifted from crank angle to the appropriate joint angle.
- Model the crank rocker tricycle (CRT) and the coupler driver tricycle (CDT). Kinematic and quasi-static models are created for the CRT and CDT, both utilizing tricycle dimensions, rider dimensions and transformed muscle data.
- Optimize the CRT and CDT dimensions. Optimizations are performed on the CRT and CDT models with the objective of improving upon the cycle-averaged power produced by each group (P1P2 and P1P3) of riders.
3. Traditional Recumbent Tricycle Model
The kinematics of the interaction between the cyclist and the TRT is modeled as a four-bar linkage. Figure 2b displays the vector diagram. The recumbent tricycle frame is designated as .
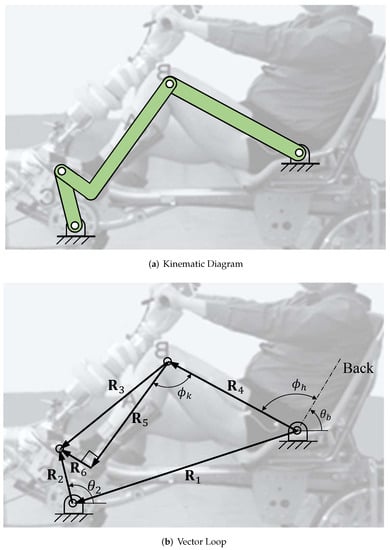
Figure 2.
Kinematic model for the TRT mechanism, adapted from Ref. [23], 2014 Elsevier Ltd.
The thigh serves as an oscillating link. The cnemis and foot are held at a constant relative angle by a rigid boot and are combined to form the coupler . The cycle pedal arm is a fully-rotating crank. The frame dimensions are = cm and the crank length is = 15.0 cm.
The loop closure equation for the TRT model is
where is the length of vector i, and is the angle of vector i measured counterclockwise from the positive horizontal axis. With a specified crank angle , Equation (2) can be readily solved for and . Note that the hip angle is , where is the seat recline angle. In addition, the knee angle is .
The time derivative of Equation (2) generates the velocity equation,
As with the position analysis, the angular velocities of the lower leg and upper leg are determined from Equation (3).
Szecsi’s experimental work [21] imposed a constant angular velocity (cadence) of = 60 rpm on the cyclist pedaling. Using a gear reduction of = 1.31 between the crank sprocket and the driving wheel, the linear velocity of the tricycle was determined by using a wheel diameter of = 66 cm, to be = 5.71 km/h, which is consistent with the average speed of cyclists at the Cybathlon in 2016 [14]. Given and the TRT dimensions, a position, velocity, and acceleration analysis are performed. Determining the relationship of the knee angle and hip angle to the crank angle is required to utilize the experimental data on the alternate six-bar linkage designs.
Free-body diagrams of the thigh, cnemis/foot, and crank are shown in Figure 3. A quasi-static model was deemed appropriate as the angular velocities and accelerations of and are low. As a consequence, inertial forces are ignored when generating the free-body diagrams. Further, the cycle-averaged power will be used as a comparison parameter between the TRT and the alternative six-bar designs. Over one cycle of the crank, the potential and kinetic energies related to the leg segment masses, would sum to zero and would have no effect on the cycle-averaged power. From Figure 3, the force and moment equilibrium equations become
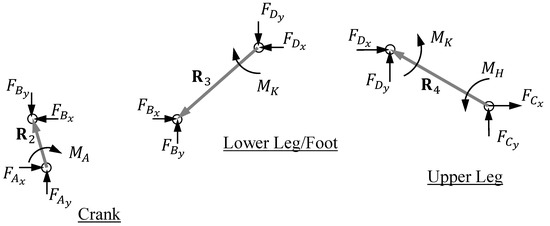
Figure 3.
Free-body diagrams for the TRT force model.
The hip-joint moment and knee-joint moment as a function of crank angle serves as input for the force analysis. Given the link kinematics , from Equations (2) and (4) become a square system of , , and . As such, a statically equivalent torque at the crank center, , is generated a function of .
The experimental data of Figure 1 represents the average of several FES cyclists, each with different leg lengths. To generate a model that represents an average rider, , , and , were altered until a simulated cycle-averaged power was consistent with Szecsi’s experiments. The average leg lengths for the P1P2 group are = 51.5 cm, = 51.5 cm, and = 6.9 cm. The average leg lengths that represent the P1P3 group are = 54.2 cm, = 54.2 cm, and = 6.9 cm.
The crank torque is calculated with the P1P2 and P1P3 knee and hip moments from Figure 1 for 0 360 using a constant angular velocity of the crank. The instantaneous power is calculated through Equation (1) and overlayed on Szecsi’s data in Figure 4.
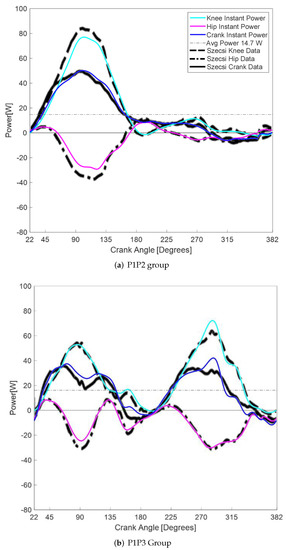
Figure 4.
The color curves represent the power calculated by the TRT model at the crank center attributed to the knee (cyan), hip (magenta) and total (blue). The calculated data overlays the black curves that represent the power reported by Szecsi.
Each SCI FES cyclist in Szecsi’s experiments produced an average of 30 Watts per cycle of the crank. Presuming that each leg equally contributes to the power generation, the single-leg TRT model is expected to produce a cycle-average of 15 W. With representative rider dimensions selected as = 52.0 cm, = 52.0 cm, and = 6.9 cm, the P1P2 group produced =14.7 W per leg whereas the P1P3 produced = 16.2 W.
4. Joint Moment Transformation
The measured joint torques (i.e., joint moments) shown in Figure 1 are provided by Szesci as a function of crank angle. Those torques are used as inputs to the TRT power model of Section 3. Alternative tricycle linkage designs will exhibit significantly different leg kinematics. In order to utilize Szesci’s measurements when exploring alternative designs, the joint torque dependency must be transformed.
Yoon et al. [26] show that joint torque is a function of three inputs: joint angle, joint motion, and muscular contraction speed. The preferred FES cyclist torque data would be available as a function of these dependencies. Without that experimental data, the approach taken in this work combines the three inputs. Joint torque is mapped from crank angle to joint angle and joint motion (i.e., joint extension and flexion). Additionally, the motion of the hip and knee joints are prevented from exceeding those experienced in the TRT cyclist model. This constraint is present not because the leg is incapable of moving beyond these ranges, but because of the lack of data for modeling purposes.
The TRT model provides the joint angle as a function of crank angle, which is combined with Szesci’s torque as a function of crank angle. In that way, a continuous curve of joint torque as a function of joint angle is produced and shown in Figure 5. The angular velocity of each joint is used to distinguish joint extension or flexion, which affects joint torque as the motion is derived from stimulating different muscle groups. A positive (or zero) joint angular velocity is identified as extension. Conversely, a negative angular joint velocity is identified as flexion. Extension and flexion are denoted in Figure 5 as alternate line styles.
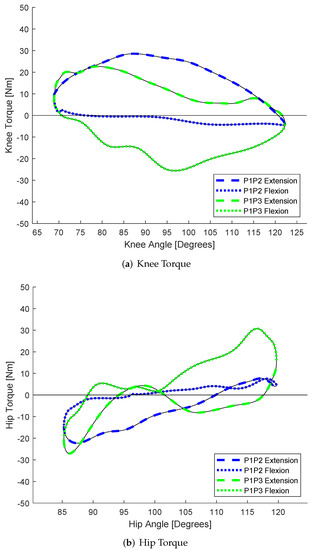
Figure 5.
Joint moments as a function of relative joint angles.
5. Alternate Tricycle Models
Two alternative six-bar linkage designs for the recumbent tricycle drive train are described below.
5.1. The CDT Model
When including the thigh and cnemis as links in the kinematic diagram, the Coupler-Driver Tricycle (CDT) forms a Stephenson III six-bar mechanism. The vector diagram for modeling the rider and CDT interaction is shown in Figure 6b. As with the TRT in Figure 2b, the upper leg serves as the oscillating input link. The cnemis and foot are constrained by a boot to define link . Note that vectors , , and define a rigid triangle that acts as a coupler for the four-bar defined by , , , and . The rider’s foot, affixed to a point on the triangular coupler, follows a cyclic motion corresponding to oscillations of the upper and lower leg. In addition, note that is not the actual rotation of the drive wheel as there can be a gear reduction inserted between the crank and the drive wheel due to the chain and sprockets.
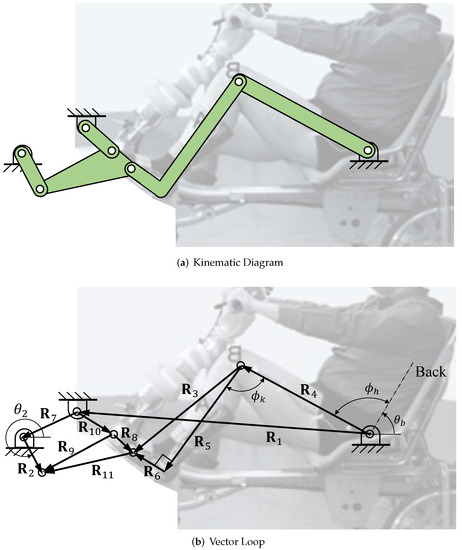
Figure 6.
Kinematic model for the CDT mechanism, adapted from Ref. [23], 2014 Elsevier Ltd.
The vector loops for the CDT are
where the nomenclature and is adopted from Equation (2). In addition, , where . Taking time derivatives of the loop closure gives the CDT linkage velocity equations,
Similar to the TRT model, a quasi-static model was used to calculate the torque production at the crank. The corresponding free-body diagrams are shown in Figure 7. The dynamic effects of the leg and the linkage masses are neglected by acknowledging the low angular velocities and accelerations experienced through one cycle of the crank. Over the course of one cycle, all potential and kinetic energies sum to zero. As in the TRT, the mass of each link was ignored as the concern of this study is the average power produced at the crank. The equilibrium equations from Figure 7 are

Figure 7.
Free-body diagrams for the CDT mechanism.
Thus, given the complete kinematics and values of , the quasi-static analysis of Equations (9) generates the statically equivalent torque at the crank given the torque produced by the cyclist at the knee and hip joints, and , respectively.
5.2. The CRT Model
When including the thigh and cnemis as links in the kinematic diagram, the Crank-Rocker Tricycle (CRT) with the rider’s legs forms a Watt II six-bar mechanism. The vector diagram for modeling the rider and CRT interaction is shown in Figure 8b. Note that vectors and are collinear and part of the same rigid body, acting together as the rocking input link for the four-bar defined by , , , and . The rider’s foot oscillates, affixed to a point on the rocker, with corresponding oscillations of the thigh and cnemis. This system also has the gear reduction .

Figure 8.
Kinematic model for the CRT mechanism adapted from Ref. [23], 2014 Elsevier Ltd.
The collinearity of vectors and may appear to eliminate a potential design variable in the angle between them. As may change in both the x and y component, the fixed pivot at the crank center could potentially be located well below or above the fixed pivot of the oscillating input link. The angle between and may then be introduced to rotate the entire linkage and move to an improved location with respect to the actual design of the tricycle. Rotating the entire linkage in this fashion does not change the forces and does not effect the power over a full rotation of the crank.
The vector loops for the CRT are
where the nomenclature and is adopted from Equation (2). Taking time derivatives of the loop closure gives the CDT linkage velocity equations,
The CRT free-body diagrams are shown in Figure 9, noting that those for bodies 2, 3 and 4 remain unchanged between the CDT and CRT. Furthermore, all assumptions about masses stay the same and the energies still sum to zero.
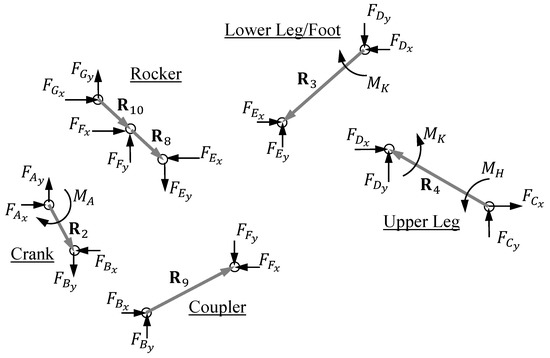
Figure 9.
Free-body diagrams for the CRT mechanism.
The equilibrium equations for the CRT are
Given the complete kinematics and values of , Equations (14) represent a square system for , , , , , , and . As with the other devices, the quasi-static analysis generates the statically equivalent torque at the crank given the torque produced by the cyclist at the knee and hip joints, and , respectively.
6. Optimization
Both six-bar models have ten design parameters, and not the 14 stated in the Introduction because the parameters associated with the human leg cannot be varied. The ten parameters are collected as =, , , ,, , , ]. An objective function is posed to maximize the average power throughout the cycle . The optimization is formally posed as
where is the number of angles within the kinematic model and ℑ refers to the imaginary part of .
In order to determine from Equation (1), the kinematic vector loop closure equations are solved throughout a cycle of . The kinematic loop closure for the CDT are given in Equations (5) and () and for the CRT in Equations (10) and (). Subsequently, the force and moment equilibrium equations, given in Equations (9) for the CDT and Equations (14) for the CRT, are used to determine the reaction moment at the crank that is used in Equation (1). The motivation for the optimization constraints posed in Equation (15) are provided below.
The loop closure equations must produce a linkage that can be assembled for every position of the crank. That is, . Additionally, the crank rotation must produce a linear velocity consistent with the TRT ( = 5.71 km/h),
Grashof’s criteria is enforced to ensure full crank rotatability,
where is required to be the shortest of the four links.
To align with the results generated during the TRT analysis, the hip joint was restricted to the range . Likewise, the knee joint was restricted to the range . As expected, test optimizations produced unusable mechanisms due to positioning of components and undesirable link lengths. As such, a final set of constraints on dimensions was introduced for the sake of practicality and manufacturability: the crank 2.5 cm, the rocker 2.5 cm, the angle-to-pedal length 35.5 cm, and crank center and rocker center locations constrained to lie within the envelope shown in Figure 10.
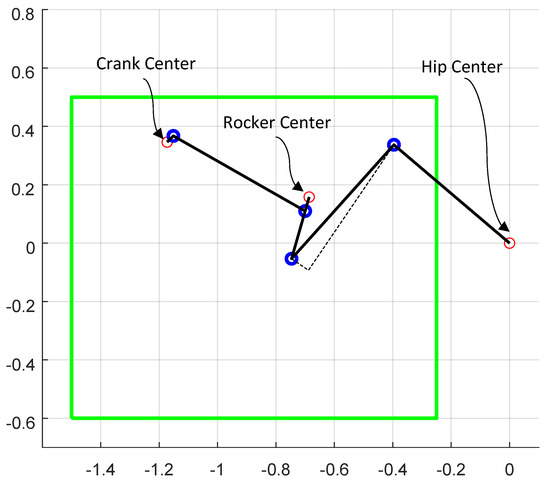
Figure 10.
The design space shown in green bounds the region of usable crank center and rocker arm pivot locations for both the CRT and CDT designs, in units of meters.
This nonlinear problem includes a significant number of inequality constraints. As such, a standard gradient-based optimization proved problematic. A Random Pursuit Optimization was used instead to identify optimal design values . The optimization initiates with a guess, , for the ten design parameters that satisfies all constraints. The corresponding average power over one full cycle, , is calculated for . A new guess, , is generated from through the introduction of small, random changes. That is, for the potential first optimization step, i = 1,
where . The values of are evaluated against the entire set of constraints. If satisfied, is passed to the objective function and is determined. If , the new optimal is . A new guess, , is generated by making small, random changes to according to Equation (18). If , the optimal design values remain unchanged and . A new guess for is generated by making a different set of random changes to .
Convergence was determined by limiting the number of iterations since the last improvement. Due to the randomness associated with altering the ten parameters, and to be confident that a design approaching the optimum has been obtained, the convergence criteria was established to be 10,000 consecutive iterations of parameters that satisfy the constraints without improving . Code to perform the aforementioned procedure was generated by the authors using MATLAB.
7. Results and Discussion
An optimization as described in the prior section was performed for both six-bar designs using the torque input for the P1P2 group and the P1P3 group. The resulting power and extreme joint angles encountered during motion for the TRT, CRT and CDT architectures are presented in Table 1. The solution for the CRT design that generated the highest power output for the P1P2 group is designated R1, while for the CRT design with the P1P3 group is designated R2. Similarly, D1 is corresponding with the CDT design for the P1P2 group and D2 is corresponding with the CDT design for the P1P3 group. Once the design was achieved, the cycle-averaged power output for both groups and was determined and are given in Table 1. The average power for both groups is also shown.

Table 1.
Designs R1 and R2 were selected from the CRT optimization results and designs D1 and D2 were selected from the CDT optimization results for further analysis to identify the best design for spinal cord injured FES cyclists. The powers listed are in watts (W). For reference, the TRT is shown in Figure 2, the CDT in Figure 6 and the CRT in Figure 8.
Note from Table 1 that all six-bar designs provide substantial increases in power output when compared to the TRT. Further, the R1 and D1 designs were optimized for the P1P2 group, yet the P1P3 group would generate comparable power with those tricycle designs. Conversely, the R2 and D2 designs were optimized for the P1P3 group, but the P1P2 group generates notably less power.
Designs R1, R2, D1, D2 are further evaluated to identify the best six-bar tricycle design based upon the following set of metrics: manufacturability, joint torque curve continuity, equal power distribution over the entire crank cycle, and percent increase in average power for each group.
7.1. Manufacturability
The dimensions of the TRT, R1, R2, D1 and D2 designs are provided in Table 2. The length represents the distance from the ankle to the center of the pedal. Since the cyclist’s foot is placed in a boot, zero and negative values are permissible.
Table 2.
Designs R1, R2, D1, D2 Optimized Design Parameter Results for further analysis to identify the best design for spinal cord injured FES cyclists. Link dimensions (and vectors) are in cm and is a dimensionless ratio.
Manufacturability considerations include several design criteria such as the distance from the hip center to crank center, length of the the rocker arm, height of the rocker arm pivot relative to rider’s line of sight, estimated weight of the design, etc. All four design six-bar designs are deemed suitable and will yield an acceptable mechanical design.
7.2. Joint Torque Curve Continuity
The joint torque curves of Figure 5 are truncated when the kinematics of a six-bar linkage design requires the cyclist’s knee or hip to move less than the TRT during a full pedaling motion. The discontinuity at the ends of the plots on Figure 11 are not biomechanically correct. Yet, these truncated curves are used in the CRT and CDT power modeling because the experimental data needed to generate continuous curves does not exist.
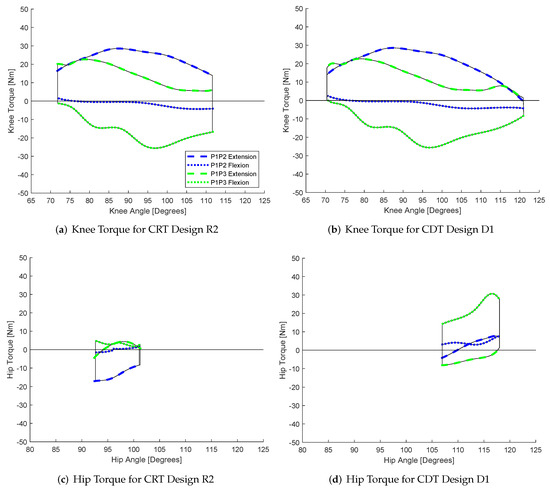
Figure 11.
Joint torque curves for CRT design R2 and CDT design D1. Note that the axes limits are kept the same as Figure 5 for comparative purposes.
For example, notice that design R2 requires knee movement from to , whereas the TRT requires to . At the lower extreme of , the knee joint torque is assumed to shift instantaneously from the extension curve with 20 Nm of torque to flexion curves with −1 Nm. A continuous joint torque curve would likely reduce the power generated as the sharp corners in Figure 11 would become rounded and decrease the torque produced at the joint limit extremes. As such, the power from the six-bar linkage models will be more accurate when the design requires joint movements that closely align with the TRT joint movements. The CDT designs D1 and D2 have more similar joint angle extremes when compared to the TRT. Accordingly, the CDT modeled power is more representative of the biomechanical output.
7.3. Power Distribution
An ideal tricycle design enables a cyclist to generate a constant level of power throughout the crank rotation, thereby creating smooth forward motion. However, Szesci [21] observed that FES cyclists generate uneven levels of power, exhibiting propulsive and recovery phases. Understanding that power fluctuations will occur, a favorable design will limit the instantaneous power variations and prevent negative values. When the power output becomes negative, power is extracted from the tricycle’s kinetic energy and used to move the cyclist’s legs. This transfer of power from tricycle to the cyclist’s legs is referred to as an inactive zone, where the leg is not in a configuration that can be stimulated to produce positive work. The inactive zones create a choppy pedaling motion and may lead to the cyclist becoming locked at the TDC or BDC of the TRT crank. Video from the Cybathlon demonstrates this phenomena [15].
The instantaneous power curves for the R2 and D1 designs are given in Figure 12 for both the P1P2 and P1P3 groups. The curves in Figure 12a,c exhibit a high power peak in one phase of the crank because the P1P2 group riders generate almost all of their joint torques in this region. This single peak is consistent with the TRT instantaneous power with the P1P2 group shown in Figure 4a. Note that in the TRT inactive zones, the remainder of the power decreases in the second half of the cycle while becoming negative. In the CRT and CDT designs of Figure 12a,c, the power remains above or at zero throughout the remainder of the cycle.
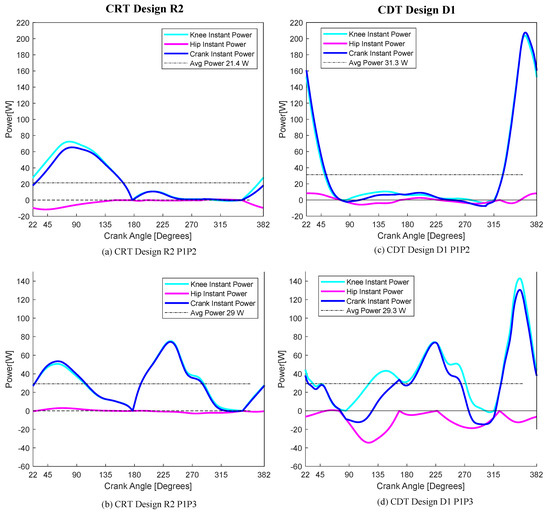
Figure 12.
CRT instantaneous power curve at crank center for design R2 and CDT instantaneous power curve at crank center for design D1. Plot (a) shows the CRT design R2 instantaneous power curve for the P1P2 group. Plot (b) shows the CRT design R2 instantaneous power curve for the P1P3 group. Plot (c) shows the CDT design D1 instantaneous power curve for the P1P2 group. Plot (d) shows the CDT design D1 instantaneous power curve for the P1P3 group.
The P1P3 group exhibits two power peaks as discussed in Section 3 and shown in Figure 4b. Accordingly, the R2 and D2 designs with the P1P3 group yield the highest power output. Additionally, the power curves in Figure 12b,d are not dominated by a single peak and are expected to produce smoother tricycle motion.
7.4. Design Recommendation
The tricycle design selected for further consideration should allow any FES rider of an unknown power group to effectively produce a significant power improvement above the TRT. The tricycle design should have high average power for both groups ( and ), satisfy the manufacturability criteria, and biomechanically satisfy the additional constraints required for FES cycling. Design D1 produces comparable power in each group with a group average power of 30.32 W, which is nearly double the TRT. Design D1 achieves the increased power by altering the motion of the leg and maintaining the joint angle in regions of high toque to ensure that positive power is produced for the duration of the crank cycle. The optimization recognized that a significant portion of the hip range did not produce positive power at the crank, therefore the kinematics of the design D1 limits the hip from entering this region. Further, design D1 limits any antagonistic joint moments created at the hip through limiting its joint range. Lastly, the D1 design also nearly matches the knee joint angle ranges of the TRT. Therefore, the recommendation is that the biomechanical interaction of the cyclist and the Coupler Driver Tricycle, design D1 be investigated to confirm that an an FES cyclist is capable of producing the anticipated joint torque curves. A scaled kinematic sketch of the recommended Design D1 is shown in Figure 13.

Figure 13.
A scaled kinematic sketch of CDT Design D1, in meters.
8. Conclusions
This paper presents two alternative tricycle designs and modeling techniques for spinal cord injury functional electric stimulated cycling. Traditional cycling for AB subjects is vastly different from FES cycling. Average power production for FES cyclist is an order of magnitude less than for an AB cyclist. Additionally, the four power peaks observed in AB cycling are not seen in FES cycling. Therefore, alternative drive trains may have better force/power transmission to the driven wheel. The CRT tricycle design employs a four-bar architecture that allows the pedal, and therefore leg, to travel in a back-and-forth motion instead of the traditional circular motion of the pedal. The CDT tricycle design drives the leg in the same motion as the CRT while holding the angular constraint in a different position than the CRT. the optimization of these architectures lead to designs that improved the throughput power of P1P2 cyclists by as much as 102% and P1P3 cyclists by as much as 138% on the CDT architecture. These designs take advantage of joint angular ranges where cyclists can produce large amounts of torque. Furthermore, the back-and-forth motion more evenly distributes power throughout the cycle of the crank and thus reduces inactive zones. Increased power throughput to the driving wheel and a smoother pedaling cycle are believed to improve SCI FES cycling. This paper shows alternative tricycle architectures can improve mechanical power throughput of FES cycling. Further research is recommended to determine the biomechanical properties of the rider to supplement the mechanical models presented in this paper.
Author Contributions
Conceptualization, N.A.L., D.H.M., A.L.B. and A.P.M.; methodology, D.H.M. and A.P.M.; software, N.A.L. and A.L.B.; validation, N.A.L. and A.L.B.; formal analysis, N.A.L., D.H.M., A.L.B. and A.P.M.; investigation, N.A.L. and A.L.B.; data curation, N.A.L. and A.L.B.; writing—original draft preparation, D.H.M., A.L.B. and A.P.M.; writing—review and editing, N.A.L., D.H.M. and A.P.M.; visualization, N.A.L., D.H.M. and A.L.B.; supervision, D.H.M. and A.P.M.; project administration, D.H.M. and A.P.M. All authors have read and agreed to the published version of the manuscript.
Funding
This research received no external funding.
Data Availability Statement
Data is available upon request.
Acknowledgments
The authors are grateful for motivation and valuable guidance from Christine Azevedo-Coste.
Conflicts of Interest
The authors declare no conflict of interest.
References
- Hull, M.; Jorge, M. A Method for Biomechanical Analysis of Bicycle Pedaling. J. Biomech. 1985, 18, 631–644. [Google Scholar] [CrossRef]
- Chen, F.-C. Analysis and Verification of a Watt I Six-Bar Furniture Hinge Mechanism. Proc. Inst. Mech. Eng. Part C J. Mech. Eng. Sci. 2005, 219, 1107–1117. [Google Scholar] [CrossRef]
- Soong, R.-C. An Adjustable Six-Bar Mechanism with Variable Input Speed for Mechanical Forming Presses. Trans. Can. Soc. Mech. Eng. 2008, 32, 453–466. [Google Scholar] [CrossRef]
- Batayneh, W.; Al-araidah, O.; Malkawi, S. Biomimetic Design of a Single DOF Stephenson III Leg Mechanism. Mech. Eng. Res. 2013, 3, 43. [Google Scholar] [CrossRef]
- Plecnik, M.; McCarthy, J.M.; Wampler, C.W. Kinematic Synthesis of a Watt I Six-Bar Linkage for Body Guidance. In Advances in Robot Kinematics; Springer: Cham, Switzerland, 2014; pp. 317–325. [Google Scholar]
- Gezgin, E.; Chang, P.; Faruk, A. Synthesis of a Watt II six-bar linkage in the design of a hand rehabilitation robot. Mech. Mach. Theory 2016, 104, 177–189. [Google Scholar] [CrossRef]
- Azam, F.I.; Rani, A.M.A.; Altaf, K.; Zaharin, H.A. Experimental and Numerical Investigation of a Six-Bar Linkage Application to Bellow Glovbe Valve for Compact Design. J. Appl. Sci. 2018, 8, 1980. [Google Scholar] [CrossRef]
- Bazler, A.; Myszka, D.; Murray, A. The Redesign of a Recumbent Trucycle using a Crank Rocker Mechanism to Increase Power Throughput in FES Cycling. In Proceedings of the 2021 ASME International Design Engineering Technical Conference, Virtually, 17–19 August 2021. [Google Scholar]
- Nussbaum, E.; Houghton, P.; Anthony, J.; Rennie, S.; Shay, B.; Hoens, A. Neuromuscular Electrical Stimulation for Treatment of Muscle Impairment: Critical Review and Recommendations for Clinical Practice. Physiother. Can. 2017, 69, 1–76. [Google Scholar] [CrossRef]
- Agarwal, S.; Triolo, R.; Kobetic, R.; Miller, M.; Bieri, C.; Kukke, S.; Davis, J. Long-term user perceptions of an implanted neuroprosthesis for exercise, standing, and transfers after spinal cord injury. J. Rehabil. Res. Dev. 2003, 40, 241–252. [Google Scholar] [PubMed]
- Chen, S.C.; Lai, C.H.; Chan, W.P.; Huang, M.H.; Tsai, H.W.; Chen, J.J.J. Increases in bone mineral density after functional electrical stimulation cycling exercises in spinal cord injured patients. Disabil. Rehabil. 2005, 27, 1337–1341. [Google Scholar] [CrossRef] [PubMed]
- Berkelmans, R. FES Cycling. J. Autom. Control 2008, 18, 73–76. [Google Scholar] [CrossRef]
- Salter, A.; Bagg, S.; Creasy, J.; Romano, C.; Romano, D.; Richmond, F.; Loeb, G. First clinical experience with BION implants for therapeutic electrical stimulation. Neuromodulation Technol. Neural Interface 2004, 7, 38–47. [Google Scholar] [CrossRef] [PubMed]
- Cybthalon Official Website, Functional Electrical Stimulation Bike Race. Available online: https://cybathlon.ethz.ch/en/event/disciplines/fes (accessed on 3 February 2022).
- Bergeron, V. FES Cycling Race Cybathlon 2016. 2018. Available online: www.youtube.com/watch?v=RWiN5ihf3og (accessed on 3 February 2022).
- Sijobert, B.; Fattal, C.; Daubigney, A.; Azevedo-Coste, C. Participation to the first Cybathlon: An overview of the FREEWHEELS team FES-cycling solution. Eur. J. Transl. Myol. 2017, 27, 7120. [Google Scholar] [CrossRef] [PubMed][Green Version]
- Yamazaki, H.; Matsuda, A. Joint Torque Evaluation of Lower Limbs in Bicycle Pedaling. In Proceedings of the 11th Conference of the International Sports Engineering Association, Delft, The Netherlands, 11–14 July 2016. [Google Scholar]
- Hull, M.; Jorge, M. Crank Inertial load has Little Effect on Steady-State pedaling Coordination. J. Biomech. 1996, 29, 1559–1567. [Google Scholar]
- Gfohler, M.; Angeli, T.; Eberharter, T.; Lugner, P.; Mayr, W.; Hofer, C. Test Bed with Force-Measuring Crank for Static and Dynamic Investigations on Cycling by Means of Functional Electrical Stimulation. IEEE Trans. Neural Syst. Rehabil. Eng. 2001, 9, 169–180. [Google Scholar] [CrossRef] [PubMed]
- Gfohler, M.; Lugner, P. Dynamic Simulation of FES-cycling: Influence of Individual Parameters. IEEE Trans. Neural Syst. Rehabil. Eng. 2004, 12, 398–405. [Google Scholar] [CrossRef] [PubMed]
- Szecsi, J.; Straube, A.; Fornusek, C. A Biomechanical Cause of Low Power Production during FES Cycling of Subjects with SCI. J. Neuroeng. Rehabil. 2014, 11, 123. [Google Scholar] [CrossRef] [PubMed]
- Szecsi, J.; Krause, P.; Krafczyk, S.; Brandt, T.; Straube, A. Functional output improvement in FES cycling by means of forced smooth pedaling. Med. Sci. Sports Exerc. 2007, 39, 764–780. [Google Scholar] [CrossRef]
- Szecsi, J.; Straube, A.; Fornusek, C. Leg General Muscle Moment and Power Patterns in Able-Bodied Subjects during Recumbent Cycle Ergometry with Ankle Immobilization. Med. Eng. Phys. 2014, 36, 1421–1427. [Google Scholar] [CrossRef] [PubMed]
- Ibrahim, K.; Gharooni, S.; Tokhi, M.; Massoud, R. Energy-Efficient FES Cycling with Quadriceps Stimulation. In Proceedings of the 13th Annal Conference of the International Function Electrical Stimulation Society, Freiburg, Germany, 21–15 September 2016. [Google Scholar]
- Shan, G. Biomechanical Evaluation of Bike Power Saver. Appl. Ergon. 2008, 39, 45. [Google Scholar] [CrossRef]
- Yoon, T.S.; Park, D.S.; Kang, S.W.; Chun, S.I.; Shin, J.S. Isometric and Isokinetic Torque Curves at the Knee Joint. Yonsei Med. J. 1991, 32, 33–43. [Google Scholar] [CrossRef] [PubMed]
Publisher’s Note: MDPI stays neutral with regard to jurisdictional claims in published maps and institutional affiliations. |
© 2022 by the authors. Licensee MDPI, Basel, Switzerland. This article is an open access article distributed under the terms and conditions of the Creative Commons Attribution (CC BY) license (https://creativecommons.org/licenses/by/4.0/).