Article

Implementation of a Flexible and Lightweight Depth-Based Visual Servoing Solution for Feature Detection and Tracing of Large, Spatially-Varying Manufacturing Workpieces

1
Department of Automatic Control and Systems Engineering, University of Sheffield, Sheffield S1 3JD, UK
2
Advanced Manufacturing Research Centre, Sheffield S9 1ZA, UK
*
Author to whom correspondence should be addressed.
Robotics 2022, 11(1), 25; https://doi.org/10.3390/robotics11010025
Submission received: 12 November 2021 / Revised: 28 January 2022 / Accepted: 1 February 2022 / Published: 11 February 2022
(This article belongs to the Special Issue Industrial Robotics in Industry 4.0)

Abstract

:
This work proposes a novel solution for detecting and tracing spatially varying edges of large manufacturing workpieces, using a consumer grade RGB depth camera, with only a partial view of the workpiece and without prior knowledge. The proposed system can visually detect and trace various edges, with a wide array of degrees, to an accuracy of 15 mm or less, without the need for any previous information, setup or planning. A combination of physical experiments on the setup and more complex simulated experiments were conducted. The effectiveness of the system is demonstrated via simulated and physical experiments carried out on both acute and obtuse edges, as well as typical aerospace structures, made from a variety of materials, with dimensions ranging from 400 mm to 600 mm. Simulated results show that, with artificial noise added, the solution presented can detect aerospace structures to an accuracy of 40 mm or less, depending on the amount of noise present, while physical aerospace inspired structures can be traced with a consistent accuracy of 5 mm regardless of the cardinal direction. Compared to current industrial solutions, the lack of required planning and robustness of edge detection means it should be able to complete tasks more quickly and easily than the current standard, with a lower financial and computational cost than the current techniques being used within.

1. Introduction

Ever since the 19th century and the Industrial Revolution, manufacturing within the U.K. has been a significant part of the workforce, employing 2737 million people within the manufacturing industry as of March 2019 [1]. Despite the large size of this industry, automation has not been fully embraced within many manufacturing tasks, usually related to either task complexity or an unfavourable cost-to-benefit ratio. Some industries such as the automotive industry have been able to embrace automation [2]. These industries typically have repetitive tasks, which can be replicated and repeated by robots, whereas other sectors, such as the aerospace industry, have not experienced automation to the same extent. Typical industrial robotics are used for low accuracy and high production-volume work, whereas the aerospace industry requires high accuracy [3] and low production-volume work.
Current research on automation within the manufacturing industry is influenced by visual servoing; the combination of vision and kinematics to inform movement [4]. There are two main types of visual servoing, either Eye-in-Hand (camera mounted to an end-effector) or Eye-to-Hand (camera mounted elsewhere in the environment) [5], much of its use in manufacturing is done via Eye-in-Hand due to its more precise vision of the workpiece.
One example of visual servoing commonly seen within the manufacturing industry is painting, specifically in the automobile industry [6]. However, doing this via visual servoing requires a fair amount of image processing, as the object must be identified and travelled to, and the agent must remain parallel to, the workpiece. CAD (Computer-aided design) information can be used to aid and inform the system about the dimensions and location of the workpiece.
Another prevalent task to be completed by visual servoing robots within the manufacturing industry is welding. Examples of welding robots show that it is common to locate weld seams, identify their cartesian coordinates, and then use this information to get a successful weld on the seam [7]. Many of these techniques use heavy post-processing to ensure a clear image, which is an essential requirement when conducting welding tasks. A similar approach utilises a combination of Position-Based Visual Servoing (PBVS) and Image-Based Visual Servoing (IBVS) [8], where PBVS is used to locate and travel across a weld seam, and then IBVS is used to correct any errors in movement. These techniques are very accurate, up to 0.2 mm [9], although in almost all cases, the weld being traced is on a flat surface with no level of curvature.
Visual Servoing techniques for identifying spatially varying edges for industrial purposes, such as sewing [10] or cutting [11] have been reported in literature. Examples such as [12] show a kinematic arm tracing curved surfaces for a manufacturing use case, although they rely on predefined information, in this case, a vertical slice.
Within aerospace, the introduction of precision kinematics is already a popular option [13]. However, it still suffers from a lack of flexibility. It is a single cell explicitly created for a singular task on a particular type of aeroplane wing, requiring a large amount of setup time before the operation can begin. Some dynamic solutions have been proposed, such as [14], which uses CAD files as a rough guide, and then uses structured light techniques to adjust the path. This technique would allow an agent to quickly move around a large workpiece and interact with it, although it still requires a CAD model to be created, which hampers its flexibility.
A use case for automation in the aerospace industry is sealing and cleaning large aerospace components prior to assembly. An example component is shown in Figure 1. This process is traditionally done by hand and is a long, complex task, which costs both time and money. There are limitations in using traditional visual servoing techniques due to the required setup before tracing can begin. This setup can take a substantial amount of time and must be repeated after every operation due to the possibility of unique deformation in the workpiece. Some automation has begun to appear within aerospace manufacturing, such as using Autonomous Mobile Robots (AMRs) [15,16] or kinematic arms [17]. For example, Airbus’s Wing of Tomorrow program focuses on aircraft wing technology and how to manufacture them more economically through the use of advanced manufacturing techniques [18].
This research proposes a lightweight solution capable of detecting the edges of a large workpiece and tracing them with an appropriate end effector without prior knowledge of its location or shape. The solution has been tuned through a detailed analysis of environmental variables which can effect edge detection quality, to ensure a high level of robustness. The workpiece edges were spatially varying and had various curvatures and gradients. The developed setup has the capability to trace either the edge or at the point at which a curved edge begins. The resulting system can detect and trace the edges to an accuracy of 1.5 cm or less. The developed solution had the advantage of low financial and computational costs.
The proposed technique offers a clear advantage over currently existing techniques as it does not require any external information such as CAD files to inform the system; all the processing is done locally in real-time. This allows for dynamic changes in the workpiece and requires no lengthy setup or adjustment time. A similar technique, demonstrated by [19], lacked tests to show how their implementation could identify the point at which a curve starts.
The proposed lightweight solution, paired with information learnt from environmental factor experimentation, provided a fast method to track and trace workpiece features and edges, which could cut down the processing time significantly, reducing the time and cost involved in high-value complex manufacturing tasks. Figure 2 demonstrates an overview of key research conducted and reported in this article. Initially, important environmental factors were identified, and then used to create an optimal environmental setup. Using this environmental setup, different cameras were compared, to identify the best camera for edge detection and tracing. Once an ideal camera and setup were established, algorithms were created to allow the system to detect and trace a variety of edge types.
The remainder of this paper is organised as follows: Section 2 discusses the hardware and software needed for camera and visual servoing experiments, as well as the methods and algorithms to be employed. Section 3 shows the experimental setup for environmental variable, edge detection and visual servoing experiments. Section 4 presents the results for both simulated and physical edge detection and tracing experiments using a variety of dimensions and materials, and provides a discussion and analysis. Finally, Section 5 discusses directions for related future work and conclusions.

2. Methods and Materials

2.1. Selection of Physical Camera and Kinematic Robot

To detect the features of the various workpieces, a camera was required. The camera needed to work seamlessly with various image processing libraries (such as OpenCV [20]), have RGB functionality, as well as a way to gain depth information from images. An Intel Realsense D435i was suitable, as it met all these requirements, and was readily purchasable. This was a low-cost RGB camera that had depth-sensing capabilities, and that can detect objects up to 10 m away, in conjunction with a high quality RGB sensor. This allowed the target workpiece to be detected, while ignoring and removing all other subjects, for example, background noise.
In addition to the camera, a kinematic robotic arm was required to trace the detected features of the workpiece. Ideally, the kinematic arm was required to be both lightweight to aid with mobility around the lab, as well as being compatible with ROS (Robotic Operating System) [21] to allow it to fit into the expected workflow. A Commonplace Robotics Mover6 was found to be suitable, as it was lightweight enough to move around (weighing 3.5 kg) while also being ROS compatible. Additionally, the arm had a maximum payload of 400 g meaning that it would comfortably support the majority of cameras connected to the end effector.

2.2. Selection of Software

OpenCV [20] was used to develop the overall system, providing an off-the-shelf edge detection algorithm. Additionally, the camera required its own dedicated software to function correctly, specifically pyrealsense2 [22].
ROS was chosen as the ideal robotics middleware, as it is the most well-known and open source, allowing some cameras to interact directly with it and other software packages entirely [23]. Specifically ROS Melodic, as it is the version targeted at Ubuntu 18.04.
By using ROS, the robot was easily controlled as it subscribed to joint demands, which were generated by MATLAB. The MATLAB robotics’ toolkit published ROS messages, as well as provided a robust inverse kinematic function. Using both of these MATLAB features allowed a singular software solution for moving the arm to the desired location, which was both highly flexible and lightweight. The inverse kinematic function was able to calculate joint demands for the robot, and then these were published via ROS to the robot to allow it to move.
In addition to preparing software for real world experiments, a simulator was used for more precise measurement experiments and simulating curved surfaces for detection. Gazebo, a robotics simulation engine [24], was the primary and most obvious choice due to its capability to: integrate with ROS [25], simulate the selected cameras and the kinematic arm, and execute movement commands from MATLAB.

2.3. Algorithm Design

2.3.1. Acute Edge Detection

Once a camera was selected to do edge detection and an optimal environmental setup was created, the next task was identifying the detected edge and enabling a robotic arm to move towards that location (Figure 3). Canny Edge Detection [26], a longstanding edge detection algorithm, was used for all edge detection experiments, alongside an additional algorithm that automatically tuned the thresholds for edge detection [27]. While this algorithm did not produce results as perfectly as a well-tuned edge detector, it did produce results that were suitable for the purpose and required no tuning while also increasing the overall completion speed of the solution. The camera detected the edges of the workpiece with Canny Edge and searched the edge for a pixel pair with the lowest X value, which would be a point furthest to the left of the frame. The depth sensor on the Intel Realsense D435i was then used to provide the camera with the Z coordinates, the distance between the camera and the workpiece. The pixel pair and depth coordinates were then used to deproject them into 3D camera coordinates. These 3D coordinates were moved to MatLab, an offset and transformation matrix was added to turn them into world coordinates, and input into the inverse kinematic mover for the robot. While the camera used was able to easily get the distance between itself and the workpiece, there are alternative methods to get the depth, such as using deep learning [28], or treating the video as a stereo camera system with a camera with a large FOV [29]. The local coordinates were transformed into global coordinates by offsetting the camera position and using a transformation matrix. Finally, the new global coordinates were fed into an inverse kinematic system which output the necessary joint demands for the robot arm to move to the specified point. This workflow was repeated with the arm moving from point to point until it had traced the whole edge.

2.3.2. Obtuse Edge Detection

Some types of edges did not have a well defined acute edge, and their edges had a low rate of curvature, similar to a cylinder. For features like this, the point at which the workpieces’ face transformed into a curved edge needed to be detected. This was achieved by initially getting the distance from the arm to the workpiece and then systematically moving across the workpiece, looking for the point at which the depth information subtly changes. This change was generally where the curve began, which is the feature that needed to be identified. Figure 4 and Figure 5 demonstrate how the algorithm worked when the camera and robotic arm viewed the workpiece perpendicular.
Initially, the centre of the frame is used to provide a depth reading for the camera, to inform how far the camera is from the flat face of the workpiece. The algorithm then searched the face, initially from the bottom left pixel, incrementing the vertical coordinate until a depth change is detected. The point was saved in an array, the vertical coordinate resets, and the horizontal coordinates were incremented by one. This continued until the whole image was systematically searched, outputting an array of points where the flat surface starts to curve. These coordinates were then converted to local coordinates, in preparation to be traced by a kinematic arm.
Compared to the algorithm used for acute edge detection, this algorithm relied more heavily on the point cloud data provided by the stereo camera being used, as it is the primary sensor. Other works have also used a similar offline technique [30], allowing accurate, real-time information related to the structure at the time of operation.

3. Experimental Setup

3.1. Environmental Variable Experimentation

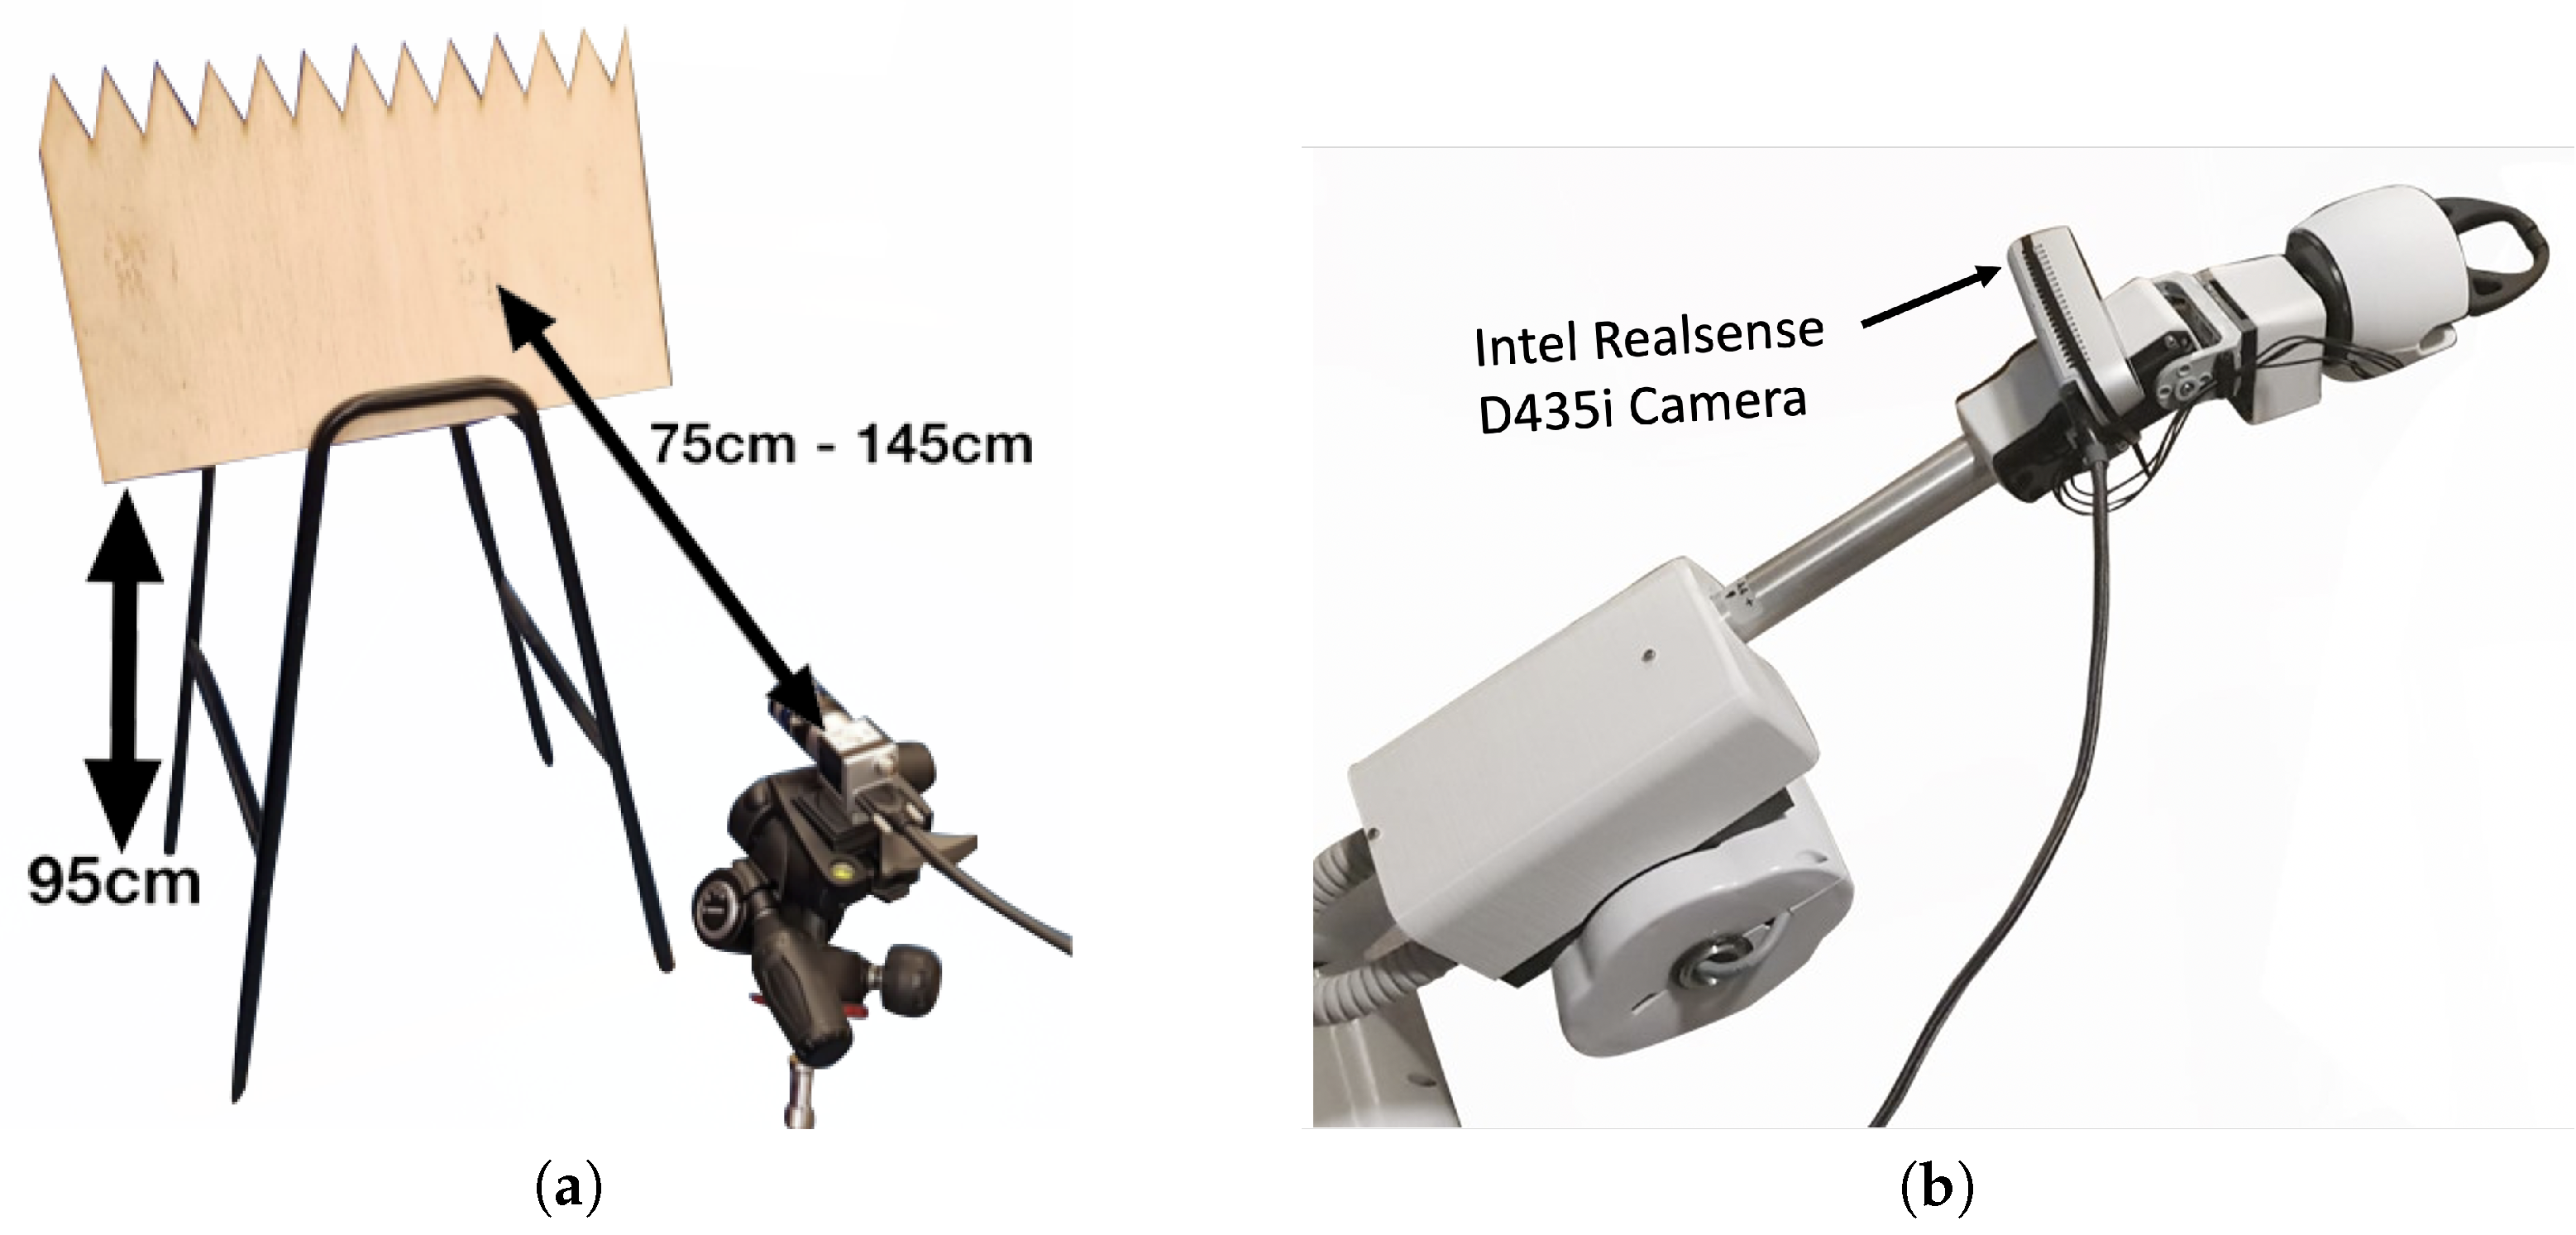
A set of environmental experiments was designed, using the factorial design technique to understand the effect and relationship between significant environmental variables [31]. The four environmental variables used were Camera Focus, Camera Aperture, Environmental Lighting and Distances from Target. These variables and their factorial maximum and minimum settings can be seen in Table 1. The use of the factorial design of experiments resulted in an increased speed of experimentation, due to variables being limited to the minimum and maximum setting, and allowing the calculation of both dependency and interdependency scores for each variable and combination of variables. Each variable combination was recorded, and a test image was taken with an industrial RGB camera using the workflow shown in Figure 6 with the setup seen in Figure 7a. Once the camera was detected and an image frame was grabbed, proprietary software was used to covert the camera frame to an OpenCV compatible BGR colour formatted image. Tolerances were then generated from this image using the median pixel density, limiting the amount of tuning needed. Finally, Canny Edge was run with these settings, and an output image was exported and analysed. These images were systematically scored against a ground truth test image to show the effects that a combination of variables had on image quality and feature detection.
Once the dependency and interdependencies of variables were established, an optimal environmental setup was created for feature detection and tracing.

3.2. Acute Feature Detection and Tracking

Experiments were conducted that tested the algorithm’s edge detection and tracing ability when parallel to a face with a 90 acute edge. A setup was created in Gazebo, to allow easier and quicker changes to the setup. The workpiece was suspended 90 cm off the ground, with a camera an optimal distance away. The algorithm detected the edge and attempted to trace it moving from point to point. These experiments aimed to ensure that the algorithm could detect the correct edge and corresponding local coordinates, ready for tracing.
Once the pixels were identified, they were converted from the camera’s local coordinate system, into 3D coordinates, into the robot’s global coordinate system. Once completed by deprojecting the 2D coordinates into 3D coordinates and applying a transformation matrix and offset, an experiment was conducted to test the agent’s accuracy. The transformation matrix represented the difference between the current state of the robotic joint the camera is mounted to and the robot’s base, as this contained both the distance and the rotation of the camera compared to the bottom of the robot. The physical robot was given a hollow 3-dimensional workpiece to trace, and the initial point was identified (Figure 7b). A physical marker was then placed on the workpiece where it would be expected to move, allowing a comparison between the predicted and actual positions. The hollow workpiece was 1 m by 1 m and had 10 cm edges to be traced. The edges were made thick enough to support the structure while also ensuring that the workpiece tracing is hollow on the inside to measure the offset and ensure no damage to the kinematic arm.
In order to verify the simulated experiments, some final simulated acute edge detection experiments were conducted. An example aerostructure was imported in the simulator (similar to the one seen in Figure 1), and various amounts of Gaussian noise were added to the camera feed. The aerospace structure was roughly 1 m long, and 10 cm high, and had a variety of spacial changes along its prominent edge. As Table 2 shows, 16 different levels of Gaussian blur were added by modifying the variance (amount of noise) and mean (saturation of the noise) variables. These were calculated by experimenting until the output image was unreadable, therefore getting a broad range of variables. The gaussian blur results were compared against an averaged ground truth result, which had no blur. The ground truth was obtained by getting the average of ten different non-blurred results to ensure that the ground truth was accurate.

3.3. Obtuse Feature Detection and Tracking

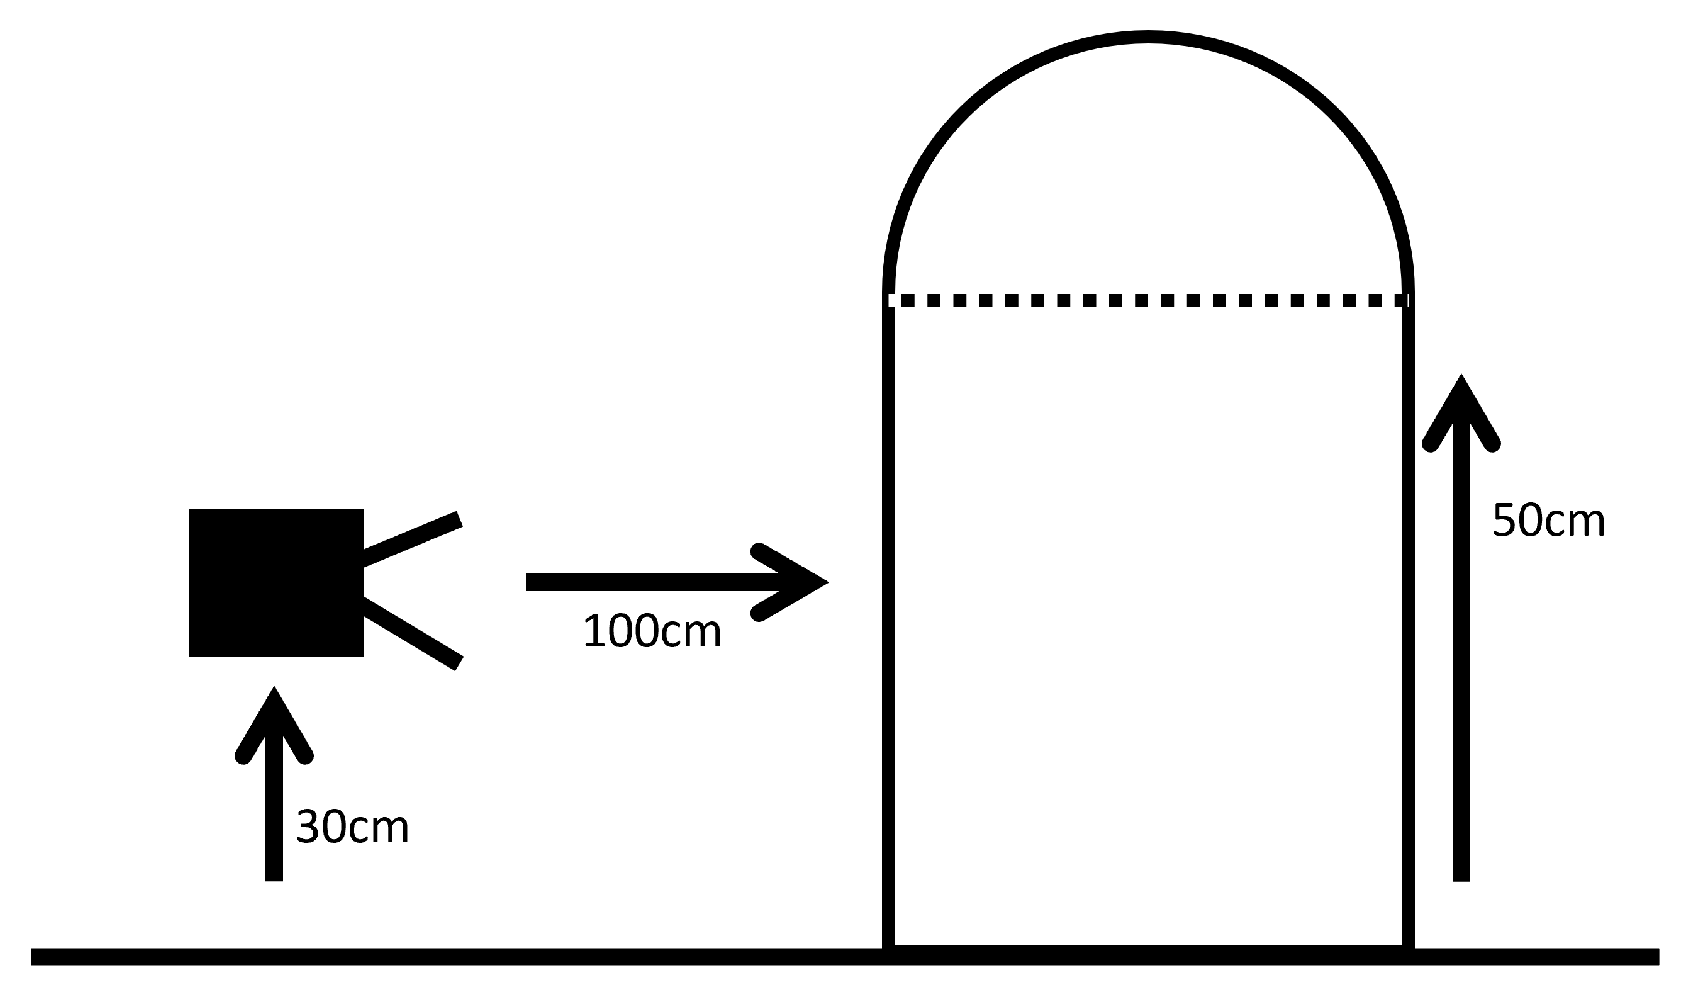
Multiple experiments were planned to test this algorithm and its effectiveness at finding the point at which curvature starts. A simulated setup was created where a 1 × 0.5 × 0.5 m cuboid with an equally sized semi-cylinder on top was spawned. The camera was spawned facing this object at the height of 30 cm off the ground (Figure 5). All absolute positions of the workpiece were recorded, and multiple runs of the simulation were performed. The aim was to see how accurately the curved edge was detected compared to the known absolute values. Throughout these tests, the distance and angle of the workpiece varied, ensuring that the algorithm was robust at a range of distances and workpiece inclines.

3.4. Physical Detection and Tracing

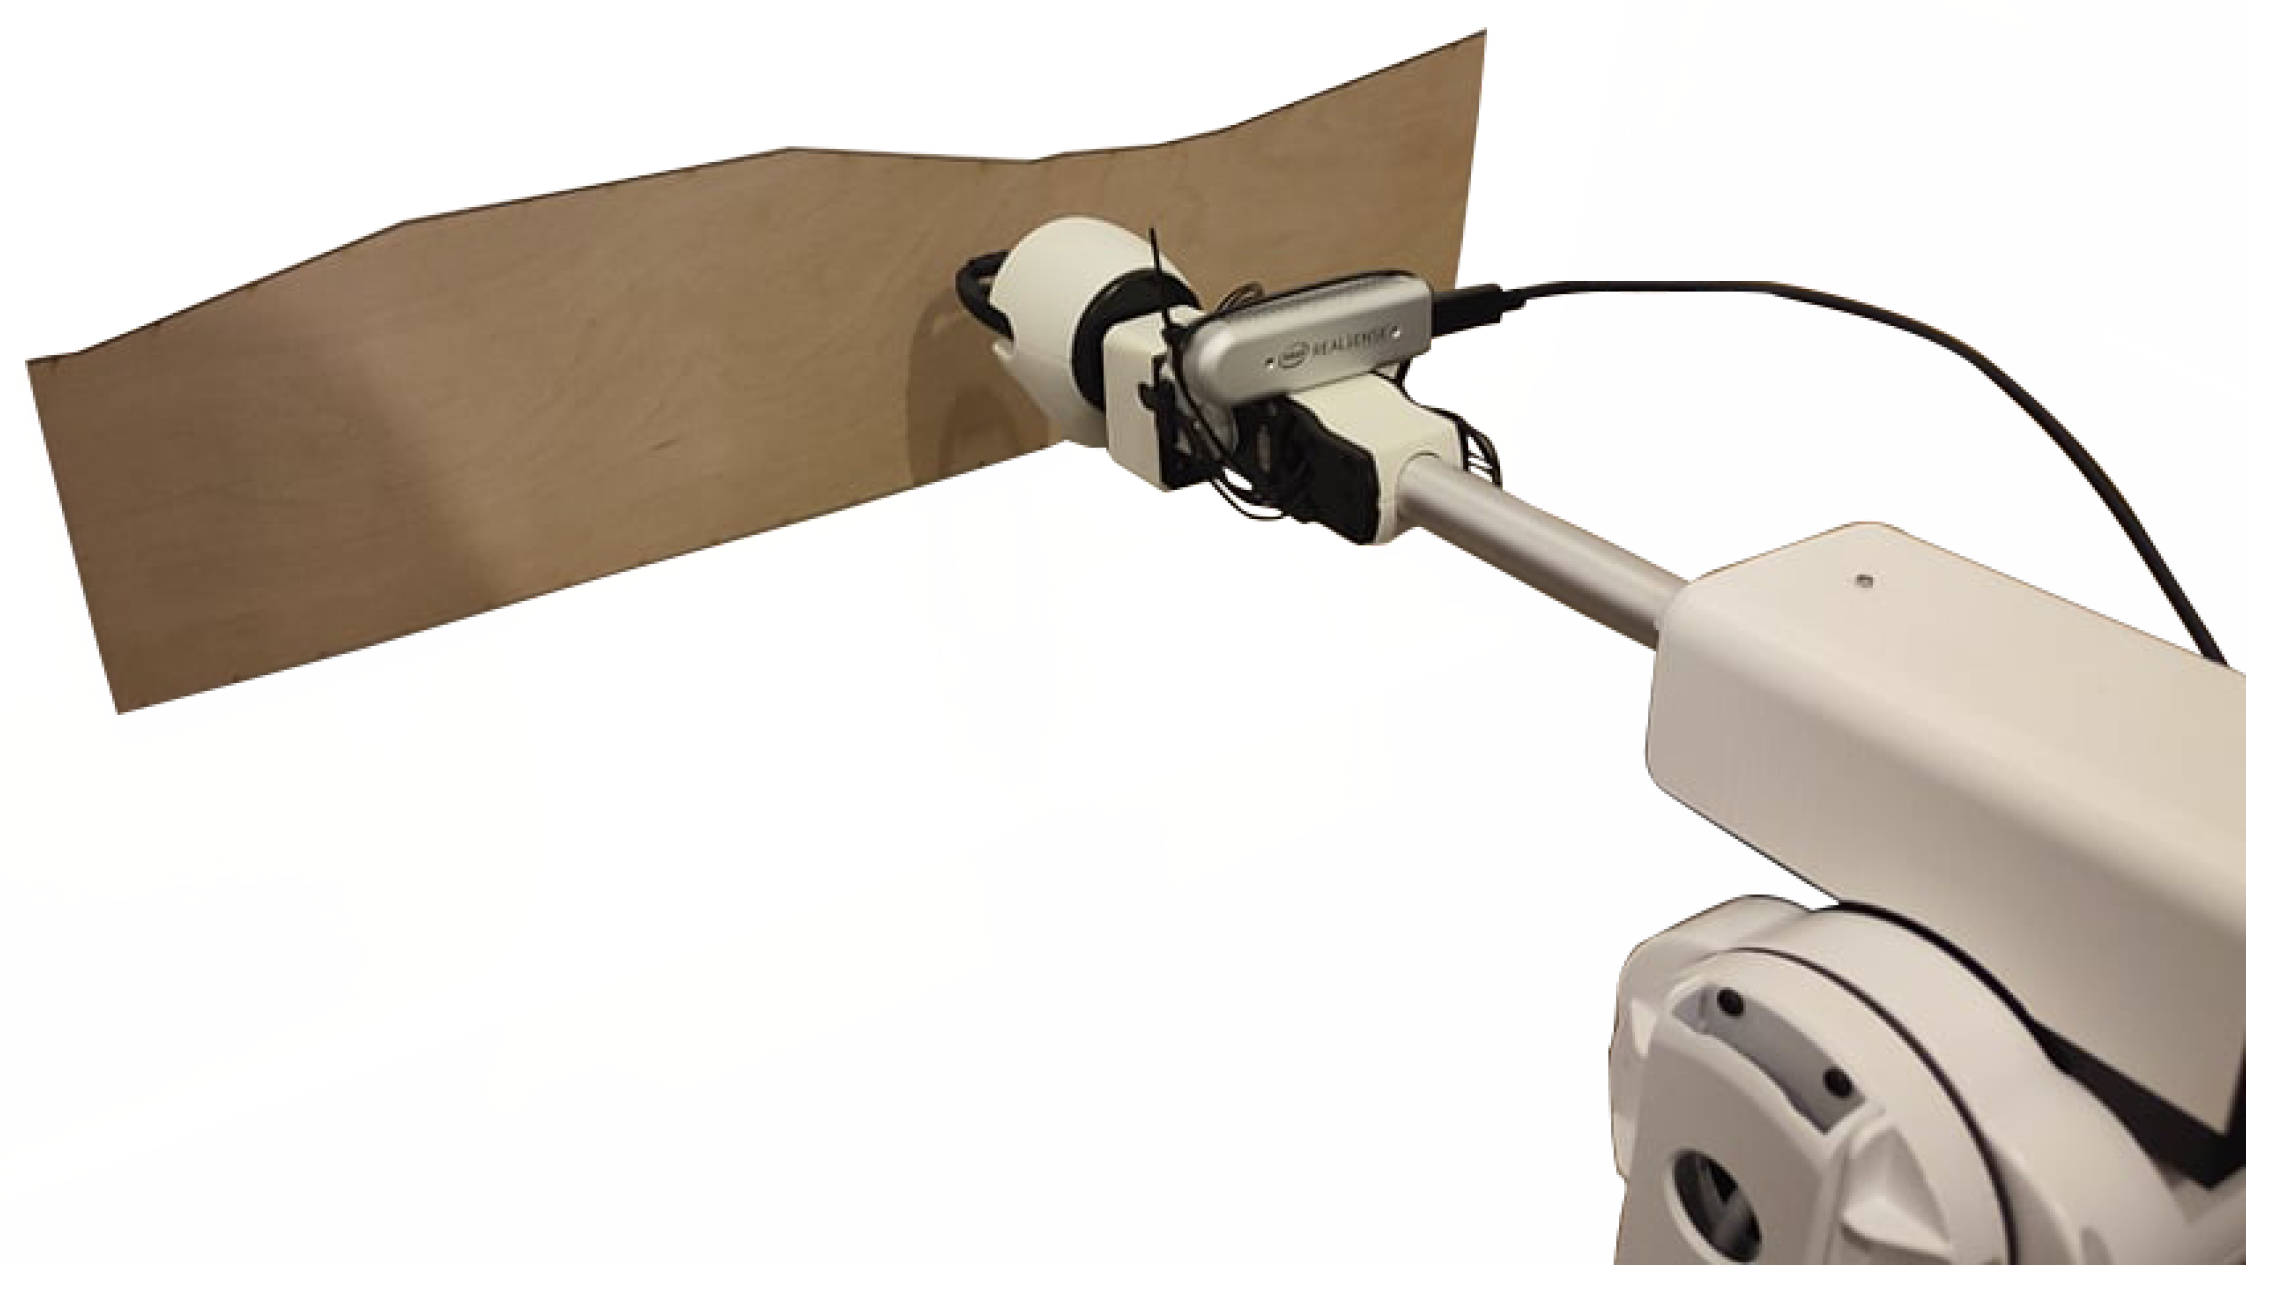
Once the algorithms were tested and proven in simulation, physical experiments were completed to show the algorithms used with a physical robot, camera and workpiece. A set of experiments were conducted to test the feature tracing capabilities of the arm, initially using a hollow 3D workpiece (Figure 8) to trace multiple different points independently, and then three reference workpieces for the arm to trace, inspired by existing aerostructures (Figure 9, Figure 10 and Figure 11).
The workpieces were all inspired by existing aerospace structures and took specific abstract features which could be used to test the algorithm. The initial workpiece was hollow and constructed out of cardboard, measuring 500 mm by 350 mm by 350 mm. This was initially used to safely test feature accuracy, to ensure that camera detected features could be reached. Due to the workpieces narrow edges, the arms 3-dimensional accuracy could also be tested quickly.
Another three workpieces were also constructed, more closely mimicking typical aerostructure design, created from a range of materials. The initial workpiece was a scaled-down aerostructure made from 3 mm plywood, measuring 600 mm by 170 mm. Using a more abstract aerostructure design, a second workpiece was made out of 3 mm Perspex and measured 400 mm by 200 mm. With both of these workpieces in conjunction, the algorithm could be tested against various realistic workpieces, ranging in dimension and material.
A final workpiece was constructed to mimic the curved part of an aerostructure, to test the obtuse edge detection and tracing aspects of the system. It was a piece of flexible 6 mm MDF (Medium-Density Fibreboard) measured 1220 mm by 607 mm and was curved, creating a workpiece measuring 607 mm by 470 mm by 520 mm.

4. Results and Discussion

4.1. Identification of Best Environmental Parametres

Experiments were done where the camera would be pointing directly at a highly detailed and complex workpiece. The workpiece was created by laser cutting a 3.6 mm thick plywood and was used to test the robustness of the cameras and algorithms.
For each test case, an environmental variable was changed to give a different resulting image. The obtained standard image and an image showing the outlines were recorded. From these experiments, the effects certain variables had on the image quality were calculated and an optimal setup was identified. Table 3 shows the effect each variable and combination of variables had on image quality. The effect each variable has was decided by scoring all the final images out of 100 by comparing them to a ground truth image and evaluating the strength and clarity of the outline of the photos.
By analysing Table 3, conclusions can be drawn regarding the variables used and their effects on each other.
  • While on its own, the aperture had a significant effect on the final image, as expected, as it controlled how much light was let into the lens as well as the lens depth of focus. When combined with lighting, these became the two variables with the strongest interdependencies. This was expected as the two variables complemented each other and directly affected how the other one would affect the image;
  • Similarly, the second strongest interdependency was focus and distance. Individually both of these variables had little effect on the final image but combined, they interacted to either create a focused image or one which was entirely out of focus;
  • Unsurprisingly, the variable with the smallest impact was the environment’s lighting, due to how the minimal lighting setting selected was not total darkness, but having one of the possible three lights on, producing a value of 478 lux. This was done to consistently provide usable images and not cause anomalies with the other variables.
These experimental results had some similarities with the work reported in the literature, for example, by [32], where canny edge detection was used, at 5.66 lux, edges became visible and detected, but at anything over 87 lux, the interior of the object was detected as well. This was reflected in many of the tests conducted, as seen in Figure 12, where the image’s interior is fully detected. This was counterbalanced by adjusting the aperture, which aided in creating an optimal setup.
Using the experimental results and other knowledge within the literature, an optimal environmental setup was created. The resulting setup required the workpiece was closer to the camera (within 1 m), the focus to be set to match this on a case-by-case basis (so the sharp features of the workpiece were clear), and setting a high aperture while having lower environmental lighting.

4.2. Feature Identification and Tracing

To show the feature detection capabilities of the method, experiments were conducted individually on both the acute and obtuse detection systems, which built on top of each other.
Two sets of analysis were conducted: (1) To check the robustness of the acute detection, a workpiece was positioned in front of a virtual camera, and two checks were made. Firstly, could the camera successfully detect the outline of the workpiece and, secondly, that the initial detected pixel of the traced line was the expected, correct pair; (2) To check the capabilities of the obtuse edge detection, a workpiece was placed 1 m away from a simulated Intel Realsense camera positioned 30 cm up in the air. The camera was then tasked to find the point at which the curve began and trace this point across the whole shape. The resulting ‘edge’ would then be traced by a kinematic arm, a task needed in specific manufacturing tasks.

4.2.1. Acute Feature Identification and Extraction

The first condition was checked purely by viewing the output image, whereas the second condition was checked by having the specified pixel printed out on screen and checked against a known value. By testing this, both the accuracy of the edge and initial pixel detection was established. This is important since the cameras edge detection, and specifically, initial pixel detection was the primary source of information for where the kinematic arm needed to move to for workpiece tracing.
A simulated workspace was created, where a 1 × 0.5 rectangular workpiece was placed 0.6 m away from an Intel Realsense D435 camera at various locations within the world (Figure 12). These locations varied by moving the object from left to right across the camera’s frame and increasing or decreasing the distance to the camera by 10 cm either way. Out of the ten times this was tested, eight of the ten tests successfully detected the rectangular workpiece and identified the first pixel of that edge. The two exceptions were anomalies where more than 1 face could be seen in the frame, resulting in an extra edge being detected initially. This shows the importance of the workpiece needing to be parallel to the camera and ideally as central to the camera frame as possible.
Once it was established the outline could be detected and the correct pixel set could be found, a test was run to ensure that the correct local 3D coordinates could be deprojected. By deprojecting the coordinates, this allows a local 3D view of the camera and workpiece to be established, an essential step in allowing the arm to trace the workpiece without needing preprogrammed information relating to the position of the workpiece. A test was run where a small workpiece was moved systematically across the camera’s frame of a simulated Intel Realsense D435i. The output coordinates of the first detected pixel were then checked for accuracy by geometrically measuring the distance from the camera to the initial pixel. These data were then used to inform on the accuracy of the deprojection and data related to the accuracy across the frame.
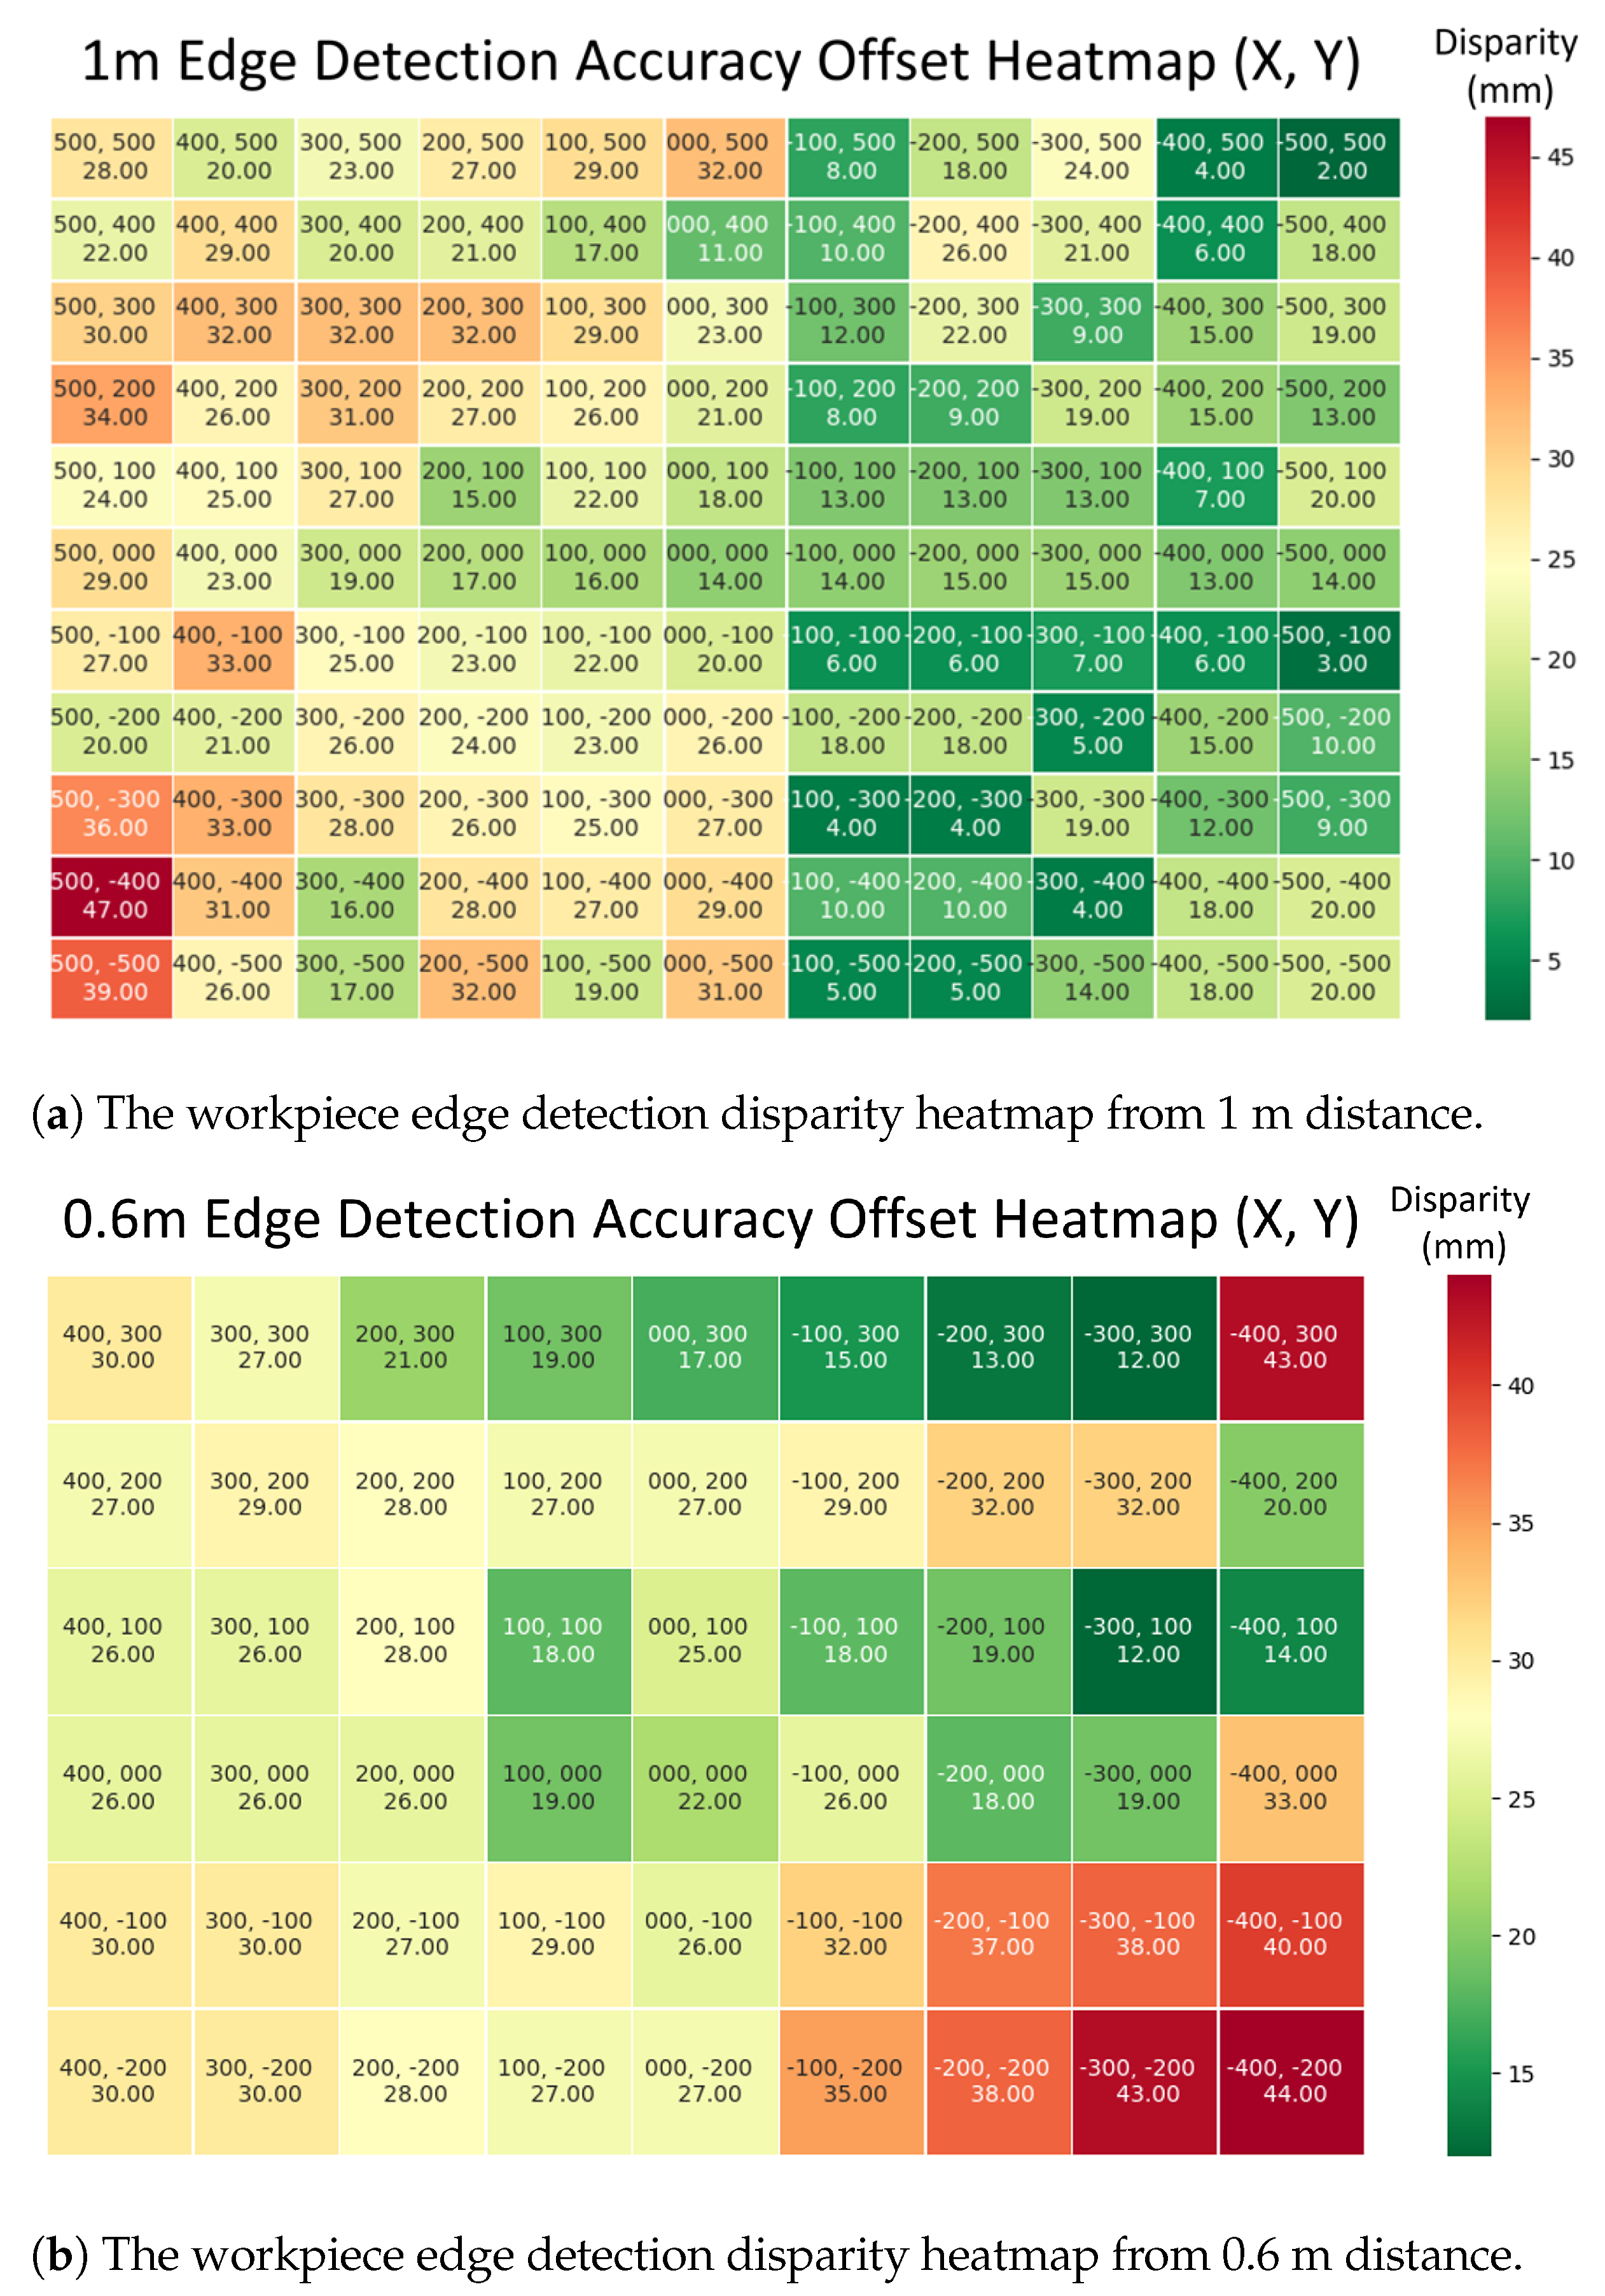
As seen in Figure 13, the results were mapped to a heat map; Figure 13a was 1 m, while Figure 13b was at a distance of 0.6 m. By looking at the heat maps and the discrepancy between what was recorded and the ground truth, patterns began to emerge. While the overall accuracy of the deprojection showed a discrepancy of 50 mm or less, a large amount of the detected pixels were within 20 mm or less, an acceptable tolerance, given the tracing task requirements. Additionally, there was a clear accuracy difference between the left and right sides of the frame, broadly favoring the right side at all distances. This is related to the Intel Realsense’s lens setup and how deprojection is achieved. Since the depth-sensing lens was positioned on the device’s right side, and deprojection relies on depth data to inform its Z coordinate, this difference was not unexpected. This holds less true as the camera gets closer, showing a pattern of poor accuracy towards the bottom-right of the frame as the camera gets closer. This is due to the algorithm incorrectly interpreting the environment’s Z value as the workpiece’s; something which can be corrected via making multiple readings before assigning a Z value. By identifying these eccentricities, this information could be leveraged for later experimentation when designing control patterns for the inspection and observation of workpieces, prioritising the more accurate side of the frame. Specifically, if using a probabilistic model of control, more certainty could be applied to the upper-right side of the lens to decrease the uncertainty of the world state when compared to just observing with the left.
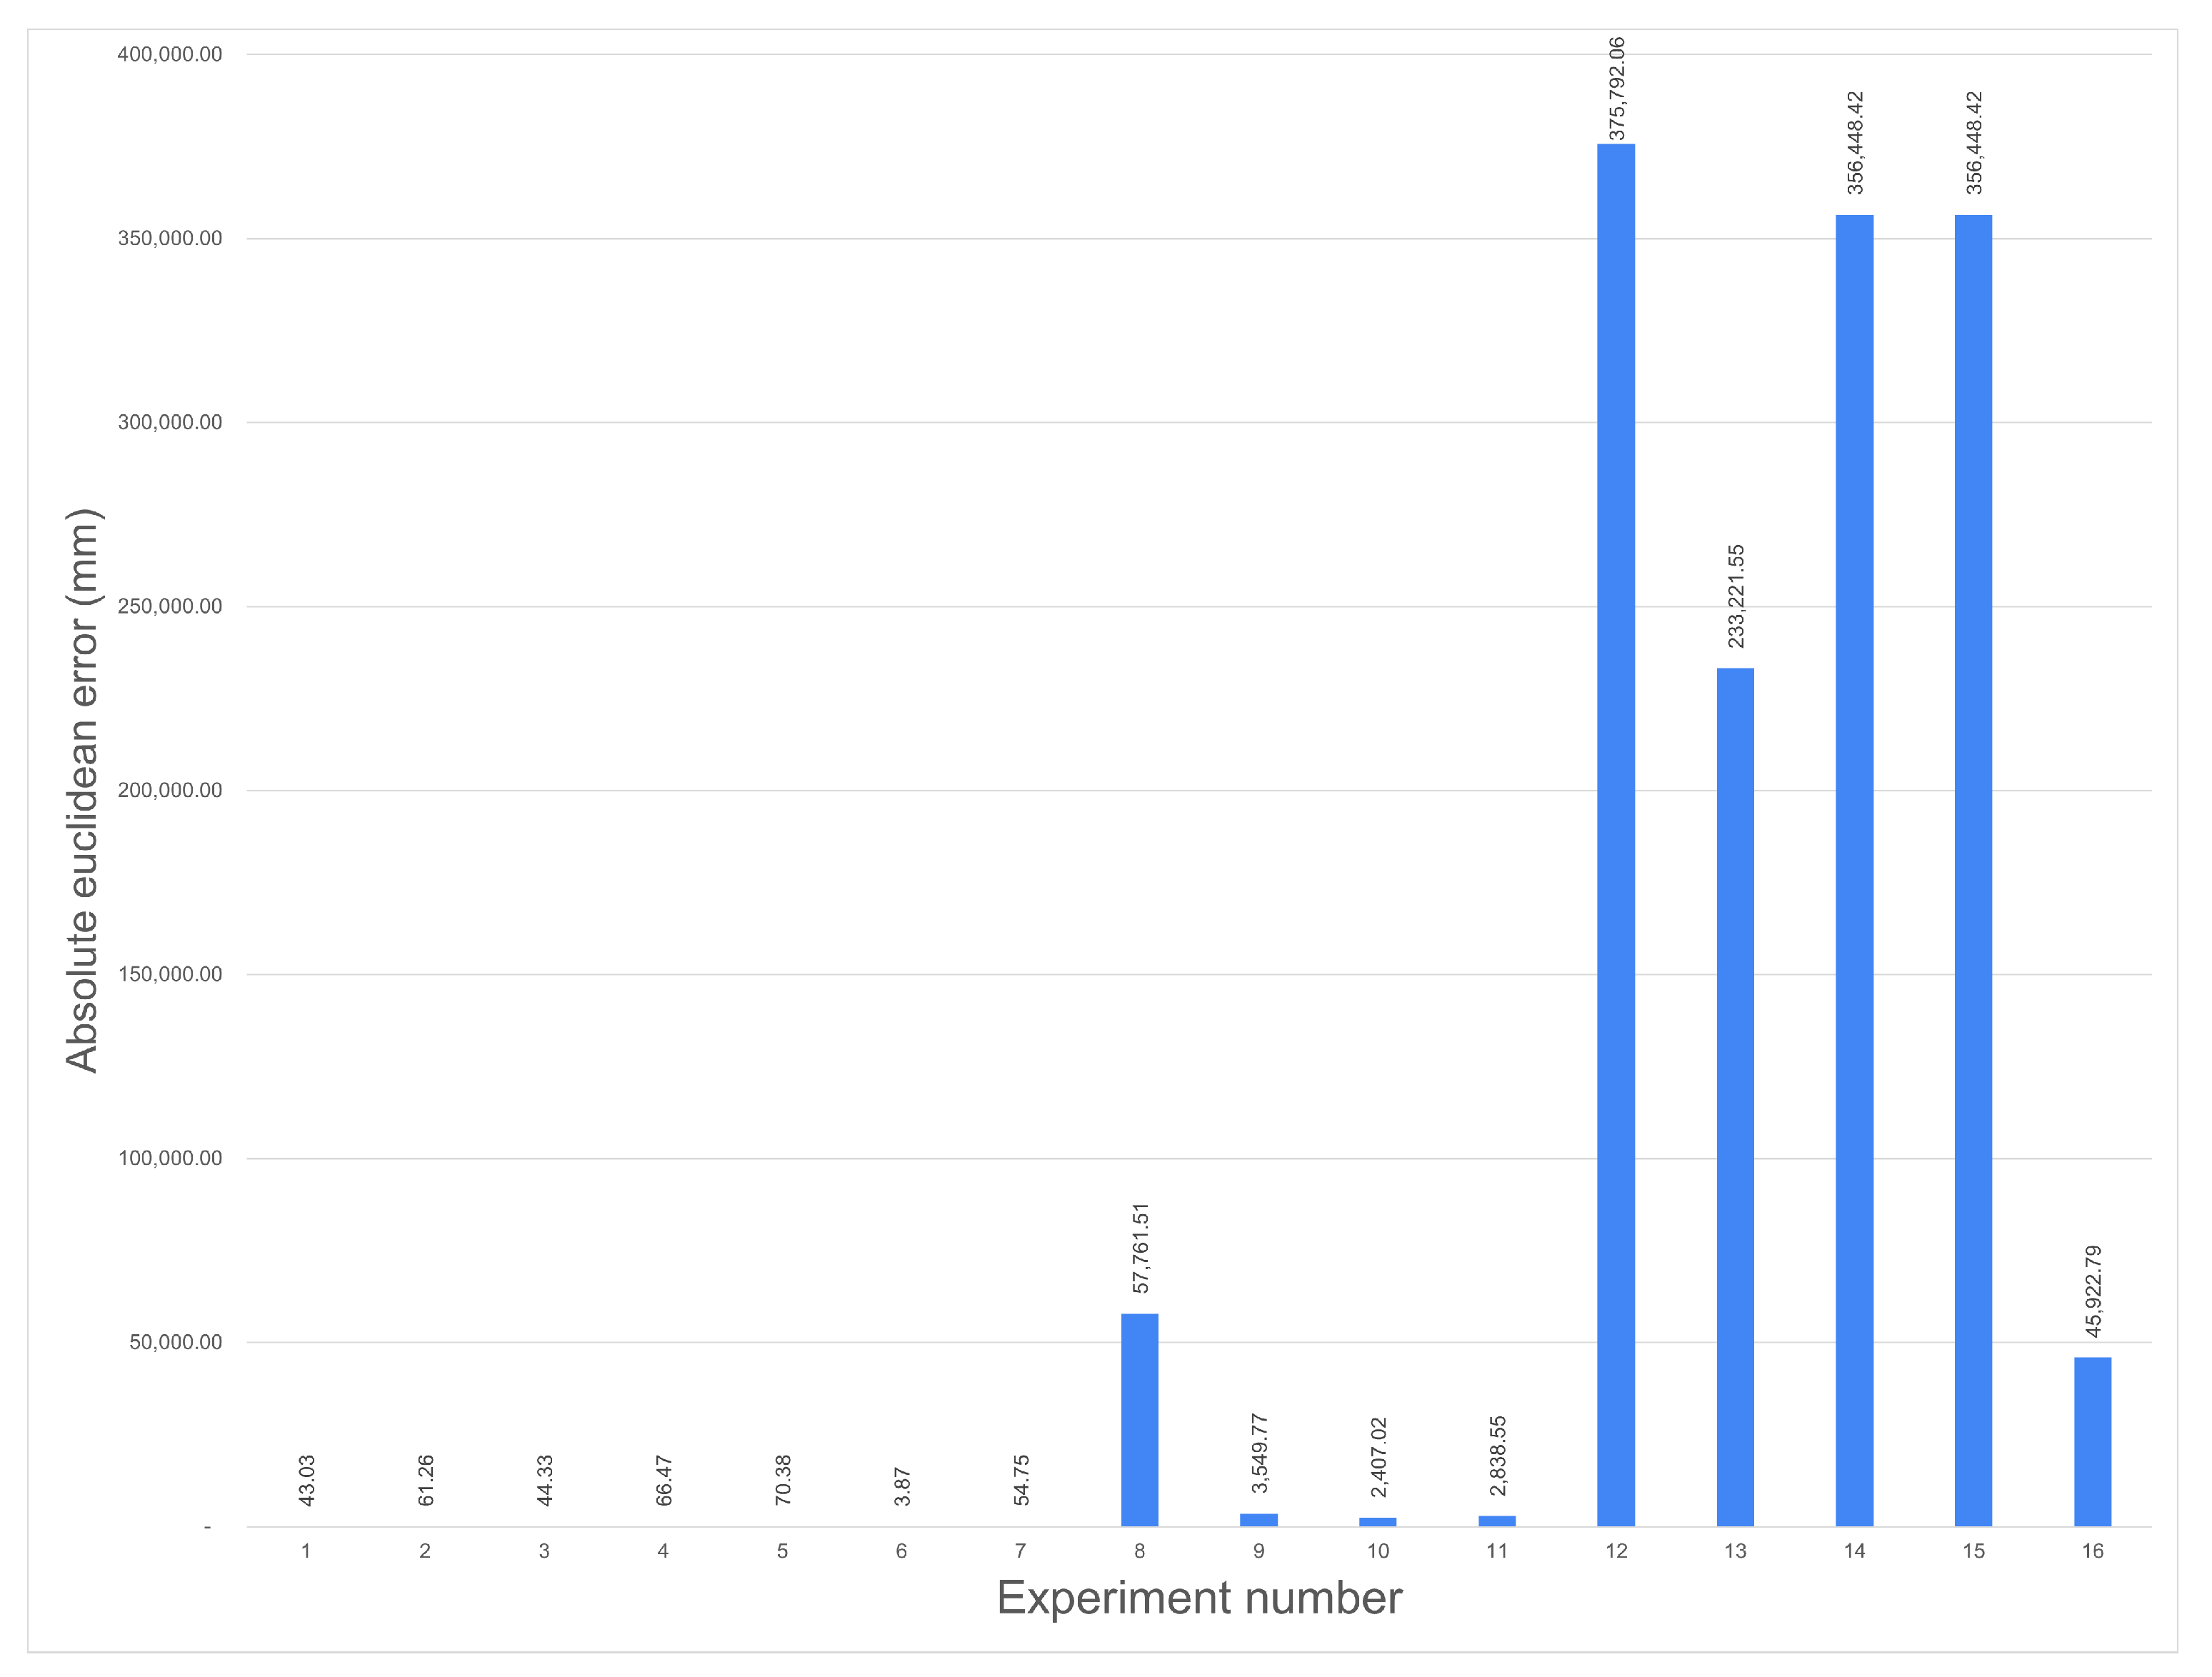
Once the algorithm detected a simple workpiece successfully, it was tested on a complex workpiece with additional noise for verification. Figure 14 shows the absolute disparity between the gaussian blur and the averaged ground truth output. The algorithm is robust enough not to be affected by blur with a variance of six or less until the mean is increased to its maximum setting of 18, at which point it deviates from the ground truth. This is because the edge detection algorithm is sensitive to light, so once the noise gets heavily saturated, the algorithm will start detecting false positives more frequently. This pattern can be seen again for experiments nine through 12, where the high level of variance has little effect on the algorithm until the mean is increased. The final four experiments have such a large amount of variance that the edge detector was producing many false positives. In most cases, the edge detector failed to get a precise reading. The only time it did not was when the mean was increased to its maximum, which produced such a bright amount of noise, the algorithm ignored the noise entirely and successfully traced the edge with only a few false positives.
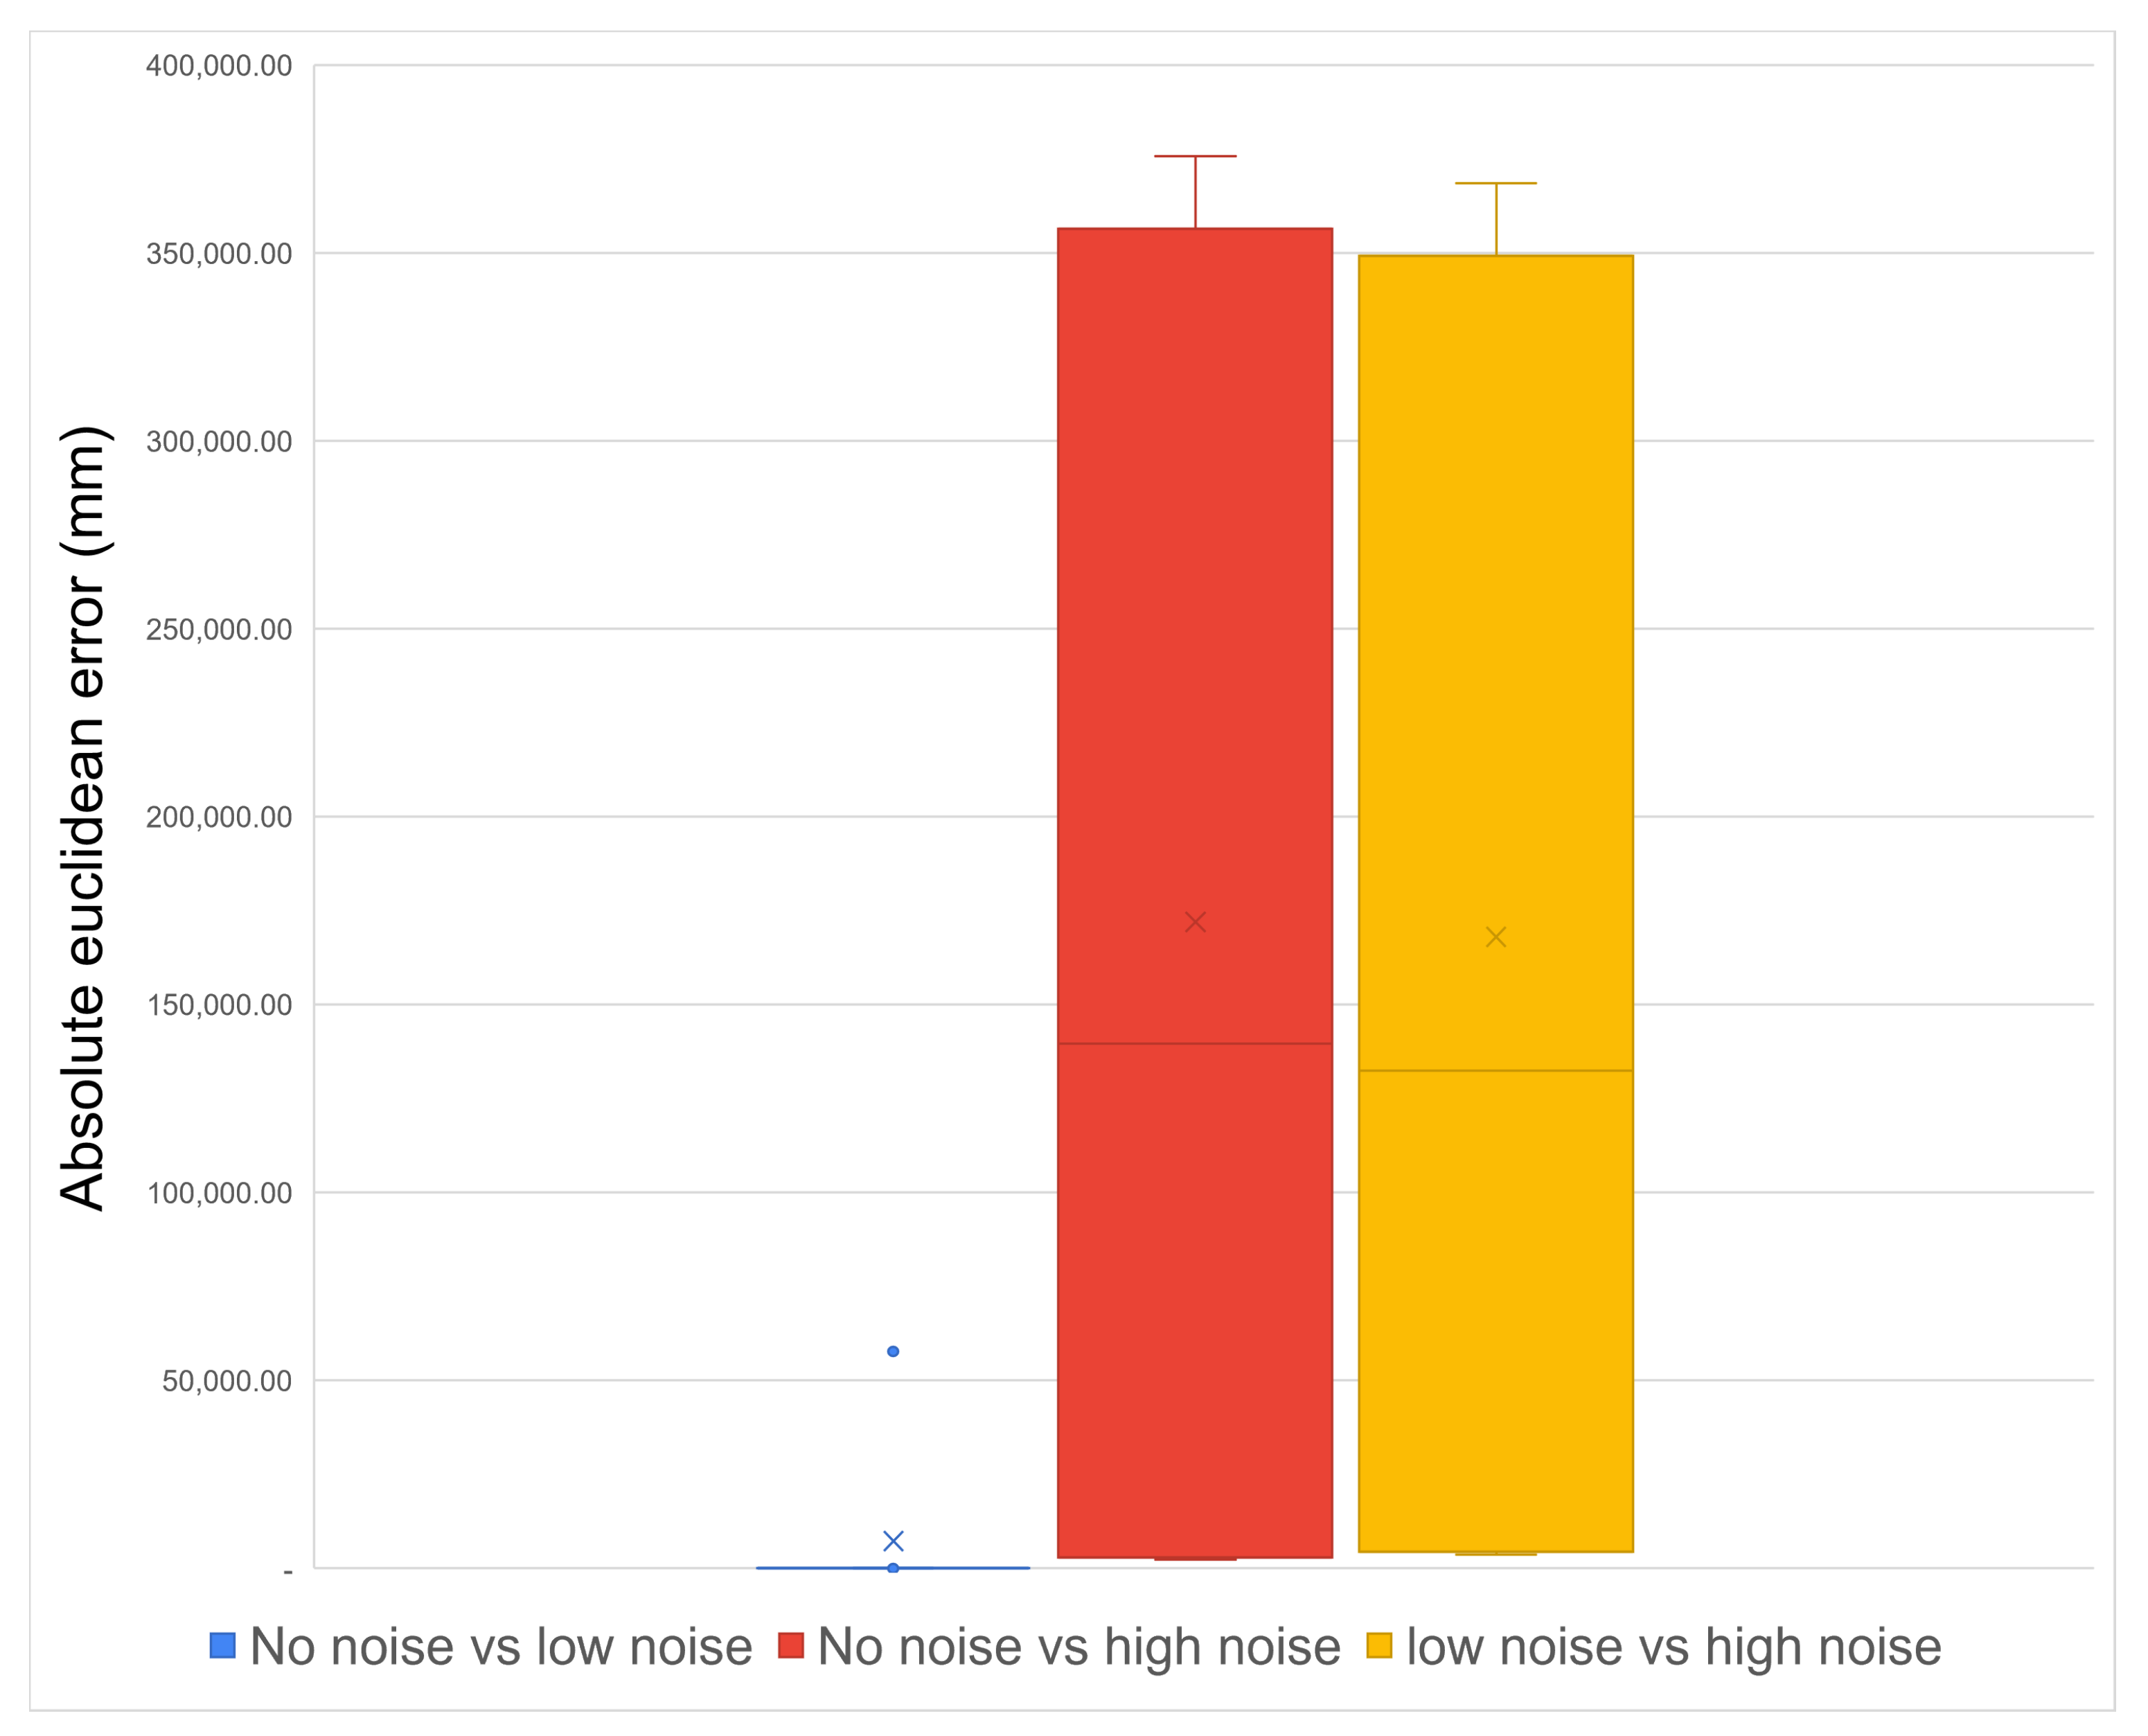
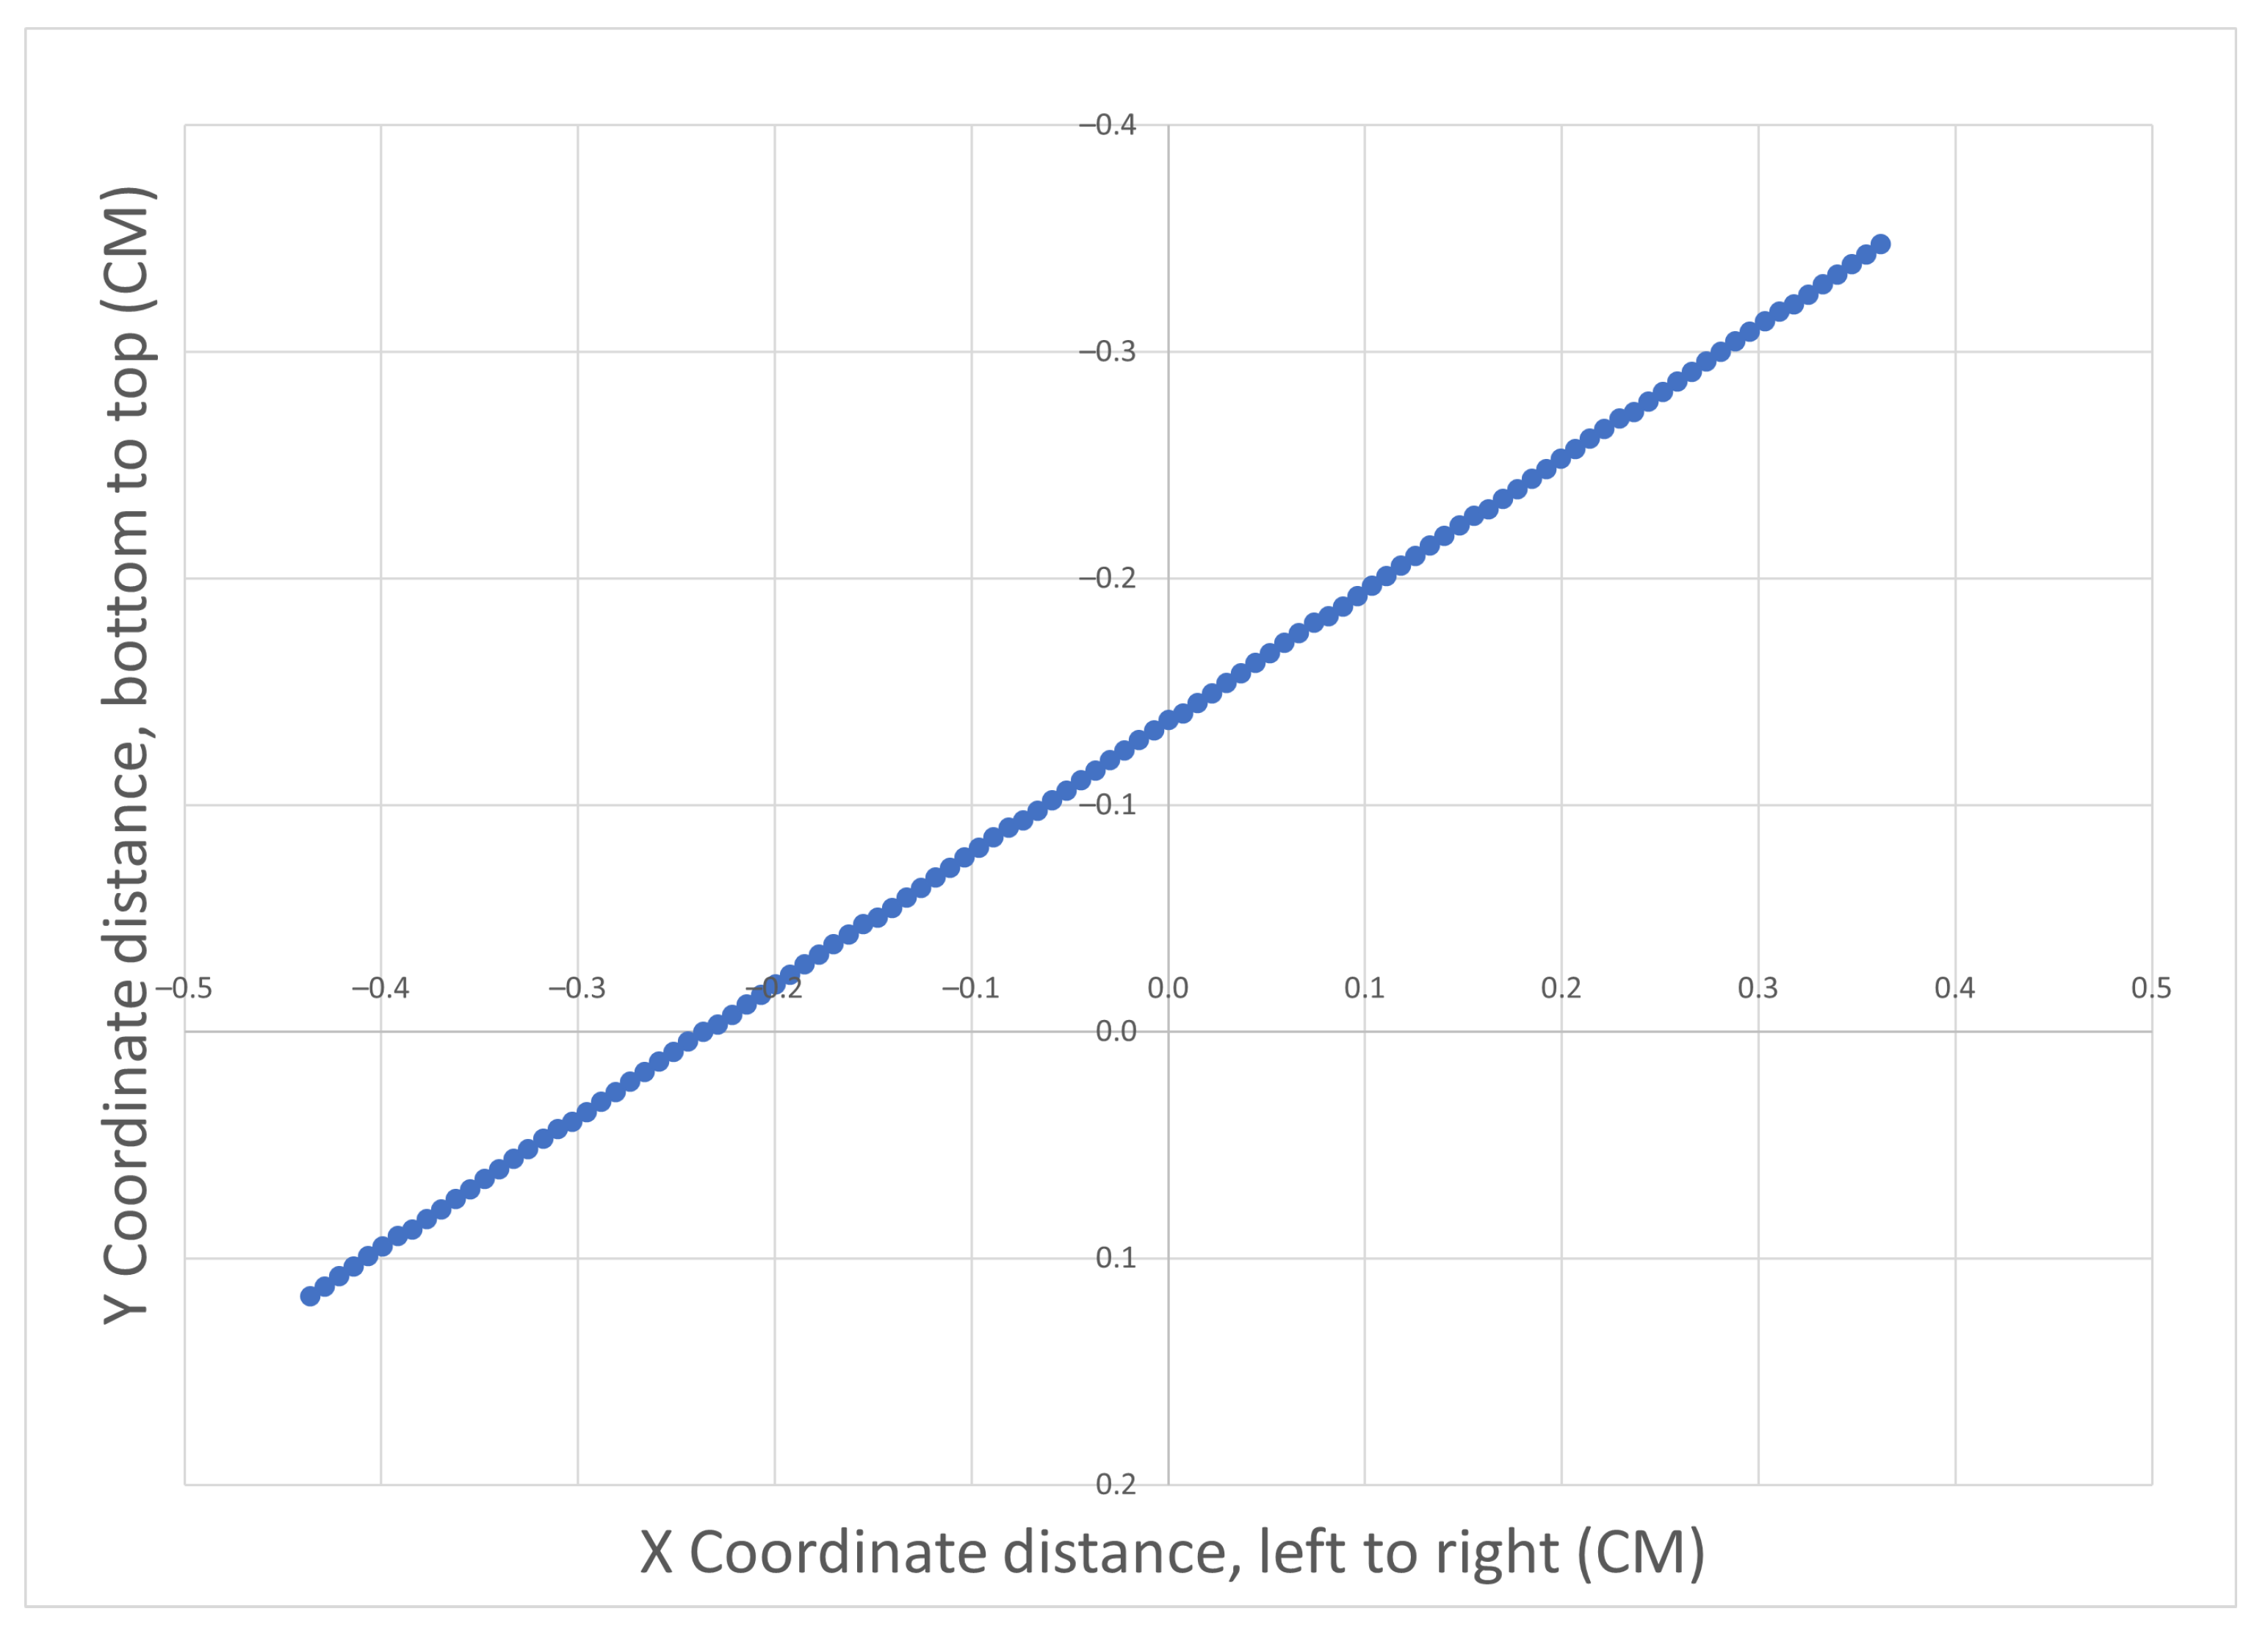
Further analysing the results via Figure 15 and Figure 16 shows how different results compared with each other. The experiments were put into two groups: Low Noise (Experiments 1 through 8) and High Noise (Experiments 9 through 16). By comparing these groups against each other, a better effect of the noise overall can be examined. The error of low noise compared to no noise is very low, almost having no effect, excluding the outlier with an error of 50,000 mm. This can be seen again when comparing the results of the high noise group when compared to both the no noise and low noise groups, with them only having a difference of less than 1000 mm.
By adding such a varying amount of noise to these experiments and requiring the system to trace a significantly more complex shape than in previous experiments, the system’s robustness is proven. The real-world cameras previously suggested for edge tracing would produce a noise level far less than anything used in this experiment, showing that while many of the experiments performed in this paper are simulated, the results they output are still valid.

4.2.2. Obtuse Feature Identification and Extraction

An initial test was conducted, with the workpiece and camera 1 m away and the camera 30 cm off the ground plane. The expected height of where the flat surface of the workpiece transitions into a curve was 50 cm off the ground plane; therefore, the expected local height coordinate would be 20 cm. The resulted detected height was a consistent 24.3 cm across the whole workpiece (Figure 17). The resulting absolute difference between the expected and actual result was 4.3 cm when viewed from 1 m away. Other measured factors of the experiment such as computation time produced acceptable results, detecting the whole workpiece in under 2 s.
An additional experiment was carried out to verify the previous results and to understand the offset better. A similar simulated setup was created, but the camera was 0.75 m away from the workpiece, compared to 1 m. The results were very similar (Figure 18), with an offset of 4.58 cm, compared to the previous offset of 4.36 cm. Given the algorithm checked for a curvature increase every 5 mm, the offset could be related to a combination of factors, such as the rate of curvature of the workpiece (10 mm ± 5 mm), the accuracy of the simulated depth cloud or the position of the lens of the Realsense D435 compared to the cameras origin position.
One final experiment using a non-parallel workpiece was conducted, positioned 1 m away from the camera, at a 30 angle (Figure 19). The detected edge deviated by 2 cm from the ground truth at its maximum height, with a maximum detected height of 34.7 cm. Across the whole detected edge, the difference between the detected edge and the ground truth fluctuated between the expected 2 cm and 4 cm. Given this slight deviation, a line of best fit could be drawn through all these points to define better the boundary between flat surface and curvature to provide a more accurate edge for an arm to trace.
In all cases, the computational time of finding the points at which flat surfaces become curved was low, usually under 2 s from program execution. Since the algorithm relied on an organised pointcloud, this allowed quicker indexing of pixel coordinates. Additionally, only the non-curved part of the workpiece is analysed, and not the whole curve, since the goal is to find the point at which the curve starts, not the whole curve. By leveraging the information we had, such as always having an organised pointcloud, the technique shown was fast and efficient and reasonably lightweight, not requiring any heavy graphics processing such as CUDA (Compute Unified Device Architecture).

4.2.3. Feature Tracing

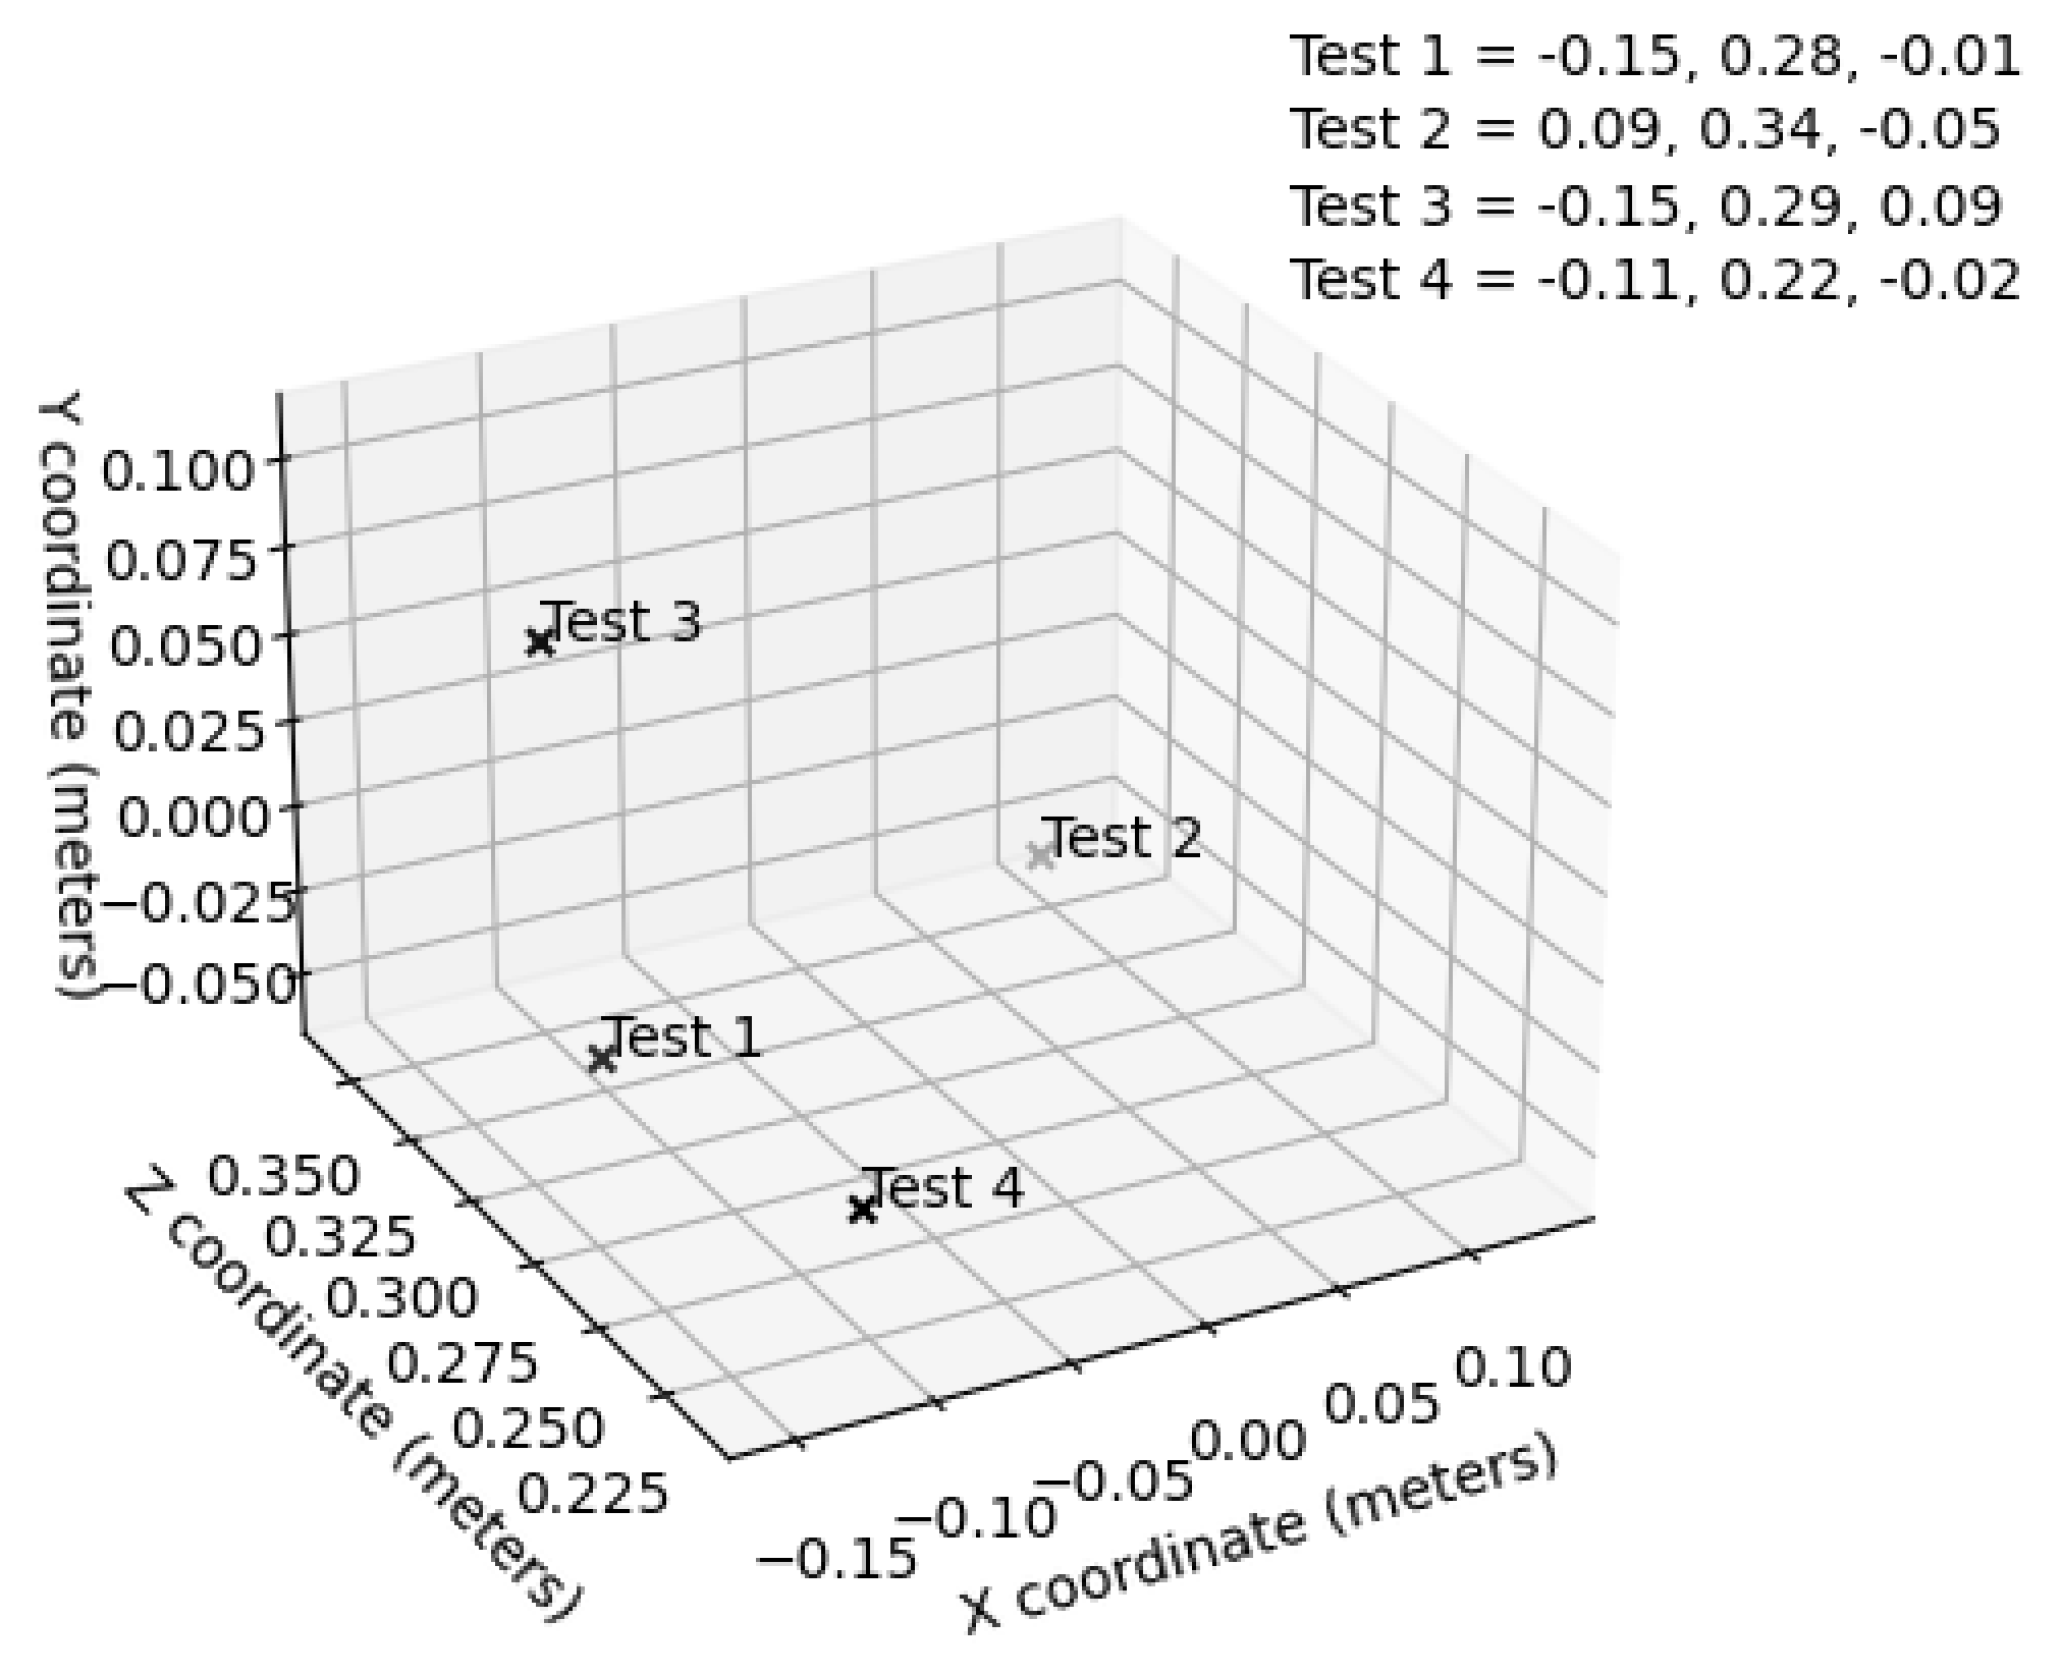
A hollow 3-dimensional workpiece was placed in various positions alongside the workpiece, alongside the kinematic arm, to allow the kinematic arm to trace and detect different features in different positions. By doing this, a better understanding of how accurate the arm was at different distances was understood. While the robots maximum reach was 550 mm [33], this was vague in practical applications, as the height, width or distance of what the agent would be tracing is unknown until the time of detection. This is best demonstrated in Table 4 and Figure 20, where four different features were detected and traced in a variety of distances and positions, and the accuracy of the robot’s final position compared to its expected position was recorded.
Tests 1 and 2 were unsuccessful, due to the reach limitations of the robotic arm being used, with the arm prioritising movement in the X-axis, then Z, and finally Y. This explains why the offsets for the first two tests were minor on the X and Z-axis (within 5 cm), but were over 10 cm in the Y. Once the workpiece was positioned closer to the arm, as seen in tests 3 and 4, the arm had much more success in moving to the detected feature, having almost no offset, especially in test three.
D t = ( x t + o t x ) 2 + ( y t + o t y ) 2 + ( z t + o t z ) 2 .
Equation (1) takes the euclidean distance in 3D, incorporating the offset of the camera to the base of the robot. The D distance of the robot to the specified location at t time can be approximated through the use of the provided x, y and z coordinates, as well as there relative offsets, all at current t time [34]. Using the knowledge provided by an accurate depth-sensing camera, it can be estimated if the point can be reached from the robots current position, or if the robot would need to move first to avoid an unreachable target.
A final set of experiments was completed, combining all aspects of the previous experiments. Three aerospace inspired workpieces were created out of various materials in various sizes and were all traced using a physical kinematic arm and camera. The workpiece was placed 500 mm away from the robot, central to the workpiece, and in its home position, ensuring the workpiece was reachable by the arm. It was then tasked to detect the visible edge of the workpiece within frame and trace it.
The three workpieces being traced were all influenced by existing aerospace structures to provide a realistic interpretation for tracing actual workpieces. The workpieces were: a 600 mm cutout of the aerostructure seen in Figure 1 made out of 3 mm plywood, a 400 mm concave cutout made from 3 mm grey-tinted Perspex and a 600 mm curved edge made from 6 mm flexible MDF.
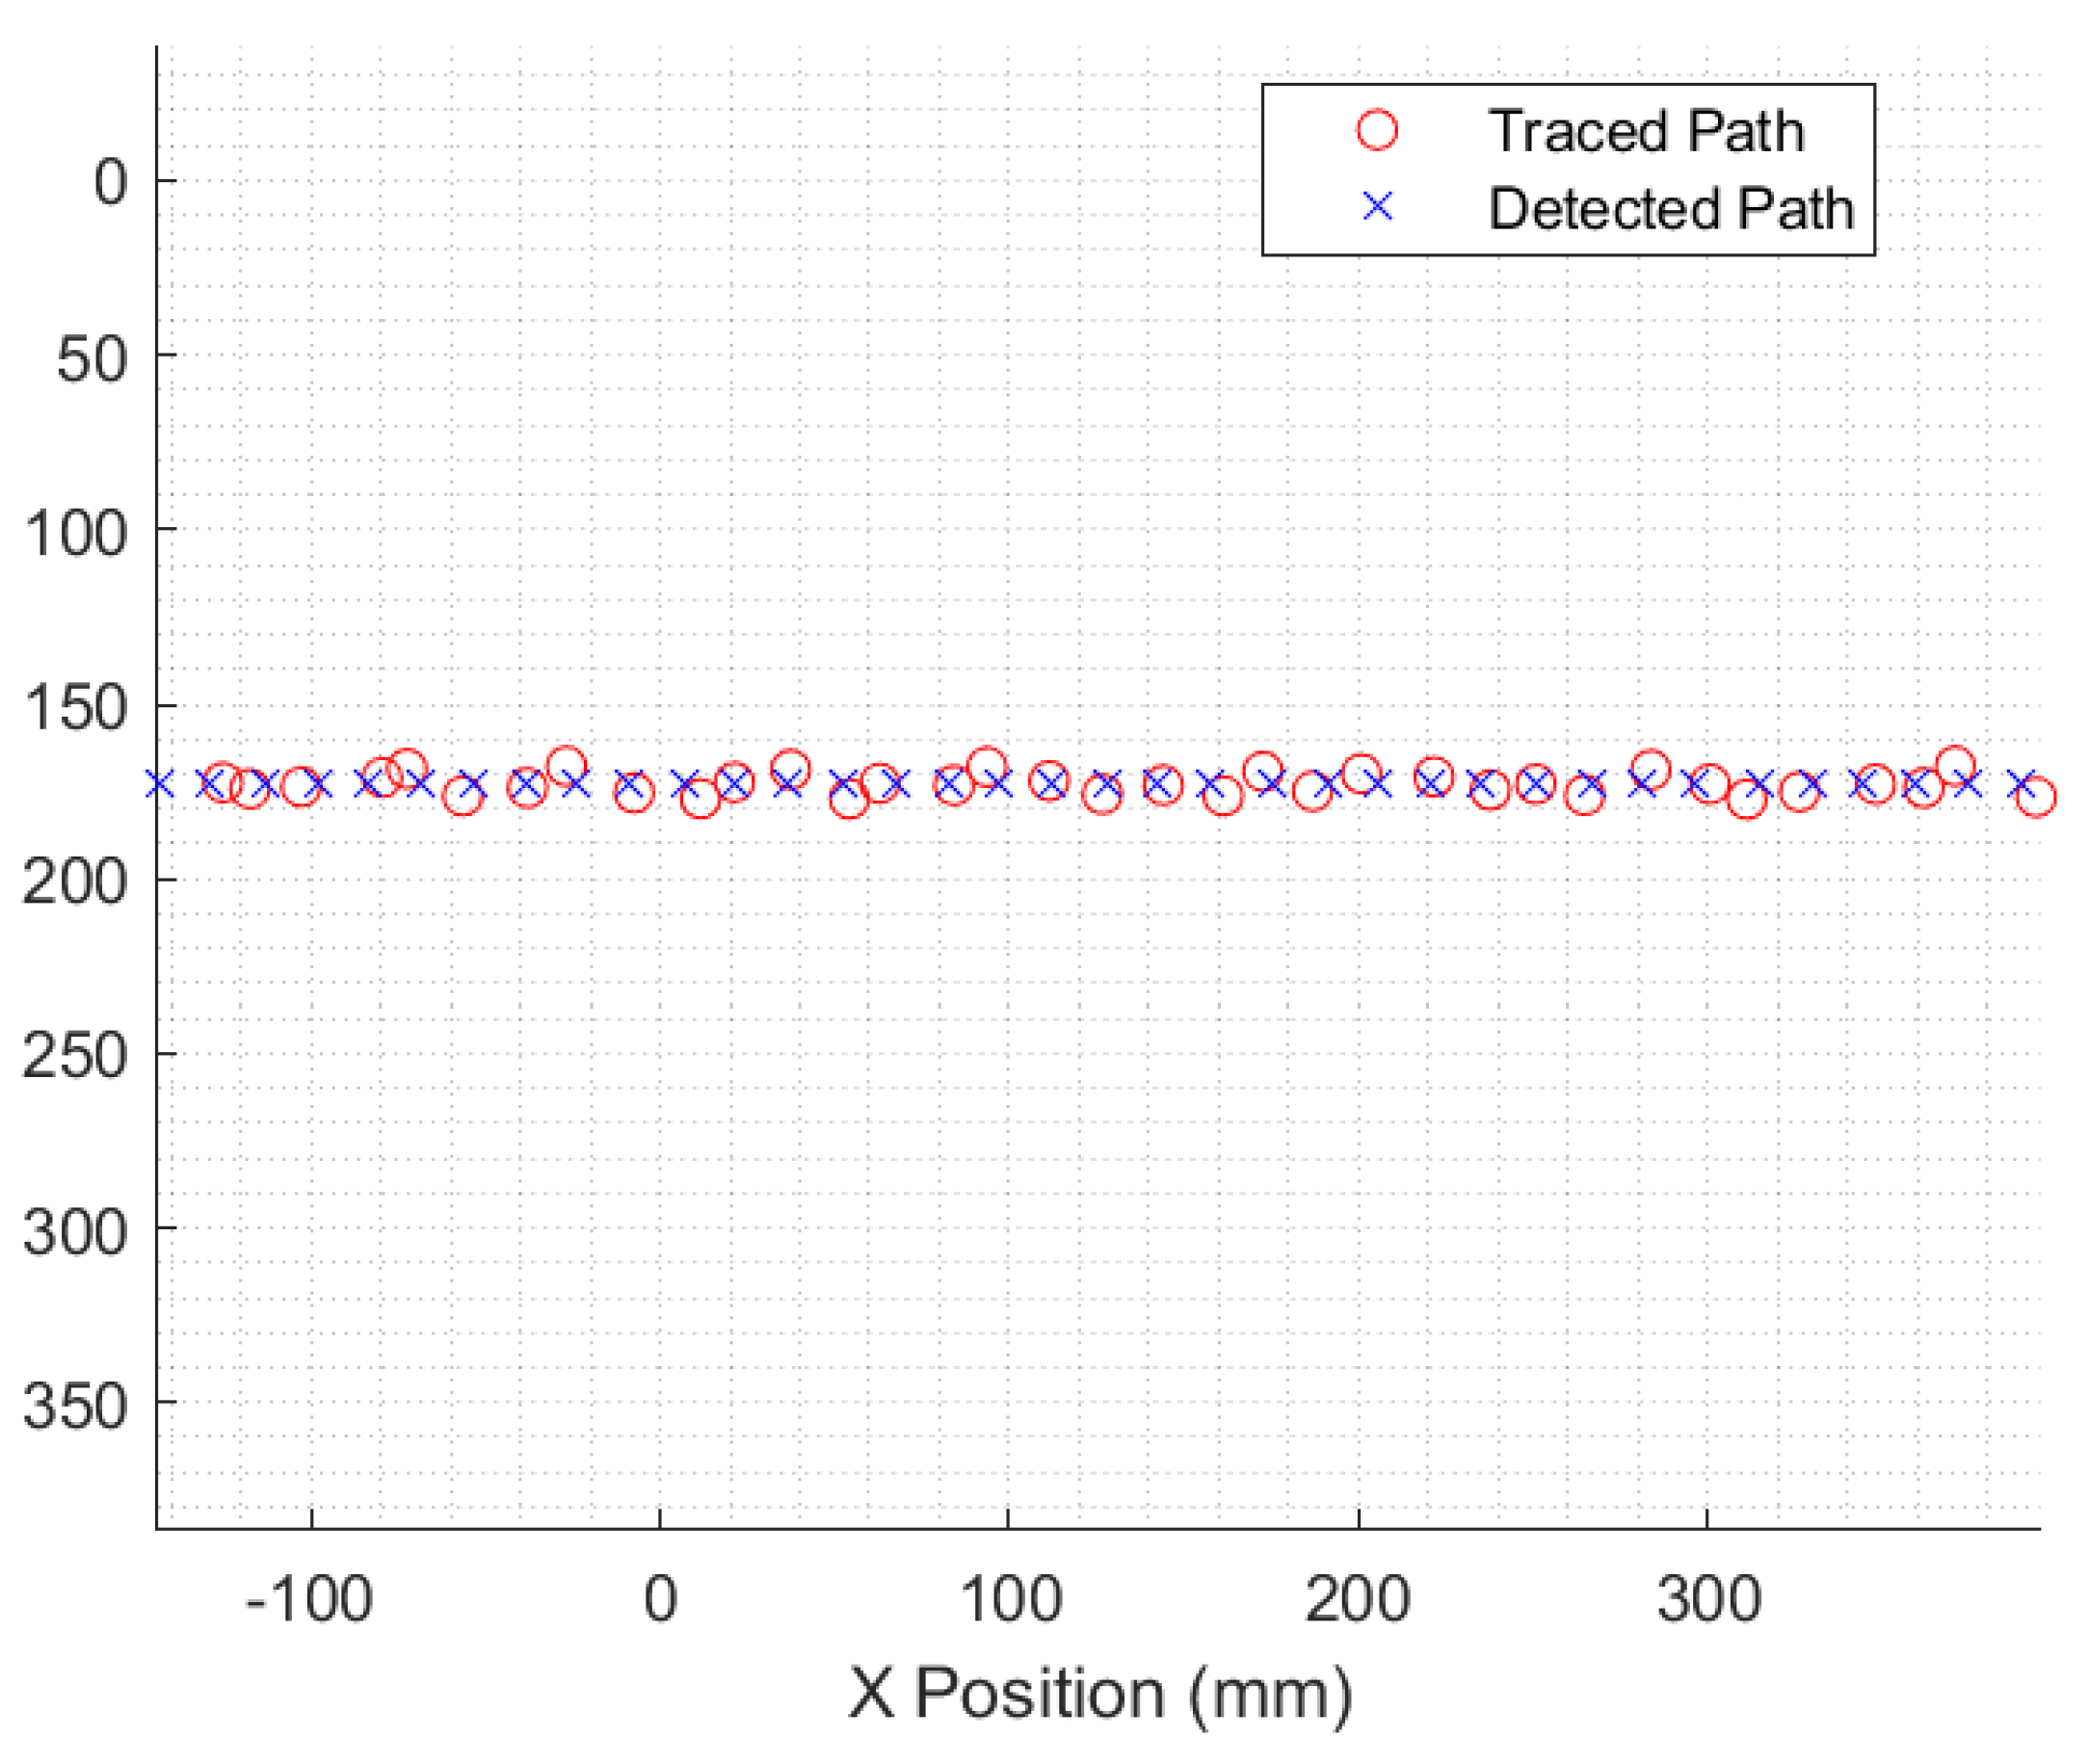
The algorithm was lightweight and fast, identifying the edge and beginning tracing with 5 s of activation, and detected various edges of varying size, material and style. As seen by Figure 21, Figure 22 and Figure 23, the resulting traced patterns are accurate to 5 mm on both the X and Y axes, similar to previous tracing experiments. The accuracy was within a consistent range across all three workpieces and did not fluctuate regardless of the arm’s cardinal direction.
Compared with other techniques, the discrepancies experienced here using an Intel Realsense and Mover6 Arm are more significant than other works, such as [35]. While their techniques for ’camera only’ visual servoing are similar, their discrepancy is lower when tracing an edge, likely due to the higher precision of instruments such as the Kuka iiwa and Cognex 7402C.

5. Conclusions and Future Work

In conclusion, the implementation provided a lightweight solution for identifying and tracing workpiece edges regardless of size, spatial profile or previous knowledge. Experiments were conducted on a variety of edges to test feature extraction and the accuracy of the output data. The experiments showed that the technique provided satisfactory results, which, while they do not beat current industrial or literature standards when tracing acute edges, are performed on a much more lightweight system and can trace a broader range of spatially varying workpieces, specifically pieces without acute, sharply defined edges. Experiments demonstrated the robustness of the developed algorithm for tracing an aerospace structure by adding high levels of artificial noise to the camera frame, in an attempt to mimic and exceed the noise present in real world. Additional experiments were completed with a physical robot and camera, to verify the simulated experiments, and show the overall goal of the algorithm. Furthermore, the technique provided can be used in multiple cells, in quick secession, without any need for a specific setup, normalisation, or pre-planning. Additional experiments demonstrated the key environmental factors that impact edge quality and how the edge detection of the workpiece can be optimised.
Future work will involve mobilising the system physically, allowing it to trace large workpieces. The developed algorithm will be used for testing different control algorithms to better understand the relationship between a mobile platform and a kinematic arm while tracing workpieces. These control algorithms will be used to gather test data, being used to create an intelligent control algorithm that can dynamically trace the edges of large aerospace workpieces in a time efficient and accurate manner.
Additional future experimentation will be done to prove that this algorithm can be used in a more realistic manufacturing environment. This will be done by simulating a realistic manufacturing cell, and exploring the effects of adverse manufacturing scenarios on the performance of the algorithm, ensuring its robustness in a realistic environment.

Author Contributions

Conceptualization, L.C. and D.T.; methodology, L.C., D.T. and W.H.; software, L.C. and J.M.A.; validation, L.C.; formal analysis, L.C.; investigation, L.C.; resources, J.M.A.; data curation, L.C.; writing—original draft preparation, L.C.; writing—review and editing, D.T. and W.H.; visualization, L.C.; supervision, C.S., L.T. and A.T.; project administration, D.T. and A.T.; funding acquisition, A.T. All authors have read and agreed to the published version of the manuscript.

Funding

This project was funded by Airbus (X/156166-12-2) and the Engineering and Physical Sciences Research Council of the UK (X/156166-11-2) through the ICASE awards scheme. The authors would also like to acknowledge through the Future Electrical Machines Manufacturing Hub (EP/S018034/1) and the Royal Academy of Engineering under the Research Chairs and Senior Research Fellowships scheme (RCSRF1718541).

Data Availability Statement

The data presented in this study are available on request from the corresponding author.

Conflicts of Interest

The authors declare no conflict of interest.

References

  1. Williams, M. JOBS02: Workforce Jobs by Industry; Technical Report; Office for National Statistics: London, UK, 2019. [Google Scholar]
  2. Brogårdh, T. Present and future robot control development-An industrial perspective. Annu. Rev. Control. 2007, 31, 69–79. [Google Scholar] [CrossRef]
  3. Devlieg, R.; Szallay, T. Applied Accurate Robotic Drilling for Aircraft Fuselage. SAE Int. J. Aerosp. 2010, 3, 180–186. [Google Scholar] [CrossRef]
  4. Agin, G.J. Real Time Control of a Robot with a Mobile Camera; Technical Note; SRI International: Menlo Park, CA, USA, 1979. [Google Scholar]
  5. Hutchinson, S.; Hager, G.D.; Corke, P.I. A tutorial on visual servo control. IEEE Trans. Robot. Autom. 1996, 12, 651–670. [Google Scholar] [CrossRef] [Green Version]
  6. Chen, W.; Wang, X.; Liu, H.; Tang, Y.; Liu, J. Optimized combination of spray painting trajectory on 3D entities. Electronics 2019, 8. [Google Scholar] [CrossRef] [Green Version]
  7. Zhou, L.; Lin, T.; Chen, S.B. Autonomous acquisition of seam coordinates for arc welding robot based on visual servoing. J. Intell. Robot. Syst. Theory Appl. 2006, 47, 239–255. [Google Scholar] [CrossRef]
  8. Xu, D.; Wang, L.; Tan, M. Image processing and visual control method for arc welding robot. In Proceedings of the 2004 IEEE International Conference on Robotics and Biomimetics, Shenyang, China, 22–26 August 2004; pp. 727–732. [Google Scholar]
  9. Chen, H.; Liu, K.; Xing, G.; Dong, Y.; Sun, H.; Lin, W. A robust visual servo control system for narrow seam double head welding robot. Int. J. Adv. Manuf. Technol. 2014, 71, 1849–1860. [Google Scholar] [CrossRef]
  10. Zacharia, P.T.; Mariolis, I.G.; Aspragathos, N.A.; Dermatas, E.S. Visual Servoing Controller for Robot Handling Fabrics of Curved Edges. In Intelligent Production Machines and Systems—2nd I*PROMS Virtual International Conference 3–14 July 2006; Elsevier: Amsterdam, The Netherlands, 2006; pp. 301–306. [Google Scholar] [CrossRef]
  11. Chang, W.C.; Cheng, M.Y.; Tsai, H.J. Implementation of an Image-Based Visual Servoing structure in contour following of objects with unknown geometric models. In Proceedings of the International Conference on Control, Automation and Systems, Gwangju, Korea, 20–23 October 2013. [Google Scholar] [CrossRef]
  12. Gangloff, J.A.; de Mathelin, M.; Abba, G. Visual servoing of a 6 DOF manipulator for unknown 3D profile following. In Proceedings of the IEEE International Conference on Robotics and Automation, Detroit, MI, USA, 10–15 May 1999. [Google Scholar] [CrossRef]
  13. Boeing. Robot Painters; Boeing: Chicago, IL, USA, 2013. [Google Scholar]
  14. Chen, R.; Wang, G.; Zhao, J.; Xu, J.; Chen, K. Fringe Pattern Based Plane-to-Plane Visual Servoing for Robotic Spray Path Planning. IEEE/ASME Trans. Mechatronics 2018, 23, 1083–1091. [Google Scholar] [CrossRef]
  15. Kuka. KUKA OmniMove Moves Heavy Parts in Confined Spaces during Construction of the A380 at Airbus; Kuka: Augsburg, Germany, 2016. [Google Scholar]
  16. Liaqat, A.; Hutabarat, W.; Tiwari, D.; Tinkler, L.; Harra, D.; Morgan, B.; Taylor, A.; Lu, T.; Tiwari, A. Autonomous mobile robots in manufacturing: Highway Code development, simulation, and testing. Int. J. Adv. Manuf. Technol. 2019, 104, 4617–4628. [Google Scholar] [CrossRef] [Green Version]
  17. AMRC. AMRC’s Robot Research Cuts the Cost of Producing Aircraft Components for BAE Systems Technology to Evolve Over Time and Embrace; Technical report; AMRC: Catcliffe, UK, 2016. [Google Scholar]
  18. Airbus. Wing of the Future; Airbus: Leiden, The Netherlands, 2017. [Google Scholar]
  19. Choi, C.; Trevor, A.J.B.; Christensen, H.I. RGB-D edge detection and edge-based registration. In Proceedings of the 2013 IEEE/RSJ International Conference on Intelligent Robots and Systems, Tokyo, Japan, 3–7 November 2013; pp. 1568–1575. [Google Scholar] [CrossRef]
  20. Bradski, G. The OpenCV Library. Dr. Dobb’s J. Softw. Tools 2000, 120, 122–125. [Google Scholar]
  21. Stanford Artificial Intelligence Laboratory. Robotic Operating System; Stanford Artificial Intelligence Laboratory: Stanford, CA, USA, 2018. [Google Scholar]
  22. Intel. Pyrealsense2; Intel: Santa Clara, CA, USA, 2018. [Google Scholar]
  23. Elkady, A.; Sobh, T. Robotics Middleware: A Comprehensive Literature Survey and Attribute-Based Bibliography. J. Robot. 2012, 2012, 959013. [Google Scholar] [CrossRef] [Green Version]
  24. Koenig, N.; Howard, A. Design and use paradigms for Gazebo, an open-source multi-robot simulator. In Proceedings of the 2004 IEEE/RSJ International Conference on Intelligent Robots and Systems, Sendai, Japan, 28 September–2 October 2004; pp. 2149–2154. [Google Scholar] [CrossRef] [Green Version]
  25. Nogueira, L. Comparative Analysis Between Gazebo and V-REP Robotic Simulators. In Proceedings of the 2011 International Conference on Materials for Renewable Energy and Environment, Shanghai, China, 20–22 May 2011; pp. 1678–1683. [Google Scholar] [CrossRef]
  26. Canny, J. A Computational Approach to Edge Detection. IEEE Trans. Pattern Anal. Mach. Intell. 1986, 8, 679–698. [Google Scholar] [CrossRef] [PubMed]
  27. Rosebrock, A. Zero-Parameter, Automatic Canny Edge Detection with Python and OpenCV. 2015. Available online: https://www.pyimagesearch.com/2015/04/06/zero-parameter-automatic-canny-edge-detection-with-python-and-opencv (accessed on 11 November 2021).
  28. Engel, J.; Schöps, T.; Cremers, D. LSD-SLAM: Large-Scale Direct Monocular SLAM. In Computer Vision—ECCV 2014; Fleet, D., Pajdla, T., Schiele, B., Tuytelaars, T., Eds.; Springer International Publishing: Cham, Switzerland, 2014; pp. 834–849. [Google Scholar]
  29. Godard, C.; Aodha, O.; Firman, M.; Gabriel, J. Digging Into Self-Supervised Monocular Depth Estimation. In Proceedings of the 2019 IEEE/CVF International Conference on Computer Vision (ICCV), Seoul, Korea, 27 October–2 November 2019. [Google Scholar] [CrossRef] [Green Version]
  30. Patil, V.; Patil, I.; Kalaichelvi, V.; Karthikeyan, R. Extraction of Weld Seam in 3D Point Clouds for Real Time Welding Using 5 DOF Robotic Arm. In Proceedings of the 2019 5th International Conference on Control, Automation and Robotics, Beijing, China, 19–22 April 2019; pp. 727–733. [Google Scholar] [CrossRef]
  31. Anderson, M.; Whitcomb, P. Chapter 3: Two-Level Factorial Design. In DOE Simplified: Practical Tools for Effective Experimentation, 3rd ed.; CRC Press: Boca Raton, FL, USA, 2015; pp. 37–67. [Google Scholar]
  32. Manish, R.; Denis Ashok, S. Study on Effect of Lighting Variations in Edge Detection of Objects using Machine Vision System. Int. J. Eng. Res. Technol. 2016, 4, 1–5. [Google Scholar]
  33. Commonplace Robotics. Robotic Arm Mover6 User Guide; Commonplace Robotics GmbH: Bissendorf, Germany, 2014; pp. 1–32. [Google Scholar]
  34. ISO 9283:1998; Manipulating Industrial Robots—Performance Criteria and Related Test Methods. International Organization for Standardization: Geneva, Switzerland, 1998.
  35. da Silva Santos, K.R.; Villani, E.; de Oliveira, W.R.; Dttman, A. Comparison of visual servoing technologies for robotized aerospace structural assembly and inspection. Robot. Comput.-Integr. Manuf. 2022, 73, 102237. [Google Scholar] [CrossRef]
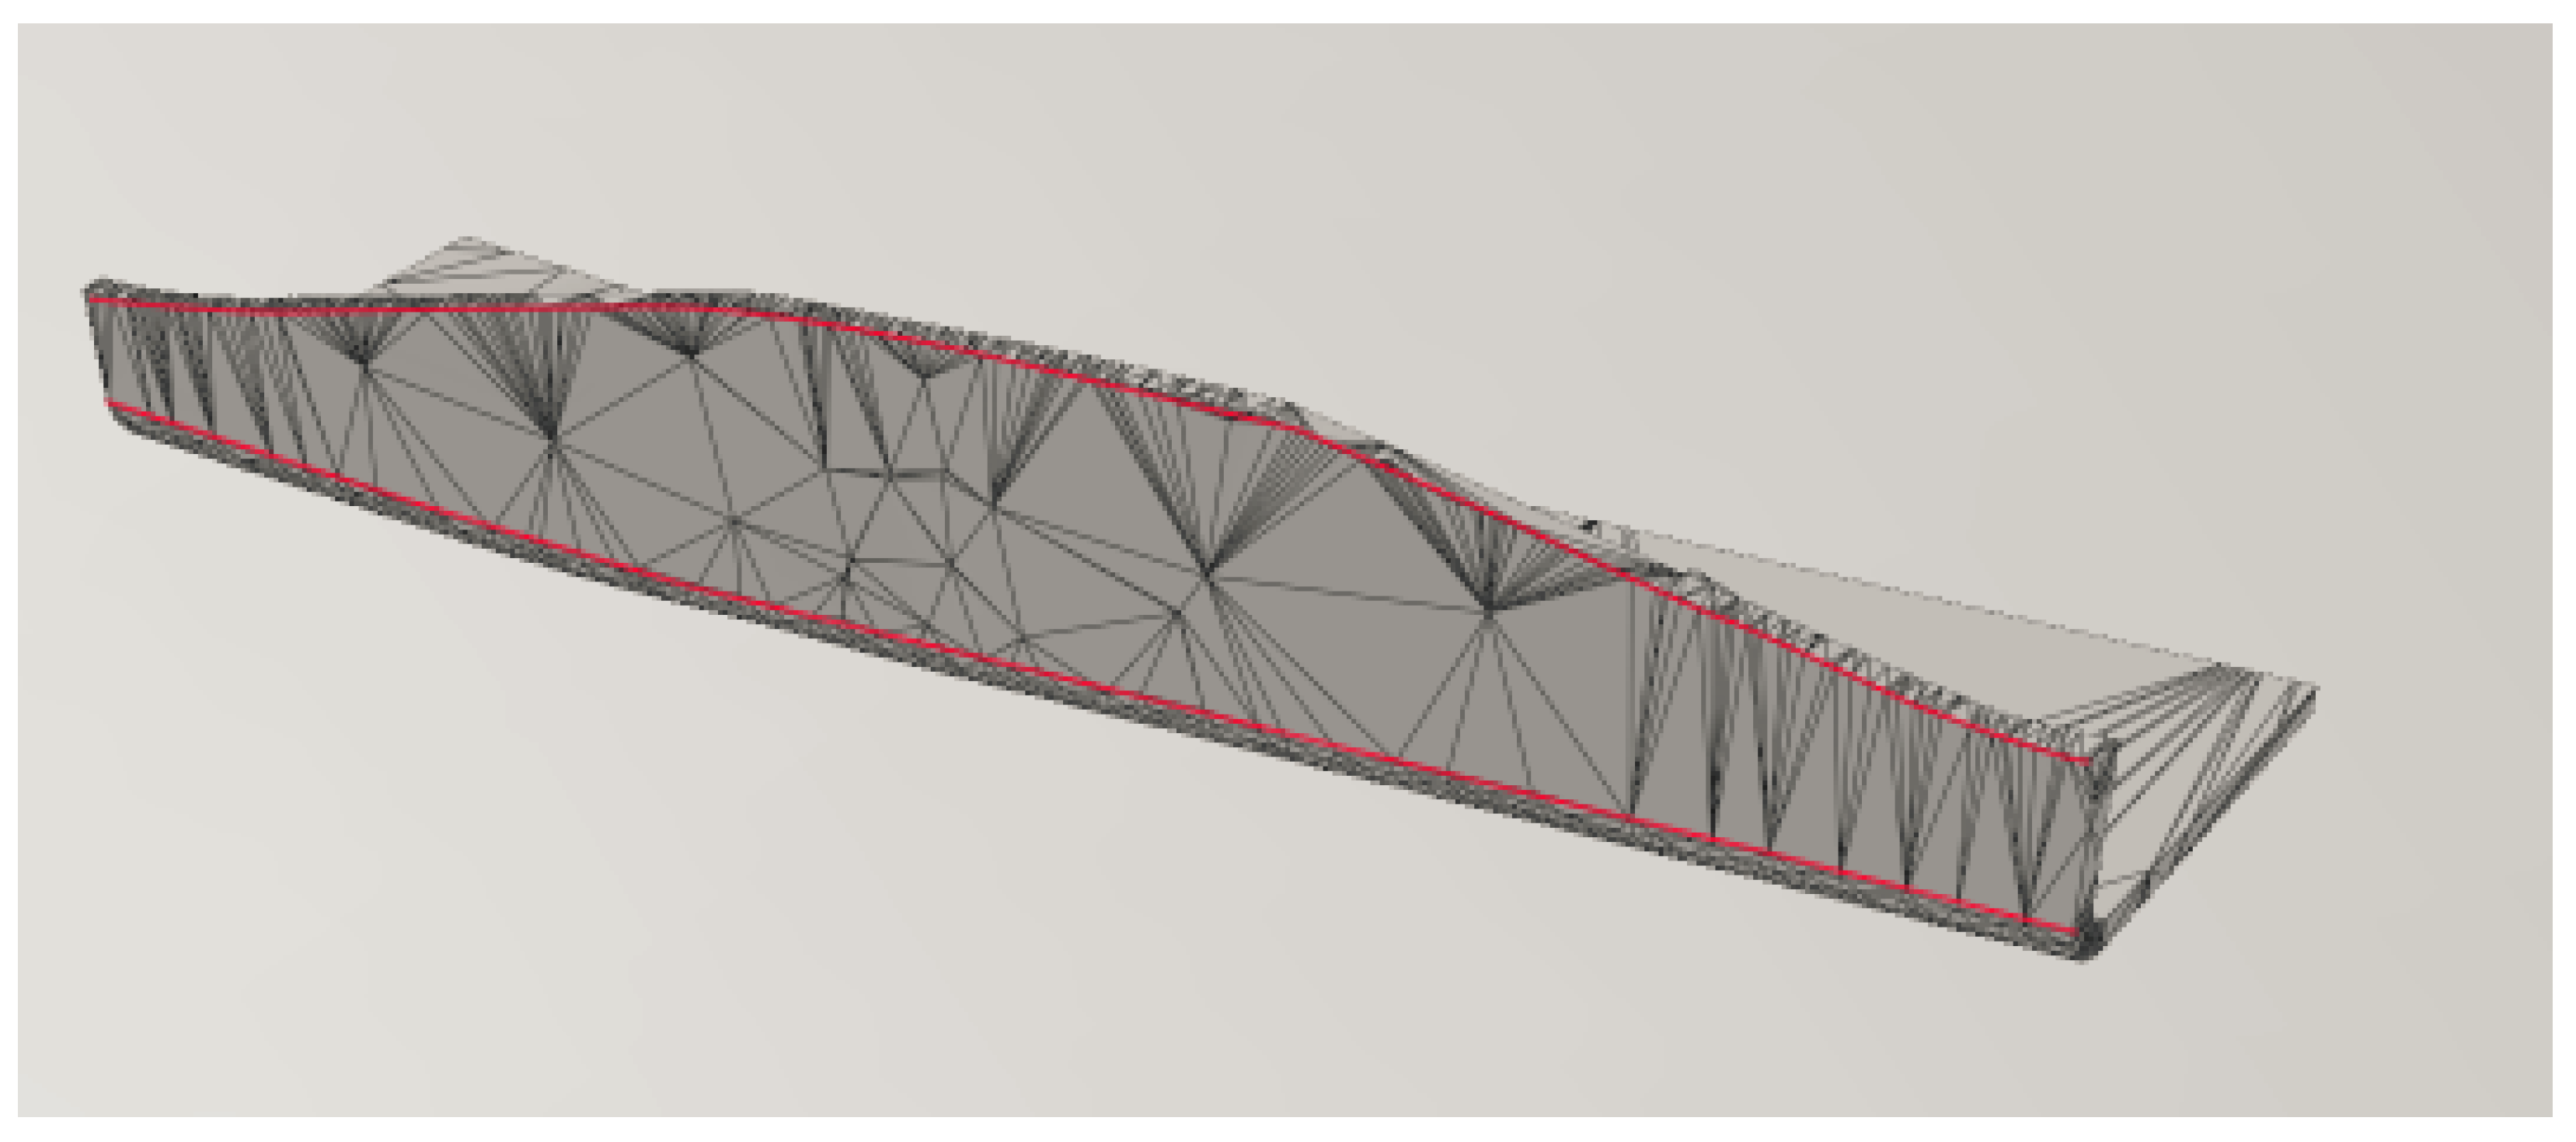
Figure 1. A CAD image of an example aerostructure needing to be traced (highlighted).
Robotics 11 00025 g001
Figure 2. An overview of the research presented.
Robotics 11 00025 g002
Figure 3. The workflow used for detecting and moving towards edges with the Mover6.
Robotics 11 00025 g003
Figure 4. The workflow of detecting the point at which a flat plane and curved edge meet.
Robotics 11 00025 g004
Figure 5. The setup for simulated obtuse edge detection.
Robotics 11 00025 g005
Figure 6. The workflow used for detecting the dependency values of different environmental variables.
Robotics 11 00025 g006
Figure 7. The lab setup for the environmental parametre experiments. (a) A photo of the environmental setup, showing the environmental parametre experiments. (b) A photo of the kinematic arm holding an Intel Realsense camera.
Robotics 11 00025 g007
Figure 8. The tracing experimental setup with a hollow cardboard workpiece measuring 500 mm by 350 mm by 350 mm.
Robotics 11 00025 g008
Figure 9. The tracing experimental setup with an aerospace inspired plywood workpiece measuring 600 mm by 170 mm by 3 mm.
Robotics 11 00025 g009
Figure 10. The tracing experimental setup with an aerospace inspired concave Perspex workpiece measuring 400 mm by 200 mm by 3 mm.
Robotics 11 00025 g010
Figure 11. The tracing experimental setup with a curved MDF workpiece measuring 1220 mm by 607 mm by 6 mm.
Robotics 11 00025 g011
Figure 12. A simulated setup for the camera to detect edges of the workpiece. (top left) The Gazebo Simulation. (top right) The Canny Edge Output. (bottom left) The pixel detection output. (bottom right) The raw camera output.
Robotics 11 00025 g012
Figure 13. The workpiece detection heatmaps, displaying disparity between detected results to a known ground truth.
Robotics 11 00025 g013
Figure 14. A bar chart showing the euclidean distance between the ground truth and each experiment.
Robotics 11 00025 g014
Figure 15. A Box Plot showing the relationships between the amount of noise and the absolute euclidean error.
Robotics 11 00025 g015
Figure 16. A scatter graph showing all detected points for each experiment.
Robotics 11 00025 g016
Figure 17. Detected points of a curved workpiece edge at a 1 m distance.
Robotics 11 00025 g017
Figure 18. Detected points of a curved workpiece edge at a 0.75 m distance.
Robotics 11 00025 g018
Figure 19. Detected points of a curved workpiece edge at 30 , at a 1 m distance.
Robotics 11 00025 g019
Figure 20. A scatter graph showing the local coordinate positions of the four test cases.
Robotics 11 00025 g020
Figure 21. Detected points of an aerospace inspired workpiece.
Robotics 11 00025 g021
Figure 22. Detected points of an aerospace inspired concave workpiece.
Robotics 11 00025 g022
Figure 23. Detected points of an aerospace inspired curved workpiece.
Robotics 11 00025 g023
Table 1. A Table showing the different variables being used in the experiments, and what the maximum and minimum settings are.
VariableMaximum (+)Minimum (−)
FocusMaximumMinimum
Lighting862 Lux478 Lux
Aperture1.8 f16 f
Distance143 cm75 cm
Table 2. A Table showing the experiments completed, and the corresponding amounts of Mean and Variance.
Mean
04818
Var0.31234
65678
209101112
5013141516
Table 3. Table listing all the dependency values of each experiment in numerical order.
ExperimentDependency Value
BC−357
AD−224.3
C−39.4
AC−16.6
ABCD12.3
ABC10.9
A10.1
BD7.4
BCD5.6
CD5.2
AB−5.0
D−3.6
ACD−3.6
ABD−3.6
B−2.6
A = Focus; B = Lighting; C = Aperture; D = Distance.
Table 4. A Table showing kinematic movement test cases, the local coordinates of the detected feature, and the robots offset once moved to the position.
Test CaseFeature Position in mm (X,Y,Z)Offset in mm (X,Y,Z)
Test 1−146, −15, 27650, −115, 35
Test 288, −45, 34−3, −125, −30
Test 3−153, 94, 2891, −2, 5
Test 4−111, −22, 2160, 3, 14
Publisher’s Note: MDPI stays neutral with regard to jurisdictional claims in published maps and institutional affiliations.