Structure of the Hydrophobic Core Determines the 3D Protein Structure—Verification by Single Mutation Proteins

 ,
, 
Abstract
1. Introduction
2. Materials and Methods
2.1. Data
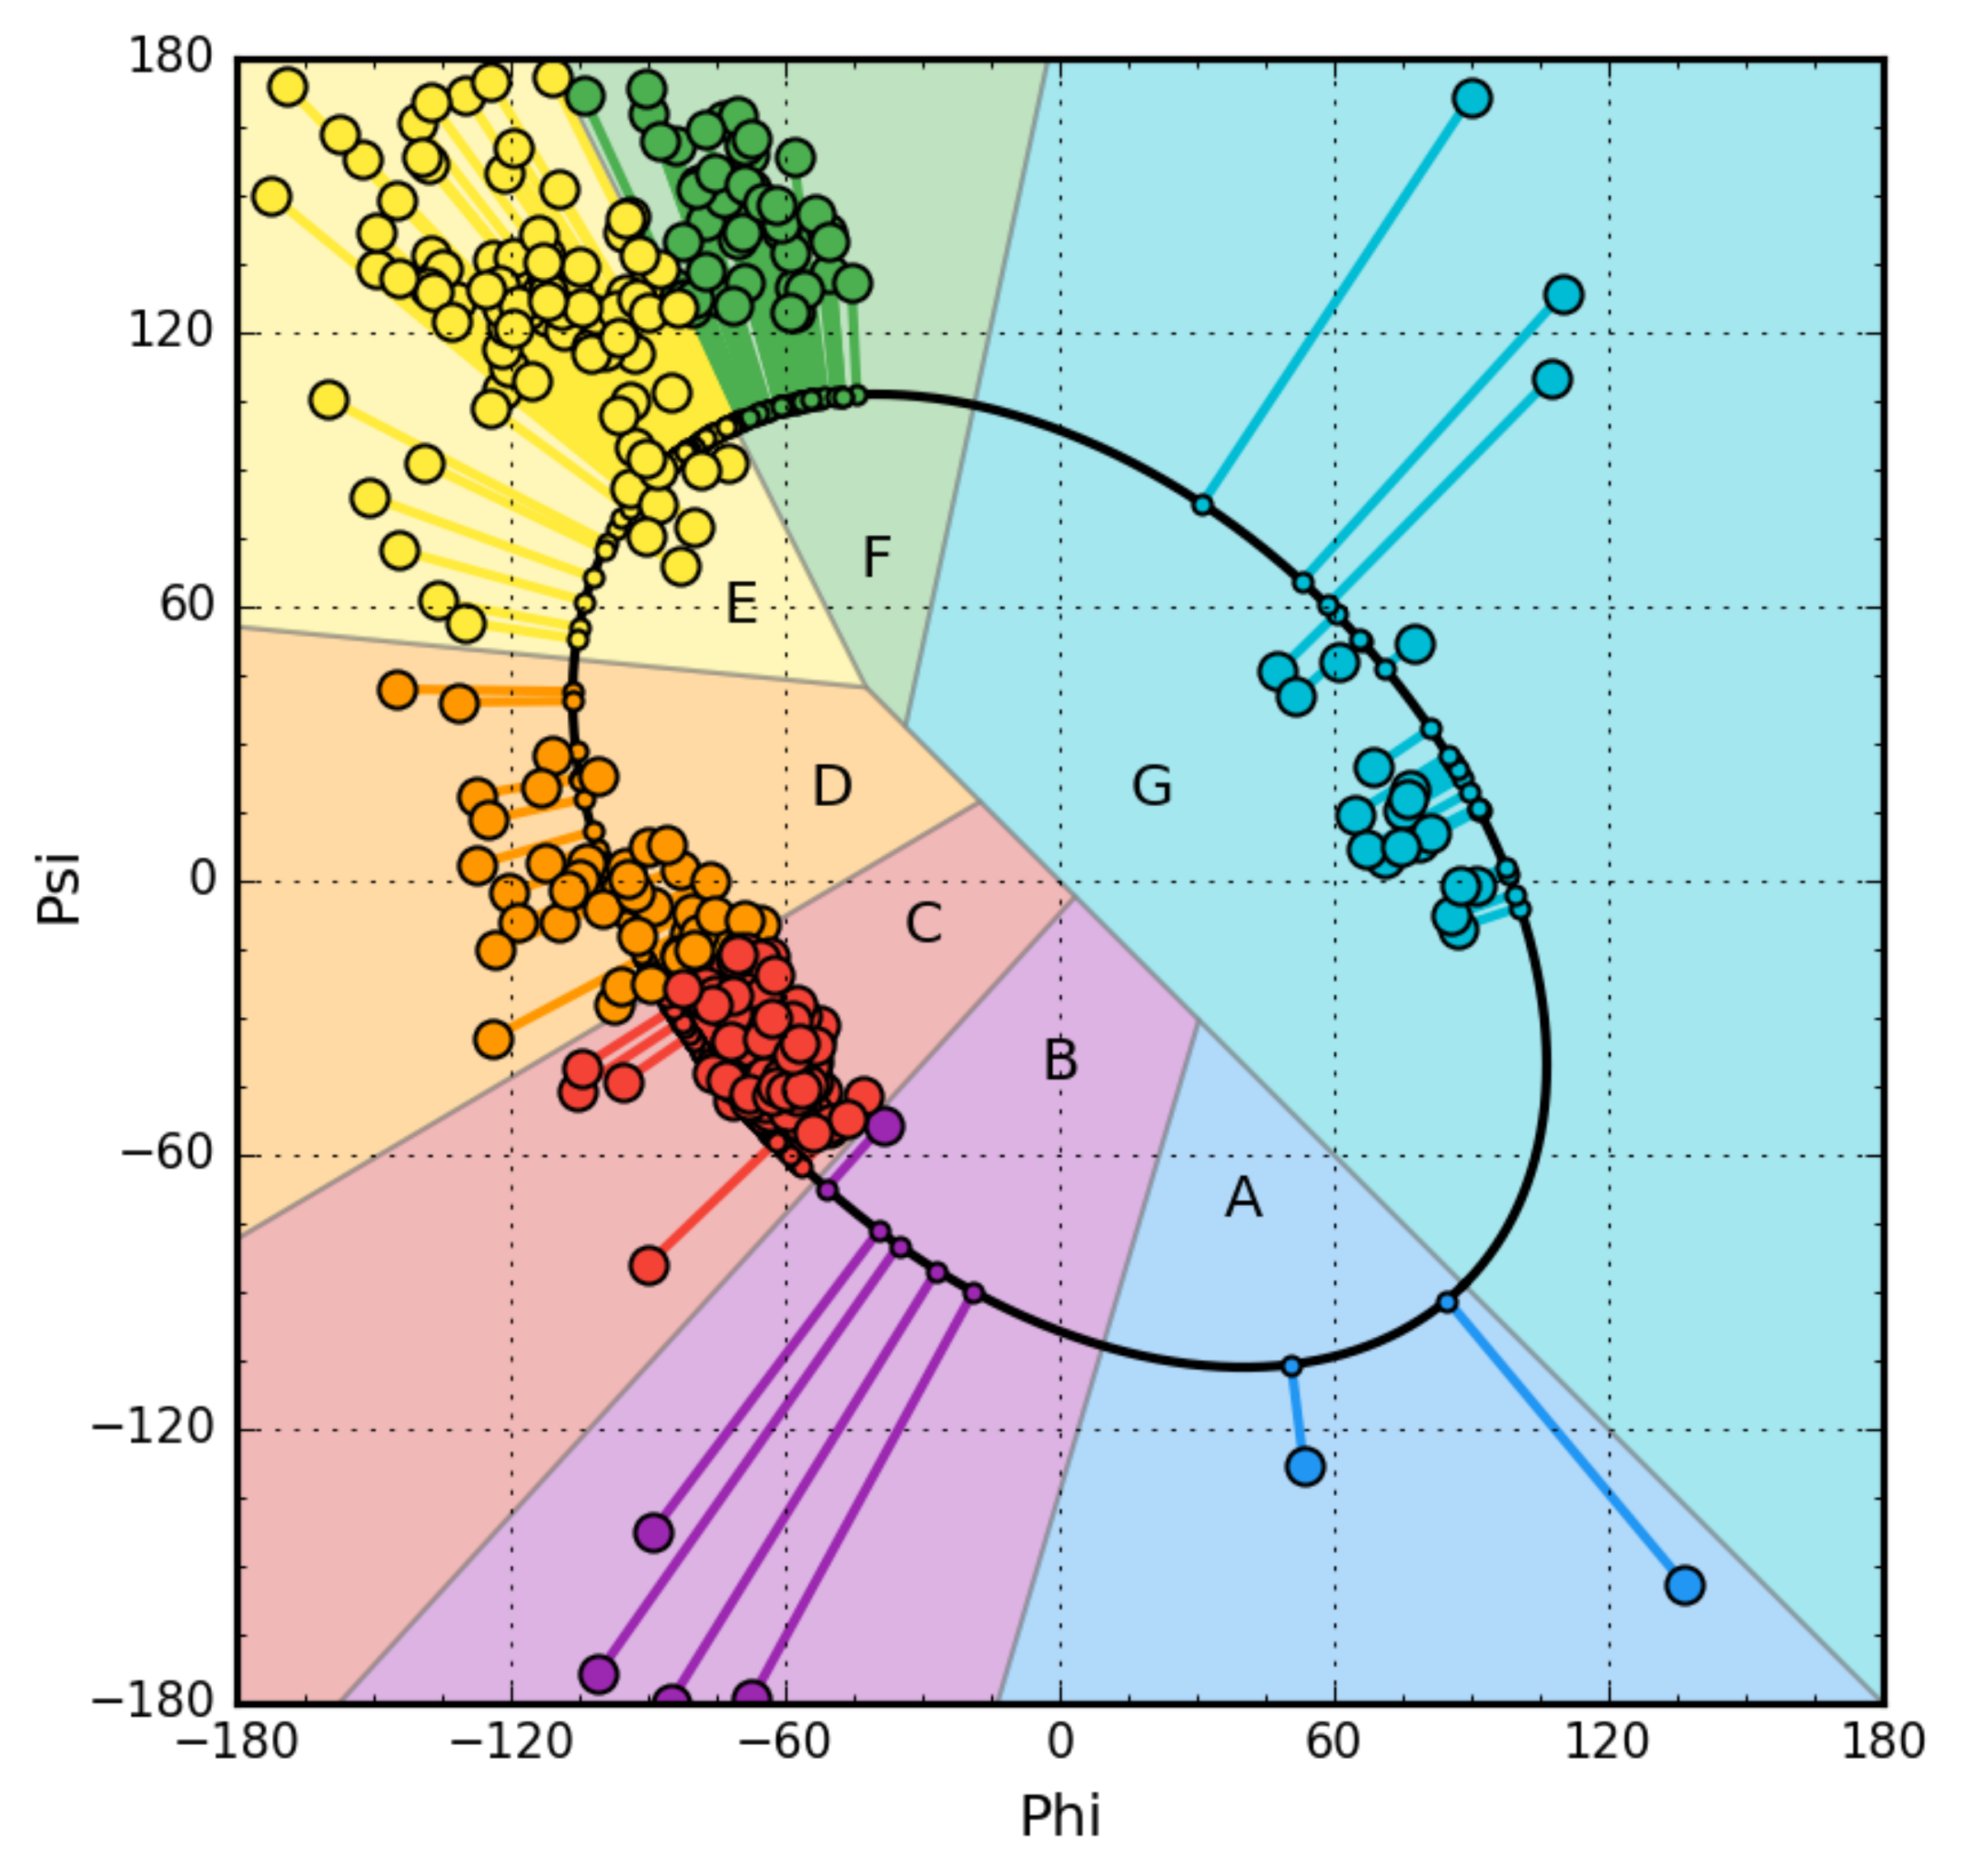
2.2. Early Stage Model—Structural Codes
2.3. Fuzzy Oil Drop Model Expressing the Structure of a Hydrophobic Core
3. Results
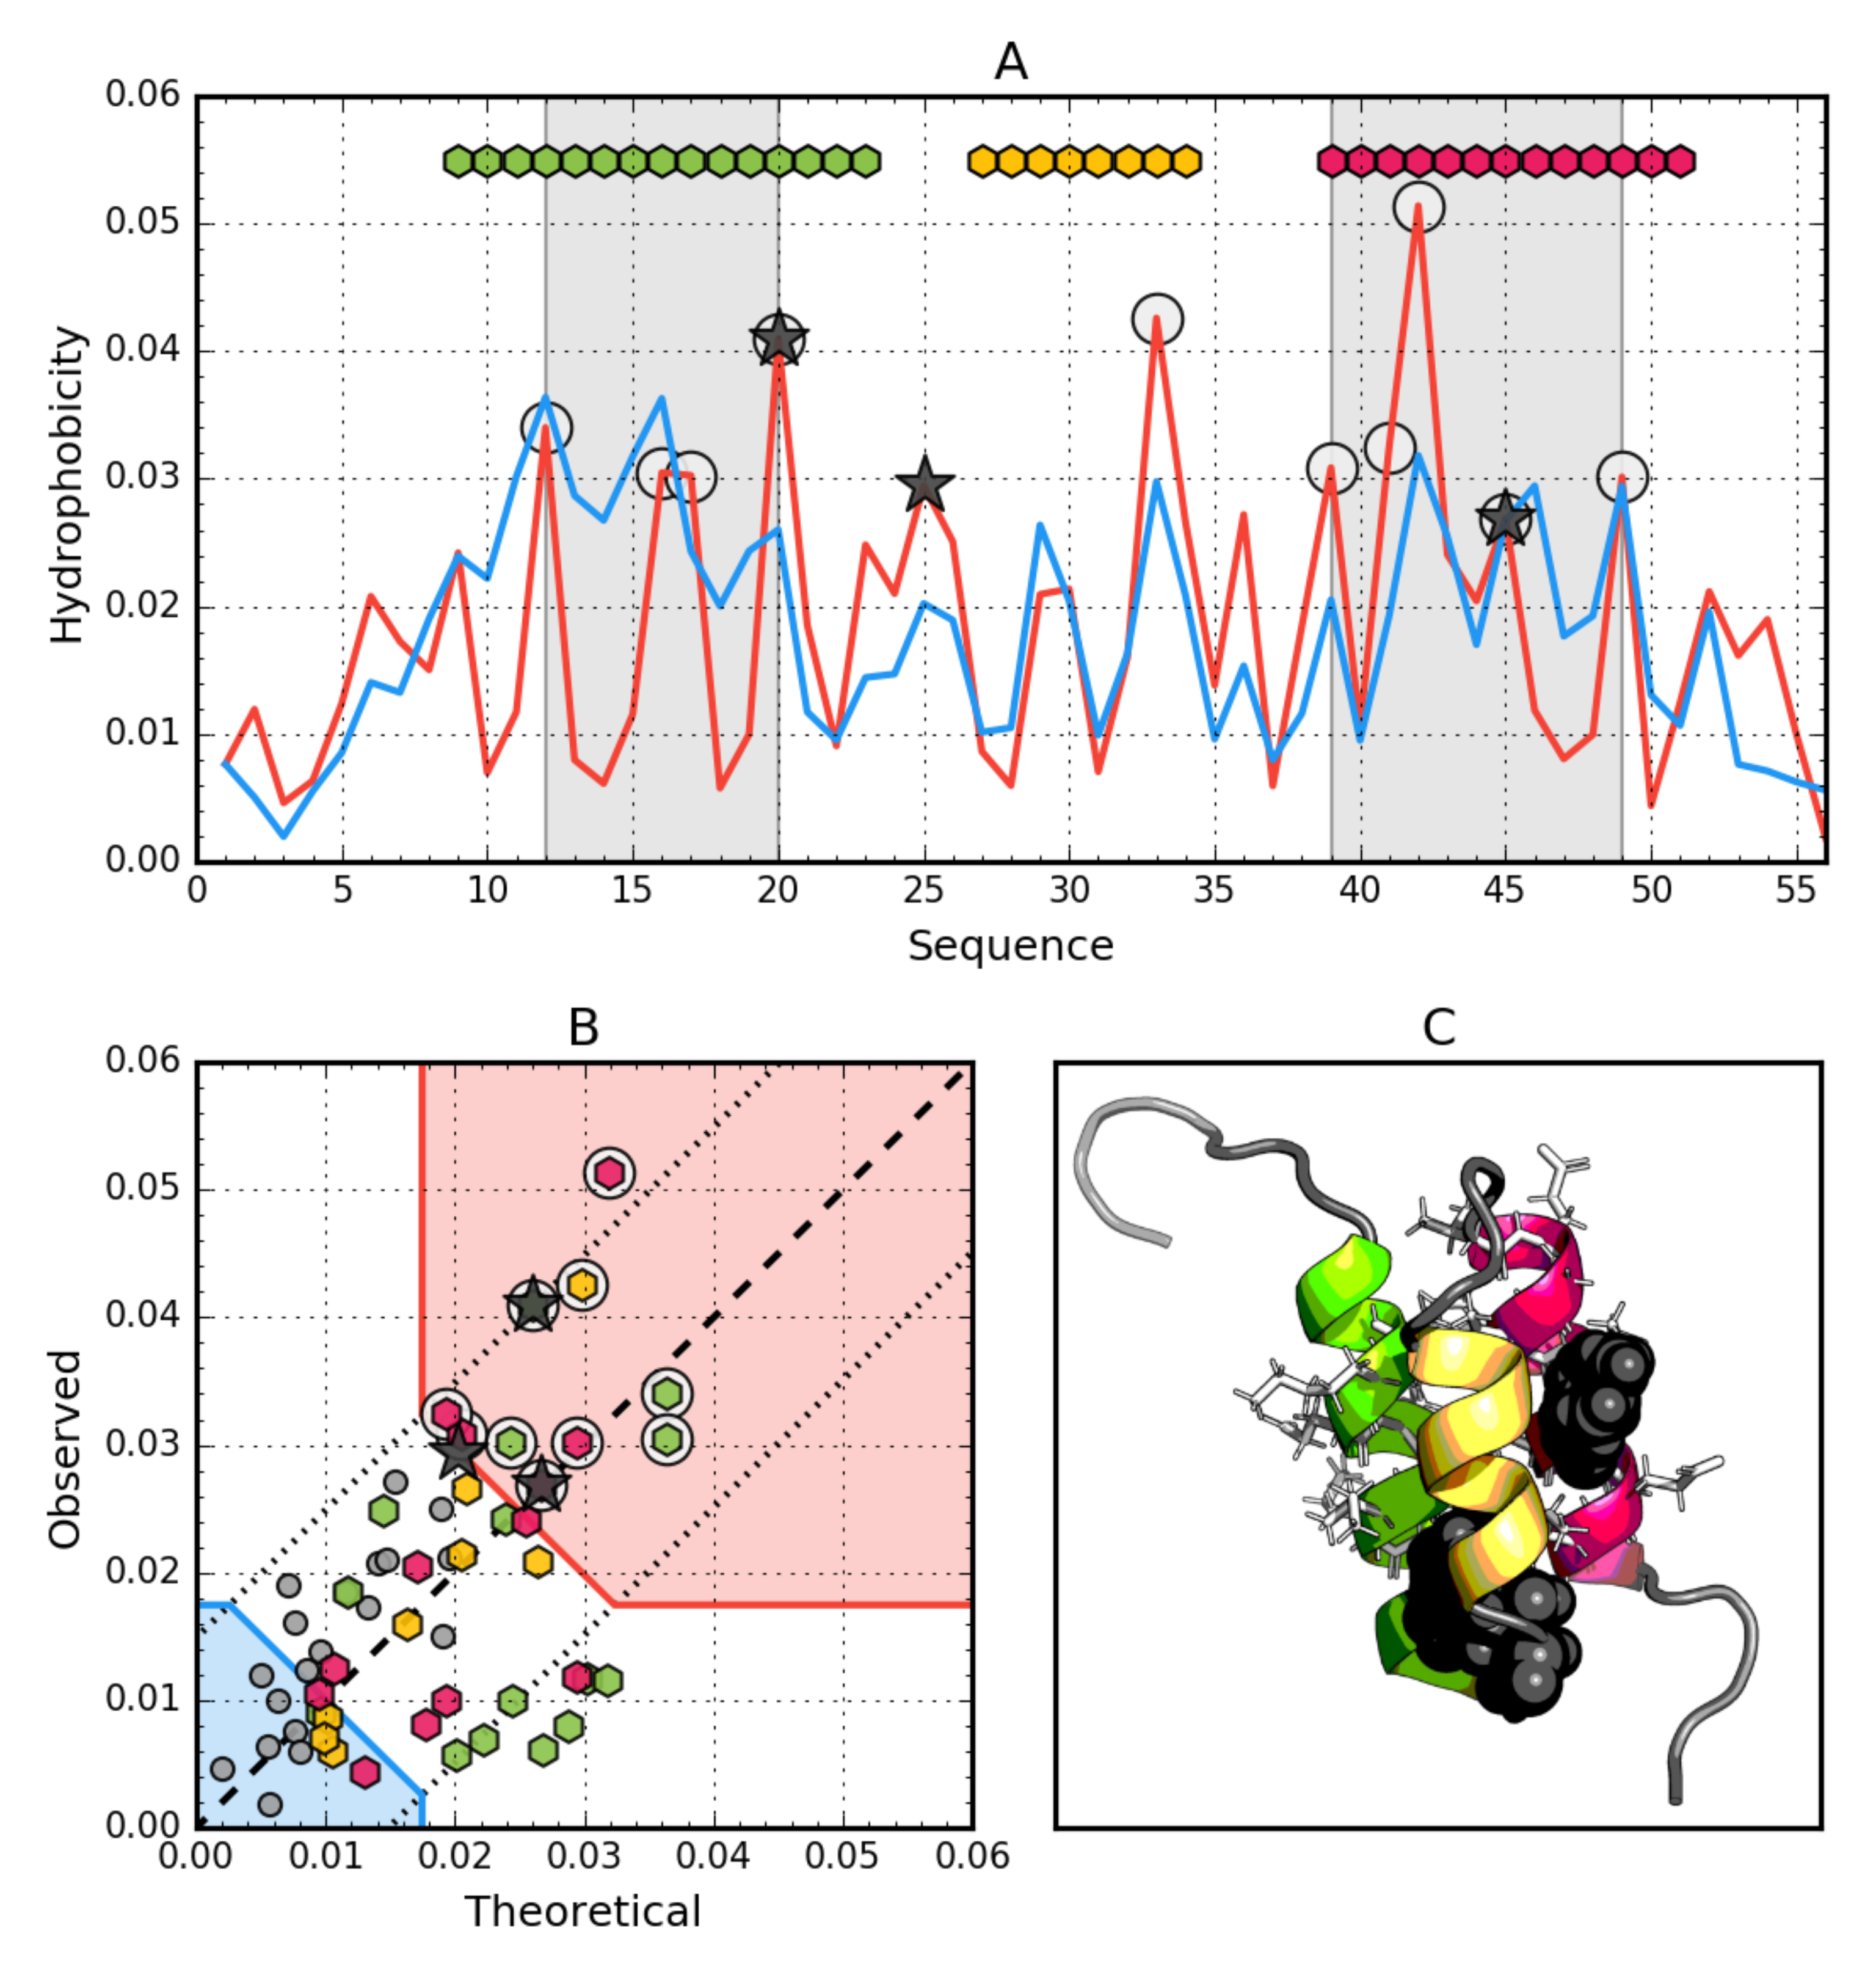
3.1. Ga98 (2LHC)
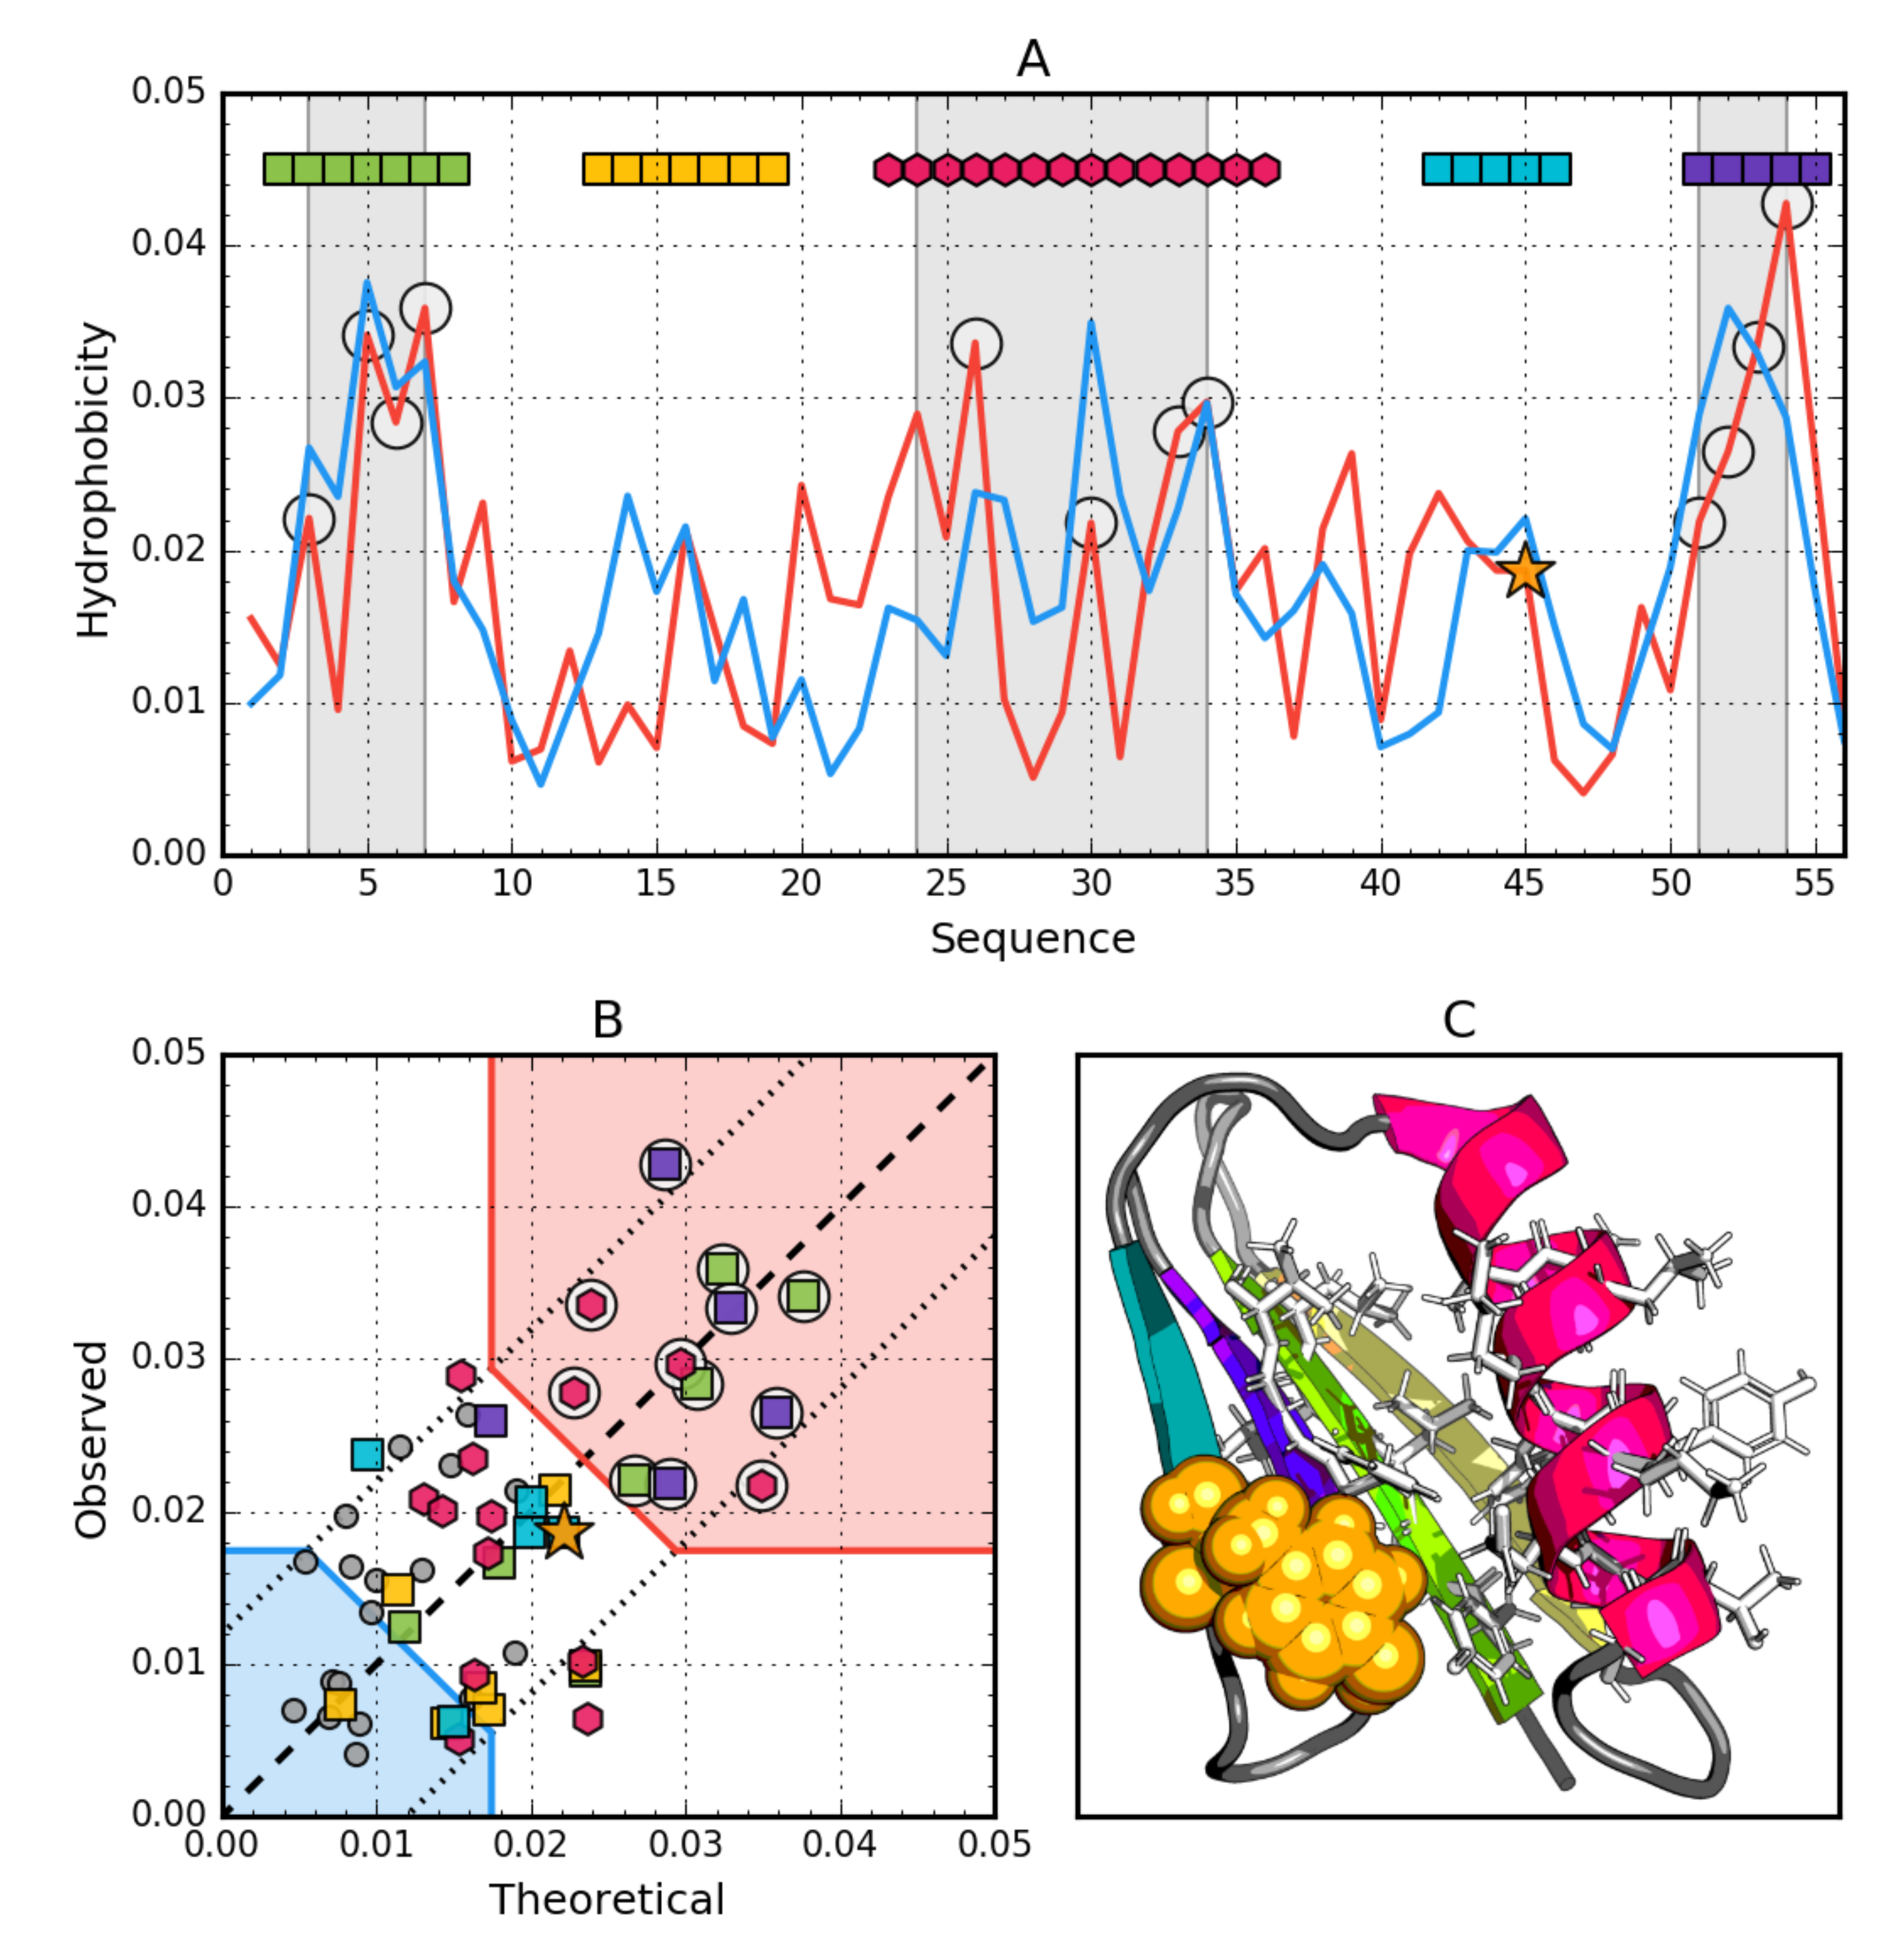
3.2. Gb98 (2LHD)
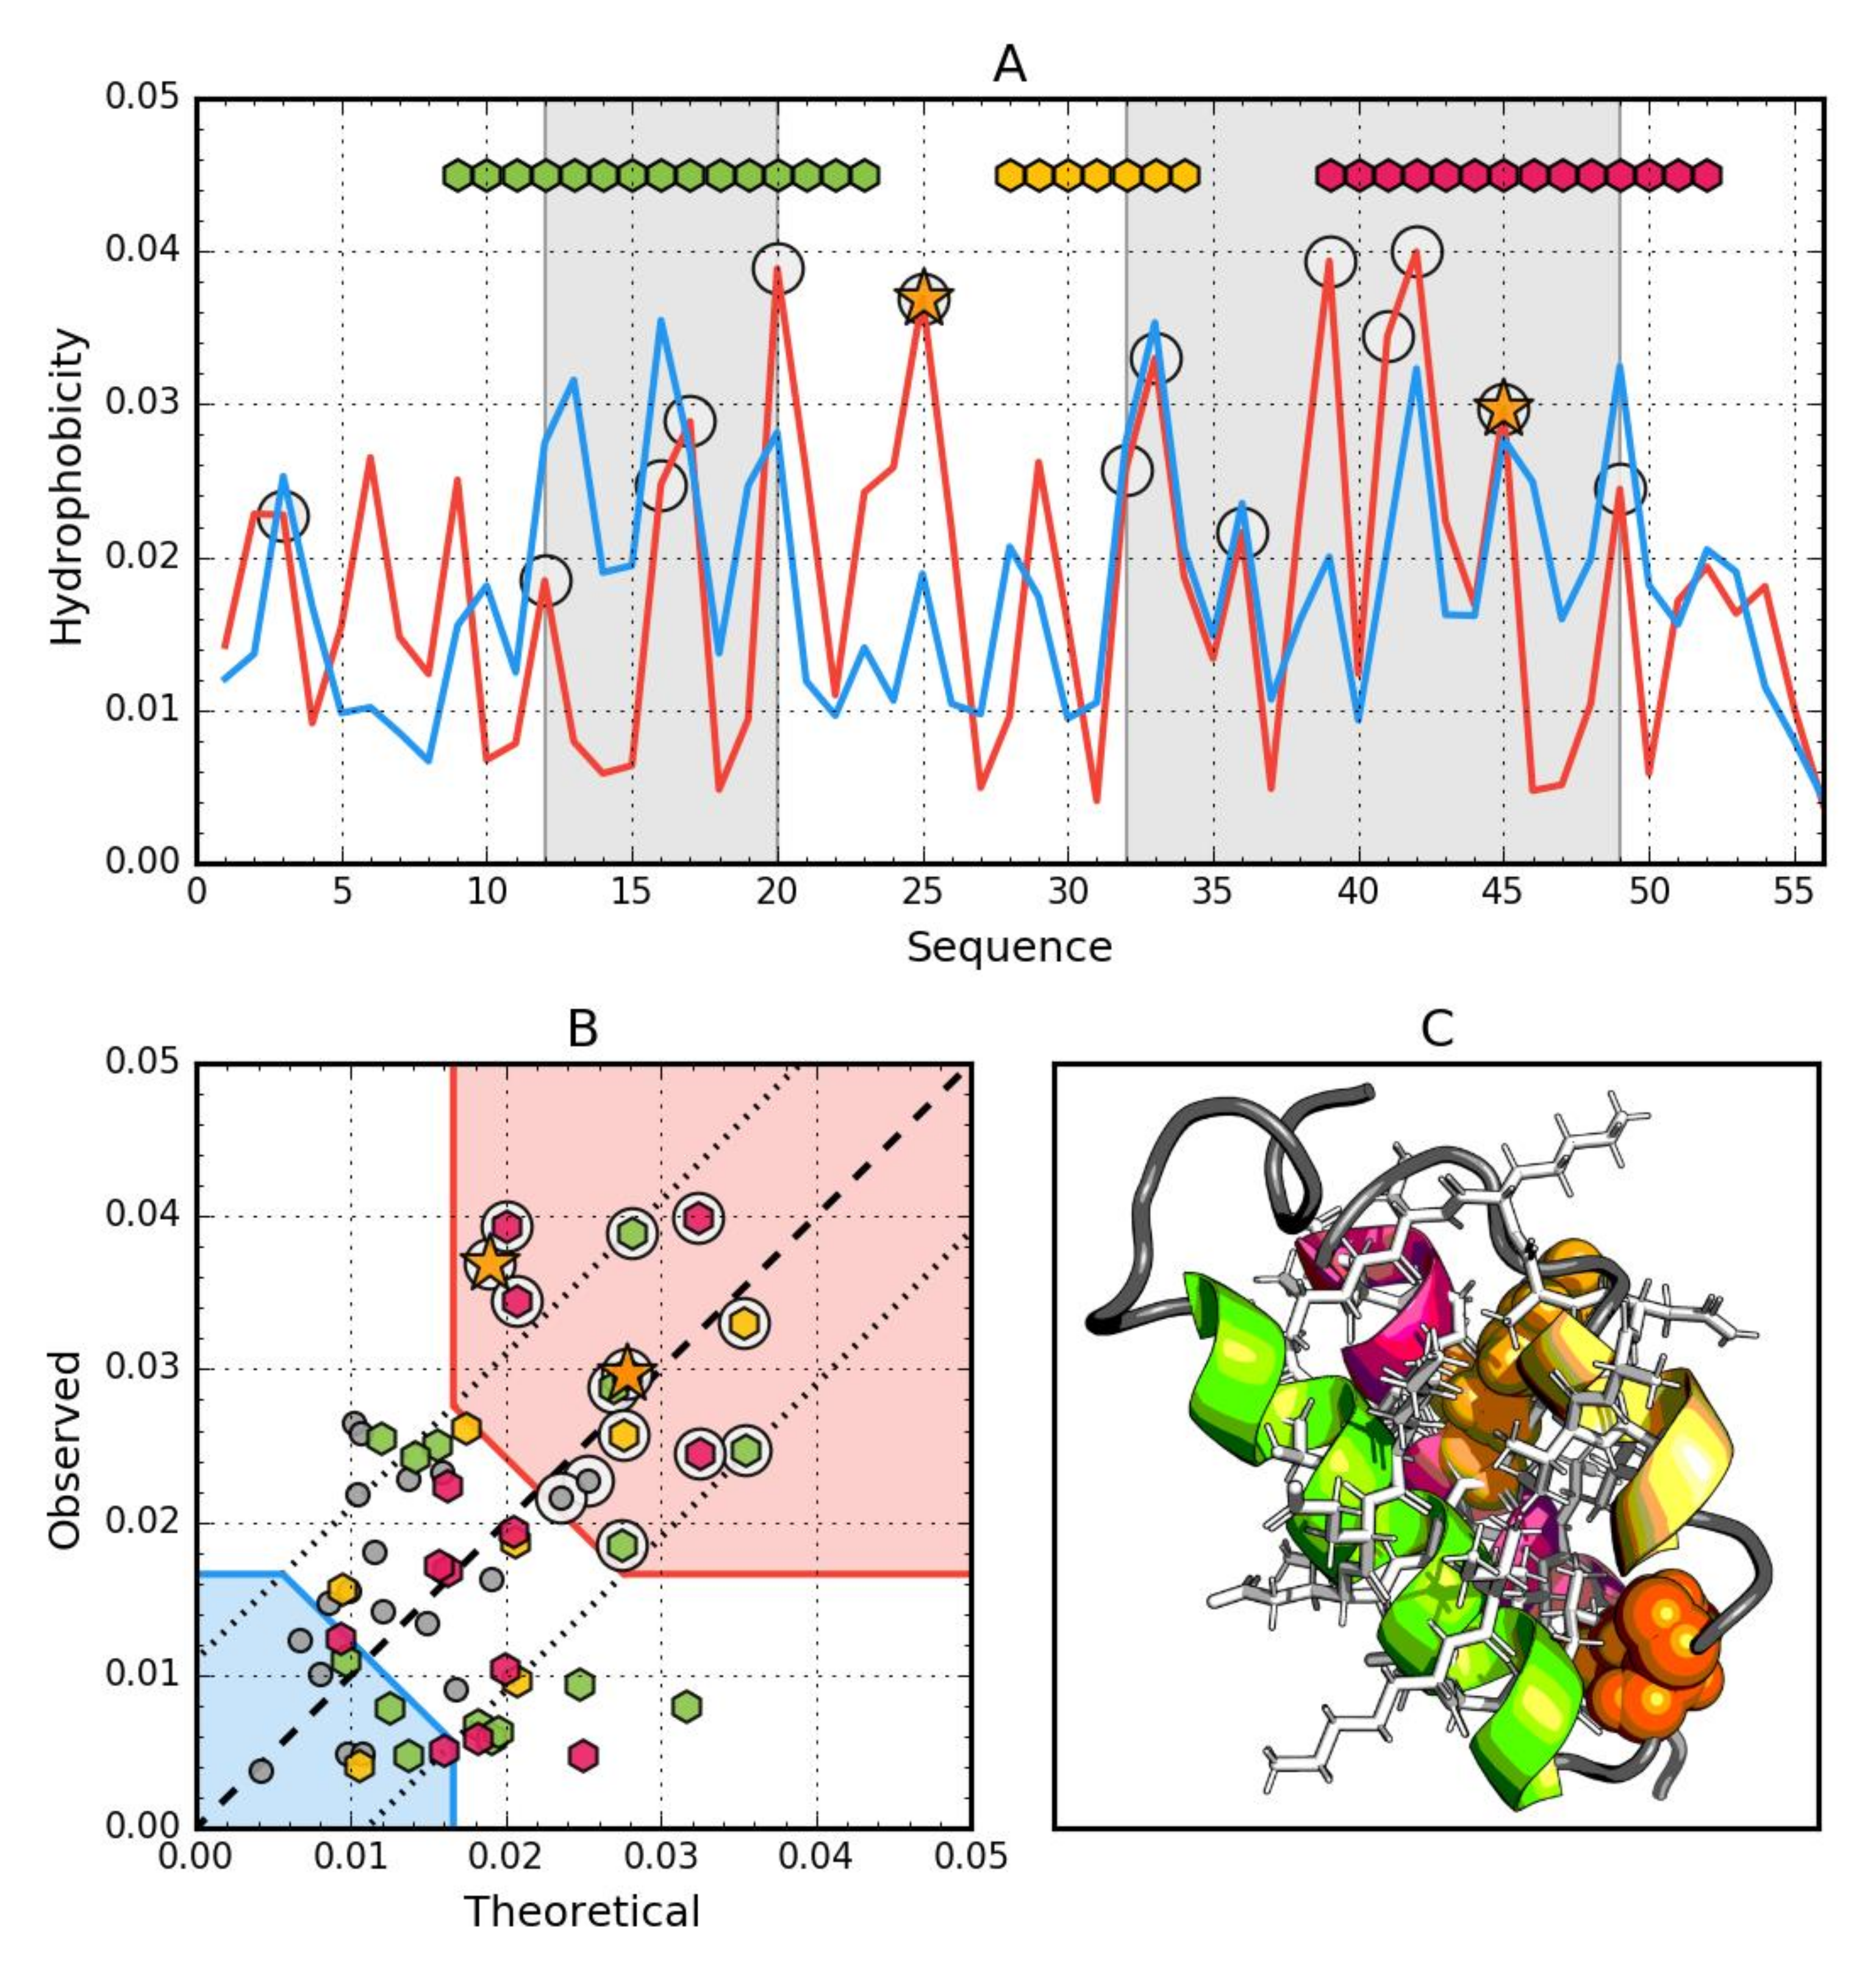
3.3. Gb98-T25I (2LHG)
3.4. Gb98-T25I, L20A (2LHE)
3.5. Comparative Analysis
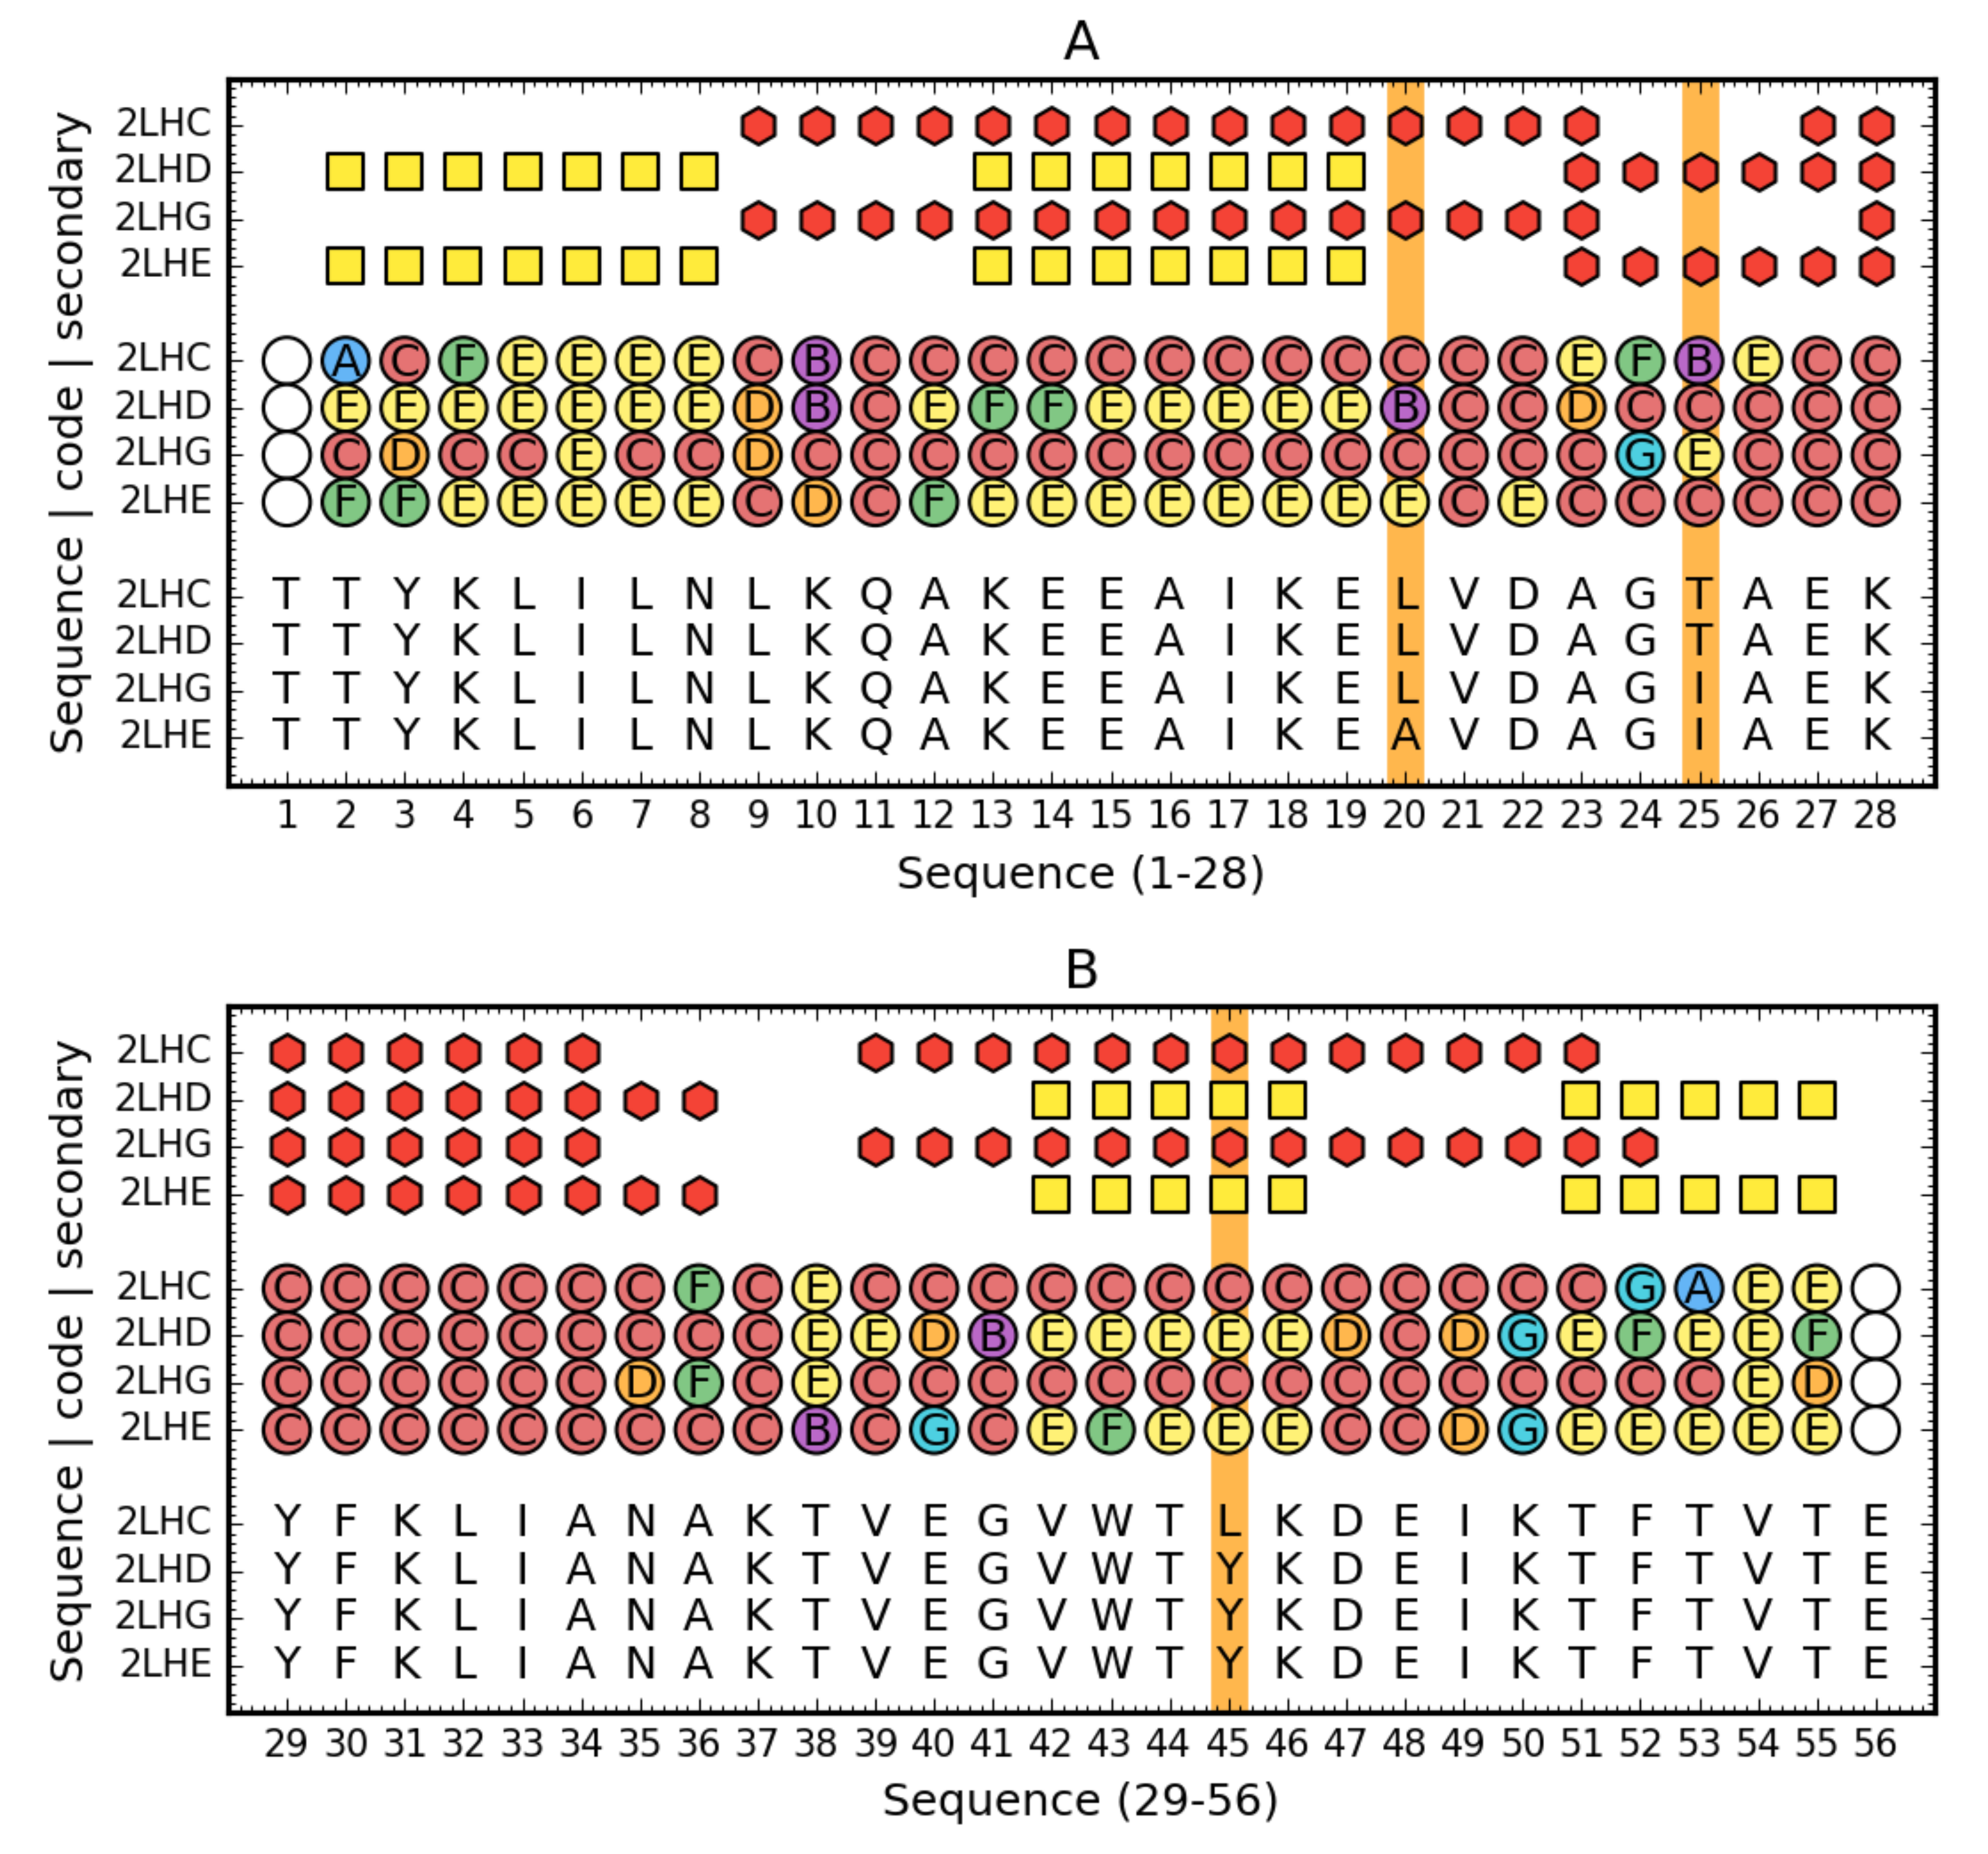
3.6. Structural Codes to Express the Structural Changes
4. Discussion
5. Conclusions
Supplementary Materials
Author Contributions
Funding
Acknowledgments
Conflicts of Interest
References
- Devlin, T.M. Textbook of Biochemistry with Clinical Correlations, 7th ed.; Wiley: New York, NY, USA, 2011. [Google Scholar]
- Berman, H.; Westbrook, J.; Feng, Z.; Gilliland, G.; Bhat, T.N.; Weissig, H.; Shindyalov, I.N.; Bourne, P.E. The Protein Data Bank. Nucleic Acids Res. 2000, 28, 235–242. [Google Scholar] [CrossRef] [PubMed]
- Dill, K.A.; MacCallum, J.L. The Protein-Folding Problem, 50 Years On. Science 2012, 338, 1042–1046. [Google Scholar] [CrossRef] [PubMed]
- Sternberg, M.J.E. Protein Structure Prediction—Principles and Approaches. In Protein Structure Prediction; Sternberg Oxford University Press Inc.: New York, NY, USA, 1996; pp. 1–30. [Google Scholar]
- Moult, J.; Fidelis, K.; Kryshtafovych, A.; Tramontano, A. Critical assessment of methods of protein structure prediction (CASP)-round IX. Proteins Struct. Funct. Bioinform. 2011, 79, 1–5. [Google Scholar] [CrossRef] [PubMed]
- Moult, J.; Fidelis, K.; Kryshtafovych, A.; Schwede, T.; Tramontano, A. Critical assessment of methods of protein structure prediction (CASP)-Round XII. Proteins Struct. Funct. Bioinform. 2017, 86, 7–15. [Google Scholar] [CrossRef]
- Anfinsen, C.B. Principles that Govern the Folding of Protein Chains. Science 1973, 181, 223–230. [Google Scholar] [CrossRef] [PubMed]
- Li, W.; Kinch, L.N.; Karplus, P.A.; Grishin, N.V. ChSeq: A database of chameleon sequences. Protein Sci. 2015, 24, 1075–1086. [Google Scholar] [CrossRef]
- Kim, B.; Do, T.D.; Hayden, E.Y.; Teplow, D.B.; Bowers, M.T.; Shea, J.-E. Aggregation of Chameleon Peptides: Implications of α-Helicity in Fibril Formation. J. Phys. Chem. B 2016, 120, 5874–5883. [Google Scholar] [CrossRef]
- Available online: http://prodata.swmed.edu/wenlin/pdb_survey2/index.cgi (accessed on 10 April 2020).
- He, Y.; Chen, Y.; Alexander, P.A.; Bryan, P.N.; Orban, J. Mutational Tipping Points for Switching Protein Folds and Functions. Structure 2012, 20, 283–291. [Google Scholar] [CrossRef]
- He, Y.; Chen, Y.; Alexander, P.; Bryan, P.N.; Orban, J. NMR structures of two designed proteins with high sequence identity but different fold and function. Proc. Natl. Acad. Sci. USA 2008, 105, 14412–14417. [Google Scholar] [CrossRef]
- He, Y.; Yeh, D.C.; Alexander, P.; Bryan, P.N.; Orban, J. Solution NMR Structures of IgG Binding Domains with Artificially Evolved High Levels of Sequence Identity but Different Folds. Biochemistry 2005, 44, 14055–14061. [Google Scholar] [CrossRef]
- Murzin, A.G. Metamorphic Proteins. Science 2008, 320, 1725–1726. [Google Scholar] [CrossRef] [PubMed]
- London, R.E. HIV-1 Reverse Transcriptase: A Metamorphic Protein with Three Stable States. Structure 2019, 27, 420–426. [Google Scholar] [CrossRef]
- Dishman, A.F.; Volkman, B.F. Unfolding the Mysteries of Protein Metamorphosis. ACS Chem. Biol. 2018, 13, 1438–1446. [Google Scholar] [CrossRef] [PubMed]
- Mishra, S.; Looger, L.L.; Porter, L.L. Inaccurate secondary structure predictions often indicate protein fold switching. Protein Sci. 2019, 28, 1487–1493. [Google Scholar] [CrossRef] [PubMed]
- Porter, L.L.; Looger, L.L. Extant fold-switching proteins are widespread. Proc. Natl. Acad. Sci. USA 2018, 115, 5968–5973. [Google Scholar] [CrossRef]
- Zheng, X.; Mueller, G.A.; Kim, K.; Perera, L.; DeRose, E.F.; London, R.E. Identification of drivers for the metamorphic transition of HIV-1 reverse transcriptase. Biochem. J. 2017, 474, 3321–3338. [Google Scholar] [CrossRef]
- Dai, Z.; Tonelli, M.; Markley, J.L. Metamorphic Protein IscU Changes Conformation by cis–trans Isomerizations of Two Peptidyl–Prolyl Peptide Bonds. Biochemistry 2012, 51, 9595–9602. [Google Scholar] [CrossRef]
- Tanaka, K.; Caaveiro, J.M.M.; Tsumoto, K. Bidirectional Transformation of a Metamorphic Protein between the Water-Soluble and Transmembrane Native States. Biochemistry 2015, 54, 6863–6866. [Google Scholar] [CrossRef]
- Porter, L.L.; He, Y.; Chen, Y.; Orban, J.; Bryan, P.N. Subdomain Interactions Foster the Design of Two Protein Pairs with ∼80% Sequence Identity but Different Folds. Biophys. J. 2015, 108, 154–162. [Google Scholar] [CrossRef][Green Version]
- Korkmaz, E.N.; Volkman, B.F.; Cui, Q. Interplay of Electrostatics and Hydrophobic Effects in the Metamorphic Protein Human Lymphotactin. J. Phys. Chem. B 2015, 119, 9547–9558. [Google Scholar] [CrossRef]
- Cieplak, A.S. Protein folding, misfolding and aggregation: The importance of two-electron stabilizing interactions. PLoS ONE 2017, 12, e0180905. [Google Scholar] [CrossRef] [PubMed]
- Tyler, R.C.; Wieting, J.C.; Peterson, F.C.; Volkman, B.F. Electrostatic Optimization of the Conformational Energy Landscape in a Metamorphic Protein. Biochemistry 2012, 51, 9067–9075. [Google Scholar] [CrossRef] [PubMed][Green Version]
- Camilloni, C.; Sutto, L. Lymphotactin: How a protein can adopt two folds. J. Chem. Phys. 2009, 131, 245105. [Google Scholar] [CrossRef] [PubMed]
- Kalinowska, B.; Banach, M.; Wiśniowski, Z.; Konieczny, L.; Roterman, I. Is the hydrophobic core a universal structural element in proteins? J. Mol. Modeling 2017, 23. [Google Scholar] [CrossRef] [PubMed]
- Hartl, F.U. Protein Misfolding Diseases. Annu. Rev. Biochem. 2017, 86, 21–26. [Google Scholar] [CrossRef] [PubMed]
- Roterman, I.; Dułak, D.; Gadzała, M.; Banach, M.; Konieczny, L. Structural analysis of the Aβ(11–42) amyloid fibril based on hydrophobicity distribution. J. Comput. Aided Mol. Des. 2019, 33, 665–675. [Google Scholar] [CrossRef]
- Dułak, D.; Banach, M.; Gadzała, M.; Konieczny, L.; Roterman, I. Structural analysis of the Aβ(15-40) amyloid fibril based on hydrophobicity distribution. Acta Biochim. Polonica 2018. [Google Scholar] [CrossRef]
- Dułak, D.; Gadzała, M.; Banach, M.; Ptak, M.; Wiśniowski, Z.; Konieczny, L.; Roterman, I. Filamentous Aggregates of Tau Proteins Fulfil Standard Amyloid Criteria Provided by the Fuzzy Oil Drop (FOD) Model. Int. J. Mol. Sci. 2018, 19, 2910. [Google Scholar] [CrossRef]
- Alexander, P.A.; He, Y.; Chen, Y.; Orban, J.; Bryan, P.N. The design and characterization of two proteins with 88% sequence identity but different structure and function. Proc. Natl. Acad. Sci. USA 2007, 104, 11963–11968. [Google Scholar] [CrossRef]
- Fabian, P.; Stapor, K.; Banach, M.; Ptak-Kaczor, M.; Konieczny, L.; Roterman, I. Alternative Hydrophobic Core in Proteins—The Effect of Specific Synergy. Symmetry 2020, 12, 273. [Google Scholar] [CrossRef]
- Kalinowska, B.; Banach, M.; Konieczny, L.; Roterman, I. Application of Divergence Entropy to Characterize the Structure of the Hydrophobic Core in DNA Interacting Proteins. Entropy 2015, 17, 1477–1507. [Google Scholar] [CrossRef]
- Banach, M.; Konieczny, L.; Roterman, I. The Amyloid as a Ribbon-Like Micelle in Contrast to Spherical Micelles Represented by Globular Proteins. Molecules 2019, 24, 4395. [Google Scholar] [CrossRef] [PubMed]
- Jurkowski, W.; Brylinski, M.; Konieczny, L.; Wisniowski, Z.; Roterman, I. Conformational subspace in simulation of early-stage protein folding. Proteins Struct. Funct. Bioinform. 2004, 55, 115–127. [Google Scholar] [CrossRef] [PubMed]
- Jurkowski, W.; Baster, Z.; Dułak, D.; Roterman-Konieczna, I. The early-stage intermediate. Protein Folding Silico 2012, 1–20. [Google Scholar] [CrossRef]
- Roterman, I. Modelling the Optimal Simulation Path in the Peptide Chain Folding–Studies Based on Geometry of Alanine Heptapeptide. J. Theor. Biol. 1995, 177, 283–288. [Google Scholar] [CrossRef]
- Roterman, I. The geometrical analysis of peptide backbone structure and its local deformations. Biochimie 1995, 77, 204–216. [Google Scholar] [CrossRef]
- Shabalin, I.G.; Polyakov, K.M.; Serov, A.E.; Skirgello, O.E.; Sadykhov, E.G.; Dorovatovskiy, P.V.; Popov, V.O. Apo-form of NAD-dependent formate dehydrogenase from higher-plant Arabidopsis thaliana. 2010. [Google Scholar] [CrossRef]
- Banach, M.; Konieczny, L.; Roterman, I. Proteins structured as spherical micelles. Globul. Proteins Amyloids 2020, 55–68. [Google Scholar] [CrossRef]
- Konieczny, L.; Brylinski, M.; Roterman, I. Gauss-function-Based model of hydrophobicity density in proteins. Silico Biol. 2006, 6, 15–22. [Google Scholar]
- Kalinowska, B.; Fabian, P.; Stąpor, K.; Roterman, I. Statistical dictionaries for hypothetical in silico model of the early-stage intermediate in protein folding. J. Comput. Aided Mol. Des. 2015, 29, 609–618. [Google Scholar] [CrossRef]
- Levitt, M. A simplified representation of protein conformations for rapid simulation of protein folding. J. Mol. Biol. 1976, 104, 59–107. [Google Scholar] [CrossRef]
- Kullback, S.; Leibler, R.A. On Information and Sufficiency. Ann. Math. Stat. 1951, 22, 79–86. [Google Scholar] [CrossRef]
- The PyMOL Molecular Graphics System; Version 2; Schrödinger, LLC: New York, NY, USA, 2017.
- Hunter, J.D. Matplotlib: A 2D Graphics Environment. Comput. Sci. Eng. 2007, 9, 90–95. [Google Scholar] [CrossRef]
- Banach, M.; Konieczny, L.; Roterman-Konieczna, I. Ligand-binding-site recognition. In Protein Folding Silico; Woodhead Publishing: Cambridge, UK, 2012; pp. 79–93. [Google Scholar] [CrossRef]
- Banach, M.; Konieczny, L.; Roterman-Konieczna, I. Can the Structure of the Hydrophobic Core Determine the Complexation Site? Focus Struct. Biol. 2012, 41–54. [Google Scholar] [CrossRef]
- Goodchild, S.C.; Curmi, P.M.G.; Brown, L.J. Structural gymnastics of multifunctional metamorphic proteins. Biophys. Rev. 2011, 3, 143–153. [Google Scholar] [CrossRef]
- Tyler, R.C.; Murray, N.J.; Peterson, F.C.; Volkman, B.F. Native-State Interconversion of a Metamorphic Protein Requires Global Unfolding. Biochemistry 2011, 50, 7077–7079. [Google Scholar] [CrossRef]
- Yadid, I.; Kirshenbaum, N.; Sharon, M.; Dym, O.; Tawfik, D.S. Metamorphic proteins mediate evolutionary transitions of structure. Proc. Natl. Acad. Sci. USA 2010, 107, 7287–7292. [Google Scholar] [CrossRef]
- Banach, M.; Konieczny, L.; Roterman, I. Fuzzy Oil Drop Model Application—From Globular Proteins to Amyloids. In Computational Methods to Study the Structure and Dynamics of Biomolecules and Biomolecular Processes; Springer: Cham, Switzerland, 2018; pp. 639–658. [Google Scholar] [CrossRef]
- Banach, M.; Konieczny, L.; Roterman, I. Why do antifreeze proteins require a solenoid? Biochimie 2018, 144, 74–84. [Google Scholar] [CrossRef]
- Kauzmann, W. Some factors in the interpretation of protein denaturation. Adv. Protein Chem. 1959, 14, 1–63. [Google Scholar]
- Roterman, I.; Konieczny, L.; Jurkowski, W.; Prymula, K.; Banach, M. Two-intermediate model to characterize the structure of fast-folding proteins. J. Theor. Biol. 2011, 283, 60–70. [Google Scholar] [CrossRef] [PubMed]
- Banach, M.; Konieczny, L.; Roterman, I. The fuzzy oil drop model, based on hydrophobicity density distribution, generalizes the influence of water environment on protein structure and function. J. Theor. Biol. 2014, 359, 6–17. [Google Scholar] [CrossRef] [PubMed]
- Konieczny, L.; Roterman, I. Protein is an intelligent micelle. Globul. Proteins Amyloids 2020, 241–249. [Google Scholar] [CrossRef]
- Van Montfort, R.L.; Basha, E.; Friedrich, K.L.; Slingsby, C.; Vierling, E. Crystal Structure and Assembly of a Eukaryotic Small Heat Shock Protein. Nat. Struct. Biol. 2001, 8, 1025–1030. [Google Scholar] [CrossRef]


| Name | PDB ID | Mutation Position vs. Ga98 | Chain Length | Structural Form | Source Organism | Ref |
|---|---|---|---|---|---|---|
| Ga98 | 2LHC | 56 aa | 3α | de novo | [11] | |
| Gb98 | 2LHD | L45Y | 56 aa | 4β + α | de novo | [11] |
| Gb98-T25I | 2LHG | L45Y, T25I | 56 aa | 3α | de novo | [11] |
| Gb98-T25I,L20A | 2LHE | L45Y, T25I, L20A | 56 aa | 4β + α | de novo | [11] |
| Ga98 | Fragment | RD | Corr. Coeff. |
|---|---|---|---|
| Complete mol. Helix 1 Helix 2 Helix 3 Rest Helices together | 1–56 9–23 27–34 39–51 | 0.428 0.511 0.166 0.365 0.287 0.426 | 0.550 0.344 0.919 0.648 0.811 0.496 |
| Gb98 | Fragment | RD | Corr Coeff |
|---|---|---|---|
| Complete mol. Beta 1 Beta 2 Helix 1 Beta 3 (L45Y) Beta 4 Β-sheet Loops | 1–56 1–8 13–20 23–36 42–46 50–55 | 0.452 0.301 0.580 0.531 0.647 0.445 0.411 0.486 | 0.588 0.746 0.028 0.228 −0.051 0.476 0.650 0.484 |
| Gb98-T25I | Fragment | RD | Corr Coeff |
|---|---|---|---|
| Complete mol. Helix 1 Helix 2 Helix 3 (L45Y) Rest (T25I) Helices together | 1–56 9–23 28–34 39–52 | 0.485 0.509 0.349 0.446 0.453 0.463 | 0.425 0.294 0.753 0.473 0.481 0.438 |
| Ga98-T25I,L20A | Fragment | RD | Corr. Coeff. |
|---|---|---|---|
| Complete mol. Beta 1 Beta 2 (L20A) Helix 1 (T25I) Beta 3 (L45Y) Beta 4 Β-sheet Loops | 1–56 1–8 13–20 23–36 42–46 50–55 | 0.383 0.360 0.470 0.488 0.686 0.356 0.407 0.365 | 0.674 0.871 0.429 0.396 −0.252 0.683 0.670 0.684 |
© 2020 by the authors. Licensee MDPI, Basel, Switzerland. This article is an open access article distributed under the terms and conditions of the Creative Commons Attribution (CC BY) license (http://creativecommons.org/licenses/by/4.0/).
Share and Cite
Banach, M.; Fabian, P.; Stapor, K.; Konieczny, L.; Roterman, a.I. Structure of the Hydrophobic Core Determines the 3D Protein Structure—Verification by Single Mutation Proteins. Biomolecules 2020, 10, 767. https://doi.org/10.3390/biom10050767
Banach M, Fabian P, Stapor K, Konieczny L, Roterman aI. Structure of the Hydrophobic Core Determines the 3D Protein Structure—Verification by Single Mutation Proteins. Biomolecules. 2020; 10(5):767. https://doi.org/10.3390/biom10050767
Chicago/Turabian StyleBanach, Mateusz, Piotr Fabian, Katarzyna Stapor, Leszek Konieczny, and and Irena Roterman. 2020. "Structure of the Hydrophobic Core Determines the 3D Protein Structure—Verification by Single Mutation Proteins" Biomolecules 10, no. 5: 767. https://doi.org/10.3390/biom10050767
APA StyleBanach, M., Fabian, P., Stapor, K., Konieczny, L., & Roterman, a. I. (2020). Structure of the Hydrophobic Core Determines the 3D Protein Structure—Verification by Single Mutation Proteins. Biomolecules, 10(5), 767. https://doi.org/10.3390/biom10050767