Abstract
Open clusters are important tracers for studying the structure and evolution of the Milky Way, but determining their dynamical states and gravitational binding properties remains a complex task. In this study, we systematically analysed the gravitational binding states of 4809 candidate clusters by calculating their observed velocity dispersions and comparing these with theoretical velocity dispersions. We identified 3897 objects as gravitationally bound. Relative to previous classification results, this work achieves 93.60% precision and 80.04% recall, with recall increasing to 83.55% for the high-quality open cluster subset. For objects with discrepant classifications, we analysed their dynamical and photometric properties, finding that this work preferentially retains clusters with cleaner colour–magnitude diagram morphologies. This study provides a more conservative sample for studies of Galactic open clusters.
1. Introduction
The spatial distribution and dynamical state of open clusters (OCs) serve as a tracer of the history of star formation in the Milky Way [1,2]. In particular, the distribution and density structure of OCs reflect the overall morphology and mass distribution of the Milky Way [3,4,5]. Therefore, distinguishing between gravitationally bound OCs and unbound moving groups (MGs) is crucial for understanding the Galactic structure and evolutionary processes [6,7]. In recent years, high-precision astrometric data from the Gaia satellite have revolutionized the study of OCs [8,9,10]. The submilliarcsecond astrometric precision of Gaia has enabled the reconstruction of the three-dimensional spatial coordinates and kinematic characteristics of clusters, which provides a new perspective on their dynamics [11,12]. Gaia Data Release 3 (Gaia DR3) provides extensive stellar kinematic data, which improves the measurement accuracy and cluster property classification [13]. To date, cataloging efforts based on Gaia data have resulted in the identification of thousands of new candidate OCs [14,15,16,17,18]. However, distinguishing bound OCs from MGs remains a significant challenge.
The differentiation between OCs and MGs is often hindered by spatial superposition in projection. While OCs are defined as gravitationally bound aggregates [19], MGs are unbound groups that may exhibit apparent spatial clustering when projected onto the sky plane [20]. Furthermore, bound clusters undergo mass loss and expansion, causing their density and spatial profiles to gradually resemble those of MGs [21]. Consequently, traditional spatial density analysis is inadequate for reliably distinguishing between OCs and MGs, necessitating a combination of more precise kinematic and dynamical criteria.
Recently, Hunt and Reffert [22] (HR24) employed the Jacobi radius method to distinguish between OCs and MGs. In this approach, a stellar group is considered gravitationally bound if its physical size is smaller than the tidal radius imposed by the Galactic potential. This method therefore relies on assumptions regarding the large-scale Galactic gravitational field and the accuracy of cluster size estimates, and may be sensitive to uncertainties in distance and structural parameters. It should be noted that each method has its limitations and that further validation and improvement are still needed to ensure the accuracy of the classification results.
In this study, we selected the HR24 catalogue and performed a detailed analysis of all objects using the virial theorem [23]. The virial theorem approach, by contrast, evaluates the internal dynamical state by comparing the observed velocity dispersion with the value expected under approximate dynamical equilibrium. This framework is most appropriate for systems that are close to virial equilibrium and for which the adopted total mass and structural parameters reasonably trace the underlying potential. In practice, departures from equilibrium—such as expansion, tidal perturbations, or incomplete mass estimates—may introduce systematic offsets in the inferred dynamical state, and are therefore considered in the robustness analysis presented below.
2. Data
In this study, we adopted the open-cluster catalogue of HR24 [22], one of the most recent and comprehensive compilations based on Gaia DR3 astrometry. The catalogue provides membership lists for 6956 cluster candidates, which form the parent sample for our analysis.
To ensure the reliability of the stellar data, we imposed a set of stringent quality criteria on the member stars associated with each candidate. Firstly, we required that stars resided within the candidate’s Jacobi radius (identified by the flag inrj = 1 in the HR24 catalogue) to guarantee spatial confinement within the system’s gravitational boundary. Secondly, we excluded stars with poor astrometric solutions by applying a renormalised unit weight error (RUWE) threshold of 1.4, which removed about 1.01% of the stars. RUWE is a fit quality statistic provided by Gaia to identify sources with potentially problematic astrometry [10,24]. Finally, we implemented a parallax quality cut by retaining only stars with relative parallax uncertainties below 0.2, which further removed about 17.70% of the stars.
Following the application of these quality filters, we discarded candidate clusters with fewer than ten remaining stars. This threshold ensured sufficient statistics for the robust determination of candidate properties. Systems with fewer than ten members are typically low-mass, and their exclusion may lead to an under-representation of the low-mass end of the sample. However, such low-mass systems are strongly affected by stochastic fluctuations, and retaining them would substantially increase the uncertainties in velocity dispersion, thereby compromising the reliability of the subsequent dynamical classification. Consequently, their removal ensures a statistically robust sample, at the cost of completeness for low-mass systems. The final sample comprised 4809 candidate clusters, which served as the basis for the analyses presented in the subsequent sections.
3. Methods
3.1. Observed Velocity Dispersion
To characterise the internal kinematics of the candidate clusters, we first corrected the stellar proper motions for the perspective effects induced by the bulk motion of each system following the first-order treatment described by van Leeuwen (2009) [25]. This procedure ensures that the residual proper motions more faithfully trace the internal kinematics of the system. We then converted the Gaia DR3 astrometric parameters, as processed in HR24, into tangential velocity components. For individual stars, the velocity component v (in ) was derived from their proper motion (in ) and parallax (in ) following Johnson et al. [26]:
where is the standard astrometric conversion factor.
To quantify the observed velocity dispersion, we applied Principal Component Analysis (PCA) to the two-dimensional distribution of tangential velocities. PCA diagonalises the covariance matrix of the tangential velocity distribution, defining an ellipse in velocity space. The dispersions along the major and minor axes of this ellipse are denoted as and , respectively. Following the approach of Kuhn et al. [27], we defined the one-dimensional observed velocity dispersion as:
The uncertainty of the observed velocity dispersion was quantified using a hybrid Monte Carlo–Bootstrap framework. For each candidate cluster, we generated 500 Monte Carlo realisations [28] by perturbing the input astrometric parameters (pmRA, pmDE, and parallax) according to their reported measurement uncertainties, with the perturbations propagated consistently through the perspective-effect correction. Convergence tests indicate that 500 Monte Carlo realisations are sufficient to ensure stable and converged uncertainty estimates. Each perturbed realisation was subsequently resampled 100 times using non-parametric bootstrap sampling [29] to capture the sample-induced uncertainty in the velocity dispersion estimation. The corresponding uncertainties and were obtained as the standard deviations of the resulting distributions. The final uncertainty in the one-dimensional observed velocity dispersion was computed via standard error propagation [30]:
3.2. Theoretical Velocity Dispersion
The theoretical velocity dispersion was derived from the virial theorem. The equatorial coordinates and parallax (in ) of the member stars were first converted into Cartesian coordinates [31]. The centre-of-mass position of the candidate cluster was calculated as:
where denotes the Cartesian position of the i-th star, and is its photometric mass derived via isochrone fitting in the HR24 catalogue.
The total observed mass of the candidate cluster was defined as . After determining the centre-of-mass and the total observed stellar mass , we calculated the distance of each member star from the cluster centre. The spatial structure of the system was characterised by its half-mass radius , defined as the radius enclosing . This was obtained by constructing the cumulative mass distribution as a function of the radius.
With and determined, we estimated the theoretical velocity dispersion following Portegies Zwart et al. [23], with the following modifications:
where G is the gravitational constant, is the structural parameter, and denotes the total mass of the candidate cluster.
In this study, the total system mass was modelled as
where is the summed photometric mass of Gaia-resolved members and f is an empirical correction factor accounting for unresolved or missing mass components. The observed mass represents only a fraction of the intrinsic total mass of the system because several effects can lead to systematic underestimation. These include: (i) faint low-mass stars below the Gaia detection limit, which may remain incompletely sampled by Gaia [22]; (ii) unresolved binaries that are treated as single sources in photometric mass estimates [32]; and (iii) stellar remnants (white dwarfs, neutron stars, and black holes) that contribute to the system potential despite their low luminosities [33]. The combined impact of these effects is difficult to quantify robustly and may vary with system age and distance. Rather than adopting a single fixed correction, we therefore treated f as a systematic uncertainty and explored a representative range . For each value of f, the theoretical velocity dispersion was recomputed, and the stability of the dynamical classification was subsequently evaluated (see Section 3.3). This strategy allows us to assess the robustness of our results against plausible variations in the total-mass correction and to identify dynamically uncertain systems.
Furthermore, the structural parameter encapsulates assumptions about the internal density profile and is therefore not expected to be universal across our large sample of 4809 candidate clusters, which likely span a wide range of dynamical states and concentrations. As emphasized by Wolf et al. [34], virial-type coefficients depend on the (generally uncertain) mass distribution and should be regarded as a source of systematic uncertainty. In this work, we adopt as a fiducial value for the structural coefficient, while explicitly accounting for its partial degeneracy with the total-mass correction factor f. Importantly, the theoretical velocity dispersion depends on the ratio through , implying that variations in can be partly absorbed by the explored range of f. Our stress test over therefore captures the dominant scaling behaviour and largely subsumes moderate variations in . For reference, changing from 3 to 5 (a commonly adopted value for Plummer models [35]) rescales by a factor , which is smaller than the dispersion induced by our adopted f range (a factor ). We therefore treat the uncertainty in f as the dominant source of systematic uncertainty and perform a robust dynamical classification accordingly (see Section 3.3).
The uncertainty in the theoretical velocity dispersion was obtained by propagating the uncertainties in the total mass and half-mass radius [30]:
Here, the uncertainties and were determined via Monte Carlo resampling [28,29] of the stellar photometric masses and parallaxes, employing the same uncertainty-propagation methodology as used for the observed velocity dispersion.
3.3. Dynamical Classification Criteria
To assess the dynamical status of each system, we compared the observed velocity dispersion with the theoretical expectation, taking into account the combined uncertainties of the two quantities. Following the general approach of Li and Zhu [36], a system was considered dynamically consistent with a bound configuration when the observed dispersion did not exceed the theoretical value within the combined error budget. Systems with observed dispersions significantly larger than the theoretical expectation were classified as unbound.
Because the total-mass correction factor f represents a major source of systematic uncertainty, the above comparison was repeated over the full range . The final classification was defined based on the stability of the result across this range. Systems classified as bound for all tested f values were labelled as bound (B), whereas those classified as unbound for all tested f values were labelled as unbound (U). Systems whose classification changed within the explored f range were assigned to an uncertain category (O).
4. Results
4.1. Dynamical Classification Results
Following the dynamical classification scheme described in Section 3.3, we assessed the dynamical states of all 4809 candidate systems. Our analysis identified 3897 objects as bound systems (B), 648 as unbound systems (U), and 264 as uncertain systems (O). By construction, the B and U populations retain consistent classifications across the full range of tested mass-scaling factors (), whereas the O systems exhibit classification changes within this range and therefore represent intrinsically ambiguous cases. The velocity-dispersion distributions of the three populations are presented in Figure 1. Table 1 lists 25 representative examples drawn from the full sample of 4809 candidates, including their total masses, observed and theoretical velocity dispersions, associated uncertainties, and dynamical classifications. The complete dataset is publicly available, as described in the Data Availability Statement.
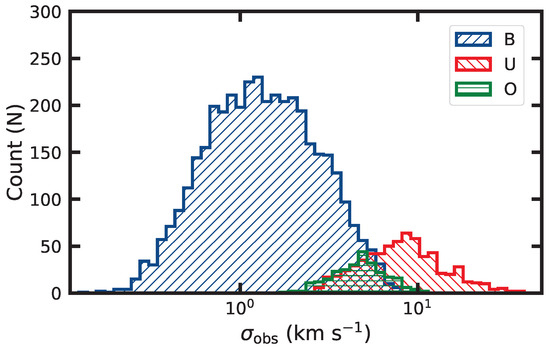
Figure 1.
Velocity dispersion distributions of 4 809 cluster candidates classified by the virial theorem. Blue, red, and green indicate the gravitationally bound (B), unbound (U), and uncertain (O) systems, respectively.

Table 1.
Observed and theoretical one-dimensional velocity dispersions for 25 example candidate clusters under different total mass correction factors f.
4.2. Comparison with HR24 Catalogue
To place our results in context, we cross-matched the systems classified as “B” in this work with the OCs reported in HR24 within the common sample of 4809 objects. Panel (a) of Figure 2 compares the velocity-dispersion distributions of our “B” sample with those of the HR24 OCs, showing that our method recovers 80.04% of the HR24 bound sample. Panel (b) presents the analogous comparison restricted to the high-quality subset defined by HR24, for which the recovery increases to 83.55%. HR24 defines high-quality OCs as those with a median colour-magnitude diagram (CMD) class greater than 0.5 and an astrometric signal-to-noise ratio (CST) greater than .
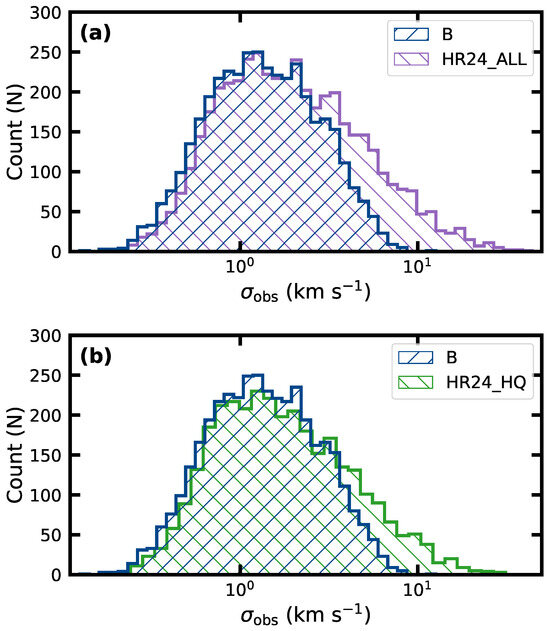
Figure 2.
Panels (a,b) show the comparison of “B” objects with all OCs and the high-quality subset from HR24, respectively, within the same parent sample.
Although our classification shows 80.04% agreement with the HR24 catalogue, a permutation test preserving marginal class fractions reveals that this overlap is comparable to random association, given that the HR24 sample is heavily dominated by bound systems. Therefore, this level of agreement should not be interpreted as simple mutual validation between the two methods. Rather, our results suggest that the current work provides a more conservative selection relative to HR24. Specifically, our pipeline achieves a precision of ≈93.6% for bound systems while retaining substantial coverage of the HR24 bound sample, suggesting that the discrepancies between the two catalogues are systematic rather than stochastic. This interpretation is further supported by the absence of strong trends with Galactic position, Jacobi radius, cluster mass, and age, as demonstrated in Section 4.3.
To investigate the physical origin of these discrepant classifications, we conducted a comparative analysis between matched HR24 bound systems (Group T, ) and unmatched ones (Group F, ). While the distributions of CST are statistically indistinguishable (Mann–Whitney U test, ), a striking divergence appears in the CMD morphology indicators. Group T exhibits significantly higher CMDCl50 values (median = 0.991) compared to Group F (median = 0.939). The Mann–Whitney U test confirms this difference with extreme statistical significance (). Furthermore, a Cliff’s of 0.22 indicates that the improvement in CMDCl50 represents a moderate yet significant effect size. This behaviour reinforces the conclusion that our method preferentially rejects clusters with inferior CMD morphologies, acting as a more conservative and reliable filter to isolate the most robust bound clusters within the HR24 sample.
4.3. Assessment of Systematic Biases and Physical Trends in Classification Discrepancies
We first examined whether the discrepancies between the two classification schemes depend on the celestial location of the clusters. The Galactic longitude and latitude distributions of the matched and discrepant samples are statistically indistinguishable, indicating that the clusters are uniformly distributed across the sky with no significant positional dependence. This demonstrates that our results do not introduce any spatial bias with respect to Galactic coordinates.
We further investigated the influence of the Jacobi radius () on the classification outcome. As shown in Figure 3, the discrepancy fraction shows moderate scatter across the observed range without exhibiting a strong systematic trend. A Mann–Whitney U test indicates a formally significant difference between the MATCH and discrepant samples (); however, the corresponding effect size is small (Cliff’s ). Notably, the median values of the two groups are nearly identical, indicating that the statistical significance is primarily driven by subtle distributional differences rather than a strong systematic shift. The binned trend is non-monotonic: the discrepancy fraction is somewhat elevated in the smallest- bin, decreases toward intermediate radii, and remains at the level of ∼10–20% over most of the populated range. In the most populated regime ( pc, ), the discrepancy fraction is close to the global average (∼18%). The enhanced value at very small likely reflects increased observational and structural uncertainties in very compact systems rather than a genuine physical bias. Overall, these results indicate that is not a dominant driver of the classification divergence and confirm that our more conservative selection maintains a stable performance across diverse dynamical scales.
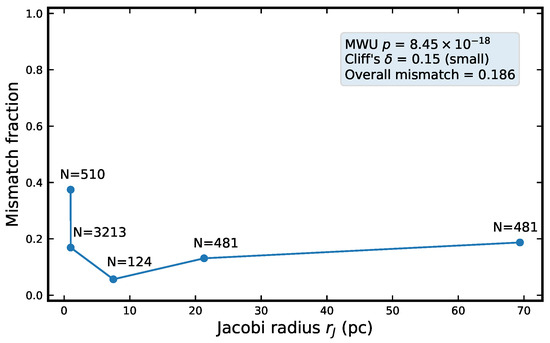
Figure 3.
Discrepancy fraction as a function of the Jacobi radius . Systems are divided into quantile based bins in , and each point shows the fraction of discrepant systems within a given bin; labels indicate the number of clusters per bin.
Finally, we examined whether discrepant clusters preferentially occupy distinct regions of parameter space. The discrepant sample exhibits marginally larger total masses and slightly older ages on average (MassTot: , ; : , ). In both cases, the effect sizes remain in the small regime, indicating modest population shifts rather than clear physical segregation. Such statistically significant yet small effect sizes are commonly encountered in large-sample studies. Overall, these results indicate that our classification remains robust across the Galactic sample. The absence of significant correlations with sky position or intrinsic cluster parameters—including Jacobi radius, mass, and age—suggests that the classification divergence is not driven by external physical or structural biases, thereby ensuring stable performance regardless of the system’s dynamical environment or evolutionary stage.
5. Conclusions and Discussion
In this work, we performed a systematic dynamical assessment of 4809 candidate clusters from the HR24 catalogue using a virial-theorem-based framework. By comparing the observed one-dimensional velocity dispersion with the theoretical expectation over a plausible range of total-mass correction factors (), we classified 3897 systems as gravitationally bound, 648 as unbound, and 264 as dynamically uncertain. Cross-comparison with HR24 shows that our method achieves high precision while acting as a more conservative filter that preferentially retains clusters with cleaner CMD morphologies. The statistical tests presented in Section 4.3 further demonstrate that the classification discrepancies do not exhibit strong dependence on sky position, Jacobi radius, mass, or age, indicating that the overall framework is stable across the Galactic sample.
The virial theorem is formally valid only for systems close to dynamical equilibrium. In practice, open clusters, particularly those that are young or undergoing dissolution, may exhibit global expansion [37], internal rotation [38], or kinematic substructure, all of which can introduce deviations between the observed velocity dispersion and the equilibrium expectation [39,40]. The classifications presented here should therefore not be interpreted as strict proof of dynamical equilibrium, especially for individual systems within such a large statistical sample. Importantly, several aspects of our methodology help mitigate these effects. The PCA-based dispersion estimator reduces sensitivity to directional anisotropy in the tangential velocity plane, while the multi-f stability criterion explicitly separates dynamically ambiguous objects into the “O” category. Furthermore, the absence of strong correlations between classification discrepancies and global cluster parameters indicates that large-scale non-equilibrium effects are unlikely to dominate the overall population statistics. Nevertheless, for very young or rapidly evolving clusters, departures from virial equilibrium may still introduce systematic biases, and caution is warranted when interpreting individual cases.
A small number of clusters listed in Table 1 (e.g., NGC 2423) exhibit observed dispersions substantially below the virial expectation while still being classified as bound. This behaviour follows directly from the adopted classification criterion, in which systems are identified as unbound only when significantly exceeds the theoretical value. Physically, an unusually low does not contradict a bound configuration; instead, it may reflect mild overestimation of the total mass, underestimation of the half-mass radius, small-number statistics in sparsely populated clusters, residual incompleteness in member selection. These extreme cases represent a small fraction of the full sample and do not drive the global statistical trends, but they remain valuable targets for future detailed studies using full phase-space information and improved mass modelling.
Our observed velocity dispersion estimates are derived from Gaia tangential motions because radial velocities are not yet available for the full sample. For isotropic systems, the PCA-based estimator provides an unbiased proxy for the one-dimensional dispersion. However, in the presence of significant velocity anisotropy, the absence of radial velocities may introduce moderate biases in . Empirically, the large-sample tests in Section 4.3 reveal no strong systematic trends that would indicate widespread anisotropy-driven misclassification. In future work, the inclusion of radial velocity data will enable a more refined dynamical assessment of individual systems.
In summary, this work provides a more conservative sample of Galactic open clusters. Although the method necessarily involves simplifying assumptions, the robustness tests and conservative classification scheme ensure that the resulting bound sample is well suited for studies of Galactic open clusters. Future work incorporating full three-dimensional kinematics, improved mass modelling, and time-dependent dynamical diagnostics will further strengthen the physical interpretation of individual systems.
Author Contributions
Z.L. proposed the research idea, developed the methodology and code, supervised the project, and secured funding. C.Y. carried out the data processing, analysis, visualization, and code modification. J.L. and B.Q. participated in the writing and revision of the manuscript. Z.L. and C.Y. contributed equally to the original draft and reviewed and edited the manuscript. All authors have read and agreed to the published version of the manuscript.
Funding
This work has been supported by the National Natural Science Foundation of China (No. 12473029) and Development Fund Project of Dali University.
Data Availability Statement
The data can be derived from Zenodo (DOI: 10.5281/zenodo.18098328).
Acknowledgments
This work has made use of data from the European Space Agency (ESA) mission Gaia (https://www.cosmos.esa.int/gaia (accessed on 2 August 2025)), processed by the Gaia Data Processing and Analysis Consortium (DPAC, https://www.cosmos.esa.int/web/gaia/dpac/consortium (accessed on 2 August 2025)). Funding for DPAC has been provided by national institutions, in particular the institutions participating in the Gaia Multilateral Agreement. This work also made use of the catalogue of Galactic open clusters published by HR24 [22], and associated data analysis results, which are based on Gaia DR3 observations.
Conflicts of Interest
The authors declare no conflicts of interest.
References
- Spina, L.; Magrini, L.; Cunha, K. Mapping the Galactic Metallicity Gradient with Open Clusters: The State-of-the-Art and Future Challenges. Universe 2022, 8, 87. [Google Scholar] [CrossRef]
- Xiang, Y.; Xi, J.; Shao, Z.; Wang, M.; Yang, Y. Open clusters identifying by multi-scale density feature learning. Astrophys. Space Sci. 2021, 366, 17. [Google Scholar] [CrossRef]
- Dias, W.S.; Monteiro, H.; Moitinho, A.; Lépine, J.R.D.; Carraro, G.; Paunzen, E.; Alessi, B.; Villela, L. Updated parameters of 1743 open clusters based on Gaia DR2. Mon. Not. R. Astron. Soc. 2021, 504, 356–371. [Google Scholar] [CrossRef]
- Castro-Ginard, A.; McMillan, P.J.; Luri, X.; Jordi, C.; Romero-Gómez, M.; Cantat-Gaudin, T.; Casamiquela, L.; Tarricq, Y.; Soubiran, C.; Anders, F. Milky Way spiral arms from open clusters in Gaia EDR3. Astron. Astrophys. 2021, 652, A162. [Google Scholar] [CrossRef]
- Li, Z.; Liu, X. Relation between photometric and parameter errors of star clusters. Mon. Not. R. Astron. Soc. 2023, 525, 827–839. [Google Scholar] [CrossRef]
- Li, Z.; Deng, Y.; Chen, J. Revisiting the Fundamental Parameters of 49 New Star Clusters in Gaia DR2. Astrophys. J. Suppl. Ser. 2021, 253, 38. [Google Scholar] [CrossRef]
- Qin, C.; Pang, X.; Pasquato, M.; Kouwenhoven, M.B.N.; Vallenari, A. The 3D morphology of open clusters in the solar neighborhood: III. Fractal dimension of open clusters. Astron. Astrophys. 2025, 695, A22. [Google Scholar] [CrossRef]
- Gaia Collaboration; Prusti, T.; de Bruijne, J.H.J.; Brown, A.G.A.; Vallenari, A.; Babusiaux, C.; Bailer-Jones, C.A.L.; Bastian, U.; Biermann, M.; Evans, D.W.; et al. The Gaia mission. Astron. Astrophys. 2016, 595, A1. [Google Scholar] [CrossRef]
- Gaia Collaboration; Brown, A.G.A.; Vallenari, A.; Prusti, T.; de Bruijne, J.H.J.; Babusiaux, C.; Bailer-Jones, C.A.L.; Biermann, M.; Evans, D.W.; Eyer, L.; et al. Gaia Data Release 2. Summary of the contents and survey properties. Astron. Astrophys. 2018, 616, A1. [Google Scholar] [CrossRef]
- Gaia Collaboration; Brown, A.G.A.; Vallenari, A.; Prusti, T.; de Bruijne, J.H.J.; Babusiaux, C.; Biermann, M.; Creevey, O.L.; Evans, D.W.; Eyer, L.; et al. Gaia Early Data Release 3. Summary of the contents and survey properties. Astron. Astrophys. 2021, 649, A1. [Google Scholar] [CrossRef]
- Cantat-Gaudin, T.; Jordi, C.; Vallenari, A.; Bragaglia, A.; Balaguer-Núñez, L.; Soubiran, C.; Bossini, D.; Moitinho, A.; Castro-Ginard, A.; Krone-Martins, A.; et al. A Gaia DR2 view of the open cluster population in the Milky Way. Astron. Astrophys. 2018, 618, A93. [Google Scholar] [CrossRef]
- Zhong, J.; Chen, L.; Kouwenhoven, M.B.N.; Li, L.; Shao, Z.; Hou, J. Substructure and halo population of Double Cluster h and χ Persei. Astron. Astrophys. 2019, 624, A34. [Google Scholar] [CrossRef]
- Katz, D.; Sartoretti, P.; Guerrier, A.; Panuzzo, P.; Seabroke, G.M.; Thévenin, F.; Cropper, M.; Benson, K.; Blomme, R.; Haigron, R.; et al. Gaia Data Release 3. Properties and validation of the radial velocities. Astron. Astrophys. 2023, 674, A5. [Google Scholar] [CrossRef]
- Ferreira, F.A.; Corradi, W.J.B.; Maia, F.F.S.; Angelo, M.S.; Santos, J.F.C., Jr. New star clusters discovered towards the Galactic bulge direction using Gaia DR2. Mon. Not. R. Astron. Soc. 2021, 502, L90–L94. [Google Scholar] [CrossRef]
- He, Z.; Li, C.; Zhong, J.; Liu, G.; Bai, L.; Qin, S.; Jiang, Y.; Zhang, X.; Chen, L. New Open-cluster Candidates Found in the Galactic Disk Using Gaia DR2/EDR3 Data. Astrophys. J. Suppl. Ser. 2022, 260, 8. [Google Scholar] [CrossRef]
- Li, Z.; Deng, Y.; Chi, H.; Chen, J.; Liu, X.; Yan, C.; Chen, W.; Guo, W.; Xia, T. LISC Catalog of Star Clusters. I. Galactic Disk Clusters in Gaia EDR3. Astrophys. J. Suppl. Ser. 2022, 259, 19. [Google Scholar] [CrossRef]
- Hunt, E.L.; Reffert, S. Improving the open cluster census. II. An all-sky cluster catalogue with Gaia DR3. Astron. Astrophys. 2023, 673, A114. [Google Scholar] [CrossRef]
- Li, Z.; Mao, C. LISC Catalog of Star Clusters. II. High Galactic Latitude Open Clusters in Gaia EDR3. Astrophys. J. Suppl. Ser. 2023, 265, 3. [Google Scholar] [CrossRef]
- Deb, S.; Baruah, A.; Kumar, S. Ensemble-based unsupervised machine learning method for membership determination of open clusters using Mahalanobis distance. Mon. Not. R. Astron. Soc. 2022, 515, 4685–4701. [Google Scholar] [CrossRef]
- Hoogerwerf, R.; Aguilar, L.A. Identification of moving groups and member selection using HIPPARCOS data. Mon. Not. R. Astron. Soc. 1999, 306, 394–406. [Google Scholar] [CrossRef][Green Version]
- Krause, M.G.H.; Offner, S.S.R.; Charbonnel, C.; Gieles, M.; Klessen, R.S.; Vázquez-Semadeni, E.; Ballesteros-Paredes, J.; Girichidis, P.; Kruijssen, J.M.D.; Ward, J.L.; et al. The Physics of Star Cluster Formation and Evolution. Space Sci. Rev. 2020, 216, 64. [Google Scholar] [CrossRef]
- Hunt, E.L.; Reffert, S. Improving the open cluster census. III. Using cluster masses, radii, and dynamics to create a cleaned open cluster catalogue. Astron. Astrophys. 2024, 686, A42. [Google Scholar] [CrossRef]
- Portegies Zwart, S.F.; McMillan, S.L.W.; Gieles, M. Young Massive Star Clusters. Annu. Rev. Astron. Astrophys. 2010, 48, 431–493. [Google Scholar] [CrossRef]
- Everall, A.; Boubert, D.; Koposov, S.E.; Smith, L.; Holl, B. Completeness of the Gaia-verse–IV. The astrometry spread function of Gaia DR2. Mon. Not. R. Astron. Soc. 2021, 502, 1908–1924. [Google Scholar] [CrossRef]
- van Leeuwen, F. Parallaxes and proper motions for 20 open clusters as based on the new Hipparcos catalogue. Astron. Astrophys. 2009, 497, 209–242. [Google Scholar] [CrossRef]
- Johnson, D.R.H.; Soderblom, D.R. Calculating Galactic Space Velocities and Their Uncertainties, with an Application to the Ursa Major Group. Astron. J. 1987, 93, 864. [Google Scholar] [CrossRef]
- Kuhn, M.A.; Hillenbrand, L.A.; Sills, A.; Feigelson, E.D.; Getman, K.V. Kinematics in Young Star Clusters and Associations with Gaia DR2. Astrophys. J. 2019, 870, 32. [Google Scholar] [CrossRef]
- Metropolis, N.; Ulam, S. The Monte Carlo Method. J. Am. Stat. Assoc. 1949, 44, 335–341. [Google Scholar] [CrossRef]
- Babamoradi, H.; van den Berg, F.; Rinnan, Å. Bootstrap based confidence limits in principal component analysis—A case study. Chemom. Intell. Lab. Syst. 2013, 120, 97–105. [Google Scholar] [CrossRef]
- Taylor, J. Introduction to Error Analysis, the Study of Uncertainties in Physical Measurements, 2nd ed.; University Science Books: Sausalito, CA, USA, 1997. [Google Scholar]
- Bossini, D.; Vallenari, A.; Bragaglia, A.; Cantat-Gaudin, T.; Sordo, R.; Balaguer-Núñez, L.; Jordi, C.; Moitinho, A.; Soubiran, C.; Casamiquela, L.; et al. Age determination for 269 Gaia DR2 open clusters. Astron. Astrophys. 2019, 623, A108. [Google Scholar] [CrossRef]
- Wirth, H.; Dinnbier, F.; Kroupa, P.; Šubr, L. The masses of open star clusters and their tidal tails and the stellar initial mass function. Astron. Astrophys. 2024, 691, A143. [Google Scholar] [CrossRef]
- Sollima, A.; Baumgardt, H. The global mass functions of 35 Galactic globular clusters: I. Observational data and correlations with cluster parameters. Mon. Not. R. Astron. Soc. 2017, 471, 3668–3679. [Google Scholar] [CrossRef]
- Wolf, J.; Martinez, G.D.; Bullock, J.S.; Kaplinghat, M.; Geha, M.; Muñoz, R.R.; Simon, J.D.; Avedo, F.F. Accurate masses for dispersion-supported galaxies. Mon. Not. R. Astron. Soc. 2010, 406, 1220–1237. [Google Scholar] [CrossRef]
- Plummer, H.C. On the problem of distribution in globular star clusters. Mon. Not. R. Astron. Soc. 1911, 71, 460–470. [Google Scholar] [CrossRef]
- Li, Z.; Zhu, Z. A study of newly discovered close binary open cluster candidates in the Milky Way from Gaia DR3. Astron. Astrophys. 2025, 700, A280. [Google Scholar] [CrossRef]
- Della Croce, A.; Dalessandro, E.; Livernois, A.; Vesperini, E. Young, wild, and free: The early expansion of star clusters. Astron. Astrophys. 2024, 683, A10. [Google Scholar] [CrossRef]
- Healy, B.F.; McCullough, P.R.; Schlaufman, K.C. Stellar Spins in the Pleiades, Praesepe, and M35 Open Clusters. Astrophys. J. 2021, 923, 23. [Google Scholar] [CrossRef]
- Guilherme-Garcia, P.; Krone-Martins, A.; Moitinho, A. Detection of open cluster rotation fields from Gaia EDR3 proper motions. Astron. Astrophys. 2023, 673, A128. [Google Scholar] [CrossRef]
- Hao, C.J.; Xu, Y.; Hou, L.G.; Bian, S.B.; Lin, Z.H.; Li, Y.J.; Dong, Y.W.; Liu, D.J. Probing the Nature of Rotation in the Pleiades, Alpha Persei, and Hyades Clusters. Astrophys. J. 2024, 963, 153. [Google Scholar] [CrossRef]


Disclaimer/Publisher’s Note: The statements, opinions and data contained in all publications are solely those of the individual author(s) and contributor(s) and not of MDPI and/or the editor(s). MDPI and/or the editor(s) disclaim responsibility for any injury to people or property resulting from any ideas, methods, instructions or products referred to in the content. |
© 2026 by the authors. Licensee MDPI, Basel, Switzerland. This article is an open access article distributed under the terms and conditions of the Creative Commons Attribution (CC BY) license.