Article

Reduction of Electromagnetic Interference for Permanent Magnet Synchronous Motor Using Random PWM Switching Method Based on Four-Switch Three-Phase Inverters

College of Information Science and Engineering, Huaqiao University, Xiamen 361021, China
*
Author to whom correspondence should be addressed.
Electronics 2020, 9(12), 1998; https://doi.org/10.3390/electronics9121998
Submission received: 24 October 2020 / Revised: 20 November 2020 / Accepted: 23 November 2020 / Published: 25 November 2020

Abstract

:
The four-switch three-phase inverters have become an effective approach for fault-tolerant reconstruction and operation of the six-switch three-phase topology. However, the conventional control strategy for four-switch three-phase inverters can result in a large number of current harmonic components, high electromagnetic acoustic noise, and electromagnetic interference (EMI). Therefore, this paper proposes a random switching frequency pulse width modulation method under the centrosymmetry period with a two-state Markov chain based on four-switch three-phase inverters (RSFPWM-CPTMC). In this method, random numbers are optimized and evenly distributed on both sides of the center frequency within a specific frequency bandwidth range, which significantly reduces the current harmonics and EMI at the switching frequency and frequency multiplication. The spectral characteristics generated by the random switching frequency under the centrosymmetry period with the two-state Markov chain are evaluated and compared to that provided by the traditional fixed switching frequency pulse width modulation (FSFPWM). Simulations and experiments are carried out to illustrate the superiority of the proposal.

1. Introduction

In power electronics technology, as highly efficient and clean carriers of power conversion [1,2,3], voltage source inverters have gradually penetrated into various fields such as power adapter, rail transit, and solar/wind power generation [4,5,6,7]. Simultaneously, the emergence of pulse width modulation (PWM) technology promotes the development of frequency conversion control technology. However, for the system and the load, there are a lot of harmonics in the output, which generate EMI and electromagnetic noise [8], and reduce the electromagnetic compatibility quality, thereby affecting the regular operation of the power electronics converters themselves and other equipment [9,10,11,12].
Given the above problems in fixed switching frequency pulse width modulation, researchers started with the modulation method to optimize the PWM [13,14,15], such as the specific harmonic elimination method. However, this method has no universally applicable value. Reference [16] proposed a random PWM strategy, studied the mechanism and characteristics of harmonic generation and analyzed internal factors to improve the effect of vibration and noise and EMI reduction [17,18].
The general random PWM (RPWM) strategy can be divided into random pulse position modulation, random switch pulse width modulation (RSPWM), and random switching frequency PWM (RSFPWM) [19,20,21,22]. RSPWM takes the modulation signal into consideration [23], but when the modulation coefficient is low, the distortion of the modulation signal will be more serious. Therefore, researches began to include the selection of mathematical statistics of random signals, weight assignment at different times, and the influence of the statistical parameters of the pulse position distribution on the frequency spectrum and the corresponding power spectral density function characteristics [24,25]. Simultaneously, the drawbacks of these methods are similar to RSPWM, and it is difficult to obtain an exact analytical formula for the output voltage harmonic spectrum.
RSFPWM is the most recognized RPWM by researchers in this field [26]. Where random carrier frequency modulation fixed duty (RCFMFD) is a common strategy of RSFPWM, and it affects the spectral distribution of the output harmonics [27]. Currently, the application of RSFPWM technology mainly concentrates on diverse DC/DC, six-switch three-phase inverters, etc. [28,29,30]. The RCFMFD strategy follows the principle of random switching frequency with a fixed duty cycle, which is consistent with the proposed strategy in this paper. Thus, the vector waveform is combined with a fixed value in each switching cycle, and the normal operation of the motor is ensured. The duty cycle calculation value of different sectors is different, so the duty cycle is different in the whole time process. In addition, based on the RCFMFD strategy and the vector waveform characteristics of the FSTPI, this paper improved the carrier generation method, and generated the periodic symmetrical carrier wave, which reduced the harmonic influence when switching between different sectors. Therefore, the proposed strategy can be flexibly applied to a four-switch three-phase inverter and verified.
With the development of power electronic technology, FSTPI, a new category of inverter topology equipment has attracted much attention in the motor speed control system [31,32,33]. The FSTPI provides reliable fault-tolerant operation for six-switch three-phase and achieves good control performance of the motor by virtue of its simple driving circuit, low conduction loss and cost. On the other hand, FSFPWM-FSTPI technology can also cause problems such as EMI to the switching frequency system. Therefore, this paper investigates the RSFPWM-CPTMC technique for FSTPI. In particular, the random numbers are optimized and evenly distributed on both sides of the central frequency within the specific central symmetric frequency bandwidth. The harmonic spread factor (HSF) performance index and total harmonic distortion (THD) are introduced to evaluate the spectrum performance of the weakened current harmonics and power spectral density (PSD), so as to achieve wide and relatively uniform continuous spectrum characteristics, which significantly reduce the current harmonics and EMI at the switching frequency and its harmonics. The simulation and experimental results are carried out to illustrate the superiority and effectiveness of the proposed RSFPWM-CPTMC strategy compared with the scheme of the conventional FSFPWM and RCFMFD strategy.
The rest of this paper is organized as follows. Section 2 describes the vector control system for a permanent magnet synchronous motor (PMSM) based on FSTPI. Section 3 shows the theoretical background of PWM-FSTPI technology. Section 4 shows the detailed simulation and experimental results that are obtained by the proposed strategy. Section 5 provides the final comments of this paper. In particular, the main contributions are as follows in this paper.
(1)
In this paper, this is the first time to provide a new RSFPWM-CPTMC strategy for FSTPI, which combines the proposed carrier under the centrosymmetry period with a two-state Markov chain to be a novel RPWM strategy. By introducing the performance index of HSF and THD to evaluate frequency spectrum characteristics.
(2)
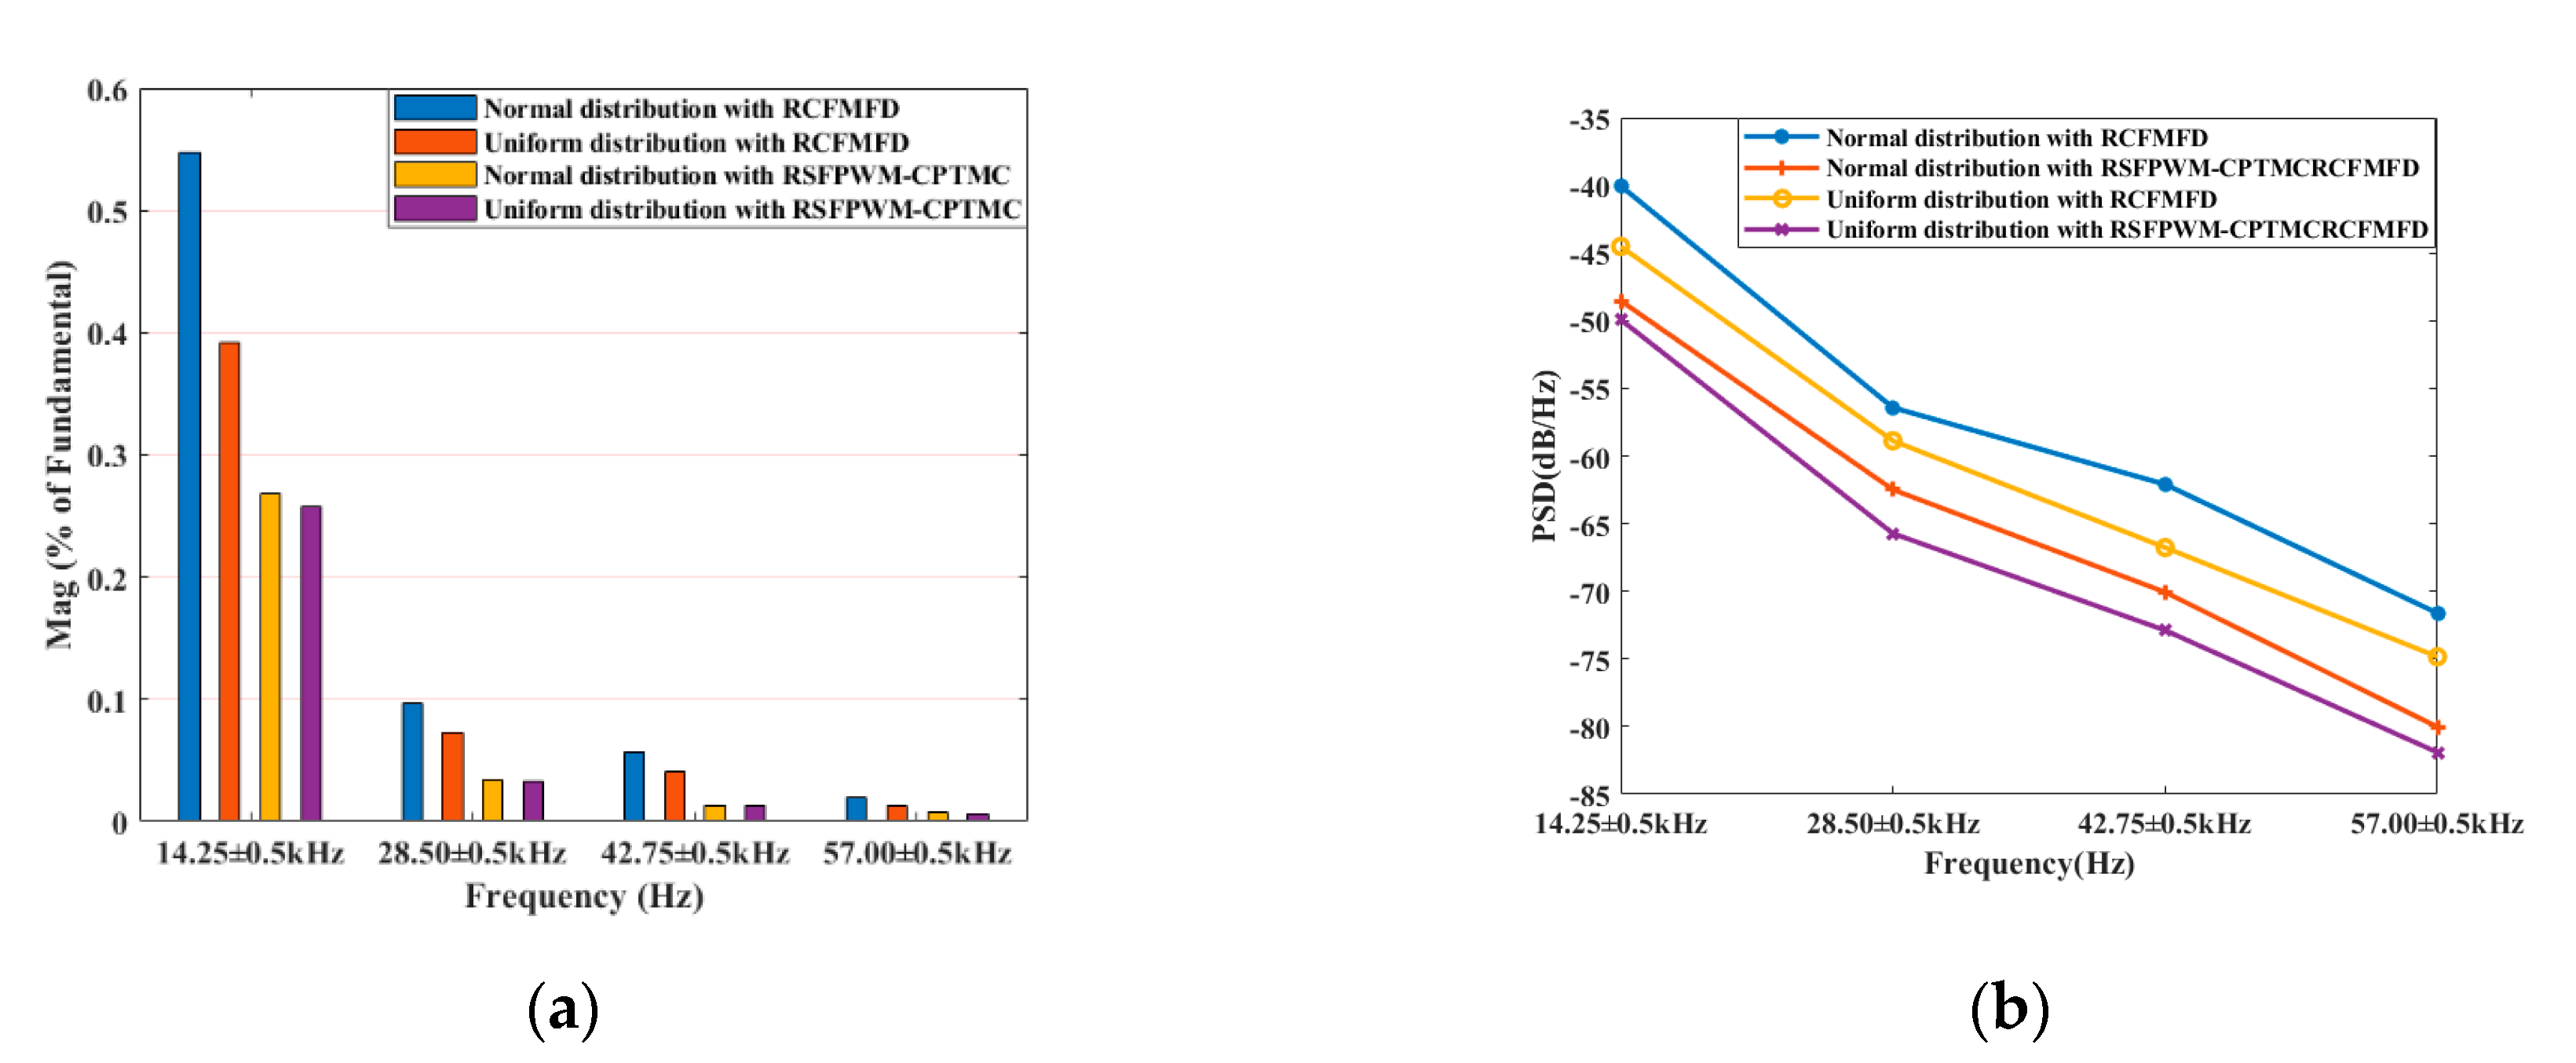
Based on the RCFMFD strategy and the characteristics of the space vector pulse width modulation (SVPWM) waveform for FSTPI, this paper proposes the RSFPWM-CPTMC strategy to reduce the current harmonics and EMI generated by switching between different sectors. By comparing the randomness of different random distribution modes, the simulation and experimental results based on RSFPWM-CPTMC strategy are presented to indicate the effective and superior performance of EMI compared to the conventional FSFPWM and RCFMFD scheme.

2. The Vector Control System for PMSM

2.1. The Mathematical Model of PMSM

To facilitate the design of the later controller and the control effect of the PMSM, a simple and feasible mathematical model based on the control strategy with id = 0 is applied in this paper [34]. Typically, the mathematical model under the d-q axis of the synchronous rotating coordinate system is selected, and the stator flux equation, stator voltage equation, and electromagnetic torque equation are:
{ ψ d = L d i d + ψ f ψ q = L q i q
{ u d = R i d + d d t ψ d ω e ψ q u q = R i q + d d t ψ q + ω e ψ d
T e = 3 2 n p [ ψ f i q + ( L d L q ) i d i q ]
where Ψd, Ψq, ud, uq, id, iq are the d-q axis components of stator flux, stator voltage, and stator current; R, ωe, Ψf, np, Ld, Lq are the stator resistance, electrical angular velocity, permanent magnet flux, motor pole pairs and d-q axis components of inductance respectively.
As shown in Figure 1, the vector control system includes an outer loop based on speed and an inner loop based on current.

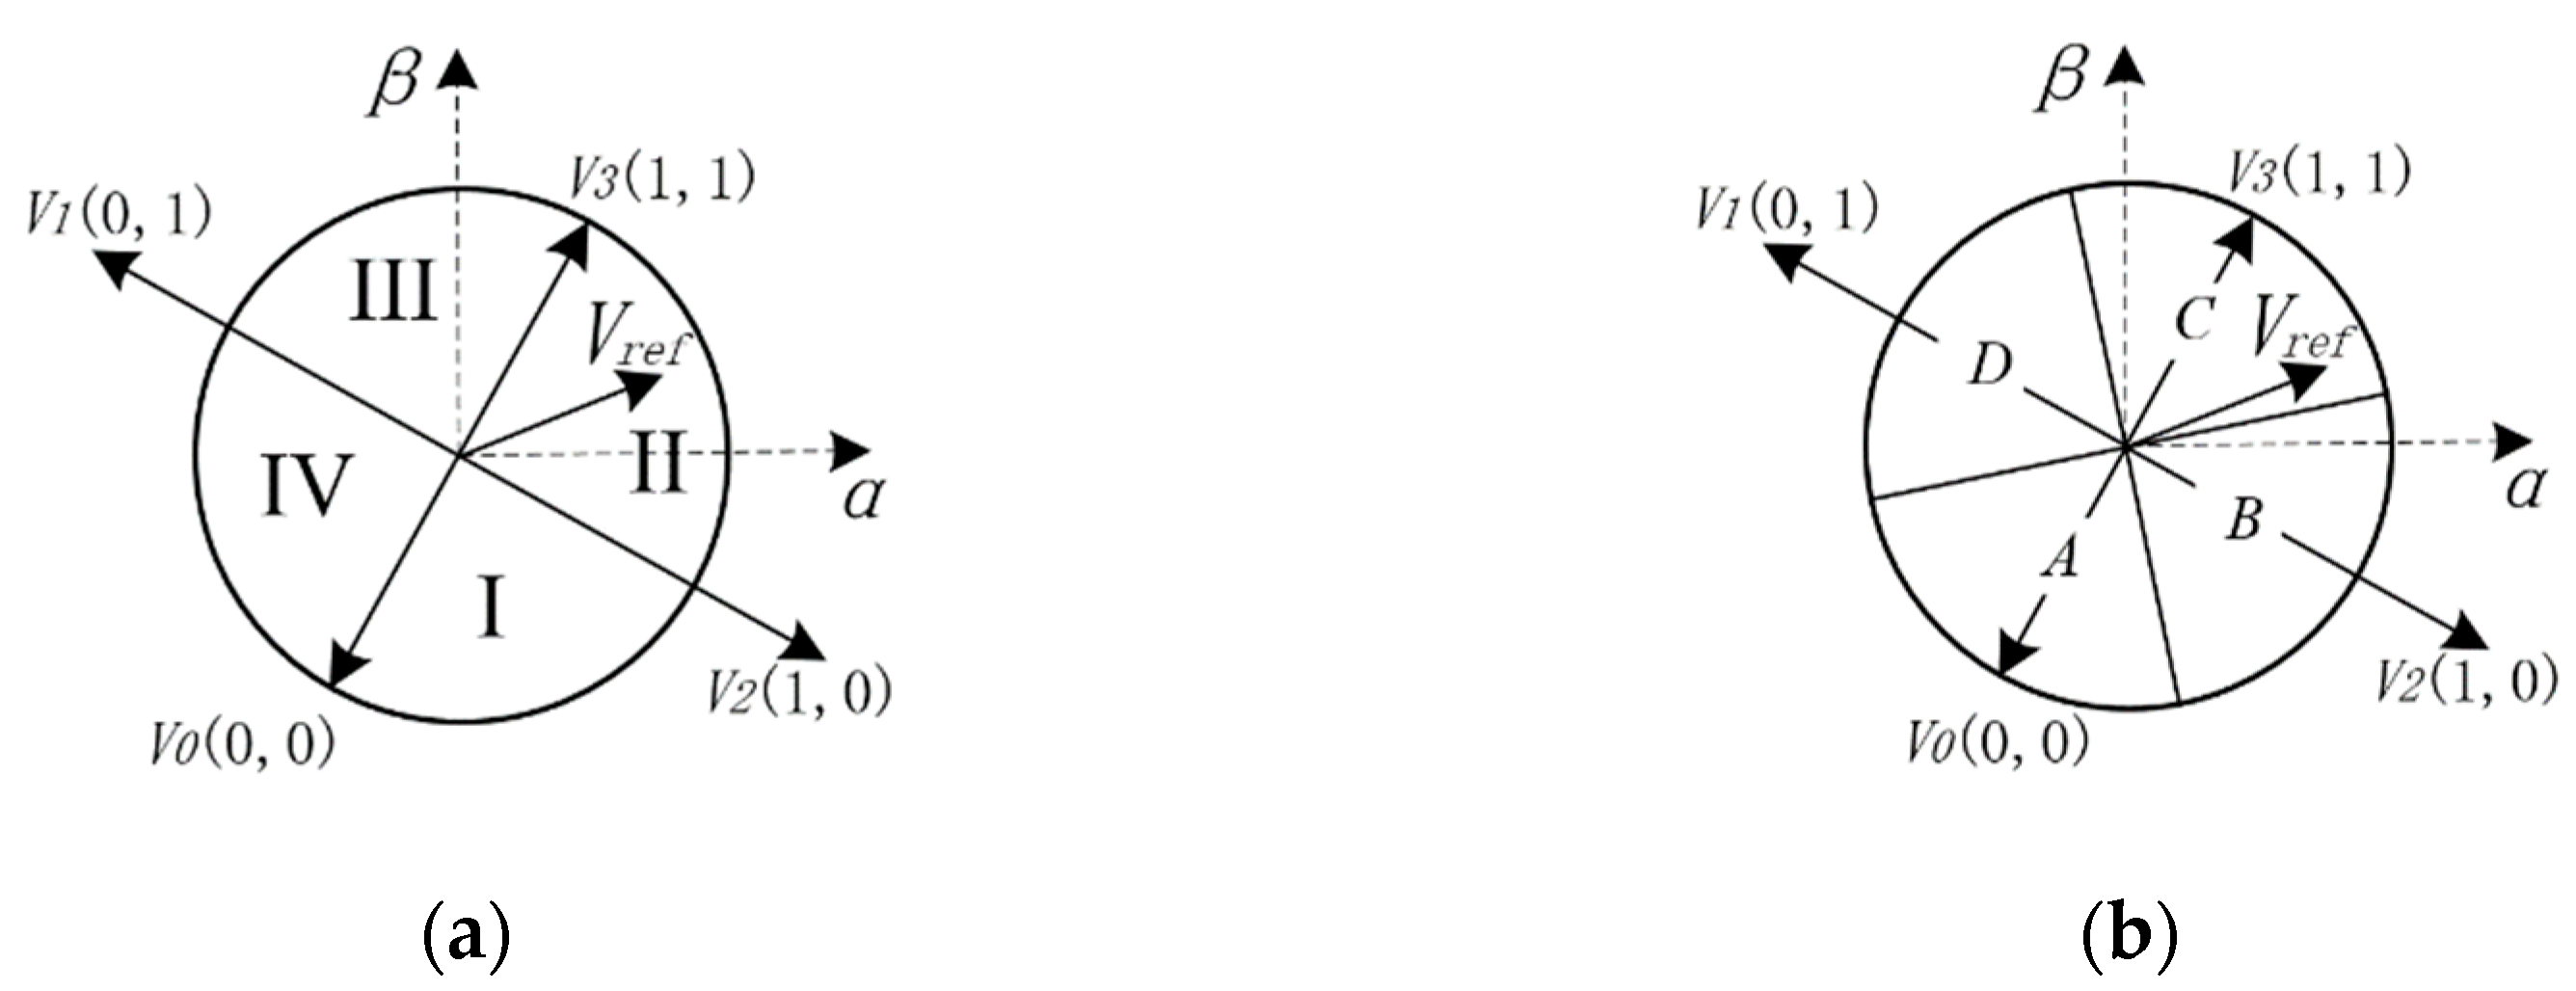
2.2. The Basic Principle of FSTPI

Figure 2 shows the topology of FSTPI in PMSM control system. By setting the switching state, combination sequence, and switching time of the inverter power switches in Figure 2 to make the voltage space vector run in a circular trajectory, the switching state table of FSTPI under star load can be obtained as shown in Table 1.
Since the SVPWM algorithm has the advantages of easy digitization and high voltage utilization, this paper makes a theoretical analysis of FSTPI based on the algorithm. Through the principle that the total power is unchanged, the three-phase phase voltages obtained in the four switching states are converted from the three-phase ABC coordinate plane to the α-β plane rectangular coordinate system as shown in Figure 3a, the vector of V0V3 are obtained and transformation matrix is:
T A B C α β = 2 3 [ 1 1 2 1 2 0 3 2 3 2 ]
According to Table 1 and (4), the corresponding components in α-β coordinate system can be obtained, and the results are shown in Table 2. From Uα and Uβ vector distribution values under different switch combinations in Table 2, the basic voltage vector and partition method of FSTPI can be obtained as shown in Figure 3a.
As shown in Figure 3a, according to the volt-second characteristic, the reference vector (Vref) can be synthesized by V0V3 and expressed as:
V ref T P W M = V 0 t 0 + V 1 t 1 + V 2 t 2 + V 3 t 3
where t0t3 are the action time of V0V3; TPWM is the action time of Vref and can be figured out as:
T P W M = t 0 + t 1 + t 2 + t 3
It can be derived from Figure 3a that V0 = −V3 = v1α + jv1β and V1 = −V2 = v2α + jv2β, and the relationship between the two sets of vectors is substituted into Equation (5) to obtain:
{ V r e f T P W M = V 0 t 03 + V 2 t 21 t 03 = t 0 t 3 t 21 = t 2 t 1
Therefore, according to the projection relationship of V0 and V2 in the α-β coordinate system in Table 2, it can be obtained as:
{ t 03 = 3 2 ( V r e f α + 3 V r e f β ) T P W M E t 21 = 3 2 ( V r e f α 1 3 V r e f β ) T P W M E
As can be seen from the above, the three sets of equations cannot be solved from t0–t3 in relation to Equations (6) and (8). Therefore, this article uses the following time setting method. When the inverter outputs zero vector, the stator flux linkage of the motor remains unchanged and insert a zero vector δT during TPWM, let:
T P W M = | t 03 | + | t 21 | + δ T
There are three equivalent ways for the zero vector. In this paper, the coefficient k is used to divide the zero vector into two parts, T and (1 − k) δT, 0 < k < 1, i.e., V0, V3 and V1, V2 work together. It can be obtained by transforming from formula (9), the action schedule of the vector is shown in Table 3.
Since the Vref of the FSTPI in the α-β coordinate system lacks a zero vector, the three basic voltage vectors closest to the Vref are artificially selected. As shown in Figure 3b, the original sector 1–4 of FSTPI is replaced by sector A–D and selects the sector by comparing the values of t03 and t21 as shown in Table 4. The segmentation method and selection principles of zero-vector in this paper are: (1) Ensure that switching times of the power switches is minimum; (2) Each time the voltage space vector changes, only the switch of one bridge arm acts. As shown in Figure 4, the five-stage voltage SVPWM waveform generated according to the above principles is selected.

3. The PWM-FSTPI Technology

The output control of the PWM inverter can be achieved by controlling the duty cycle of the switching device. The duty cycle has nothing to do with the conduction position (i.e., conduction angle) of the switching device and the switching frequency. However, the change of the conduction position and the switching frequency affect the frequency distribution of the inverter output. If the conduction position or switching frequency is changed in a random manner, the output of the inverter can get a wide and relatively uniform continuous spectrum, and some larger harmonic components, electromagnetic acoustic noise, and EMI can be effectively suppressed derived from the PSD results [35]. Therefore, this paper mainly studies the application of RSFPWM-CPTMC technology.

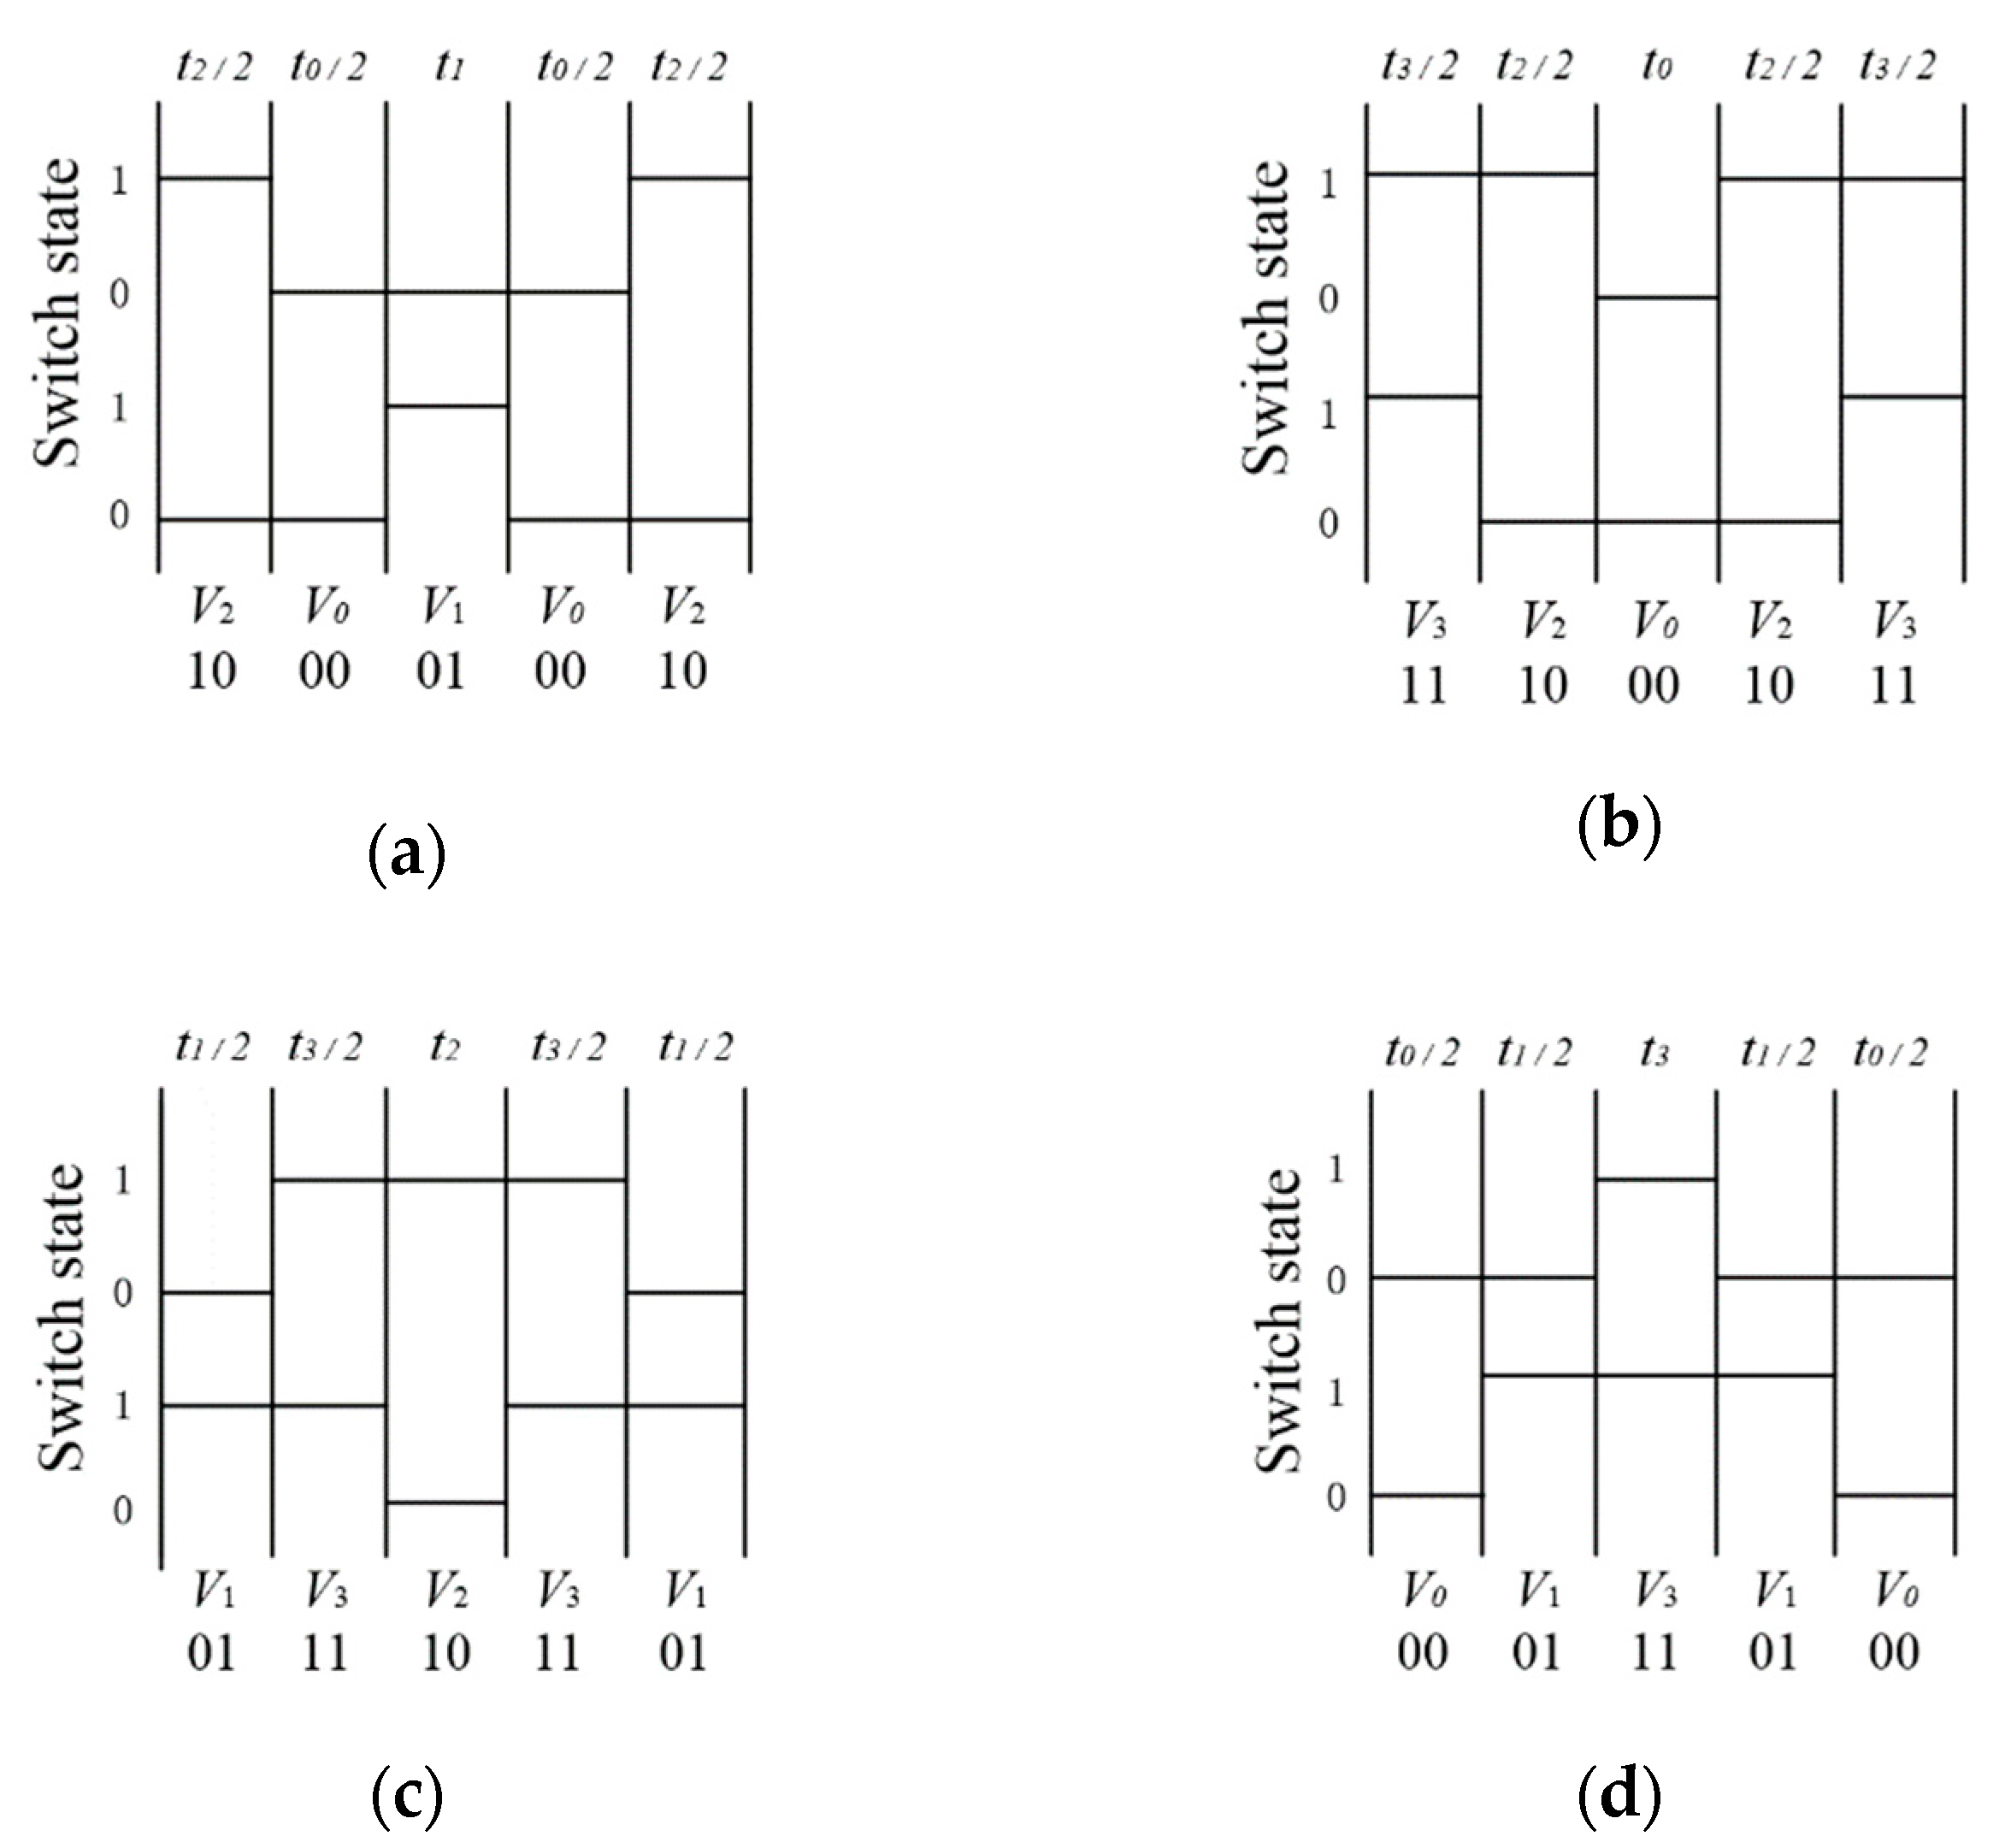
3.1. Conventional FSFPWM Technology

The conventional FSFPWM technology is to fix the carrier frequency fs = 1/Ts to a constant value. Figure 5 is a schematic diagram of a fixed switching function g(t) and the expression is as follows:
g ( t ) = lim N k = 1 k = N g k ( t t k )
It can be seen from Figure 5 that the autocorrelation function of the switch function g(t) is Rg(τ), which is defined as:
R g ( τ ) = E [ lim T 0 1 T 0 0 T 0 g ( t ) g ( t + τ ) d τ ]
where E[·] expresses mathematical expectation; T0 is the observation interval and contains N number of expected values Tk, namely:
T 0 = N E [ T k ]
From Equations (10)–(12), Wiener–Khintchine theorem and Poisson formula, the PSD of a fixed period PWM signal is:
S P ( f ) = 1 ( T s ) 2 | G ( f ) | 2 k = 1 δ ( f k T s )
It can be seen from Equation (13) that the component of PSD at this time is mainly concentrated at the switching frequency and frequency multiplication, the amplitude of each harmonic is determined by |G(f)|2/(Ts)2 when f = k/Ts, and these discrete harmonic energy are prone to generate EMI and other issues.

3.2. Proposed RSFPWM-CPTMC Technology

Random switching frequency pulse width modulation method under the centrosymmetry period (RSFPWM-CP) technology is to make the carrier frequency change according to some random law within a certain frequency range, as shown in Figure 6. The expression of the triangular carrier of the centrosymmetry period proposed in this paper is as follows:
f c = f c 0 + R i Δ f
where Ri is a random number in the range of [–1, 1]; fc0 is the center frequency; Δf is the frequency variable range, and both are constant; fc is a set of random numbers that change within a certain range.
When fc changes randomly within this range, the PSD of its output waveform changes as Ri changes. Therefore, the PSD distribution of higher harmonics is closely related to the random number distribution.
After adopting the RSFPWM strategy, the switching period in formula (12) changes randomly. Hence, the probability density distribution function is set to P(TK). If it satisfies uniform distribution, let:
P ( T K ) = 1 T max T min = 1 R T T S
where Tmax, Tmin are the maximum and minimum values of the switching period; TS is the average switching period; RT is the random degree of switching period.
Then the PSD expression of RSFPWM-CP technology is:
S P ( f , R T ) = 1 E [ T k ] { E [ | G ( f ) | 2 ] + 2 Re { E [ G ( f ) e j 2 π f T k ] E [ G ( f ) ] 1 E [ e j 2 π f T k ] } }
where E[·] expresses mathematical expectation; G(f) is the Fourier transform; G*(f) is the conjugate complex numbers of G(f).
It is known from Equation (16) that P(TK) determines the distribution of the PSD expression Sp(f, RT) of the switch function g(t). After adopting the RSFPWM-CP strategy, it can be seen from the power spectrum density that the spectrum no longer contains discrete components, and the discrete spectrum becomes a continuous spectrum, which can improve the electromagnetic interference of the output voltage or current.
In order to make the characteristics of the switching power converter system better meet the requirements of the time domain index and obtain satisfactory spectral characteristics, this paper proposed an RSFPWM-CPTMC strategy, which can not only reduce the EMI of the system, but also can restrain the increase in output current harmonics in one cycle, so that this pair of contradictions can be solved well.
The realization method of the variable frequency speed regulation system of RSFPWM-CPTMC is as follows. When the switching frequency is greater than fc, it becomes a large state, i.e., state 1. When the switching frequency is less than fc, it is a small state, i.e., state 2. The purpose of introducing the Markov chain is to switch the switching frequency between state 1 and state 2 as far as possible, so that the actual mathematical expectation of the switching frequency is as equal to the theoretical mathematical expectation as possible.
Figure 7 is a state diagram of the switch parameters of the two-state Markov chain. From Figure 7, the transition probability matrix of the two-state Markov chain is expressed as:
P = [ P 11 P 12 P 21 P 22 ] = [ 1 P t P t P t 1 P t ]
where Pt is the transition probability;
In order not to affect the spectrum characteristics of the system, the transition probability between the two states of the smooth Markov chain cannot be 1.
For evaluating the frequency spectrum characteristics of RPWM schemes, the HSF performance index is introduced in this paper and defined as:
H S F = 1 N i > 1 N ( H i H 0 ) 2
H 0 = 1 N i > 1 N H i
where Hi is the amplitude of the ith harmonics and H0 is the average value of all N harmonics.
In addition, in order to evaluate the current quality, the performance index of THD is introduced as:
T H D = n = 2 N ( G n G 1 ) 2
where Gn is the rms value of the nth harmonic; N is the specific order and G1 is the effective value of the fundamental component.
Considering that the experimental platform adopts the DSP28069 chip [36], the software method is used to generate pseudo-random numbers. Because of the selected maximum word length value of the linear congruence method has enough period, it can be used to replace the real random number. In this paper, the linear congruence method is used to generate random numbers, which is based on the following equation [37]:
R n + 1 = M o d ( 2 N s ) ( R n a + b )
where Rn, Rn+1 are the generated random number of nth, (n + 1)th; a, b both are prime number; Ns is the maximum word length of a random number.

4. Simulation and Experimental Analysis

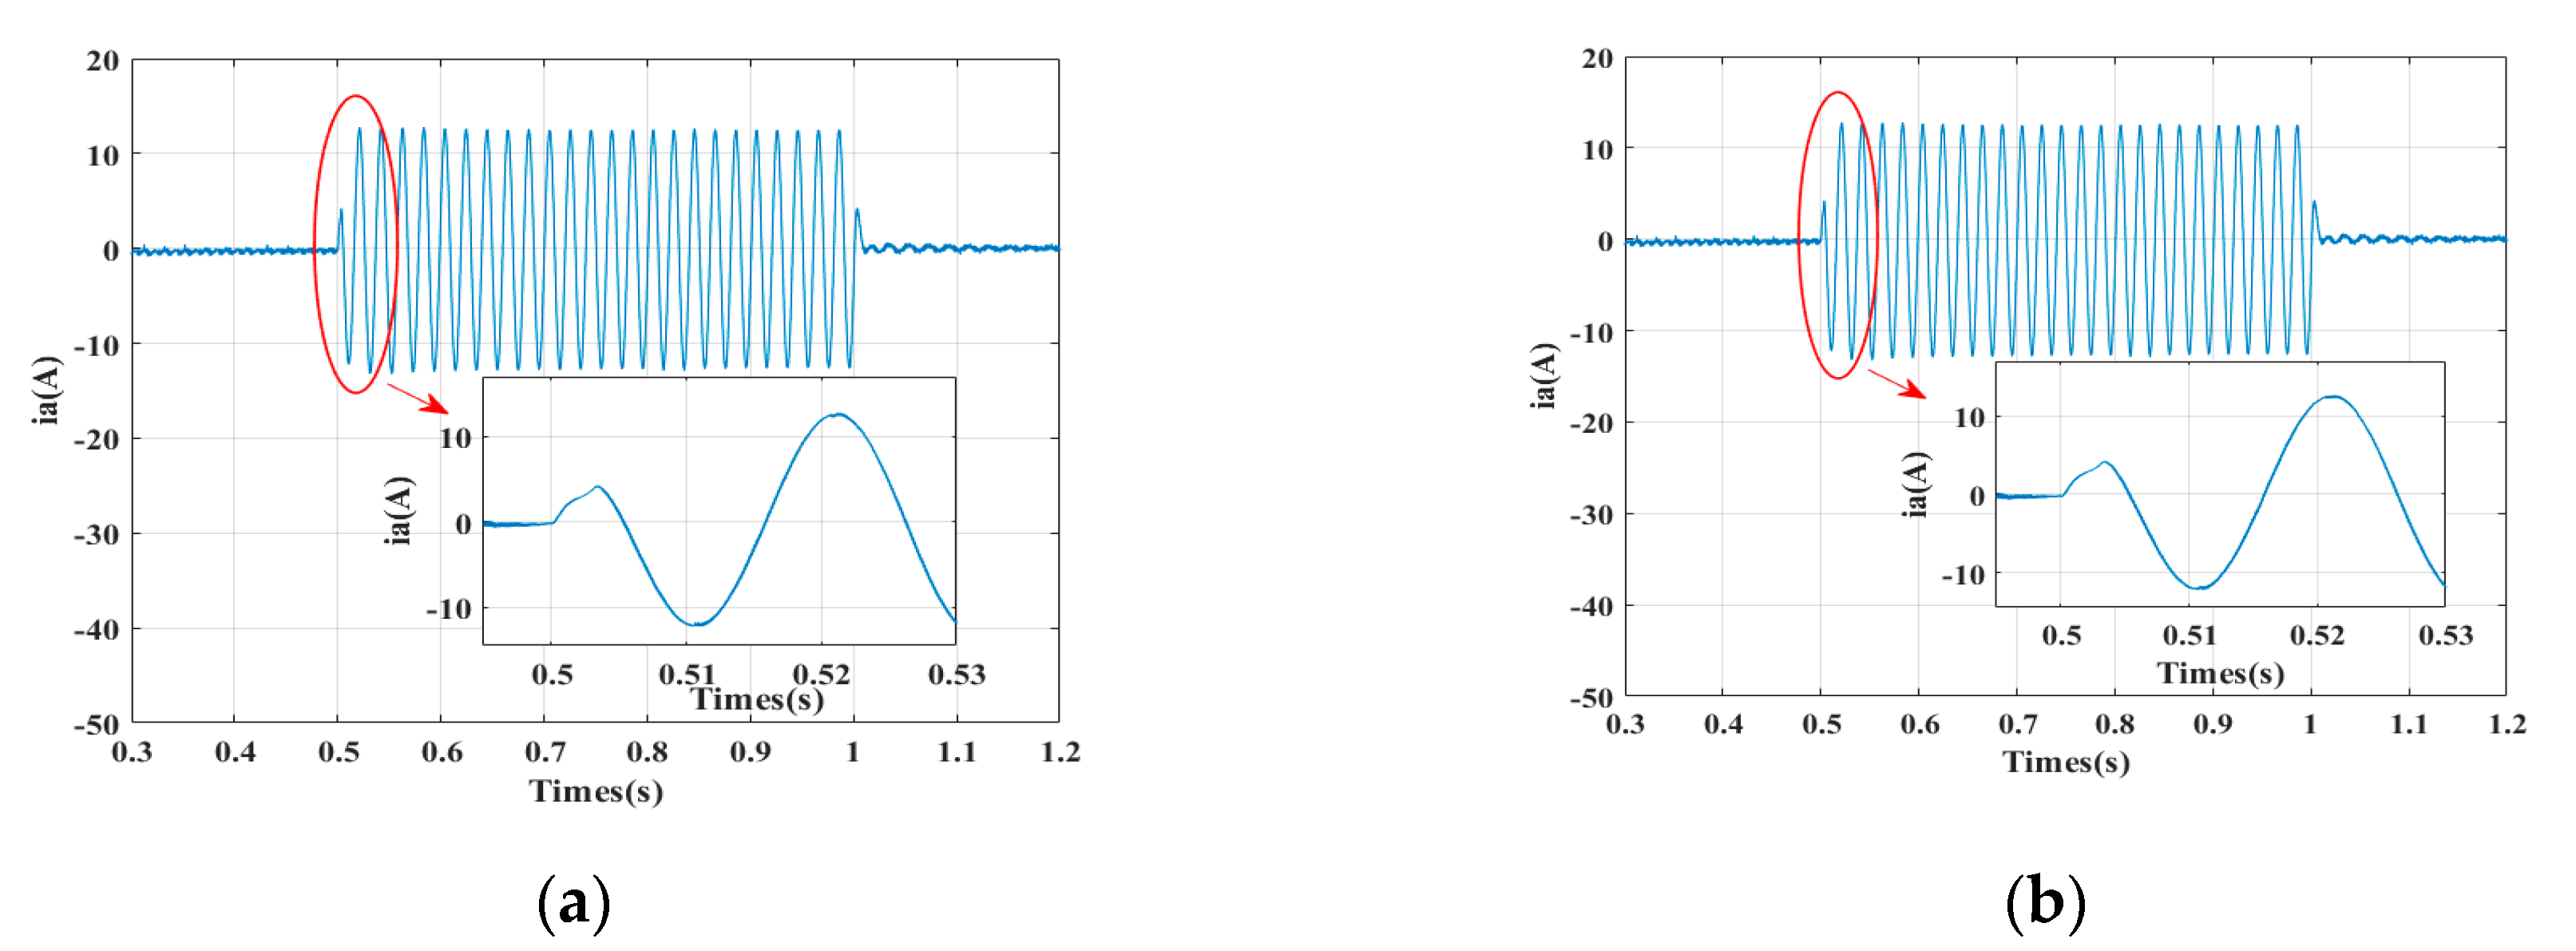
4.1. Simulation Results and Analysis

Table 5 shows the parameters of the PMSM in a Simulink environment. In this paper, the control frequency based on FSFPWM is set to 14.25 kHz, and the center frequency of the proposed RSFPWM-CPTMC strategy is also the same, which changes according to the frequency range of 0.5 kHz. The motor runs at 1260 r/min with no load, and then the load torque suddenly increases the step response from 0 N·m to 18.5 N·m after 0.5 s, and finally, the load torque drops to 0 N·m at 1.0 s.
The A-phase current waveform based on FSFPWM and RSFPWM-CPTMC is shown in Figure 8. It can be seen from Figure 8, the RSFPWM-CPTMC has the same good dynamic response and steady-state performance as that of FSFPWM technology. The adoption of the proposed strategy will not affect the performance of the motor control system.
Figure 9a,c,e show further the fast Fourier transform (FFT) harmonic content analysis results of the A-phase current under three different strategies. In addition, compared with the FSFPWM strategy in Figure 9a,c,e shows that the harmonic content at the switching frequency of 1st, 2nd, 3rd, and 4th under RCFMFD and RSFPWM-CPTMC strategy are significantly reduced respectively.
Figure 9b,d,f show PSD analysis of the A-phase current based on FSFPWM, RCFMFD, and RSFPWM-CPTMC respectively. In Figure 9b, conventional FSFPWM has large harmonic components and EMI at the switching frequency and its harmonics. Figure 9d,f also show that the PSD content under RCFMFD, and the proposed strategy are significantly reduced respectively.
Figure 10 shows the HSF results of the frequency spectrum distribution of the FFT and PSD under FSFPWM, RCFMFD, and the proposed strategy respectively. It can be seen from Figure 10 that the HSF value under RSFPWM-CPTMC is the smallest at the switching frequency of 1st, 2nd, 3rd, and 4th, which also means wider and more uniform frequency spectrum characteristics. Simultaneously, the comparison results of the THD value under three different strategies shown in Figure 14 indicate that the proposed strategy does not weaken basically the total harmonic content, while it disperses the peak harmonic at the switching frequency in a spread spectrum way. In addition, the weakened peak current harmonics and the uniform frequency spectrum characteristics mean the better electromagnetic compatibility quality.
Figure 11 shows the distribution of random numbers with two different strategies. It can be seen from Figure 11 that the distribution of random numbers based on RSFPWM-CPTMC strategy is better than that of the RCFMFD scheme whether the random number is uniformly distributed or normally distributed. In Figure 12, the paper mainly compares the FFT and PSD results of different random distribution modes of different RPWM strategies. The results show that if the same RPWM strategy is used, the uniform distribution can generate less current harmonics. In addition, if the same random distribution is used, the proposed strategy can produce less current harmonics and EMI. In conclusion, the superiority of the proposed strategy is verified and uniform distribution is used for follow-up research.
Based on the above results, this paper studies and compares the harmonic performance of FSFPWM, RCFMFD, and the proposed strategy at the various randomness levels as shown in Figure 13. It can be seen from Figure 13 that the randomness control of random numbers will have a direct impact on the current harmonics and EMI levels. By the comparison of the results, it can be concluded that the random performance of the proposed strategy is optimal, and the current harmonics and EMI are the minimum when the transition probabilities Pt = 0.3.
In addition, Figure 14 also shows that the comparison of THD value under different PWM strategies and random distribution. It can be seen from Figure 14, the THD produced by the uniform distribution of RCFMFD (U-RCFMFD) and RSFPWM-CPTMC (U-RSFPWM-CPTMC) is smaller than that of the normal distribution of RCFMFD (N-RCFMFD) and RSFPWM-CPTMC (N-RSFPWM-CPTMC). Moreover, when the proposed strategy selects the different transition probabilities based on uniform distribution, the THD value of Pt = 0.3 is the minimum, which verifies the above conclusion.

4.2. Experimental Results and Analysis

The experimental results are obtained on a 4.2 kW industrial laboratory environment where the main control chip is DSP28069 to validate the effectiveness of the proposed RSFPWM-CPTMC scheme. The motor parameters and experimental platform are given in Table 5 and Figure 15 respectively. The control frequency based on FSFPWM-FSTPI is set to 14.25 kHz, and the center frequency of the proposed strategy is also the same, which changes according to the frequency range of 0.5 kHz. In the experiment, the tested motor runs at 1260 r/min with no load, and then the rapid load torque suddenly rises to 18.5 N·m.
Figure 16 presents that under the influence of the capacitor charging and discharging of the upper and lower arms of the A-phase, the voltage across the capacitor is basically the same, which ensures the normal operation of the motor control system. Furthermore, Figure 17 shows that the actual switching waveform of the A-phase driving axle based on the proposed strategy with the upper and lower bridge legs. It indicates the proposed strategy has the same fixed duty cycle control mode as RCFMFD, so that the voltage space vector can be combined with a fixed value in each switching cycle and run in a circular trajectory normally, which ensures the control performance of the motor.
It can be clearly seen from Figure 18, the A-phase current distortion under the proposed strategy is smaller than the FSFPWM, and good motor control performance is guaranteed. Figure 19a,c,e show further the experimental FFT harmonic content analysis results of the A-phase current under three different strategies. In addition, compared with the FSFPWM strategy in Figure 19a,c,e show that the harmonic content at the switching frequency of 1st, 2nd, and 3rd under RCFMFD and the proposed strategy are significantly reduced respectively. In addition, it is obvious that from Figure 19e that the peak harmonic content outside the random frequency range is still smaller than that of value under FSFPWM.
The PSD analysis of the A-phase current based on FSFPWM, RCFMFD, and the proposed strategy is shown in Figure 19b,d,f respectively. In Figure 19b, conventional FSFPWM has large harmonic components and EMI at the switching frequency and frequency multiplication. Figure 19d,f also show that the PSD content under RCFMFD, and the proposed strategy are significantly reduced respectively. It is also obvious from Figure 19f that the PSD content outside the random frequency range is still smaller than the PSD content value under FSFPWM.
Figure 20 shows the experimental HSF results of the frequency spectrum distribution of the FFT and PSD under three different strategies respectively. It can be seen from Figure 20 that the HSF value under the proposed strategy is the smallest, which also confirms the simulation results and means the better frequency spectrum characteristics. Moreover, the THD values under three different RPWM strategies are shown in Figure 21. By comparing the results, the THD value of the proposed strategy is smaller than that of other control methods. In conclusion, the results of theory and simulation are confirmed by experiments.
The experimental results show that the proposed strategy has the advantages of good dynamic response and steady-state performance, wider and more uniform frequency spectrum characteristics. By evaluating the spectrum distribution and harmonic amplitude of the current harmonics and PSD, electromagnetic acoustic noise and EMI are significantly weakened. Simultaneously, it can be concluded that the experimental results conform to the theoretical and simulation results. Therefore, the superiority of the proposed RSFPWM-CPTMC strategy for FSTPI is confirmed in this paper.

5. Conclusions

This paper has presented a novel method and application of the harmonic spread spectrum technique, RSFPWM-CPTMC, in order to effectively reduce the current harmonics and EMI at the switching frequency and frequency multiplication in the PMSM drives. By optimizing the distribution of random numbers, better electromagnetic acoustic noise frequency spectrum characteristics are obtained. The simulation and experiments both show the theoretical results. The experimental results have confirmed a substantial reduction of PSD about 31.4%, 39.8%, and 11.8% and the harmonic content approximately 36.0%, 39.7%, and 60.6% by the application of the proposed strategy at the switching frequency of 1st, 2nd, and 3rd in comparison with the conventional FSFPWM strategy.

Author Contributions

Conceptualization, S.W. and X.G.; Methodology, S.W. and R.W.; Software, S.W.; validation, S.W., X.G. and Y.L. (Yulong Liu); formal analysis, S.W.; Investigation, S.W.; resources, X.G.; data curation, S.W.; writing—original draft preparation, L.L.; writing—review and editing, Y.L. (Youjian Lei); visualization, S.W.; supervision, R.W.; project administration, X.G.; funding acquisition, X.G. and R.W. All authors have read and agreed to the published version of the manuscript.

Funding

This work was supported in part by the National Natural Science Foundation of China (no. 51477058, 51707068), in part by the Xiamen Science and Technology Project—University Research Institute Industry–University–Research Project—under Grant 3502Z202003037, in part by the Science and Technology Innovation Team of Fujian Province Universities (Industrialization Project)—Power Semiconductor Device and Electric Drive Technology Innovation Team under Grant 605-5J120019, in part by the Subsidized Project for Postgraduates’ Innovative Fund in Scientific Research of Huaqiao University under Grant 18014082015.

Conflicts of Interest

The authors declare no conflict of interest.

References

  1. Tan, D. Emerging System Applications and Technological Trends in Power Electronics: Power electronics is increasingly cutting across traditional boundaries. IEEE Power Electron. Mag. 2015, 2, 38–47. [Google Scholar] [CrossRef]
  2. Wang, Y.; Lucia, O.; Zhang, Z. High and Very High Frequency Power Supplies for Industrial Applications. IEEE Trans. Ind. Electron. 2020, 67, 1400–1404. [Google Scholar] [CrossRef]
  3. Chen, J.; Jiang, D.; Sun, W.; Shen, Z.; Zhang, Y. A family of spread-spectrum modulation schemes based on distribution characteristics to reduce conducted EMI for power electronics converters. IEEE Trans. Ind. Appl. 2020, 56, 5142–5157. [Google Scholar] [CrossRef]
  4. Ramabhadran, R.; She, X.; Levy, Y.; Glaser, J.; Raju, R.; Datta, R. Universal AC Input High-Density Power Adapter Design with a Clamped Series-Resonant Converter. IEEE Trans. Ind. Appl. 2016, 52, 4096–4107. [Google Scholar] [CrossRef]
  5. Liang, Y.; Wang, R.; Hu, B. Single-Switch Open-Circuit Diagnosis Method Based on Average Voltage Vector for Three-Level T-Type Inverter. IEEE Trans. Power Electron. 2020, 36, 911–921. [Google Scholar] [CrossRef]
  6. Xiao, B.; Hang, L.; Mei, J.; Riley, C.; Tolbert, L.; Ozpineci, B. Modular Cascaded H-Bridge Multilevel PV Inverter with Distributed MPPT for Grid-Connected Applications. IEEE Trans. Ind. Appl. 2015, 51, 1722–1731. [Google Scholar] [CrossRef]
  7. Blaabjerg, F.; Liserre, M.; Ma, K. Power Electronics Converters for Wind Turbine Systems. IEEE Trans. Ind. Appl. 2012, 48, 708–719. [Google Scholar] [CrossRef] [Green Version]
  8. Ji, Q.; Ruan, X.; Ye, Z. The Worst Conducted EMI Spectrum of Critical Conduction Mode Boost PFC Converter. IEEE Trans. Power Electron. 2015, 30, 1230–1241. [Google Scholar] [CrossRef]
  9. Besnerais, J.; Lanfranchi, L.; Hecquet, M.; Brochet, P. Characterization and Reduction of Audible Magnetic Noise Due to PWM Supply in Induction Machines. IEEE Trans. Ind. Electron. 2010, 57, 1288–1295. [Google Scholar] [CrossRef]
  10. Liaw, C.; Lin, Y. Random slope PWM inverter using existing system background noise: Analysis, design and implementation. IEE Proc. Electr. Power Appl. 2000, 147, 45–54. [Google Scholar] [CrossRef]
  11. Wang, S. Conductive EMI issues in power electronics systems. In Proceedings of the 2017 IEEE International Symposium on Electromagnetic Compatibility & Signal/Power Integrity (EMCSI), Washington, DC, USA, 7–11 August 2017; pp. 1–110. [Google Scholar]
  12. Rossetto, L.; Buso, S.; Spiazzi, G. Conducted EMI issues in a 600-W single-phase boost PFC design. IEEE Trans. Ind. Appl. 2000, 36, 578–585. [Google Scholar] [CrossRef] [Green Version]
  13. Chen, Y.; Guo, X.; Xue, J.; Chen, Y. Hybrid PWM modulation technology applied to three-level topology-based PMSMS. J. Power Electron. 2019, 19, 146–157. [Google Scholar]
  14. Dordevic, O.; Jones, M.; Levi, E. Analytical Formulas for Phase Voltage RMS Squared and THD in PWM Multiphase Systems. IEEE Trans. Power Electron. 2015, 30, 1645–1656. [Google Scholar] [CrossRef] [Green Version]
  15. Brudny, J.; Szkudlapski, T.; Morganti, F.; Lecointe, J. Method for Controlling the PWM Switching: Application to Magnetic Noise Reduction. IEEE Trans. Ind. Electron. 2015, 62, 122–131. [Google Scholar] [CrossRef]
  16. Trzynadlowski, A.; Legowski, S.; Lynn, K. Random pulse-width modulation technique for voltage-controlled power inverters. Int. J. Electron. 1990, 68, 1027–1037. [Google Scholar] [CrossRef]
  17. Stankovic, A.; Verghese, G.; Perreault, D. Analysis and synthesis of randomized modulation schemes for power converters. IEEE Trans. Power Electron. 1995, 10, 680–693. [Google Scholar] [CrossRef]
  18. Wang, B.; Li, X.; Drissi, K. Analysis of power spectrum of a dual randomized modulation. Proc. CSEE 2004, 24, 97–101. [Google Scholar]
  19. Mahdavi, J.; Kaboli, S.; Toliyat, H. Conducted electromagnetic emissions in unity power factor AC/DC converters: Comparison between PWM and RPWM techniques. In Proceedings of the 30th Annual IEEE Power Electronics Specialists Conference, Charleston, SC, USA, 1 July 1999; pp. 881–885. [Google Scholar]
  20. Wang, H.; Wang, B.; Zhou, D. Comparison and Investigation of Two Randomized PWM Modulation Technology. Electr. Drive 2006, 36, 23–25. [Google Scholar]
  21. Boudjerda, N.; Melit, M.; Nekhoul, B.; Drissi, K.; Kerroum, K. Spread spectrum in DC-DC full bridge voltage converter by a dual randomized PWM scheme. In Proceedings of the International Symposium on Electromagnetic Compatibility—EMC Europe, Hamburg, Germany, 8 September 2008; pp. 1–6. [Google Scholar]
  22. Jiang, D.; Lai, R.; Wang, F.; Luo, F.; Wang, S.; Boroyevich, D. Study of Conducted EMI Reduction for Three-Phase Active Front-End Rectifier. IEEE Trans. Power Electron. 2011, 26, 3823–3831. [Google Scholar] [CrossRef]
  23. Peyghambari, A.; Dastfan, A.; Ahmadyfard, A. Strategy for switching period selection in random pulse width modulation to shape the noise spectrum. IET Power Electron. 2015, 8, 517–523. [Google Scholar] [CrossRef]
  24. Kirlin, R.; Lascu, C.; Trzynadlowski, A. Shaping the Noise Spectrum in Power Electronic Converters. IEEE Trans. Ind. Electron. 2011, 58, 2780–2788. [Google Scholar] [CrossRef]
  25. Lai, Y.; Chang, Y.; Chen, B. Novel Random-Switching PWM Technique with Constant Sampling Frequency and Constant Inductor Average Current for Digitally Controlled Converter. IEEE Trans. Ind. Electron. 2013, 60, 3126–3135. [Google Scholar] [CrossRef]
  26. Xu, J.; Nie, Z.; Zhu, J.; Zhang, Y.; Li, H. Restudy on the Random Pulse Width Modulation. Electr. Mach. Control Appl. 2016, 43, 45–51. [Google Scholar]
  27. Sudhakar, N.; Pydikalva, P.; Jyotheeswara, R.; Thanikanti, S.; Vigna, K. Conducted Electromagnetic Interference Spectral Peak Mitigation in Luo-Converter Using FPGA-Based Chaotic PWM Technique. Electr. Power Compon. Syst. 2019, 47, 838–848. [Google Scholar]
  28. Lai, Y.; Chen, B. New Random PWM Technique for a Full-Bridge DC/DC Converter with Harmonics Intensity Reduction and Considering Efficiency. IEEE Trans. Power Electron. 2013, 28, 5013–5023. [Google Scholar] [CrossRef]
  29. Xu, J.; Nie, Z.; Zhu, J. Characterization and Selection of Probability Statistical Parameters in Random Slope PWM Based on Uniform Distribution. IEEE Trans. Power Electron. 2020, 36, 1184–1192. [Google Scholar] [CrossRef]
  30. Zhang, Y.; Yin, Z.; Liu, J.; Zhang, R.; Sun, X. IPMSM Sensorless Control Using High-Frequency Voltage Injection Method with Random Switching Frequency for Audible Noise Improvement. IEEE Trans. Ind. Electron. 2020, 67, 6019–6030. [Google Scholar] [CrossRef]
  31. Dzung, P.; Minh, P.; Vinh, P.; Hoang, N.; Bac, N. A new switching technique for direct torque control of induction motor using four-switch three-phase inverter. In Proceedings of the 7th International Conference on Power Electronics and Drive Systems, Bangkok, Thailand, 27 November 2007; pp. 1331–1336. [Google Scholar]
  32. Dzung, P.; Minh, P.; Vinh, P.; Hoang, N.; Binh, T. New Space Vector Control Approach for Four Switch Three Phase Inverter (FSTPI). In Proceedings of the 7th International Conference on Power Electronics and Drive Systems, Bangkok, Thailand, 27 November 2007; pp. 1002–1008. [Google Scholar]
  33. Guo, X.; Cong, W.; Zhao, F.; Fang, R. Research on the Control Algorithms for Four Switch Three Phase Inverter. Small Spec. Electr. Mach. 2012, 40, 66–68. [Google Scholar]
  34. Guo, X.; Du, S.; Li, Z.; Chen, F.; Chen, K.; Chen, R. Analysis of Current Predictive Control Algorithm for Permanent Magnet Synchronous Motor Based on Three-Level Inverters. IEEE Access 2019, 7, 87750–87759. [Google Scholar] [CrossRef]
  35. Gamoudi, R.; Elhak Chariag, D.; Sbita, L. A Review of Spread-Spectrum-Based PWM Techniques—A Novel Fast Digital Implementation. IEEE Trans. Power Electron. 2018, 33, 10292–10307. [Google Scholar] [CrossRef]
  36. Texas Instruments. Available online: https://www.ti.com.cn/document-viewer/cn/TMS320F28069M/datasheet/2-ZHCS009H#SPRS6984427 (accessed on 14 September 2020).
  37. Ma, F.; Wu, Z.; Hou, X. Random Space Vector PWM Based on the Generalized Modulator. Proc. CSEE 2007, 27, 98–102. [Google Scholar]
Figure 1. A schematic diagram of permanent magnet synchronous motor (PMSM) vector control system.
Electronics 09 01998 g001
Figure 2. The topology of four-switch three-phase inverters (FSTPI). where Q1 and Q2 respectively represent the switching state of the two-phase bridge arms; 1 stand for “on” and—0 stand for “off”; E is the DC bus voltage.
Electronics 09 01998 g002
Figure 3. The basic voltage vector and partition method of FSTPI. (a) the conventional method. (b) the selected method.
Electronics 09 01998 g003
Figure 4. The space vector pulse width modulation (SVPWM) wave of FSTPI five-segment voltage space vector. (a) Sector A. (b) Sector B. (c) Sector C. (d) Sector D.
Electronics 09 01998 g004
Figure 5. A schematic diagram of switching function.
Electronics 09 01998 g005
Figure 6. A schematic diagram of RSFPWM-CP.
Electronics 09 01998 g006
Figure 7. Two-state Markov chain to control the switch state diagram.
Electronics 09 01998 g007
Figure 8. A-phase current waveform based on: (a) FSFPWM; (b) RSFPWM-CPTMC.
Electronics 09 01998 g008
Figure 9. FFT harmonic content and power spectral density (PSD) analysis of the A-phase current: (a) FFT analysis with FSFPWM; (b) PSD analysis with FSFPWM; (c) FFT analysis with RCFMFD; (d) PSD analysis with RCFMFD; (e) FFT analysis with RSFPWM-CPTMC; (f) PSD analysis with RSFPWM-CPTMC.
Electronics 09 01998 g009
Figure 10. The harmonic spread factor (HSF) results of the frequency spectrum distribution based on three different strategies for: (a) The results of peak harmonic; (b) The results of PSD.
Electronics 09 01998 g010
Figure 11. The distribution of random number based on: (a) Uniform distribution RCFMFD; (b) Uniform distribution RSFPWM-CPTMC; (c) Normal distribution RCFMFD; (d) Normal distribution RSFPWM-CPTMC.
Electronics 09 01998 g011
Figure 12. The comparison of different random distribution of different RPWM strategies for: (a) The results of peak harmonic; (b) The results of PSD.
Electronics 09 01998 g012
Figure 13. The comparison of different PWM strategies for: (a) The results of peak harmonics; (b) The results of PSD.
Electronics 09 01998 g013
Figure 14. The comparison of total harmonic distortion (THD) value under different PWM strategies and random distribution.
Electronics 09 01998 g014
Figure 15. The experimental platform for the PMSM drive system.
Electronics 09 01998 g015
Figure 16. Voltage across the upper and lower arm capacitors of A-phase.
Electronics 09 01998 g016
Figure 17. The switching waveform of A-phase driving axle based on the proposed strategy with: (a) The upper bridge leg; (b) The lower bridge leg.
Electronics 09 01998 g017
Figure 18. Experimental A-phase current waveform based on: (a) FSFPWM-FSTPI; (b) The proposed strategy.
Electronics 09 01998 g018
Figure 19. Experimental FFT and PSD results of the current: (a) FFT results under FSFPWM; (b) PSD results under FSFPWM; (c) FFT results under RCFMFD; (d) PSD results under RCFMFD; (e) FFT results under the proposed strategy; (f) PSD results under the proposed strategy.
Electronics 09 01998 g019
Figure 20. The experimental HSF results of the frequency spectrum distribution based on three different strategies for: (a) The results of peak harmonic; (b) The results of PSD.
Electronics 09 01998 g020
Figure 21. The experimental comparison of THD value under different PWM strategies.
Electronics 09 01998 g021
Table 1. The corresponding relation between FSTPI switching state and phase/line voltage.
Q1/Q2UAUBUCUABUBCUCA
0/0−E/6−E/6E/30−E/2E/2
0/1−E/2E/20−EE/2E/2
1/0E/2−E/20E−E/2−E/2
1/1E/6E/6−E/30E/2−E/2
Table 2. The corresponding relation between FSTPI switch state and basic voltage vector.
Q1/Q2UαUβV = vα + jvβ
0/0 6 12 E 2 4 E V 0 = E 6 e j 2 3 π
0/1 6 4 E 2 4 E V 1 = E 2 e j 5 6 π
1/0 6 4 E 2 4 E V 2 = E 2 e j 1 6 π
1/1 6 12 E 2 4 E V 3 = E 6 e j 1 3 π
Table 3. Action schedule of vector.
Sectort03, t21t0–t3
It03> 0; t21 > 0t0 = t03 + k 2 δ T ; t1 = 1 k 2 δ T ; t2 = t21 + 1 k 2 δ T ; t3 = k 2 δ T
IIt03 0; t21 > 0t0 = k 2 δ T ; t1 = 1 k 2 δ T ; t2 = t21 + 1 k 2 δ T ; t3 = −t03 + k 2 δ T
IIIt03< 0; t21 0t0 = k 2 δ T ; t1 = −t21 + 1 k 2 δ T ; t2 = 1 k 2 δ T ; t3 = −t03 + k 2 δ T
IVt03 0; t21 < 0t0 = t03 + k 2 δ T ; t1 = −t21 1 k 2 δ T ; t2 = 1 k 2 δ T ; t3 = k 2 δ T
Table 4. Synthetic vector distribution of reference voltage vector.
SectorAnalyzing ConditionsSelect Vectork
At03 3 | t 21 | V0V1V20
Bt21 | t 03 | 3 V0V2V31
C−t03 3 | t 21 | V1V2V30
D−t21 | t 03 | 3 V0V1V31
Table 5. Simulation and experiment parameters of PMSM-based FSTPI.
ParametersSimulation and Experimental Values
Stator resistance RS0.0071
Stator inductance L/H7.39 × 10−4
Flux Ψf/Wb0.0147
Rated speed Nr/rpm3000
Rated torque TN/N·M9.5
Rated power PN/kW4.2
Pole pairs np6
Publisher’s Note: MDPI stays neutral with regard to jurisdictional claims in published maps and institutional affiliations.

