Abstract
In this paper, the impact of several polarization distortions on geometrical structure retrieval of man-made targets in inverse synthetic aperture radar (ISAR) images is assessed. For polarimetric ISAR, the polarization distortions are usually composed of crosstalk and channel imbalance. For non-stationary targets, a residual phase error exists between two columns of the scattering matrix in the alternate transmission and simultaneous reception (ATSR) mode, especially when the radar frequency is high. These two kinds of distortions have varying influences on different targets, as well as different decomposition methods. Some theoretical derivations and numerical analyses are given to reveal the impact of these distortions on Cameron decomposition. To evaluate the impact of these distortions on geometrical structure retrieval, we use the numerical results and real data of an unmanned aerial vehicle (UAV) called Frontier to perform error analysis of both the decomposition and the retrieved size of the designated structures of the UAV. Some numerical evaluations were conducted from the perspective of system design, and these results can be useful for the practical radar system.
1. Introduction
Polarimetry, which reveals more geometry- and composition-related properties of targets, can be used to retrieve the geometry characteristics, such as the location, the type, and the size of the canonical scatterers, which give great significance to target interpretation as well as target recognition [1,2,3]. It has been recognized that the accuracy of the retrieved results rely on the accuracy of polarimetric observations.
In the field of Synthetic Aperture Radar (SAR) image processing, extensive research efforts [3,4,5,6] have been conducted to distinguish man-made targets, such as vehicles, tanks, ships, etc., from their background or unwanted targets by estimating their geometrical characteristics. Researchers have mainly focused on ways to accurately extract the scattering centers of targets and then obtain accurate geometrical features from the perspective of the application. However, these studies seldom focused on the impact of polarization distortions, such as radar system distortions, among others. As it is the practical case, there are always some distortions caused either by the sensing platform, the intermediate medium, or both, even after polarization calibration. In this paper, we aim to provide some numerical requirements for the system design of the end application of geometrical structure retrieval (GSR).
Generally, crosstalk and channel imbalances are the two main system distortions in the field of polarization calibration, and they have been well documented in the literature [7,8,9,10,11,12]. In the field of inverse synthetic aperture radar (ISAR), not only the polarimetric parameters but also the Doppler parameters need to be estimated. The coupling of the Doppler and polarimetry will introduce some deviation from the polarimetric parameter estimation. Especially in the most widely used measurement scheme, which uses the alternate transmission of two orthogonal polarizations while simultaneously receiving (i.e., alternate transmission and simultaneous reception, ATSR), some decorrelation between the two columns of the polarization scattering matrix (PSM) will be introduced [13,14]. During the two transmissions, it is common to ignore the variation in the scattering characteristics of the target, in which case the decorrelation can be regarded as a multiplicative phase error matrix. The phase error is negatively correlated with radar wavelength, and it may reach tens of degrees, which cannot be ignored in polarization measurement.
With respect to evaluating the impact of various distortions on polarimetric parameters from the perspective of applications, there are some studies in the literature [15,16,17] that have focused on the field of terrain surface classification; Wang Y defined the maximum normalized error (MNE) as a generic metric to bridge the system polarization distortion and the polarimetric measurement quality [15]. Guo S [16] then used the MNE to assess the influence of polarization distortion on decomposition. Their work verified the effectiveness of the MNE. The premise for using the MNE is that the scattering matrix can be mapped into a set of precisely known bases. However, as the most widely used method in the field of GSR [18,19,20], Cameron decomposition [1,2] aims to extract the maximum symmetric component from the scattering matrix. Furthermore, the reciprocal subspace cannot be divided into orthogonal symmetric and asymmetric subspaces because symmetric scatterers do not form a subspace. Therefore, the MNE cannot be directly used in the field of GSR. Another method [17] evaluates the impact of crosstalk contamination by the first-order derivatives of two Cameron parameters of terrain surface classification and man-made target detection. The study suggested that a crosstalk level of would be acceptable for these chosen applications. However, in a practical system, the crosstalk distortion is only one of the measurement errors. Meanwhile, because of the impact of these errors on targets and applications, we cannot simply apply the conclusion in [17] to GSR of man-made targets. This is the primary motivation of this study.
Based on the analysis above, we extend the work in [17] from the following two aspects. First, besides crosstalk, both channel imbalance and residual phase error are considered in this paper. Second, we use GSR as the application and aim to quantify the requirements of every distortion through theoretical derivation and numerical analysis. The remaining sections are organized as follows. In Section 2, the theoretical derivation and analysis are presented. Section 3 presents the validation using both numerical and real data of the Frontier unmanned aerial vehicle (UAV) by applying the method of clustering-based geometrical structure retrieval (C-GSR) proposed in [3]. Conclusions are given in Section 4.
2. Polarimetric System Model
In an ISAR system, the measured scattering matrix in the presence of system distortions and noise can be expressed as [12,15]
where is the noise after range compression, and and are the distortion matrices at transmission and reception, respectively. is the actual PSM. They can be written as follows [12,21]:
where and are the co-polarized elements of the target PSM, and is the cross-polarized element. is the crosstalk of the transmission and reception antennas [12], and and denote the channel imbalance in amplitude and phase.
The model expressed in Equation (1) focuses on the influence of radar system distortions, and it does not consider the effect of the targets’ motion. However, in the ATSR mode, the two columns of the PSM are obtained at different times. The phases of these two measurements vary as a result of the target’s motion [13,14]. In theory, this phase deviation can be accurately compensated if the target’s velocity is known. However, it is difficult to obtain the true value of velocity in practice. Under the condition of high radar frequency, a radial range variation on the order of millimeters may introduce tens of degrees of residual phase error. Therefore, in addition to the non-ideal factors of the radar system, we also need to take the motion error matrix into consideration with the ATSR mode. Here, we mainly focus on the distortions caused by the system and the target, and we regard the noise as negligible. Then, the measured PSM Equation (1) can be rewritten as
where the motion error matrix is , and is the residual compensation phase error.
The impact of crosstalk was analyzed in [17]. Xu and Wang suggested that an isolation level of would be acceptable for general terrain surface classification and for man-made target detection applications. Similarly, we mainly analyze the impact of the amplitude–phase imbalance of polarization channels and the residual phase error on the GSR of a man-made target.
2.1. Impact of the Channel Amplitude—Phase Imbalance
Here, it is assumed that no other distortions exist and that the channel imbalances at transmission and reception are equal as a general case, i.e., . The measured PSM can be expressed as
It can be noted from Equation (4) that the measured PSM abides by reciprocity with the existence of the channel imbalance.
In many radar applications, such as polarization measurement, target detection, and classification of man-made targets (e.g., vehicles, ships, and so on), coherent decomposition methods, such as Pauli decomposition, Krogager decomposition, Cameron decomposition, and Touzi decomposition, are usually preferred [6,22]. Cameron [1] aimed to achieve a maximum degree of diagonalization of the PSM and sorted the symmetric targets into six types: dihedral, trihedral, dipole, cylinder, narrow diplane, and quarter wave. We mainly analyze the impact of various errors on Cameron decomposition because of its richer interpretation of the scattering mechanism. We aim to present numerical evaluations of the requirements for various errors for GSR of man-made targets.
If the channel imbalance does not change the symmetry of the PSM, the diagonalization of the measured PSM can be expressed as
where is the target orientation angle, and are the eigenvalues of , and .
If the phase imbalance is zero, we can obtain two parameters defined by Cameron from Equation (5) as follows:
where is the amplitude imbalance, and . We let be the deviation of from 1. It can be easily inferred that . Then, the first-order derivatives of of these two parameters expressed in Equation (6) can be written as
These first-order derivatives can reflect the perturbation caused by channel amplitude imbalance. We find that the sign of the square root of is determined by whether is positive or negative. It can be derived that the sign of the square root only changes the direction of and keeps the amplitude of invariant. For simplicity, we mainly focus on the results in the case of , which is expressed in Equation (7).
Following Equation (7), we can obtain the perturbation of g and p as follows:
where the superscript’ denotes the first-order derivative. The factor is applied to regularize p because the orientation angle is arbitrary when . Please note that when g approaches 1, is not negligible. In this case, we need to find the solution of a cubic equation. We adopt the numerical method to avoid the complex analytical expression for its non-particularity.
If we restrict the negligible shift of the parameters g and p to and , then the upper bound of from Equation (8) is . We can obtain a numerical requirement of about for amplitude imbalance in the case of .
Figure 1 and Figure 2 give the amplitude and the vector field map of on Cameron’s unit disk with different orientations, respectively. The channel amplitude imbalance is set to , i.e., . It can be seen that the amplitude of increases gradually from the center to the edge when p approaches 0, which is consistent with the result shown in Equation (8). From Figure 2, we know that the direction of is divergent from the center to the edge. When p approaches 1, there is a nonlinear shift that occurs in the trihedral region. The reentry of g will occur in the region near the edge because the amplitude of g is restricted to being no more than 1. In particular, near the edge region of the trihedral, dihedral, and quarter wave scatterers, will increase suddenly, and the scattering characteristics will remain unchanged. To represent the changes to in other areas, we do not show the reentry in Figure 1.
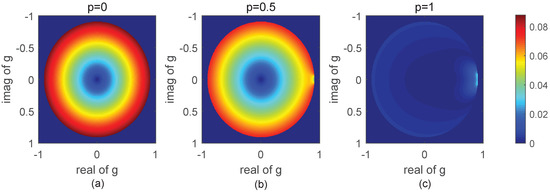
Figure 1.
Amplitude map of on Cameron’s unit disk with different orientations in the case of an amplitude imbalance of . (a) ; (b) ; (c) .
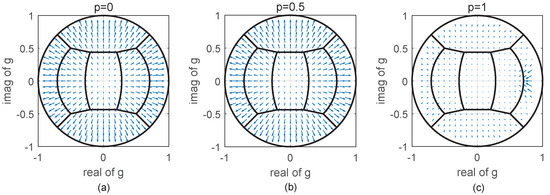
Figure 2.
Vector field map of on Cameron’s unit disk with different orientations in the case of an amplitude imbalance of . (a) ; (b) ; (c) .
Similarly, we can determine the impact of the channel phase imbalance, which is shown in Figure 3. The quiver of rotates counterclockwise around the center, and increases gradually from the center to the edge. reaches the maximum of when , where is the phase imbalance in radians. The amplitude of is more pronounced when the orientation angle is small. When p approaches 1, is smaller, except for an obvious increase near the trihedral region.
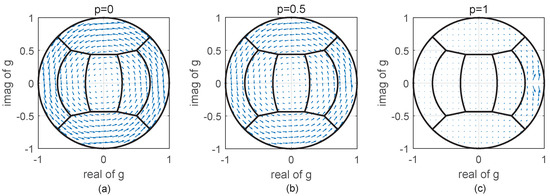
Figure 3.
Vector field map of on Cameron’s unit disk with different orientations in the case of a phase imbalance of . (a) ; (b) ; (c) .
From the analysis above, we know that the channel imbalance will cause a change in g and p. This change will affect the accuracy of the Cameron decomposition. Figure 4a,b shows the accuracy of the Cameron decomposition for different amplitude and phase imbalance conditions, respectively. From these figures, we can observe that Cameron decomposition is insensitive to channel imbalance when the orientation angle is large. In the case of , the Cameron decomposition error is less than , even when or . When the orientation angle is small, the correct rate of Cameron decomposition decreases with the increase in the amplitude imbalance or the phase imbalance. Because the orientation angles of the scatterers of a complex man-made target are often unknown, we pay more attention to the impact of the imbalance error on the decomposition results when the orientation angle is small. If the correct rate is restricted to being no less than , then the amplitude imbalance is not greater than (this is consistent with the theoretical result in Equation (8) that ) and the phase imbalance is not greater than .
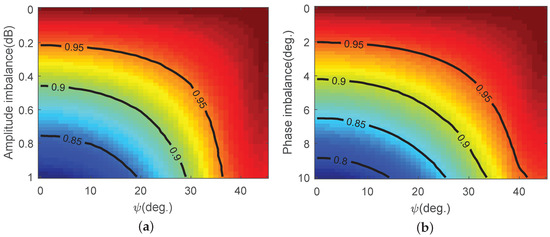
Figure 4.
The contour curve of the Cameron decomposition accuracy for different channel imbalances. () Amplitude imbalance; () Phase imbalance.
2.2. Impact of the Residual Phase Error
In the ATSR mode, four elements of the PSM are estimated during two or more pulses, and it is generally believed that there will be a phase error between two columns of the PSM even after motion compensation. The residual phase error can be written as follows:
where is the residual phase error, is the radar wavelength, is the velocity error, and T is the time interval between two polarization transmissions. The traditional ATSR mode requires two pulses to obtain two columns of the PSM, i.e., T is equal to the pulse repetition period (PRT). In the quasi-simultaneous scheme of the ATSR mode, the time interval between two orthogonal polarizations is much smaller than the PRT. After the first transmission, the orthogonal polarization usually starts at intervals of only a few microseconds. Supposing that the measurement error of radial velocity is less than and that , then , or . The residual phase error is shown in Figure 5. It can be easily seen that the phase error increases linearly with the increase in and T. Taking as an example, the phase error is , , , and , respectively. The pulse repetition frequency (PRF) of ground-based ISAR radar is usually several hundred Hertz, i.e., T is about several milliseconds. In this case, the phase error can reach tens of degrees (indicated by the red triangle in Figure 5). We need to analyze the influence of this phase error on Cameron decomposition.
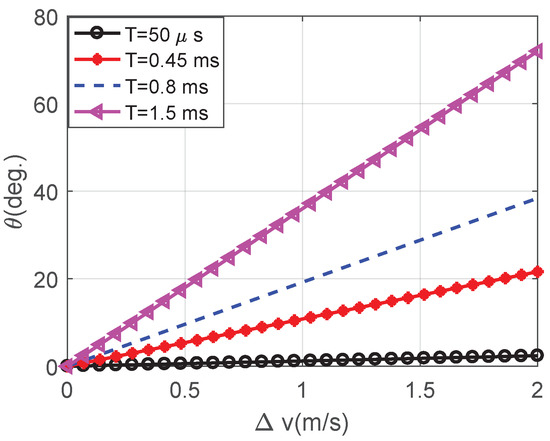
Figure 5.
The residual phase error curves versus velocity error for different values of T.
Assuming that no other distortions exist, the measured PSM becomes
It is obvious that the cross-polarized elements are not equal in Equation (10), i.e., the reciprocity of the measured PSM is violated as a result of the item containing . As indicated in Cameron decomposition [1], the angle between the scattering matrix and the reciprocal matrix needs to be greater than and less than , which can be derived from Equation (10) as follows (let us define for the simplicity of the expression):
The inequality on the right side of Equation (11) can be simplified to , which is true for any . By simplifying the inequality on the left, we can make the following observations:
- The reciprocity of the measured PSM abides by reciprocity if the phase error is less than ;
- When the co-polarized elements are larger than the cross-polarized elements, the phase error will not violate the reciprocity of the PSM to be tested;
- When the co-polarized elements are smaller than the cross-polarized elements, if we assume that two co-polarized elements are equal and that , the phase error is constrained to be no greater than .
In practice, the co-polarized elements are often smaller than the cross-polarized elements. This means that this phase error will not violate the reciprocity of the PSM. In this case, the reciprocal PSM can be written as
Comparing Equation (12) with Equation (5), we find that the influence of is similar to that of the phase imbalance, except the impact of the phase imbalance of the same value is twice as much as the influence of the phase error. Therefore, it is easily understood that rotates counterclockwise around the center and that the caused by is about when , where is in radians. Figure 6 shows the accuracy of the Cameron decomposition with the existence of phase error . It can be seen that the phase error must not be greater than to ensure that the accuracy of the Cameron decomposition is greater than , which is almost twice as much as the phase imbalance.
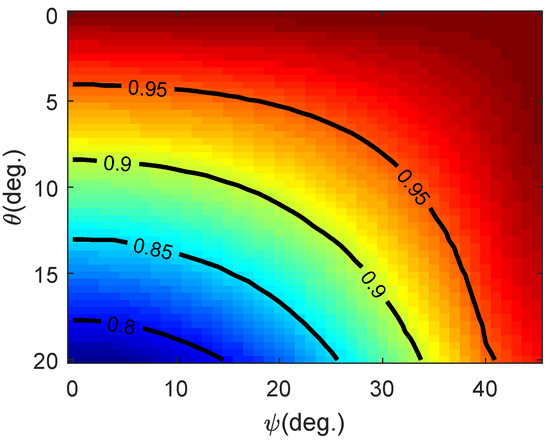
Figure 6.
The contour curve of Cameron decomposition accuracy for different phase errors.
2.3. Impact of Different Distortions on Six Symmetric Scatterers
In Cameron decomposition, Cameron’s unit disk can be divided into six symmetric scattering regions according to the distance between the scatterer in the test and six symmetric scatterers [2]. The previous analysis shows that the direction and amplitude of vary with different distortions. The amplitude of cannot solely decide the impact of various errors on the results of Cameron decomposition. Taking the influence of the channel amplitude imbalance as an example, the direction of is divergent from the center to the edge, and is larger when it is closer to the edge. is reversed because of the boundedness of Cameron’s circle in the trihedral, dihedral, and quarter wave regions. Although in these regions is large, the type results are more stable than those of the other regions. In general, the scatterers in the neighborhood of different regions are more susceptible to errors. We compare the types before and after adding distortions, and we let the flag be 1 when they are the same and 0 otherwise. The flag series are shown in Figure 7a–c for a phase error of , and Figure 7d–f show the flag series for an amplitude imbalance of . It can be easily seen that a flag of 0 (as shown in dark blue in these pictures) occurs mainly in the neighborhood of different regions. In this section, we focus primarily on the influence of different errors on different symmetric scatterers.
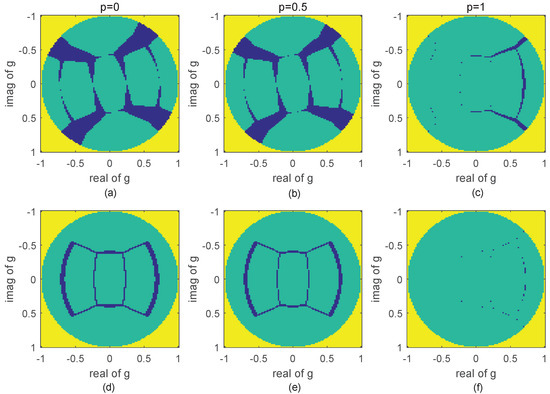
Figure 7.
Flag series for different errors. (a) , ; (b) , ; (c) , ; (d) , ; (e) , ; (f) , .
Similar to the analysis in Section 2.2, we use the accuracy of the Cameron decomposition to quantify the impact of different errors. Assuming the amplitude imbalance varies from 0 to , the phase imbalance is less than , the isolation is from to , or the phase error is less than , then the impacts on the six symmetric scatterers are obtained as shown in Figure 8. As shown in Figure 8a, Cameron decomposition is more sensitive to isolation when the orientation angle is larger, and this result is consistent with Xu Feng’s conclusion [17]. Moreover, it can be seen that isolation has the greatest influence on the trihedral scatterer. The extent of the influence on the other scatterers, arranged from largest to smallest, is as follows: dihedral, quarter wave, cylinder, narrow dihedral, and dipole. Thus, the dipole is almost immune to isolation. The influences of the other errors are displayed in Figure 8b–d, and the orders of the impact of different errors are summarized in Table 1. Please note that the dipole is the most immune to contamination and that the cylinder and the trihedral scatterers are more sensitive to these distortions.
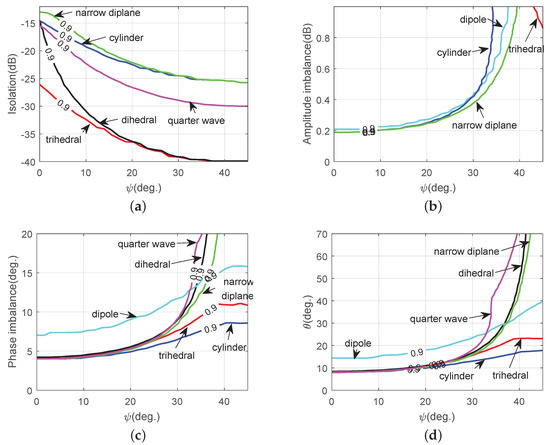
Figure 8.
The impact of different errors on six symmetric scatterers. () Impact of cross-polarization isolation; () Impact of amplitude imbalance; () Impact of phase imbalance; () Impact of residual phase error.

Table 1.
Impact of different errors on six symmetric scatterers.
3. Impact on GSR
The geometrical structure of the target can be retrieved based on the radar measurement data, which is of great significance in target interpretation and recognition. In this section, we focus on the impact of measurement errors on the GSR of two moving UAVs called Frontier. One is the numerical result under the assumption of metal measured by electromagnetic software, and the other is the real data obtained in the microwave anechoic chamber. The carrier frequency is set to be from to with an interval of . Figure 9a shows the model of the Frontier UAV with a length of and width of as measured in the microwave anechoic chamber.
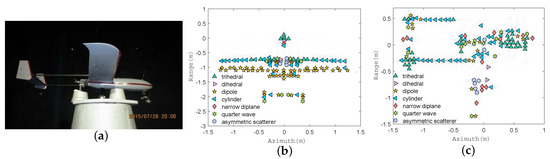
Figure 9.
The measurement scene of the Frontier UAV in the microwave anechoic chamber and the classified scattering centers of different ISAR images of the Frontier UAV. () The model of the Frontier UAV; () Classified scattering centers of the front view based on numerical data; () Classified scattering centers of the lateral view based on real data.
We take the front view of the numerical results and the lateral view of the real data as examples. Assuming that there is no interference, the classified scattering centers of the front view and the lateral view of the UAV based on numerical results and real data are shown in Figure 9b,c, respectively. From the image of the front view of the UAV, we know that the scatterers belonging to the front of the wings can be retrieved as a horizontal cylindrical structure, and those belonging to the trailing edge can be interpreted as vertical dipoles. In the real UAV image, the scatterers of the wings are no longer stable cylinders and dipoles because the real UAV mainly consists of a composite material. It can be seen that the scatterers of the towing rod exhibit the characteristic of the cylinder from Figure 9c.
3.1. Impact of Different Distortions on Classified Scattering Centers of the UAV
To display the influences of different errors on the results of Cameron decomposition, we apply crosstalk with isolation from to , amplitude imbalance from 0 to , phase imbalance of less than , or a phase error of less than . The accuracy of the Cameron decomposition of the UAV is shown in Figure 10. From Figure 10, we can make the following observations:
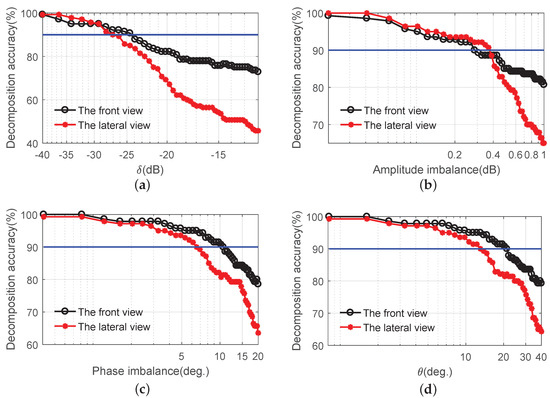
Figure 10.
The accuracy of Cameron decomposition of the UAV for different errors. () The crosstalk of isolation varies from to ; () The amplitude imbalance varies from 0 to ; () The phase imbalance is less than ; () The phase error is less than .
- The decomposition is sensitive to different distortions, and this is consistent with the previous theoretical analysis;
- In general, the accuracy of the Cameron decomposition in the front view is better than that in the lateral view. This is because the interpretation of the UAV in the front view contains many dipoles. The dipoles are almost immune to various distortions;
- The blue solid line in Figure 10 indicates an accuracy of . Accordingly, we can observe that the crosstalk should be no greater than , the amplitude imbalance should be no bigger than , the phase imbalance should be no larger than , and the phase error should be no greater than in the front view, and these distortions should be no greater than , , , and in the lateral view, respectively;
- The results above confirm an isolation of about , which is consistent with the conclusions of Xu Feng [17] and Wang Y [15], and the amplitude imbalance is about , which is consistent with the previous analysis and the work in [15];
- The requirements of the phase imbalance and the phase error are larger than those in the previous results, which are and , respectively. In the practical measurement, it is impossible to ensure that there is only one kind of error. Usually, multiple errors work together, leading to higher requirements placed on the phase imbalance and the phase error.
3.2. Impact of Various Distortions on the Estimation of the Significant Structure of the UAV
It has been recognized that retrieving geometrical structure information, such as the size and the type of the canonical scatterers of the targets, is an important problem in target interpretation and target recognition. In this section, the C-GSR method [3] is adopted to estimate the type and size of the significant structure of the UAV. Assuming that there is no distortion, the clustering results obtained by the C-GSR method are shown in Figure 11. From the clustering results of the numerical data, we choose the front and the trailing edge of the wings as two significant clusters (indicated by the red ellipses in Figure 11a), denoted as Cylinder1 and Dipole, respectively. Similarly, Cylinder2 and Cylinder3, belonging to the towing rods of the real UAV, are chosen from the clustering results (indicated by the red ellipses in Figure 11b). The retrieved sizes of Dipole, Cylinder1 (we obtain the sum of the sizes of Cylinder1-1 and Cylinder1-2), Cylinder2, and Cylinder3 are , , , and , respectively.
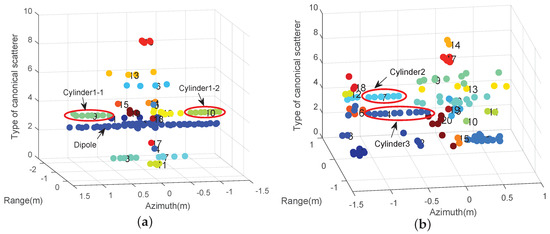
Figure 11.
Illustration of the clustering procedure for the UAV. () The front view based on numerical data; () The lateral view based on real data.
To test the impact of different errors on the estimation of these structures, we apply the same distortions as those in the previous section to the acquired images and perform the C-GSR method over the distorted images. Figure 12a–d show the retrieved size of those chosen clusters versus different errors. The length of Dipole is not shown in these figures because it remains unchanged with the given errors. According to the results in Figure 9b, the front of the wings is composed of several horizontal cylinders. The joint structures between the wings and the cabin are mainly composed of trihedral scatterers. From Figure 9c, we can similarly observe that the scatterers of the towing rods are mainly cylinders and that the joint structures between the towing rods and the tail are also trihedral scatterers. The retrieved length of Cylinder1, Cylinder2, and Cylinder3 increases with the increase in the crosstalk of isolation (shown in Figure 12a) and decreases with the increase in amplitude imbalance (shown in Figure 12b). The reason is that g shifts from the edge to the center in the presence of crosstalk [17] and diverges from the center to the edge in the presence of amplitude imbalance. Therefore, with the interference of crosstalk, the trihedral scatterer may become a cylinder, and the cylinder may become trihedral in the presence of the amplitude imbalance. It can be seen from Figure 12c,d that the impact of the phase imbalance and the phase error on the retrieved results is similar. Because of the swirling effect of the phase deviation on g, the estimated length does not show the same monotonicity as the results in Figure 12a,b.
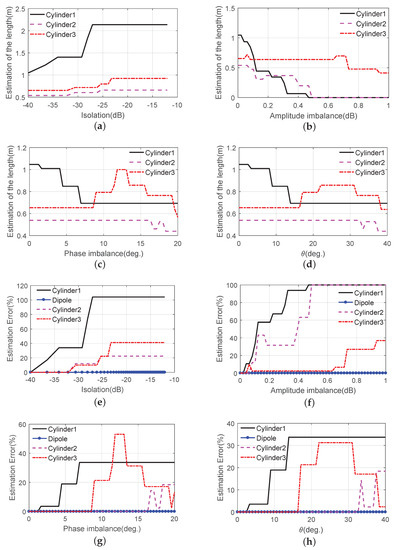
Figure 12.
The retrieved size of the chosen clusters and the estimation accuracy of these results with different errors. () The retrieved sizes versus different isolations; () The retrieved sizes versus different amplitude imbalances; () The retrieved sizes versus different phase imbalances; () The retrieved sizes versus different phase errors; () The estimation error with different isolations; () The estimation error with different amplitude imbalances; () The estimation error with different phase imbalances; () The estimation error with different phase errors.
The estimation accuracies of these four structures are shown in Figure 12e,f. From these figures, we can make the following observations:
- The estimation accuracy decreases dramatically as the crosstalk increases beyond , the amplitude imbalance increases beyond , the phase imbalance increases to more than , or the phase error becomes larger than ;
- The retrieved error of the three cylinders is different. In fact, whether it is a shrinking or divergent shift of g caused by the crosstalk and amplitude imbalance or the vortex torsion of g caused by the phase deviation, the scatterers in the neighborhood of different scattering regions on Cameron’s unit disk are the most susceptible to the errors. In other words, the retrieved accuracy will be different for those scatterers belonging to the same symmetric scatterers but with different distributions on Cameron’s unit disk.
Meanwhile, the retrieved accuracy is related to not only the distribution of scatterers or the value of the distortions but also the orientation angle. It should be noted that the phase error requirement also reflects the measured velocity accuracy requirement. Taking as an example, for an X-band radar, the residual velocity error after compensation is limited to be no more than , , , and when the time interval is , and , respectively. It is obviously that shortening the time interval is an effective method to suppress the impact of the phase error.
4. Conclusions
Both system-related distortions (the channel imbalance in amplitude and phase) and target-related distortions (the residual phase error) are considered in this paper. To evaluate the impact of these two kinds of distortions, both theoretical and numerical analyses are presented. The derived theoretical limit shows that the shifts of the selected parameters g and p based on Cameron decomposition are negligible if the amplitude imbalance is less than . From the accuracy analysis of Cameron decomposition, some numerical analyses suggest that the phase imbalance is required to be less than or that the residual phase error must be less than with an accuracy of above . In the field of GSR of man-made targets in ISAR images, we take the front view of the numerical data and the lateral view of the real data of the Frontier UAV as examples. Some conclusions are made from two aspects: the scattering interpretation accuracy and the size estimation accuracy. (1) To ensure that the Cameron decomposition accuracy is higher than , the isolation level is required to be less than (this is consistent with the conclusions made by Xu Feng [17] and Wang Y [15]) or the amplitude imbalance is required to be less than (this is close to the theoretical result). However, the requirements for each phase distortion vary greatly in the selected images, the reason being that the distribution of the scatterers on Cameron’s unit disk is different. (2) The retrieved results show that the estimation accuracy decreases dramatically as the crosstalk increases beyond , the amplitude imbalance increases beyond , the phase imbalance increases to more than , or the residual phase error increases to more than . Furthermore, we also find that the retrieved accuracy is related to the distribution of the scatterers on Cameron’s unit disk and the clustering algorithm, which is worthy of further study and analysis.
Author Contributions
Data curation, Y.L.; Formal analysis, Y.L.; Funding acquisition, X.W.; Investigation, C.P.; Methodology, Q.L. and C.P.; Project administration, X.W.; Software, Q.L.; Supervision, X.W.; Writing—original draft, Q.L.; Writing—review and editing, C.P.
Funding
This research was funded by the National Natural Science Foundation of China, grant numbers 61490690, 61490694, and 61701512.
Conflicts of Interest
The authors declare no conflict of interest.
References
- Cameron, W.L.; Leung, L.K. Feature motivated polarization scattering matrix decomposition. In Proceedings of the IEEE International Conference on Radar, Arlington, VA, USA, 7–10 May 1990; pp. 549–557. [Google Scholar]
- Cameron, W.L.; Youssef, N.N.; Leung, L.K. Simulated polarimetric signatures of primitive geometrical shapes. IEEE Trans. Geosci. Remote Sens. 1996, 34, 793–803. [Google Scholar]
- Wu, J.; Chen, Y.; Dai, D.; Chen, S.; Wang, X. Clustering-Based Geometrical Structure Retrieval of Man-Made Target in SAR Images. IEEE Geosci. Remote Sens. Lett. 2017, 14, 279–283. [Google Scholar]
- Duan, J.; Zhang, L.; Xing, M.; Wu, Y.; Wu, M. Polarimetric Target Decomposition Based on Attributed Scattering Center Model for Synthetic Aperture Radar Targets. IEEE Geosci. Remote Sens. Lett. 2014, 11, 2095–2099. [Google Scholar]
- Margarit, G.; Mallorqui, J.J.; Fabregas, X. Single-Pass Polarimetric SAR Interferometry for Vessel Classification. IEEE Trans. Geosci. Remote Sens. 2007, 45, 3494–3502. [Google Scholar]
- Saville, M.A.; Jackson, J.A.; Fuller, D.F. Rethinking vehicle classification with wide-angle polarimetric SAR. IEEE Aerosp. Electron. Syst. Mag. 2014, 29, 41–49. [Google Scholar]
- Wiesbeck, W.; Kahny, D. Single reference, three target calibration and error correction for monostatic, polarimetric free space measurements. Proc. IEEE 1991, 79, 1551–1558. [Google Scholar]
- Moisseev, D.N.; Unal, C.M.H.; Russchenberg, H.W.J.; Ligthart, L. Improved Polarimetric Calibration for Atmospheric Radars. J. Atmos. Ocean. Technol. 2002, 19. [Google Scholar] [CrossRef]
- Touzi, R.; Livingstone, C.E.; Lafontaine, J.R.C.; Lukowski, T.I. Consideration of antenna gain and phase patterns for calibration of polarimetric SAR data. IEEE Trans. Geosci. Remote Sens. 1993, 31, 1132–1145. [Google Scholar]
- Freeman, A.; Shen, Y.; Werner, C.L. Polarimetric SAR calibration experiment using active radar calibrators. IEEE Trans. Geosci. Remote Sens. 1990, 28, 224–240. [Google Scholar]
- Xiong, W. Polarimetric Calibration Using a Genetic Algorithm. IEEE Geosci. Remote Sens. Lett. 2007, 4, 421–425. [Google Scholar]
- Van Zyl, J.J. Calibration of Polarimetric Radar Images Using Only Image Parameters and Trihedral Corner Reflector Responses. IEEE Trans. Geosci. Remote Sens. 1990, 28, 337–348. [Google Scholar]
- Santalla, V.; Antar, Y.M.M.; Pino, A.G. Polarimetric radar covariance matrix algorithms and applications to meteorological radar data. IEEE Trans. Geosci. Remote Sens. 1999, 37, 1128–1137. [Google Scholar]
- Del Rio, V.S. Least Squares Estimation of Doppler and Polarimetric Parameters for Weather Targets. IEEE Trans. Geosci. Remote Sens. 2007, 45, 3760–3772. [Google Scholar]
- Wang, Y.; Ainsworth, T.L.; Lee, J. Assessment of System Polarization Quality for Polarimetric SAR Imagery and Target Decomposition. IEEE Trans. Geosci. Remote Sens. 2011, 49, 1755–1771. [Google Scholar]
- Guo, S.; Zhang, J.; Li, Y.; Hong, W. Effects of Polarization Distortion at Transmission and Faraday Rotation on Compact Polarimetric SAR System andH/ Decomposition. IEEE Geosci. Remote Sens. Lett. 2015, 12, 1700–1704. [Google Scholar]
- Xu, F.; Wang, H.; Jin, Y.; Liu, X.; Wang, R.; Deng, Y. Impact of cross-polarization isolation on polarimetric target decomposition and target detection. Radio Sci. 2015, 50, 327–338. [Google Scholar]
- Aghababaee, H.; Sahebi, M.R. Incoherent Target Scattering Decomposition of Polarimetric SAR Data Based on Vector Model Roll-Invariant Parameters. IEEE Trans. Geosci. Remote Sens. 2016, 54, 4392–4401. [Google Scholar]
- Cloude, S.R.; Pottier, E. A Review of Target Decomposition Theorems in Radar Polarimetry. IEEE Trans. Geosci. Remote Sens. 1996, 34, 498–518. [Google Scholar]
- Cloude, S.R.; Pottier, E. An entropy based classification scheme for land application of polarimetric SAR. IEEE Trans. Geosci. Remote Sens. 1997, 35, 68–78. [Google Scholar]
- Zhang, J.; Hong, W. Equivalent system model for the calibration of polarimetric SAR under Faraday rotation conditions. Sci. China 2018, 61, 022301. [Google Scholar]
- Margarit, G.; Mallorquí, J.J.; Fortuny-Guasch, J.; López-Martínez, C. Exploitation of Ship Scattering in Polarimetric SAR for an Improved Classification Under High Clutter Conditions. IEEE Trans. Geosci. Remote Sens. 2009, 47, 1224–1235. [Google Scholar]
© 2019 by the authors. Licensee MDPI, Basel, Switzerland. This article is an open access article distributed under the terms and conditions of the Creative Commons Attribution (CC BY) license (http://creativecommons.org/licenses/by/4.0/).