Abstract
Currently, heating in electric ovens is generally achieved using heaters placed on the top and bottom surfaces. In some advanced ovens, heaters are installed on the back surface, allowing 3D heating. However, in these ovens, temperature measurements are obtained from a single point, making the temperature control unreliable. Additionally, this type of oven cannot provide homogeneous heating since it lacks heaters on the left, right, or front surfaces. In this study, a unique electric oven equipped with heaters and temperature sensors was designed and produced on all six surfaces. To model its performance, the heating behavior of the oven was derived using the Ziegler–Nichols tangent method, and the gain factors for the proportional (P), proportional-integral (PI), and proportional-integral-derivative (PID) controllers were determined. Subsequently, real-time digital control of the oven was performed using on-off, P, PI, and PID controllers, which ensured a comprehensive evaluation of the oven’s control performance. The experimental results showed that homogeneous heating could only be achieved when all panels were energized. Additionally, the PI and PID controllers stabilized the system with a maximum steady-state error of 1.3 °C in all cases, demonstrating the accuracy of the derived system model and adequacy of the implemented control system.
    1. Introduction
Electric furnaces are frequently used in industry and in daily life. Generally, the heating process in these furnaces is performed by taking measurements from single point heaters placed on the lower and upper surfaces of the furnace. Therefore, it cannot be determined whether the thermal distribution in the inner chamber of the furnace is homogeneous. A considerable amount of literature has been published on the heating of electric furnaces. In one of these studies, the temperature distribution in electric furnaces is modeled as first-order plus delay (FOPDT) [,,]. In line with this model, although different techniques are used for temperature control of the device, proportional-integral-derivative (PID) control stands out because of its simplicity, performance, and stability [,,,]. In [], a system model of an electric furnace was proposed, and simulation studies of classical PID and fractional-order PID control methods were conducted according to this system model. Furnace temperature control using three PID tuning techniques, namely Ziegler–Nichols (ZN), Cohen–Coon (CC) and Chien, Hrones and Reswick (CHR) of the PID parameters was proposed in []. In [], temperature control of the heat pump solar-assisted drying system was carried out using a PID controller. The operating stability of the system was investigated by drying red pepper. In [], traditional PID controllers, intelligent control techniques, such as fuzzy PID, fuzzy self-adjusting PID, fuzzy immunity PID, and expert PID, were compared to eliminate the large overshoot and large swing problem in furnace temperature control. In [], an adaptive fuzzy control technique was used to control the temperature of the electric furnace. The efficiency of the technique used was compared with that of classical PID and traditional fuzzy controller techniques. In [], a proportional integral (PI) controller was used to control an inter-heated thermal turbine. The gain parameters Kp and Ki of the PI controller were adjusted using particle swarm optimization (PSO). In [], temperature control of an electric furnace was performed using a fuzzy PID controller. The performance of the applied control technique was compared to that of a traditional PID controller. A linear low-order model for the temperature control of a tempering furnace was proposed in [], and a model predictive control was applied. To validate the performance of the proposed model and adaptive observer-based model predictive control, simulation studies were performed, and their performance was compared with that of a PI controller and a nonlinear model predictive controller. Temperature control of biofuel furnaces was realized in [] using a PID controller. In this study, the Kp, Ki, and Kd parameters were determined using a trial-and-error method. The optimum Kp, Ki, and Kd weighting factors were determined based on the system control performance, steady-state error, overshoot size, rise time, and settling time, respectively. An adaptive fuzzy PID controller for a resistive furnace system was designed in [] by combining the simple nature of PID control with the strong reasoning of fuzzy rules. The efficiency of the proposed method was compared with that of a conventional PID controller. In [], a heat pump solar collector dryer was designed and controlled using a PID controller. In this study, temperature control, with an accuracy of approximately ±0.369 °C, was performed at a reference temperature of 40 °C. In [], temperature control of a glass melting furnace was carried out for a television picture tube. A hybrid control system was proposed as a control method that combines a fuzzy logic controller and a PI controller. The proposed hybrid controller was implemented in a real production furnace at the Samsung–Corning Company, Suwon, Korea, and its performance was investigated. Although different control theories for furnace temperature control have been proposed in these studies, none of them have investigated the homogeneity of the thermal distribution in the heater chamber of furnaces.
In the literature, the distribution of thermal changes in heater chambers of different furnace types has been investigated. In [], three-dimensional temperature measurement of a gas-fired pilot tube furnace was performed. The temperature distribution of the furnace was determined using the DRESOR method based on radiation image processing technology, with the help of four flame image detectors placed in the heater chamber. The accuracy of the measurement results was compared with the data obtained using the thermocouples. In [], a three-dimensional temperature distribution in large-scale boiler furnaces was visualized. Radiative energy images were obtained using cameras placed around the furnace. A modified Tikhonov regularization method was proposed to obtain a three-dimensional temperature distribution using these data. In [], a one-dimensional mathematical model describing the gas flow of a tunnel kiln, heat transfer between the brick and air, and evaporation of bound water in the brick was proposed, and simulation studies were conducted. In [], a new tomography detector was proposed to determine the three-dimensional flame temperature distribution in a furnace. The proposed sensor was used to detect the three-dimensional temperature distribution of semi-industrial fuel-oil flames. The performance results of the proposed sensor were compared with those obtained using color pyrometry. In [], the temperature change in an aluminum melting furnace was observed using optical sensors. A light-receiving camera was placed in the upper part of the oven. Using this camera, a new method that allows the user to objectively evaluate the melting process in a furnace was proposed. In [], a three-dimensional temperature distribution was observed in a tangentially fired furnace. Flame images inside the furnace were measured at different angles using a camera placed inside the furnace. To determine the three-dimensional thermal distribution in the inner chamber of the furnace with minimum error, the measurements obtained from different angles were combined with the proposed solution algorithm. The efficiency and applicability of the proposed algorithm were verified through experimental tests. In [], the three-dimensional homogeneous thermal change in reflow furnaces, depending on the internal convectional coefficient, was investigated. A three-dimensional internal convection coefficient map of the reflow oven was obtained from the data obtained using the measuring probes. Based on this map, the convection efficiency of the heater chamber of the reflow brazing furnace was investigated. The results of these studies indicate that previous approaches, which applied heating from a single region, failed to achieve a homogeneous temperature distribution in the heater chamber of the furnace.
This study sets out to design, produce, and control a three-dimensional electric furnace. The heaters and PT100 temperature sensors were located on all six inner surfaces of the oven to achieve homogeneous heat distribution in the chamber. PID control of the heaters on the entire surface was performed separately with the help of the driver cards. Thus, the heating process along the x-, y-, and z-axes of the furnace was conducted in three dimensions. The system model of the furnace and Kp, Ki, and Kd parameters were determined using the ZN method. The on-off, proportional (P), proportional plus integral (PI), and proportional plus integral plus derivative (PID) control methods were applied to the furnace. The time responses of the applied control techniques such as overshoot, rise time, offset error, integration of absolute error (IAE), integration of square error (ISE), integration of time-weighted absolute error (ITAE), and integration of time-weighted square error (ITSE) metrics were calculated and analyzed. In addition, the noise originating from the network was minimized by applying zero-crossing circuits to the driver unit. The results of the experimental studies indicated that a homogeneous thermal distribution was achieved in the heater chamber of the furnace within an acceptable error range. There are several important areas where this study makes an original contribution to the heating control system of electric furnaces:
- An original oven equipped with heaters and temperature sensors on six surfaces was designed and modeled, and temperature was controlled.
 - Temperature measurements were performed at six different points inside the oven, and each heater on the six surfaces of the oven was controlled separately.
 - It was demonstrated that homogeneous heating is not possible in electric ovens unless heaters are present on all six surfaces and the temperature of each heater is individually controlled.
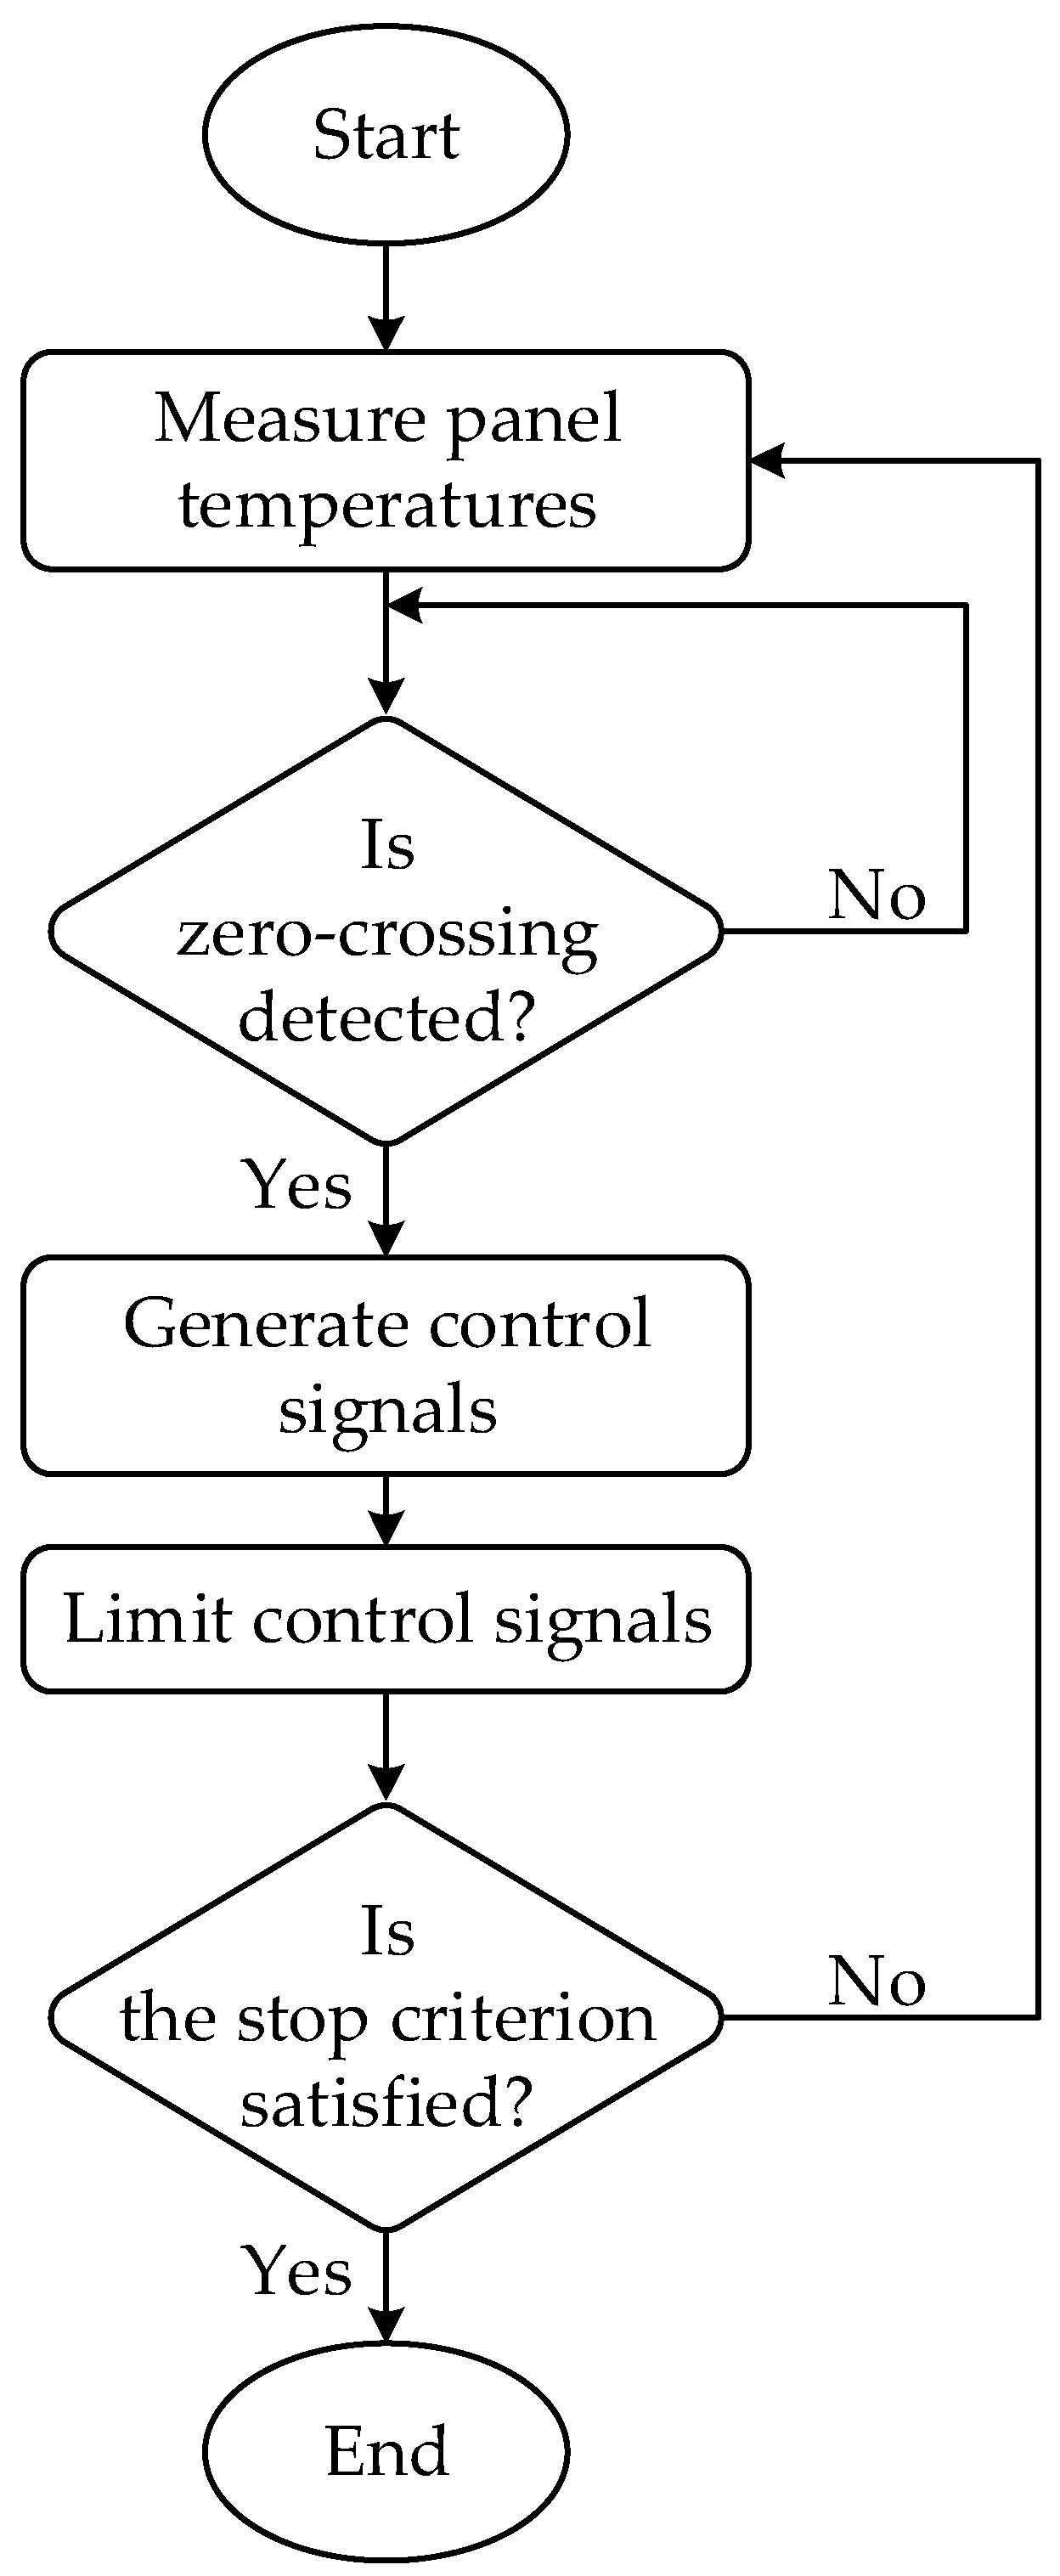
 - The heaters were switched at zero crossings of the main voltage to prevent sudden surges in current and noise generation on the mains.
 
The remaining part of the paper proceeds as follows: Section 2 contextualizes the research by introducing the implemented oven and explaining the applied methods. Section 3 includes a discussion of the findings based on experimental results. The final section provides a summary and critique of the findings.
2. Materials and Methods
2.1. The On-Off Control
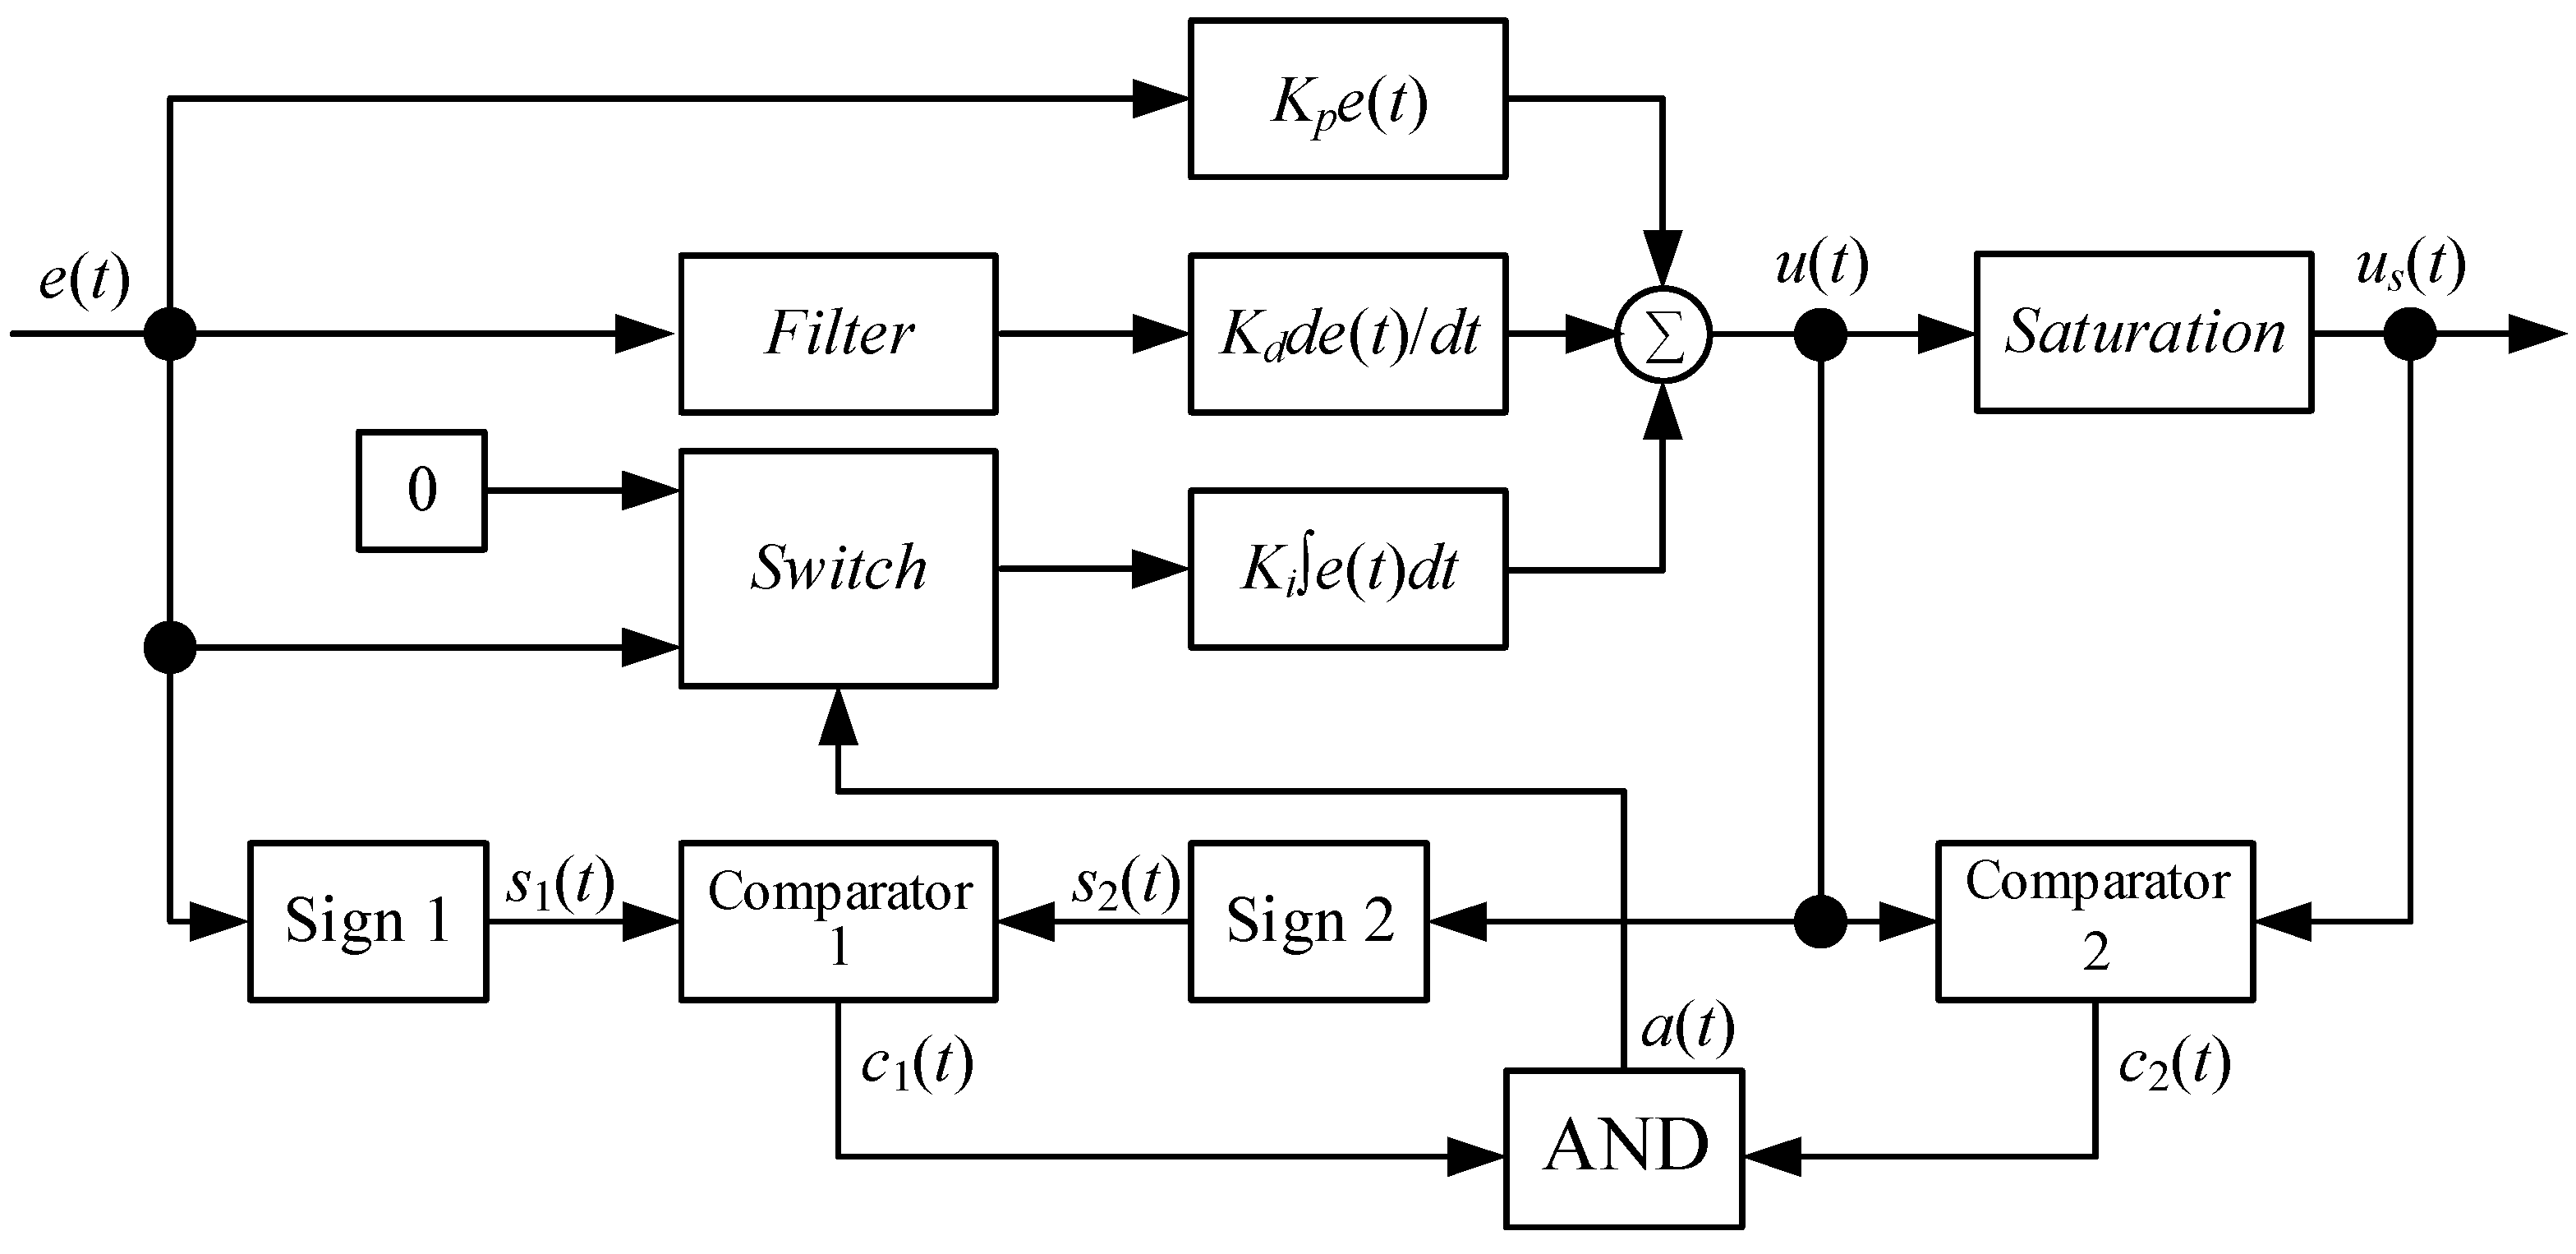
The on-off control system is the simplest control method, and it is frequently encountered in industry and our daily lives []. This system is used in heaters, air conditioners, ovens, combined boilers, and many other devices. In the on-off control technique, a set point is determined according to the state of the system to be operated. If the system has a value below this set point, it continues to operate. If the system produces a value greater than the set point, it stops working and attempts to fix the system at the set point []. There are no intermediate values for an ideal on-off control system. In other words, the system oscillates at a set point and performs continuous opening and closing operations. This results in a reduction in the life of the system used during the continuous opening and closing process, as well as of the components that make up the system. For this reason, a band gap or hysteresis below and above the system set value is generated, and the system is prevented from being continuously on and off []. Thus, more accurate operation of the system is ensured, and the durability of the system units is extended. This control system can also be used to control parameters, such as temperature, pressure, speed, acceleration, and position.
2.2. PID Control
PID control is widely used in control systems because of its sensitivity and practicality. It is commonly employed to stabilize unstable systems []. In this control method, the control signal is obtained by combining three proportional, derivative, and integral actions []. Here, an integral action is used to minimize and eliminate the offset error in large changes in the system. Derivative actions are generally used to reduce errors that occur during sudden changes. Thus, the error is maintained within the desired limits by using PID control in situations that may occur in the system []. Figure 1 shows a block diagram of the PID with an anti-windup and derivative filter.
      
    
    Figure 1.
      Block diagram of the PID controller with anti-windup and derivative filter.
  
In Figure 1,  represents the error signal,  the control signal,  the saturated control signal,  the sign of the system error,  the sign of the control signal,  the output of the first comparator,  the output of the second comparator, and  the output of the logical AND operation [,]. When the system output is noisy, this noise is transferred to the error signal. The derivative component of the PID controller amplifies the noise carried by the error signal and adds it to the control signal. This situation leads to a degradation in the stability of the system. In Figure 1, a low-pass filter is added to the input of the derivative component to minimize the effect of noise in the system output and sudden changes at the setpoint on the control signal. In addition, the signs of the error and control signals were first compared to prevent the integral component of the controller from saturating. If the signs of these two signals are the same, the output of the first comparator is logical-1 (); otherwise, it is logical-0 (). Subsequently, the second comparator monitors whether the control signal has reached saturation. When the control signal is not saturated (), the comparator output is logical-0 (). However, when the control signal reaches saturation (, the comparator output becomes logical-1 (. The outputs of the comparators are connected to the input of the logical AND operator, and the output of the AND operator is connected to the input of the switch. In the case of saturation, when the error and control signals have the same sign and the control signal reaches saturation, the operator output is logical-1 (. In this case (clamping), the switch connects the input of the integral component to zero. In other cases, since the output of the AND operator is logical-0, an error signal is applied to the integrator input. The use of a derivative filter and integrator anti-windup in the PID controller enhances the performance of the controller and stability of the system.
2.3. Error Area Based Performance Criteria
The error area is defined as the area between the system response curve and the reference curve. The commonly used criteria for error areas in the literature are presented in Equations (1)–(4).


        where t is the time, T is the period, and |.| shows the absolute values.
2.4. General Description of the System
A block diagram of the digitally controlled electric furnace is presented in Figure 2. The furnace consisted of three main components: mechanical, electrical, and software. The mechanical components included the outer main body of the oven, heaters, and sensors. The electrical unit consisted of a microcontroller card, zero-crossing detection circuit, analog digital converter (ADC) card, and driver circuits. The software component included control software running on a laptop computer and embedded software running on the microcontroller.
      
    
    Figure 2.
      General block diagram of the system.
  
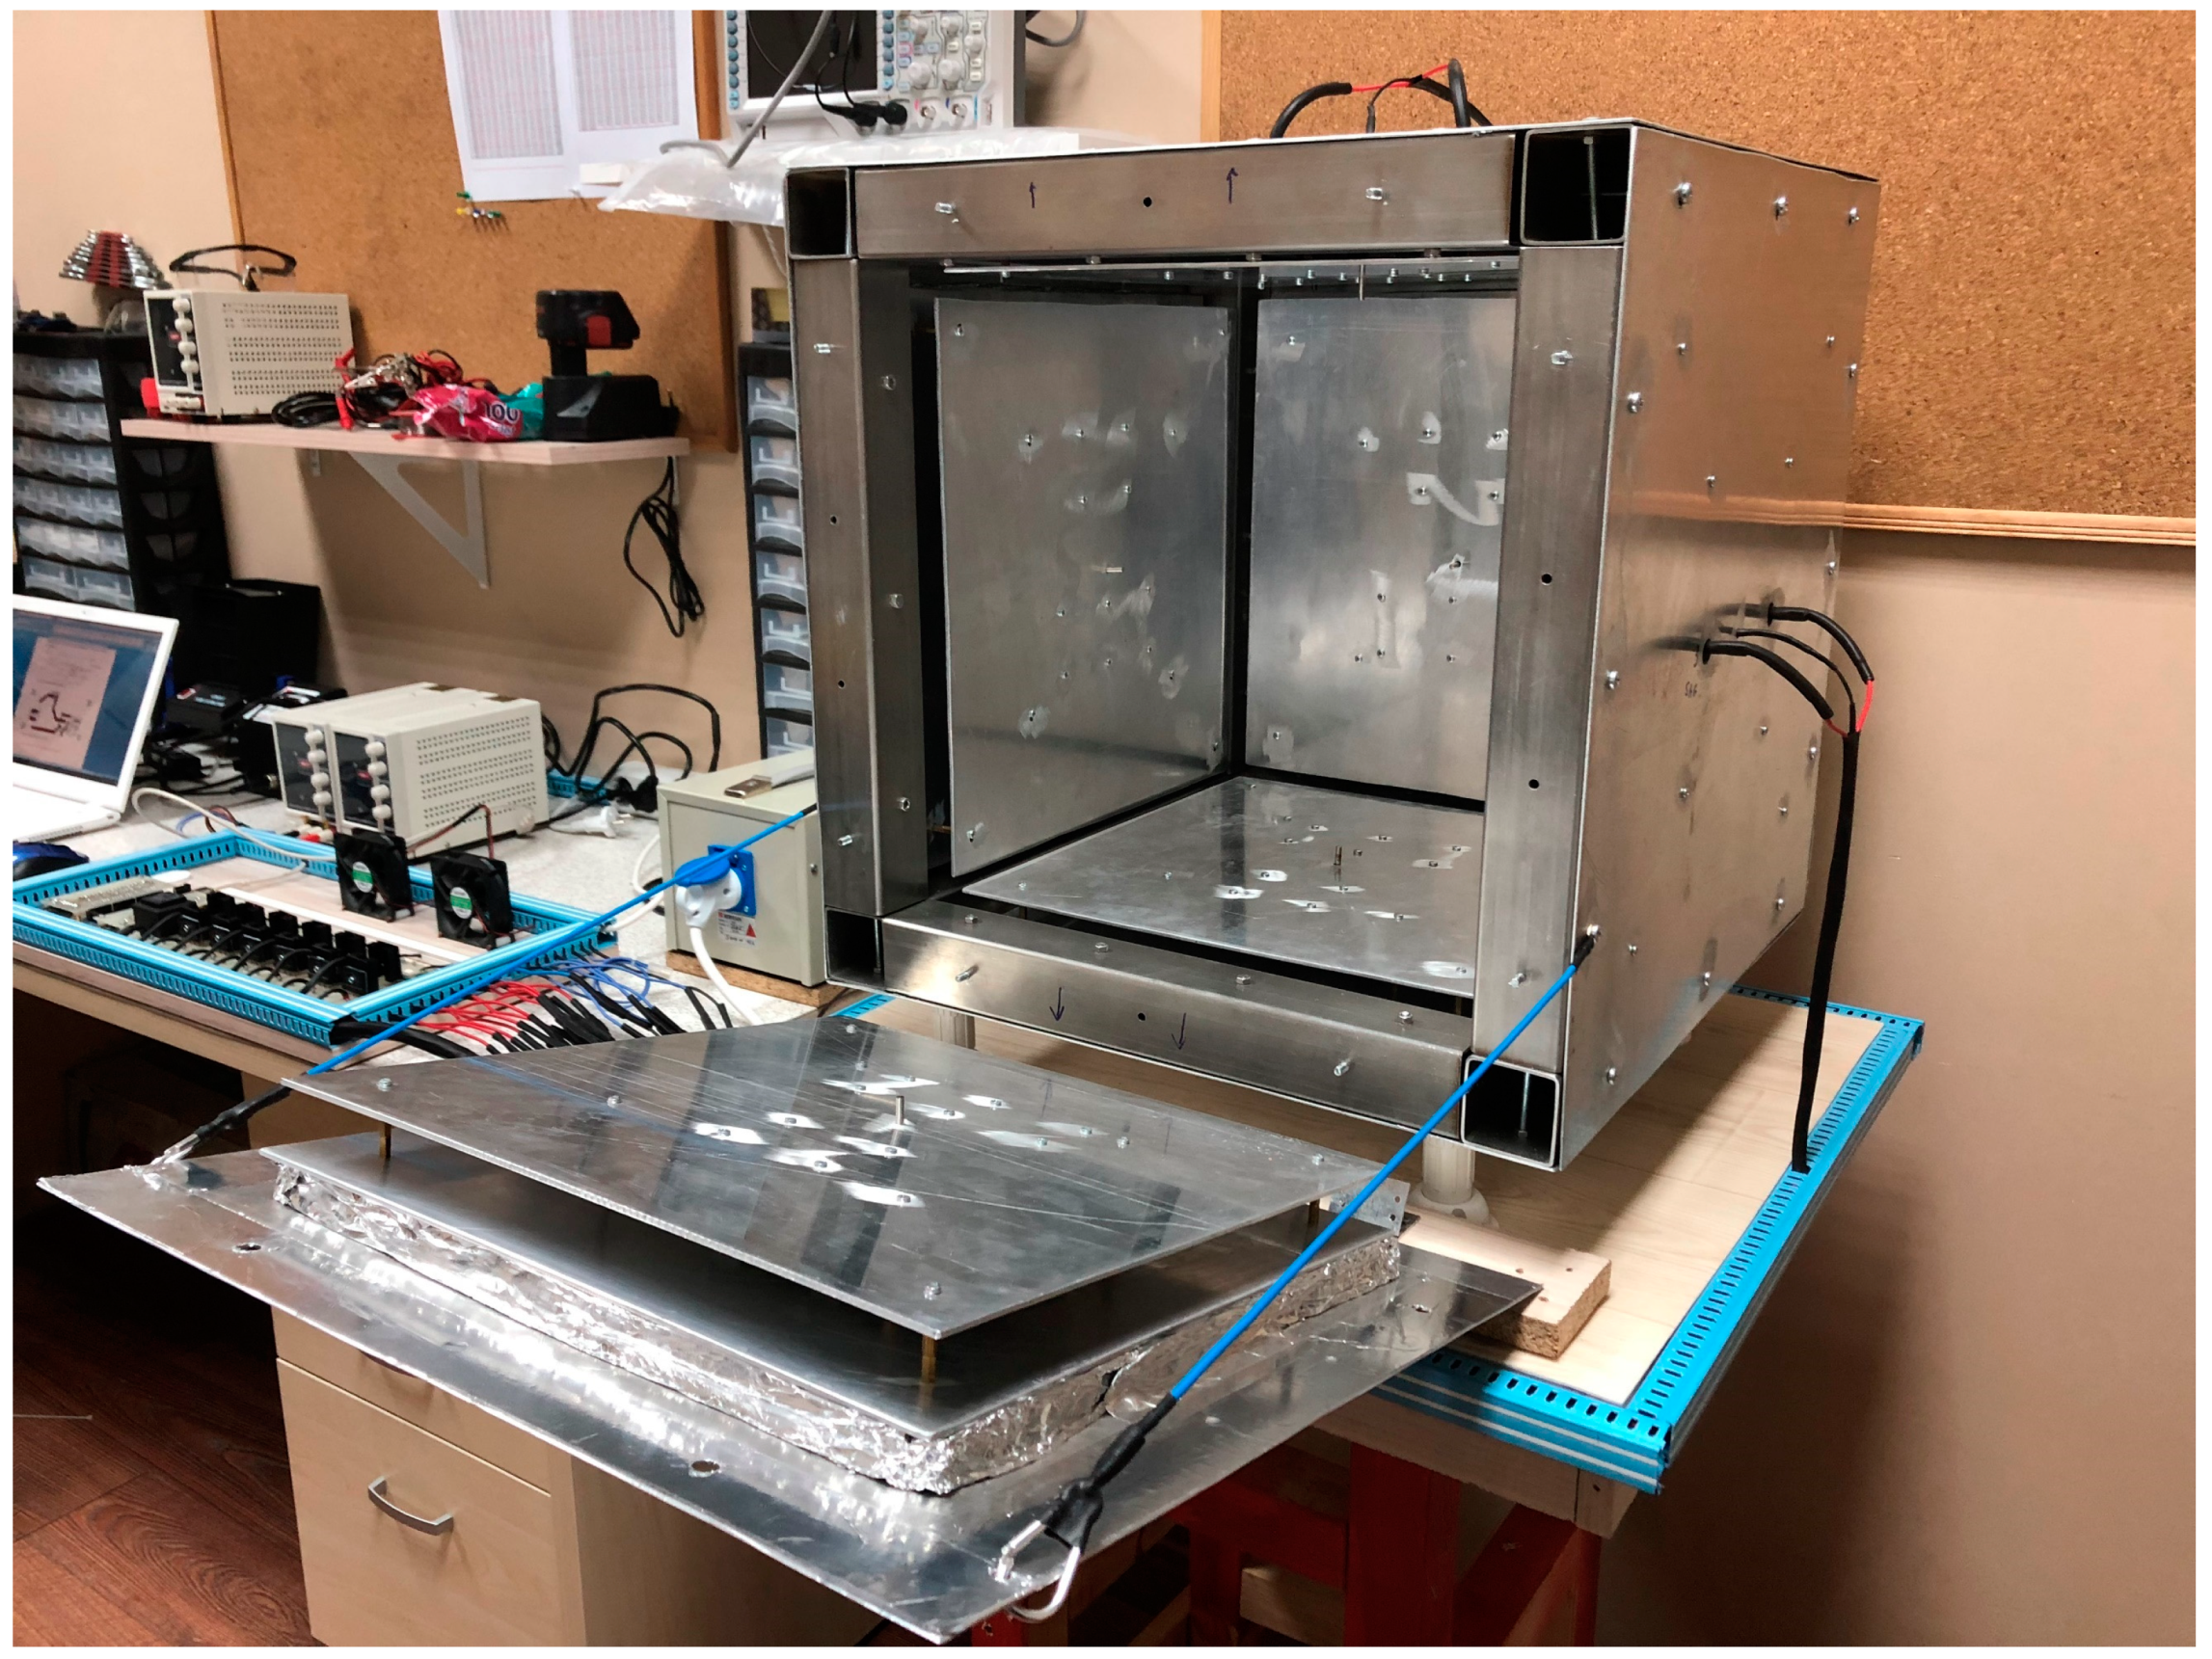
2.5. Mechanical Part
The mechanical component of the electric furnace was produced in three stages. In the first stage, the main body of the furnace was constructed as a cube measuring 60 cm × 60 cm × 60 cm, composed of four aluminum profiles measuring 60 cm × 5 cm × 5 cm and twelve profiles measuring 50 cm × 5 cm × 50 cm. Subsequently, the panels of the electric furnace were formed using aluminum plates measuring 60 cm × 60 cm, with each panel consisting of five layers. The first layer included an aluminum plate measuring 45 cm × 45 cm × 0.3 cm, designed to radiate heat generated by the resistance element. The second layer contained a 375 W heater (Baykal Rezistans Ltd. Co., Sakarya, Türkiye) and a PT100 temperature sensor (JUMO Process Control, Inc., Syracuse, NY, USA). The third layer consisted of another aluminum plate measuring 45 cm × 45 cm × 0.3 cm, which was fixed to the second layer with a copper spacer measuring 2 cm in height. The fourth layer was filled with rock wool, measuring 2.2 cm thick, capable of withstanding temperatures up to 750 °C to provide thermal insulation. Finally, a fifth layer comprised an aluminum plate measuring 60 cm × 60 cm × 0.3 cm, forming the outer surface of the oven. The mechanical assembly of the electric furnace was completed by combining these panels and components. Figure 3 provides a general view of the oven.
      
    
    Figure 3.
      General view of the oven system.
  
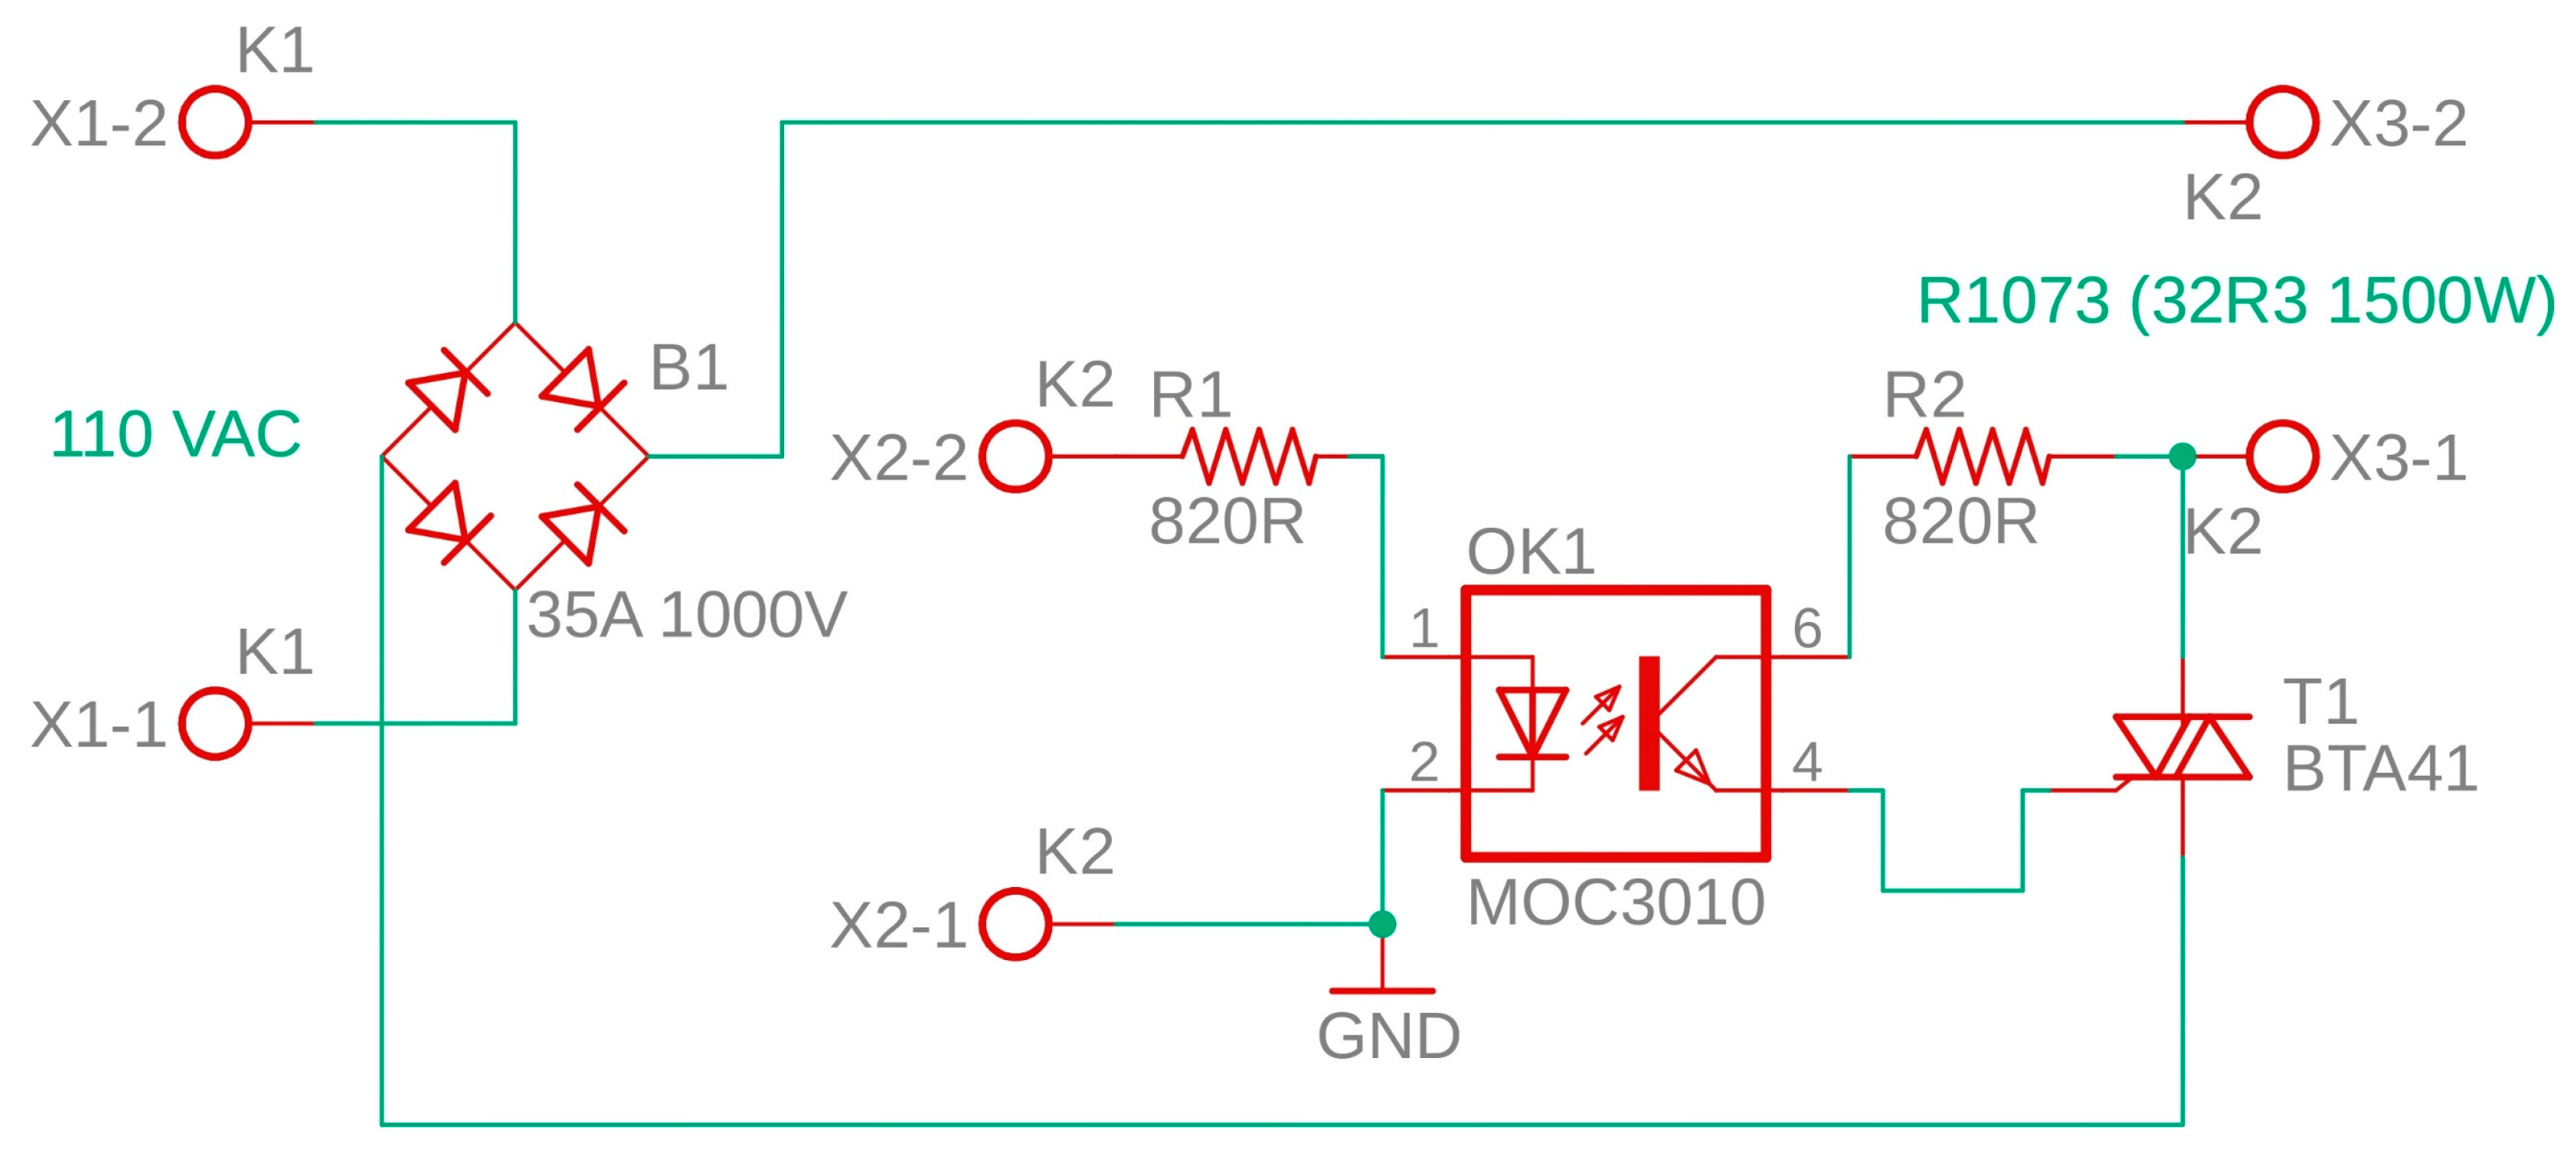
2.6. Electrical Part
The electrical component consisted of three basic components. The first is the converter unit, which converts analog data received from the sensors to digital data. The second part is the zero-crossing detection circuit, which enables the driver board to trigger. The last unit was the heater driver board.
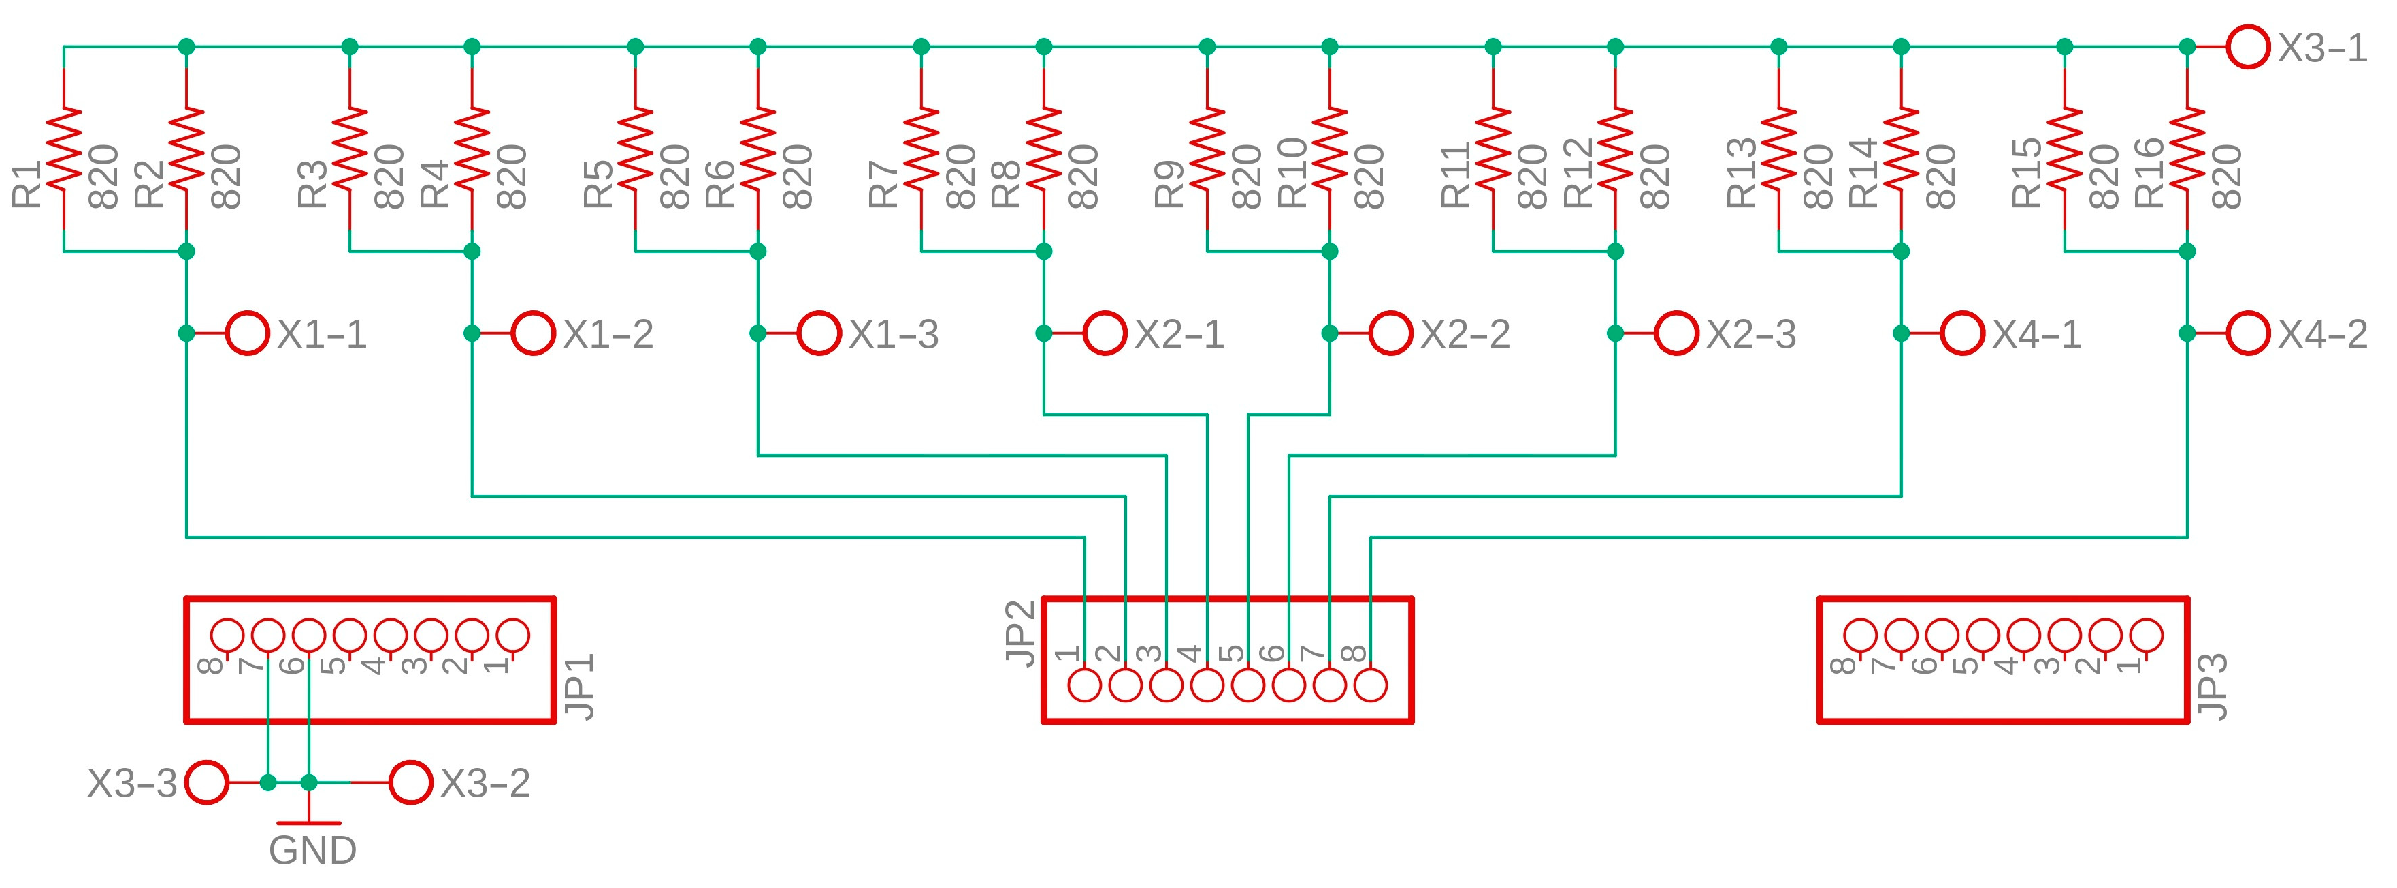
2.6.1. Analog Digital Converter Card
The ADC card digitally converted the temperature detected by the PT100 sensor. Temperature variations in the resistors led to changes in the resistance of the PT100 sensor. These resistance changes were converted into voltage changes by using the ADC interface card. Subsequently, this voltage change was digitized using an Arduino Mega microcontroller card and transferred to a laptop via the USB port. A schematic diagram of the ADC interface card is shown in Figure 4.
      
    
    Figure 4.
      Schematic of ADC board.
  
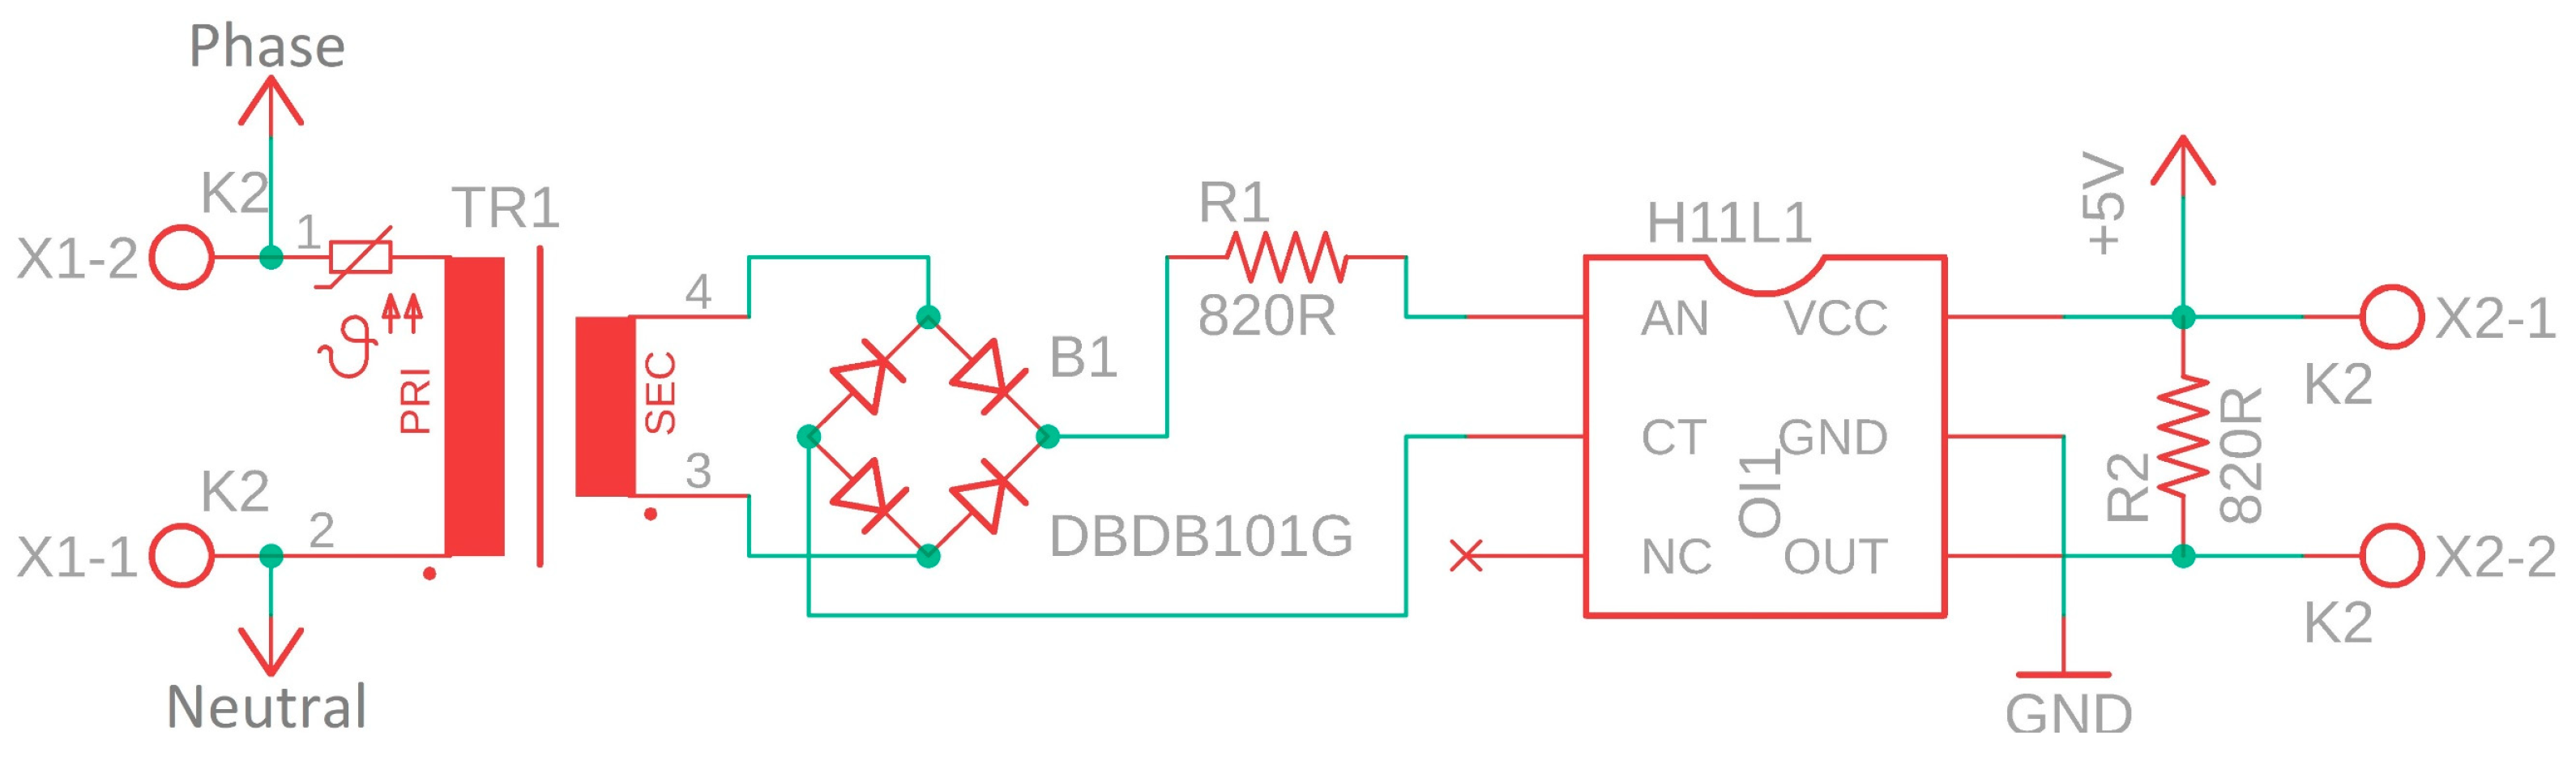
2.6.2. Zero-Crossing Detection Circuit
Resistance heaters with a power of 375 W were placed on each surface of the electric furnace to ensure homogeneous heating. The resistance heaters were independently controlled by pulse-width-modulated (PWM) trigger signals. Trigger signals were provided by a microcontroller card in 1 ms steps in a 100 ms period. The trigger signal and zero-crossing detection circuit were operated simultaneously to prevent interference from potential disturbances in the network. A schematic of the zero-crossing circuit is shown in Figure 5. Zero-crossings of the network frequency were detected using an H11L1 integrated circuit. The supply voltage required for the operation of H11L1 is provided by a 2 W transformer, 1.5 A bridge diode, and a 12 VDC supply regulated by an LM7805 linear voltage regulator and its peripheral components. The H11L1 generates a pulse with an amplitude of 5 V and a width of 500 μs for each zero crossing.
      
    
    Figure 5.
      Schematic of the zero-crossing detection circuit.
  
With the zero-crossing detection circuit, the triac was always placed into conduction or occlusion at zero crossings. Thus, the current at the time of switching became zero, and soft switching was performed. Otherwise, excessive currents could be drawn instantaneously during the furnace operation, and noise would be generated at the network voltage.
Driver Circuit
The implemented driver circuit consisted of a 35 A 1000 V rectifier bridge diode, an MOC3010 optically isolated triac driver, and a BTA41 triac. After the main voltage was rectified using the bridge diode, it was applied to the input end of the resistance. The output end of the heater was connected to a 41 A 600 V triac with a dynamic resistance of 10 mΩ. The trigger signal from the controller card was applied to BTA41 through MOC3010 optically insulated triac driver integration. Thus, the heater operated at different power levels using a trigger signal. A schematic of the driver circuit is shown in Figure 6.
      
    
    Figure 6.
      Schematic of driver circuit.
  
The main control panel of the electric furnace was realized by combining a microcontroller card, ADC card, zero-crossing detection circuit, and driver cards. Figure 7 shows the control panel.
      
    
    Figure 7.
      General view of the main control panel.
  
2.7. Software Part
The software part consisted of programs on a laptop and controller card. These programs enabled real-time temperature control of the electric furnace using on-off, P, PI, and PID control methods.
2.7.1. Control Software
The control software received the real-time temperature data for each panel from the microcontroller card via the USB port and calculated the instantaneous error by comparing it with the specified reference temperatures. The temperature error was applied as an input to the on-off, P, PI, and PID controllers, and the duty ratios required for each heater were calculated. The duty ratios were between 0% and 100% with a resolution of 1%. These values were then transmitted to the controller card via the USB port, with this process occurring every second.
2.7.2. Controller Software
The control card functioned as a data capture interface between the computer and controlled system. It generated control signals and triggers driver circuits based on the duty values received from the computer and the output of the zero-crossing detection circuit. Additionally, it measured the panel temperatures and transmitted them to a computer in real time.
Figure 8 shows a flowchart of the main control program. The main control program consisted of five components. These are:
      
    
    Figure 8.
      Flowchart of the main control program.
  
Measurement: The resistance change in the PT100 sensors on each panel was converted into a voltage change using an ADC card. These analog temperature voltages were sampled and digitized 100 times per second, as defined in Equation (5). The average temperature was then used to obtain the digital temperature of each panel. This process acted as a derivative filter for the derivative component of the PID controller. In this way, the high-frequency components of the noise on the controlled variable, and therefore, on the error signal, were filtered. Thus, the disruptive effect of the measurement noise on the stability of the system, caused by the derivative controller, was minimized.


		  where  is the panel temperature, N is the number of samples, k is the sample index, i is the oversampling index, and  is the oversampling period.  and  were selected. In this case, the temperature of each panel was sampled 100 times within 100 ms.
Synchronization: To prevent the proposed electric furnace from generating noise on the grid during operation, the heaters on the panels were powered on and off at the zero crossings of the main voltage. The output of the zero-crossing detection circuit was connected to the digital input of the microcontroller board. Upon detecting the zero crossing, the controller applied control signals to the driver circuits, thereby synchronizing the control signals with the mains voltage.
Control: The control signal for each panel was determined based on the selected control method (on-off, P, PI, or PID). The temperatures of the six panels were maintained at the reference values using six independent control loops. In the on-off control, control signals were generated using Equation (6):


          where  is the control signal, and  is the threshold, which is set to .
In the P-controller, the error signals were obtained using Equation (7), and the control signals were determined using Equation (8):


          where  is the temperature control error, and  is the proportional gain.
In the PI controller, the control signals were obtained using Equation (9):


          where  denotes the integral gain. The anti-windup method, shown in Figure 1, was used for the integral action of the PI controller.
In the PID controller, the control signals were generated using Equations (10) and (11):


          where  is the derivative gain,  is the current value of the system error,  is the value of the system error in the previous sample,  is the current value of the filtered error signal,  is the value of the filtered error signal in the previous sample, and  is the sample index. The anti-windup strategy shown in the block diagram in Figure 1 was used for the integral action of the PID controller. Additionally, to prevent the noise in the temperature measurements from adversely affecting the system, a first-order Butterworth filter, defined in Equation (11), was used in the derivative action of the PID controller.
Saturation: The control signal was a positive integer that varied between zero and 100. The control signal was limited to within this range by using Equation (12).


Termination: The temperature control continued until the stop condition was satisfied. The stop condition was determined by the maximum number of samples, and temperature control was terminated when .
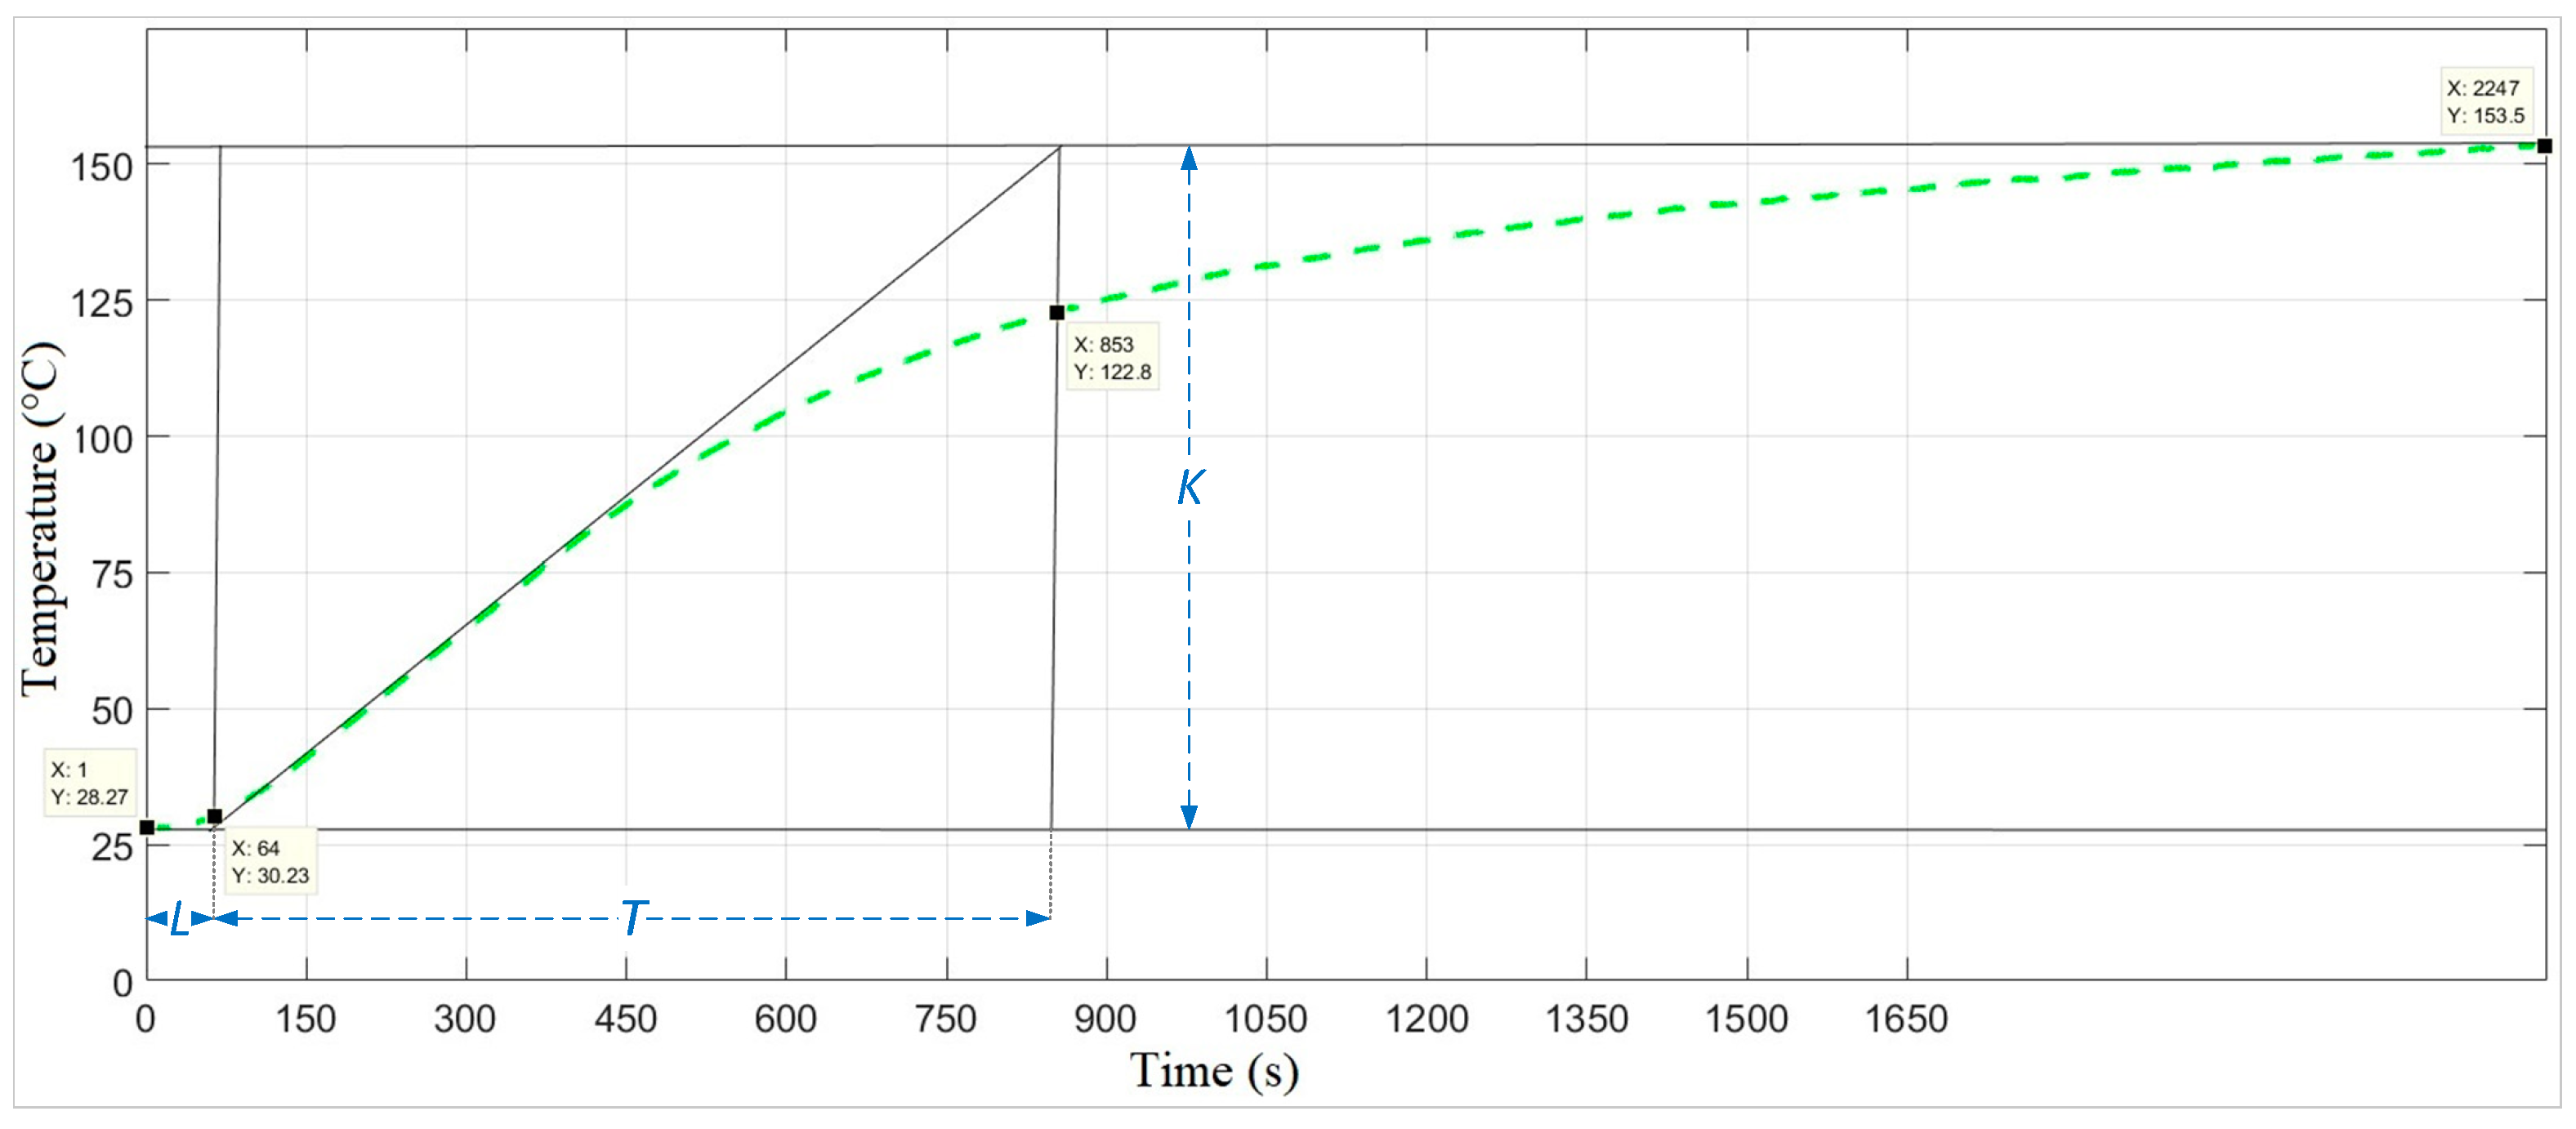
2.8. System Modeling and Determination of PID Parameters
The designed electric furnace was a first order plus dead time (FOPDT) system. Ziegler–Nichols step response method was used in modeling the furnace. In the system modeling, a unit step function was first applied to the system input. The system model was determined from the obtained output signal using the Ziegler–Nichols step response method. Figure 9 shows the output response of the system. Equation (13) was used when modeling the system using the Ziegler–Nichols step response method:


        where K is the steady-state gain, L is the time delay, and T is the time constant. From the graph in Figure 8, K = 125.23, T = 789, and L = 64 are obtained. Using these values, the system model was determined, as given in Equation (14).


    Figure 9.
      Step response of the system.


    Table 1.
    PID parameters found by the Ziegler–Nichols tangent method.
  
3. Results
In this section, the temperature control of the furnace designed for three-dimensional heating was presented, along with the obtained results. The reference temperature was set to 125 °C, and the gain factors of the P, PI, and PID controllers were considered, as shown in Table 1.
3.1. Temperature Control of a Single Panel
In this section, only the bottom panel was energized in the experimental results given. The temperature variations of the six panels are shown in Figure 10, and the control signals applied to the panels are shown in Figure 11. In Figure 10, it can be observed that, when the on-off control was applied, the panel temperature fluctuated around the reference temperature line. Additionally, it was observed that the P controller produced a steady-state error, whereas the steady-state error was significantly reduced by the PI and PID controllers.
      
    
    Figure 10.
      Temperature change over time for a single panel.


    Figure 11.
      Change in control signal over time for a single panel.
  
In Figure 10, it can be observed that, when only the bottom panel is energized, the temperatures of the other panels also change. In Figure 10, the temperatures of the right, left, front, and rear panels increased by less than 20 °C. However, the temperature of the top panel increased by approximately 50 °C. This was due to an increase in the heated air. In addition, the temperature distributions of the panels indicate that homogeneous heating is not possible with a single panel.
The performance metrics of the four control methods are presented in Table 2. For each control method, the error-area-based performance metrics (IAE, ISE, ITAE, and ITSE) were calculated and are listed in the table. As shown in Table 2, the lowest time rise was obtained with the on-off controller. This was because the bottom panel operated at full power until it reached the reference temperature. However, this led to an overshoot of 9.1877%. In addition, the system was stabilized in the shortest time with the P controller, and the least steady-state error was obtained with the PID controller. Finally, in terms of the performance criteria based on the error area, the best performance was achieved with the PI controller.
       
    
    Table 2.
    Bottom panel temperature control performance values for a single panel case.
  
3.2. Temperature Control of Two Panels
The temperature changes in the panels when the bottom and back panels were energized are shown in Figure 12, and the control signals are shown in Figure 13. It was observed that, with the on-off control, the panel temperatures oscillated around the reference temperature, and the system did not stabilize. Additionally, it was found that the P controller stabilized the system but produced an offset error. Finally, this error was reduced to a negligible level when using the PI and PID controllers.
      
    
    Figure 12.
      Temperature changes over time for two panels.


    Figure 13.
      Change in control signal over time for the two panels.
  
When the bottom and rear panels were energized, the PI and PID controllers maintained temperature control at the reference value, as shown in Figure 12. Due to its greater geometric distance from the energized panels, the front panel experienced the least temperature change (less than 10 °C). The right and left panels, equidistant from the bottom and rear panels, respectively, showed a moderate temperature change (less than 35 °C). The top panel, owing to the rising heated air, experienced the most significant temperature change (less than 60 °C).
When two panels were energized, the temperature distribution inside the furnace was more homogeneous compared to when only one panel was energized, as presented in Figure 12. However, a significant temperature difference remained between the energized and non-energized panels, indicating that homogeneous heating was not achievable with only two panels.
As shown in Table 3 and Table 4, the lowest rise time was obtained with the P control. Additionally, in the on-off control, the overshoot at the panel temperatures exceeded 2%. Furthermore, the system stabilized in the shortest time with the P controller, and the least steady-state error was obtained with the PID controller. Finally, based on the error area criteria, the best temperature control performance was achieved using the PID controller.
       
    
    Table 3.
    Bottom panel temperature control performance values for two panel cases.


    Table 4.
    Back panel temperature control performance values for two panel cases.
  
3.3. Temperature Control of Three Panels
In the three-panel scenario, the bottom, back, and left panels were energized, and the temperature changes in the panels are shown in Figure 14, with the control signals presented in Figure 15. As with the single-panel and two-panel cases, the on-off controller caused the panel temperatures to oscillate around the reference value and failed to stabilize the system. Similarly, the P controller stabilized the system but produced a steady-state error. Finally, the PI and PID controllers, owing to their integral action, stabilized the system, with the steady-state error reduced to a negligible level. When the three panels were energized, the bottom, rear, and left panels reached the reference temperatures using the PI and PID controllers, as shown in Figure 14. Additionally, the front panel experienced minimal temperature change, the right panel experienced moderate temperature change, and the top panel underwent the greatest temperature change. However, a significant temperature difference remained between the energized and non-energized panels, indicating that homogeneous heating could not be achieved.
      
    
    Figure 14.
      Temperature changes over time for the three panels.


    Figure 15.
      Change in control signal over time for the three panels.
  
As shown in Table 5, Table 6 and Table 7, the lowest rise time was achieved with the on-off control for the back panel and P control for the bottom and left panels. Additionally, the P controller stabilized the system in the shortest time, and while the PID controller resulted in the smallest steady-state error. Based on the error area criteria, the PI controller exhibited the best performance.
       
    
    Table 5.
    Bottom panel temperature control performance values for three panel cases.


    Table 6.
    Back panel temperature control performance values for three panel cases.


    Table 7.
    Left panel temperature control performance values for three panel cases.
  
3.4. Temperature Control of Four Panels
Regarding the bottom, back, left, and right panels energized, the temperature changes of the panels are shown in Figure 16, while the control signals are illustrated in Figure 17. In the on-off control, the temperatures of the four energized panels oscillated around the reference temperature. In contrast to the PI, and PID controls, the temperatures of the bottom, rear, left, and right panels reached the reference temperature with a lower steady-state error at 1 °C.
      
    
    Figure 16.
      Temperature changes over time for the four panels.


    Figure 17.
      Change in control signal over time for the four panels.
  
In Figure 16, the four energized panels reached the reference temperature with the P, PI, and PID controls. However, the front panel temperature was lower (less than 20 °C), and the upper panel was significantly affected (less than 75 °C) compared to the four energized panels. Additionally, there was a significant temperature difference between the four energized panels and two non-energized panels. Therefore, homogeneous heating could not be achieved using the four panels.
Table 8, Table 9, Table 10 and Table 11 indicate that the P controller stabilized the system in the shortest time, and the lowest offset error was obtained with the PI and PID controllers. Additionally, in terms of error-area-based performance metrics, PI control was the most successful control method.
       
    
    Table 8.
    Bottom panel temperature control performance values for four panel cases.


    Table 9.
    Back panel temperature control performance values for four panel cases.


    Table 10.
    Left panel temperature control performance values for four panel cases.


    Table 11.
    Right panel temperature control performance values for four panel cases.
  
3.5. Temperature Control of Five Panels
The temperature changes of the panels when the bottom, back, left, and right, and front panels were energized are shown in Figure 18, while the control signals applied to the panels are shown in Figure 19. Similarly, under the on-off control, the panel temperatures fluctuated around the reference temperature, and the system did not stabilize. However, with PI, and PID control, the panel temperatures approached the reference value with a steady-state error of less than 0.4 °C, achieving system stability.
      
    
    Figure 18.
      Temperature changes over time for the five panels.


    Figure 19.
      Change in control signal over time for the five panels.
  
The five energized panels increased the temperature of the unenergized top panel from 27 to 97 °C. However, this value remained significantly below the reference temperature, and homogeneous heating could not be achieved with the five energized panels.
In Table 12, Table 13, Table 14, Table 15 and Table 16, considering the error-area-based performance criteria, the PI controller demonstrated the best performance. Additionally, the temperature control stabilized in the shortest time with the P controller, as shown in Table 12 and Table 16. Moreover, the lowest offset error was achieved with the PI and PID controllers, as listed in Table 12, Table 13, Table 14, Table 15 and Table 16.
       
    
    Table 12.
    Bottom panel temperature control performance values for five panel cases.


    Table 13.
    Back panel temperature control performance values for five panel cases.


    Table 14.
    Left panel temperature control performance values for five panel cases.


    Table 15.
    Right panel temperature control performance values for five panel cases.


    Table 16.
    Front panel temperature control performance values for five panel cases.
  
3.6. Temperature Control of Six Panels
Regarding all energized panels, the change in panel temperatures over time is shown in Figure 20, while the control signals are illustrated in Figure 21. Since the panels had a disruptive effect on each other, when all the panels were energized, the oscillations in the panel temperatures and control signals increased. Additionally, it took more time for the system to reach a steady state. These negative effects can be minimized by using advanced control algorithms. In practice, due to the non-homogeneous heating of electric furnaces, the temperature difference inside the furnace can rise to dozens of degrees. Considering this situation, it is clear that the performance of the applied control algorithm and system is within acceptable limits. The on-off controller could not stabilize the system, causing the panel temperatures to oscillate around the reference value. In contrast, the PI and PID controllers stabilized the system and reduced the steady-state error to below 1 °C. Figure 20 clearly shows that homogeneous heating can only be achieved when all panels are energized.
      
    
    Figure 20.
      Temperature changes over time for the six panels.


    Figure 21.
      Change in control signal over time for the six panels.
  
In Table 17, Table 18, Table 19, Table 20, Table 21 and Table 22, it can be observed that when the P controller was used, the electric oven was controlled with the lowest settling time, and the least offset error was obtained with the PI controller. In addition, considering the error-area-based performance criteria, the PI and PID controllers provide better performance.
       
    
    Table 17.
    Bottom panel temperature control performance values for six panel cases.


    Table 18.
    Back panel temperature control performance values for six panel cases.


    Table 19.
    Left panel temperature control performance values for six panel cases.


    Table 20.
    Right panel temperature control performance values for six panel cases.


    Table 21.
    Front panel temperature control performance values for six panel cases.


    Table 22.
    Top panel temperature control performance values for six panel cases.
  
4. Conclusions
In modern electric ovens, heating is generally performed by placing heaters on the top and bottom surfaces. In some special ovens, a heater is placed on the back surface of the oven to provide three-dimensional heating. However, homogeneous heating cannot be achieved when heaters are placed on the top, bottom, and back surfaces of an electric oven. Additionally, since the oven temperature is measured from a single point, and the top, bottom, and back heaters are energized according to the same control signal, the temperature control error in such ovens can reach dozens of degrees Celsius. In this study, unlike similar studies, the design, analysis, production, and control of an innovative electric oven equipped with heaters and temperature sensors on six surfaces were carried out. The temperature of each of the six heaters on the six surfaces of the oven was measured separately and energized according to the six different control signals. Consequently, the temperature of each panel was maintained at the set reference temperature. The temperature control of the implemented unique oven was conducted using on-off, P, PI, and PID controllers. The oven heating model was derived using the Ziegler–Nichols tangent method. Using this system model, the gain factors of P, PI, and PID controllers were calculated and optimized. The experimental results demonstrated the accuracy of the obtained system model and optimized gain factors.
When the experimental results were examined, it was observed that, with on-off control, the panel temperature fluctuated around the reference value, and the system could not reach stability. In contrast, the system achieved stability with the P, PI, and PID controllers. The P controller generally produced a steady-state error, whereas the PI and PID controllers reduced the steady-state error to below 0.7 °C in the case of one, two, and three energized panels, and to below 1.3 °C in the case of four, five, and six energized panels.
The temperature control of the implemented oven was carried out for one, two, three, four, five, and six panels. The experimental results revealed that homogeneous heating was not possible unless all six panels were energized, and temperature control was applied. Therefore, it is not possible to achieve homogeneous heating with modern electric ovens that provide three-dimensional heating, as used today. This result is a novel contribution to the literature.
Finally, each of the six heaters were energized and de-energized at the zero crossings of the mains voltage. By switching the heaters when the main voltage was 0 V, the sudden surges in current from the mains and noise generation on the mains were prevented.
The system model of the implemented furnace and gain factors of the PID controller were obtained using the Ziegler–Nichols open-loop method. In future studies, the system model can be derived using linear system identification methods, such as autoregressive-moving average, autoregressive moving average with exogenous variables, and output error models, or nonlinear system identification methods, such as artificial neural networks, fuzzy jogic models, and support vector machines. Subsequently, the PID weighting factors can be optimized using metaheuristic optimization methods. Furthermore, a PT100 temperature sensor was used for the temperature measurements in the furnace. To reduce the effects of contact and cable resistance on the temperature measurement, a PT1000 temperature sensor can be used, and a low-noise operational amplifier circuit can be implemented to improve measurement accuracy. Finally, when multiple panels were energized in this study, they were powered simultaneously and de-energized based on the control signal. To obtain a more homogeneous current from the grid, a power management strategy can be applied to energize the panels sequentially in each control cycle.
Author Contributions
Methodology, A.G. and O.C.; Software, A.G. and O.C.; Validation, A.G.; Writing—original draft, A.G.; Writing—review & editing, O.C.; Supervision, O.C. All authors have read and agreed to the published version of the manuscript.
Funding
This research received no external funding.
Data Availability Statement
The original contributions presented in this study are included in the article. Further inquiries can be directed to the corresponding author.
Conflicts of Interest
The authors declare no conflict of interest.
References
- Hu, X.; Zou, Q.; Zou, H. Design and application of fractional order predictive functional control for industrial heating furnace. IEEE Access. 2018, 6, 66565–66575. [Google Scholar] [CrossRef]
 - Zhang, R.; Xue, A.; Gao, F. Temperature control of industrial coke furnace using novel state space model predictive control. IEEE Trans. Ind. Inf. 2017, 10, 2084–2092. [Google Scholar] [CrossRef]
 - Moon, U. A practical multiloop controller design for temperature control of a tv glass furnace. IEEE Trans. Control Syst. Technol. 2007, 15, 1137–1142. [Google Scholar] [CrossRef]
 - Grassi, E.; Tsakalis, K. PID controller tuning by frequency loop-shaping application to diffusion furnace temperature control. IEEE Trans. Control Syst. Technol. 2000, 8, 842–847. [Google Scholar] [CrossRef]
 - Hambali, N.; Ang, R.; Ishak, A.; Janin, Z. Various PID controller tuning for air temperature oven system. In Proceedings of the 2014 IEEE International Conference on Smart Instrumentation, Measurement and Applications (ICSIMA), Kuala Lumpur, Malaysia, 25 November 2014; pp. 1–5. [Google Scholar]
 - Kumar, Y.V.P.; Rajesh, A.; Yugandhar, S.; Srikanth, V. Cascaded PID controller design for heating furnace temperature control. IOSR J. 2013, 8, 76–83. [Google Scholar] [CrossRef]
 - Zhang, J.; Li, H.; Ma, K.; Xue, L.; Han, B.; Dong, Y.; Tan, Y.; Gu, C. Design of PID temperature control system based on stm32. Mater. Sci. Eng. 2018, 322, 1–10. [Google Scholar] [CrossRef]
 - Yanmei, W.; Yanzhu, Z.; Baoyu, W. The Control Research of PID in Heating-Furnace System. In Proceedings of the International Conference on Business Management and Electronic Information, Guangzhou, China, 13–15 May 2011; pp. 260–263. [Google Scholar]
 - Hambali, N.; Janin, Z.; Samsudin, N.; Ishak, A. Process Controllability for air Temperature Oven System Using Open-Loop Reformulated Tangent Method. In Proceedings of the IEEE International Conference on Smart Instrumentation Measurement and Applications, Kuala Lumpur, Malaysia, 25–27 November 2013; pp. 1–6. [Google Scholar]
 - Aktas, M.; Ceylan, İ.; Dogan, H.; Aktekeli, Z. Designing, Manufacturing and Performance Experiments of Heat Pumb Red Pepper Dryer Assisted Solar Energy. J. Therm. Sci. Technol. 2010, 30, 111–120. [Google Scholar]
 - Zheng, F.; Lu, Y.; Fu, S. Research on Temperature Control of Heating Furnace with Intelligent Proportional Integral Derivative Control Algorithm. Therm. Sci. 2020, 24, 3069–3077. [Google Scholar] [CrossRef]
 - Teng, F.; Li, H. Adaptive Fuzzy Control for the Electric Furnace. In Proceedings of the 2009 IEEE International Conference on Intelligent Computing and Intelligent Systems, Shanghai, China, 20–22 November 2009; pp. 439–443. [Google Scholar]
 - Gözde, H.; Toplamacıoglu, M.C.; Kocaarslan, İ.; Şenol, M.A. Particle Swarm Optimization Based PI- Controller Design to Load-Frequency Control of a Two Area Reheat Thermal Power System. J. Therm. Sci. Technol. 2010, 30, 13–21. [Google Scholar]
 - Han, Y.; Jinling, J.; Guangjian, C.; Xizhen, C. Temperature Control of Electric Furnace Based on Fuzzy PID. In Proceedings of the 2011 International Coriference on Electronics and Optoelectronics (ICEOE 2011), Dalian, China, 29–31 July 2011; pp. 41–44. [Google Scholar]
 - Seo, M.; Ban, J.; Cho, M.; Cho, B.; Koo, Y.; Kim, S.W. Low-Order Model Identification and Adaptive Observer Based Predictive Control for Strip Temperature of Heating Section in Annealin Furnace. IEEE Access. 2021, 9, 53720–53734. [Google Scholar] [CrossRef]
 - Budianto, A.; Pambudi, W.S.; Sumari, S.; Yulianto, A. PID Control Design for Biofuel Furnace using Arduino. Telecommun. Comput. Electron. Control (TELKOMNIKA) 2018, 16, 3016–3023. [Google Scholar] [CrossRef]
 - Cao, J.; Ye, Q.; Li, P. Resistance Furnace Temperature Control System Based on OPC and MATLAB. Meas. Control 2015, 48, 60–64. [Google Scholar] [CrossRef]
 - Gürel, A.E.; Ceylan, İ.; Yılmaz, S. Experimantal Analyses of Heat Pump and Parabolic Trough Solar Fluidized Bed Dryer. J. Therm. Sci. Technol. 2015, 35, 107–115. [Google Scholar]
 - Moon, U.; Lee, K.Y. Hybrid Algorithm with Fuzzy System and Conventional PI Control for the Temperature Control of TV Glass Furnace. IEEE Trans. Control Syst. Technol. 2003, 11, 548–554. [Google Scholar] [CrossRef]
 - Cheng, Q.; Zhang, X.; Wang, Z.; Zhou, H.; Shao, S. Simultaneous Measurement of Three-Dimensional Temperature Distributions and Radiative Properties Based on Radiation Image Processing Technology in a Gas-Fired Pilot Tubular Furnace. Heat Transf. Eng. 2014, 35, 770–779. [Google Scholar] [CrossRef]
 - Zhou, H.Z.S.; Han, D.; Sheng, F.; Zehng, G.G. Visualization of three-dimensional temperature distributions in a large-scale furnace via regularized reconstruction from radiative energy images: Numerical studies. J. Quant. Spectrosc. Radiat. Transf. 2002, 72, 361–383. [Google Scholar] [CrossRef]
 - Mancuhan, E.; Küçükada, K.; Alpman, E. Mathematical Modeling and Simulation of The Preheating Zone of a Tunnel Kiln. J. Therm. Sci. Technol. 2010, 31, 79–86. [Google Scholar]
 - Correia, D.P.; Ferra, P.; Caldeira-Pıres, A. Flame Three-Dimensional Tomography Sensor for In-Furnace Diagnostics. Proc. Combust. Inst. 2000, 28, 431–438. [Google Scholar] [CrossRef]
 - Langner, S.M.; Stonis, M.; Semrau, H.; Sauke, O.; Harchegani, L.H.; Behrens, A. Monitoring of an Aluminum Melting Furnace by Means of a 3D Light-Field Camera. In Proceedings of the 2017 IEEE International Conference on Industrial Engineering and Engineering Management (IEEM), Singapore, 10–13 December 2017; pp. 784–788. [Google Scholar]
 - Wei, Z.; Ge, H.; Wang, L.; Li, Z. 3-D Temperature Reconstruction of the Flame Field in a Tangentially Fired Furnace. IEEE Trans. Instrum. Meas. 2018, 67, 1929–1939. [Google Scholar] [CrossRef]
 - Illes, B.; Krammer, O.; Harsanyi, G.; Illyefavi-Vitez, Z.; Szabo, A. 3D Investigations of the Internal Convection Coefficient and Homogeneity in Reflow Ovens. In Proceedings of the 2007 30th International Spring Seminar on Electronics Technology (ISSE), Cluj-Napoca, Romania, 9–13 May 2007; pp. 320–325. [Google Scholar]
 - Chesof, A.; Panaudomsup, S.; Cheypoca, T. Evaluation of Explicit Model Predictive Temperature Control for On-Off Air Conditioner. In Proceedings of the 17th International Conference on Control Automation and Systems, Jeju, Republic of Korea, 18–21 October 2017; pp. 621–624. [Google Scholar]
 - Sutcliffe, H. The Principle of Reversed Lag Applied to On-Off Temperature Control. Proc. IEE Part B Electron. Commun. Eng. 1960, 107, 209–215. [Google Scholar] [CrossRef]
 - Roots, W.; Woods, J. On-Off Control of Thermal Processes. IEEE Trans. Ind. Electron. Control Instrum. 1969, 16, 136–146. [Google Scholar] [CrossRef]
 - Jie, S.; Zhengwei, L.; Xiaojiang, M. The Application of Fuzzy-PID Control in Heating Furnace Control. In Proceedings of the International Conference on E-Learning E-Business Enterprise Information Systems and E-Government, Hong Kong, China, 5–6 December 2009; pp. 237–240. [Google Scholar]
 - Bolat, E.; Erkan, K.; Postalcioglu, S. Experimental Autotuning PID Control of Temperature Using Microcontroller. In Proceedings of the The International Conference on Computer as a Tool, Belgrade, Serbia, 21–24 November 2005; pp. 266–269. [Google Scholar]
 - Lin, H.; Wei, L.; Zikun, N. Development of PID Neural Network Control System for Temperature of Resistance Furnace. In Proceedings of the International Forum on Information Technology and Applications, Chengdu, China, 15–17 May 2009; pp. 205–208. [Google Scholar]
 - Huang, S.; Xiang, H.; Leng, C.; Dai, T.; He, G. Intelligent Regulation of Temperature and Humidity in Vegetable Greenhouses Based on Single Neuron PID Algorithm. Electronics 2024, 13, 2083. [Google Scholar] [CrossRef]
 - Aeenmehr, A.; Yazdizadeh, A.; Ghazizadeh, M. Neuro-PID Control of an Industrial Furnace Temperature. In Proceedings of the Symposium on Industrial Electronics & Applications, Kuala Lumpur, Malaysia, 4–6 October 2009; pp. 768–772. [Google Scholar]
 
Disclaimer/Publisher’s Note: The statements, opinions and data contained in all publications are solely those of the individual author(s) and contributor(s) and not of MDPI and/or the editor(s). MDPI and/or the editor(s) disclaim responsibility for any injury to people or property resulting from any ideas, methods, instructions or products referred to in the content.  | 
© 2025 by the authors. Licensee MDPI, Basel, Switzerland. This article is an open access article distributed under the terms and conditions of the Creative Commons Attribution (CC BY) license (https://creativecommons.org/licenses/by/4.0/).