
Forecasting Corporate Financial Performance Using Deep Learning with Environmental, Social, and Governance Data


Abstract
1. Introduction
2. Related Literature
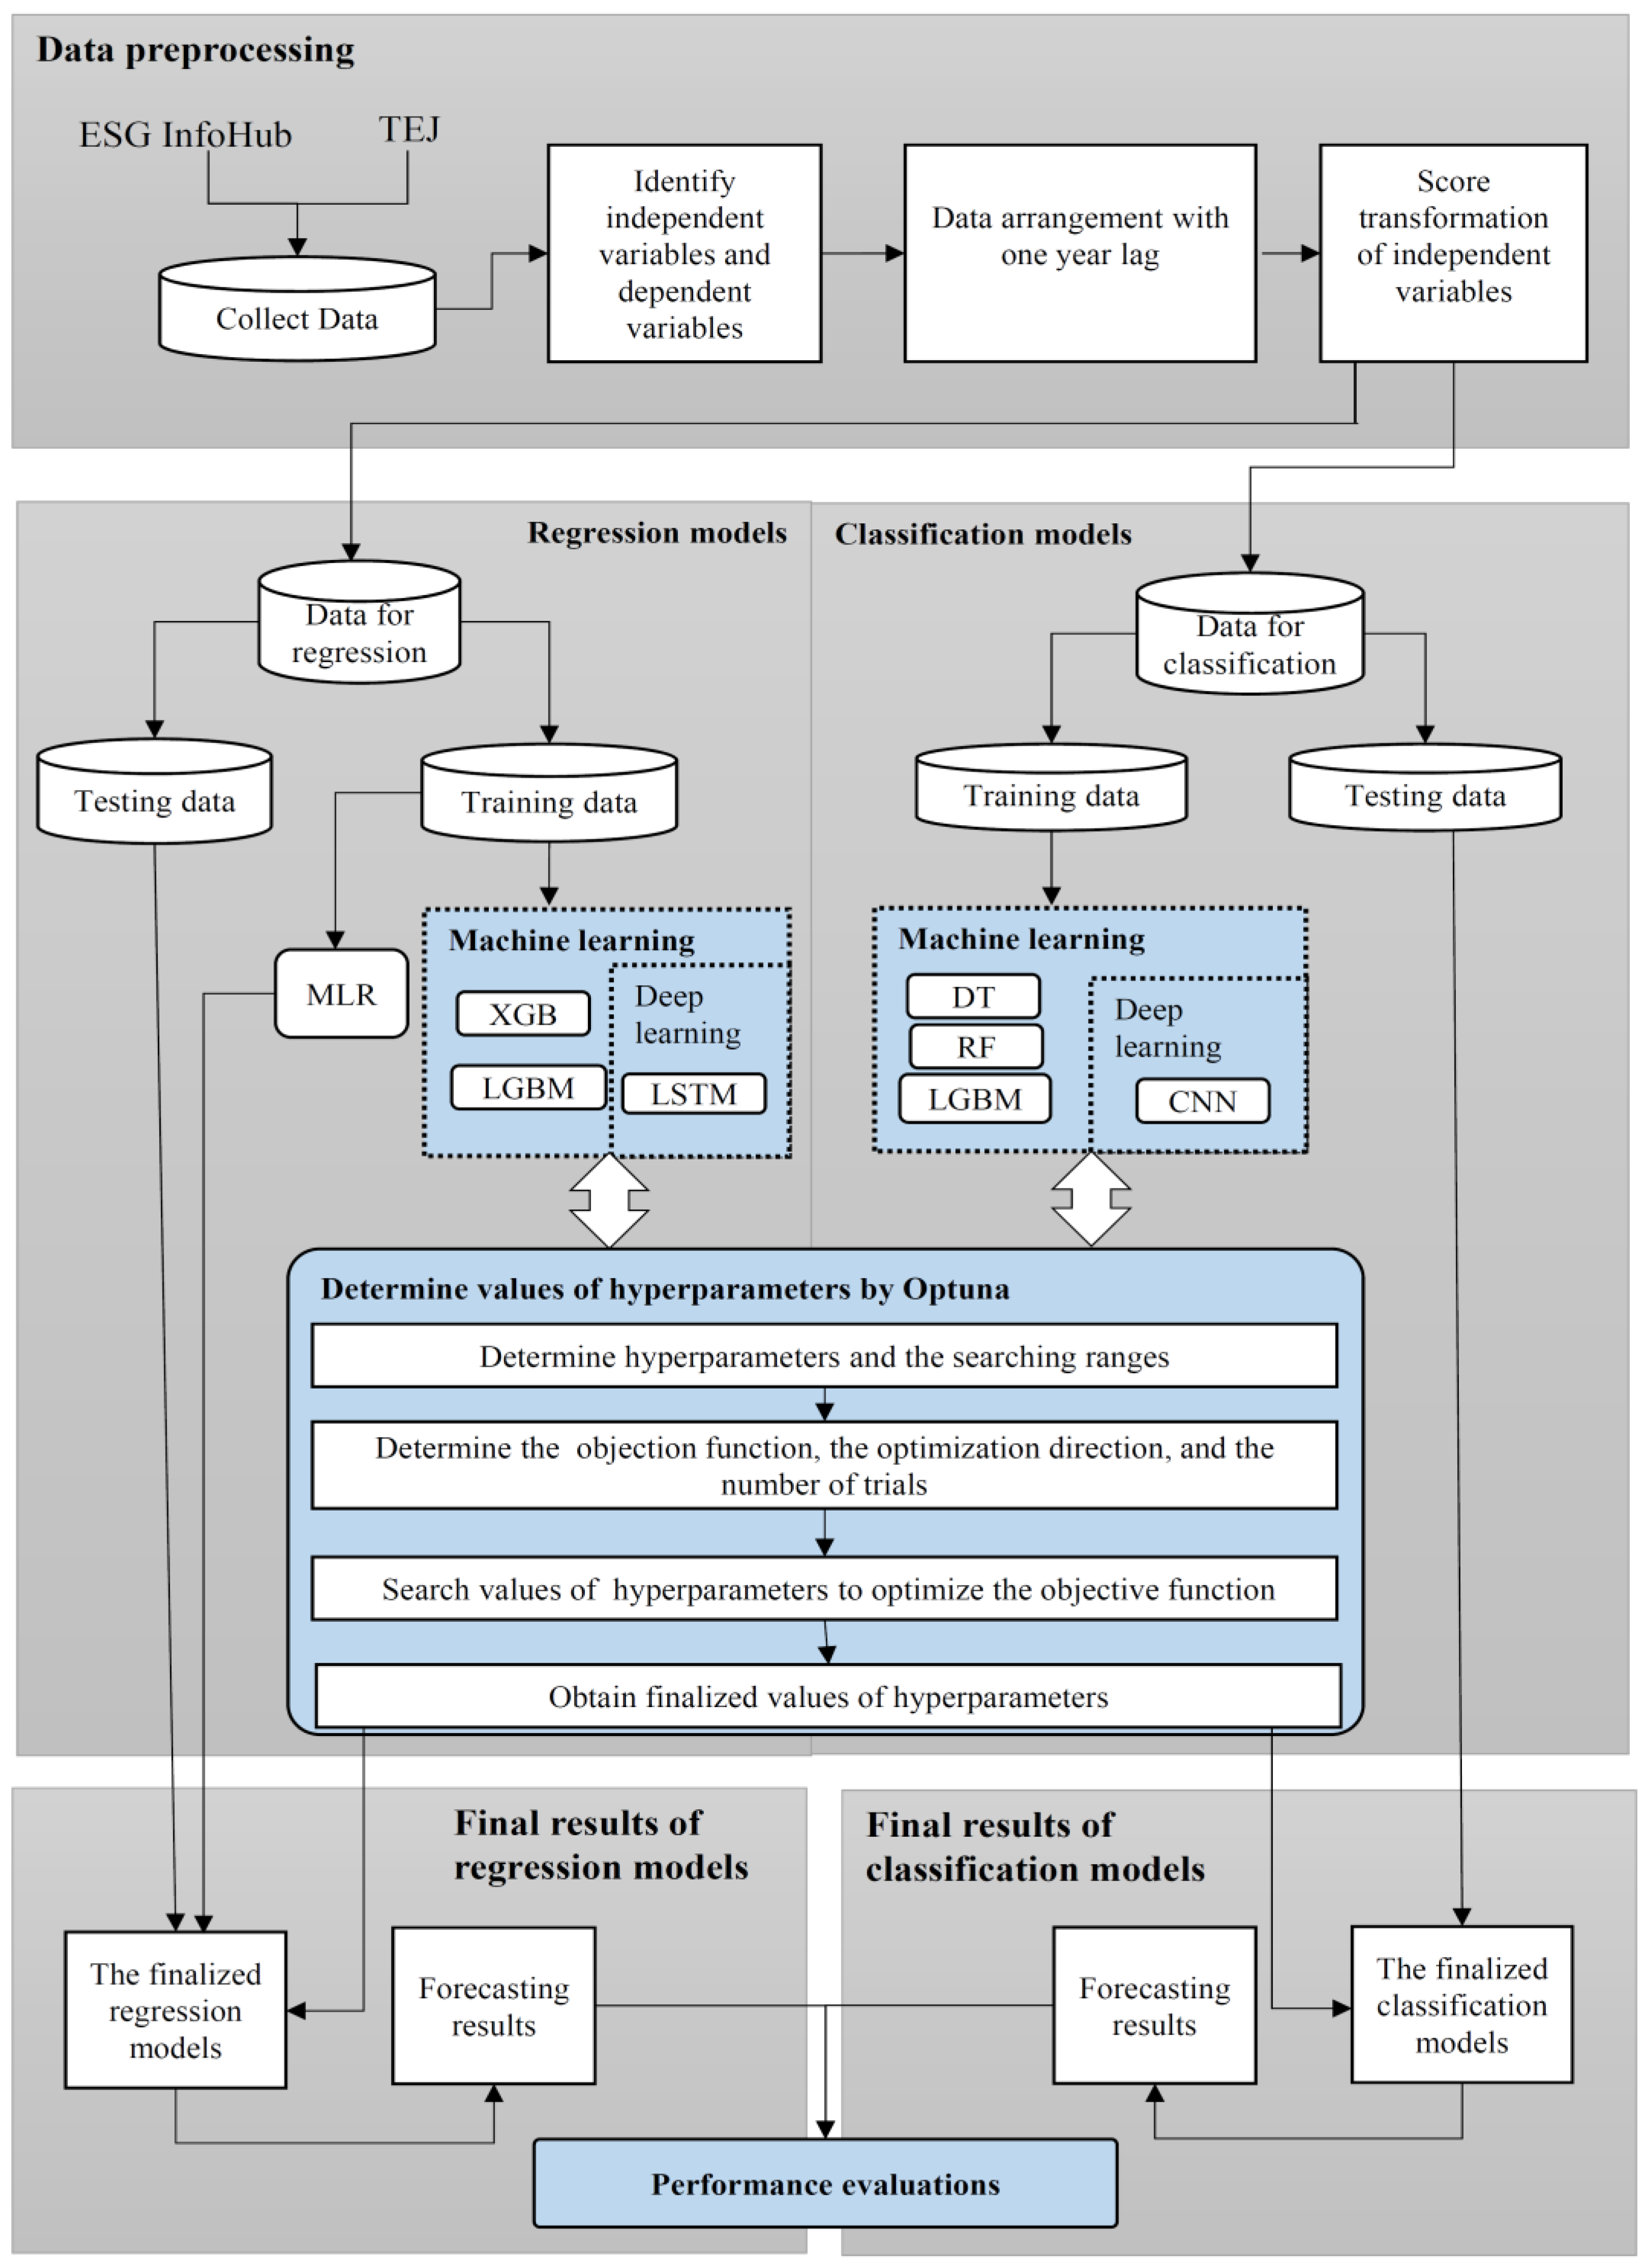
3. The Deep Learning Forecasting Architecture with Optuna in ESG Analysis
3.1. Data Preprocessing
3.1.1. Samples and Data Sources
3.1.2. Definitions of Variables
3.2. Deep Learning with Optuna
3.2.1. Long Short-Term Memory with Optuna (LSTMOPT) for Regression Model
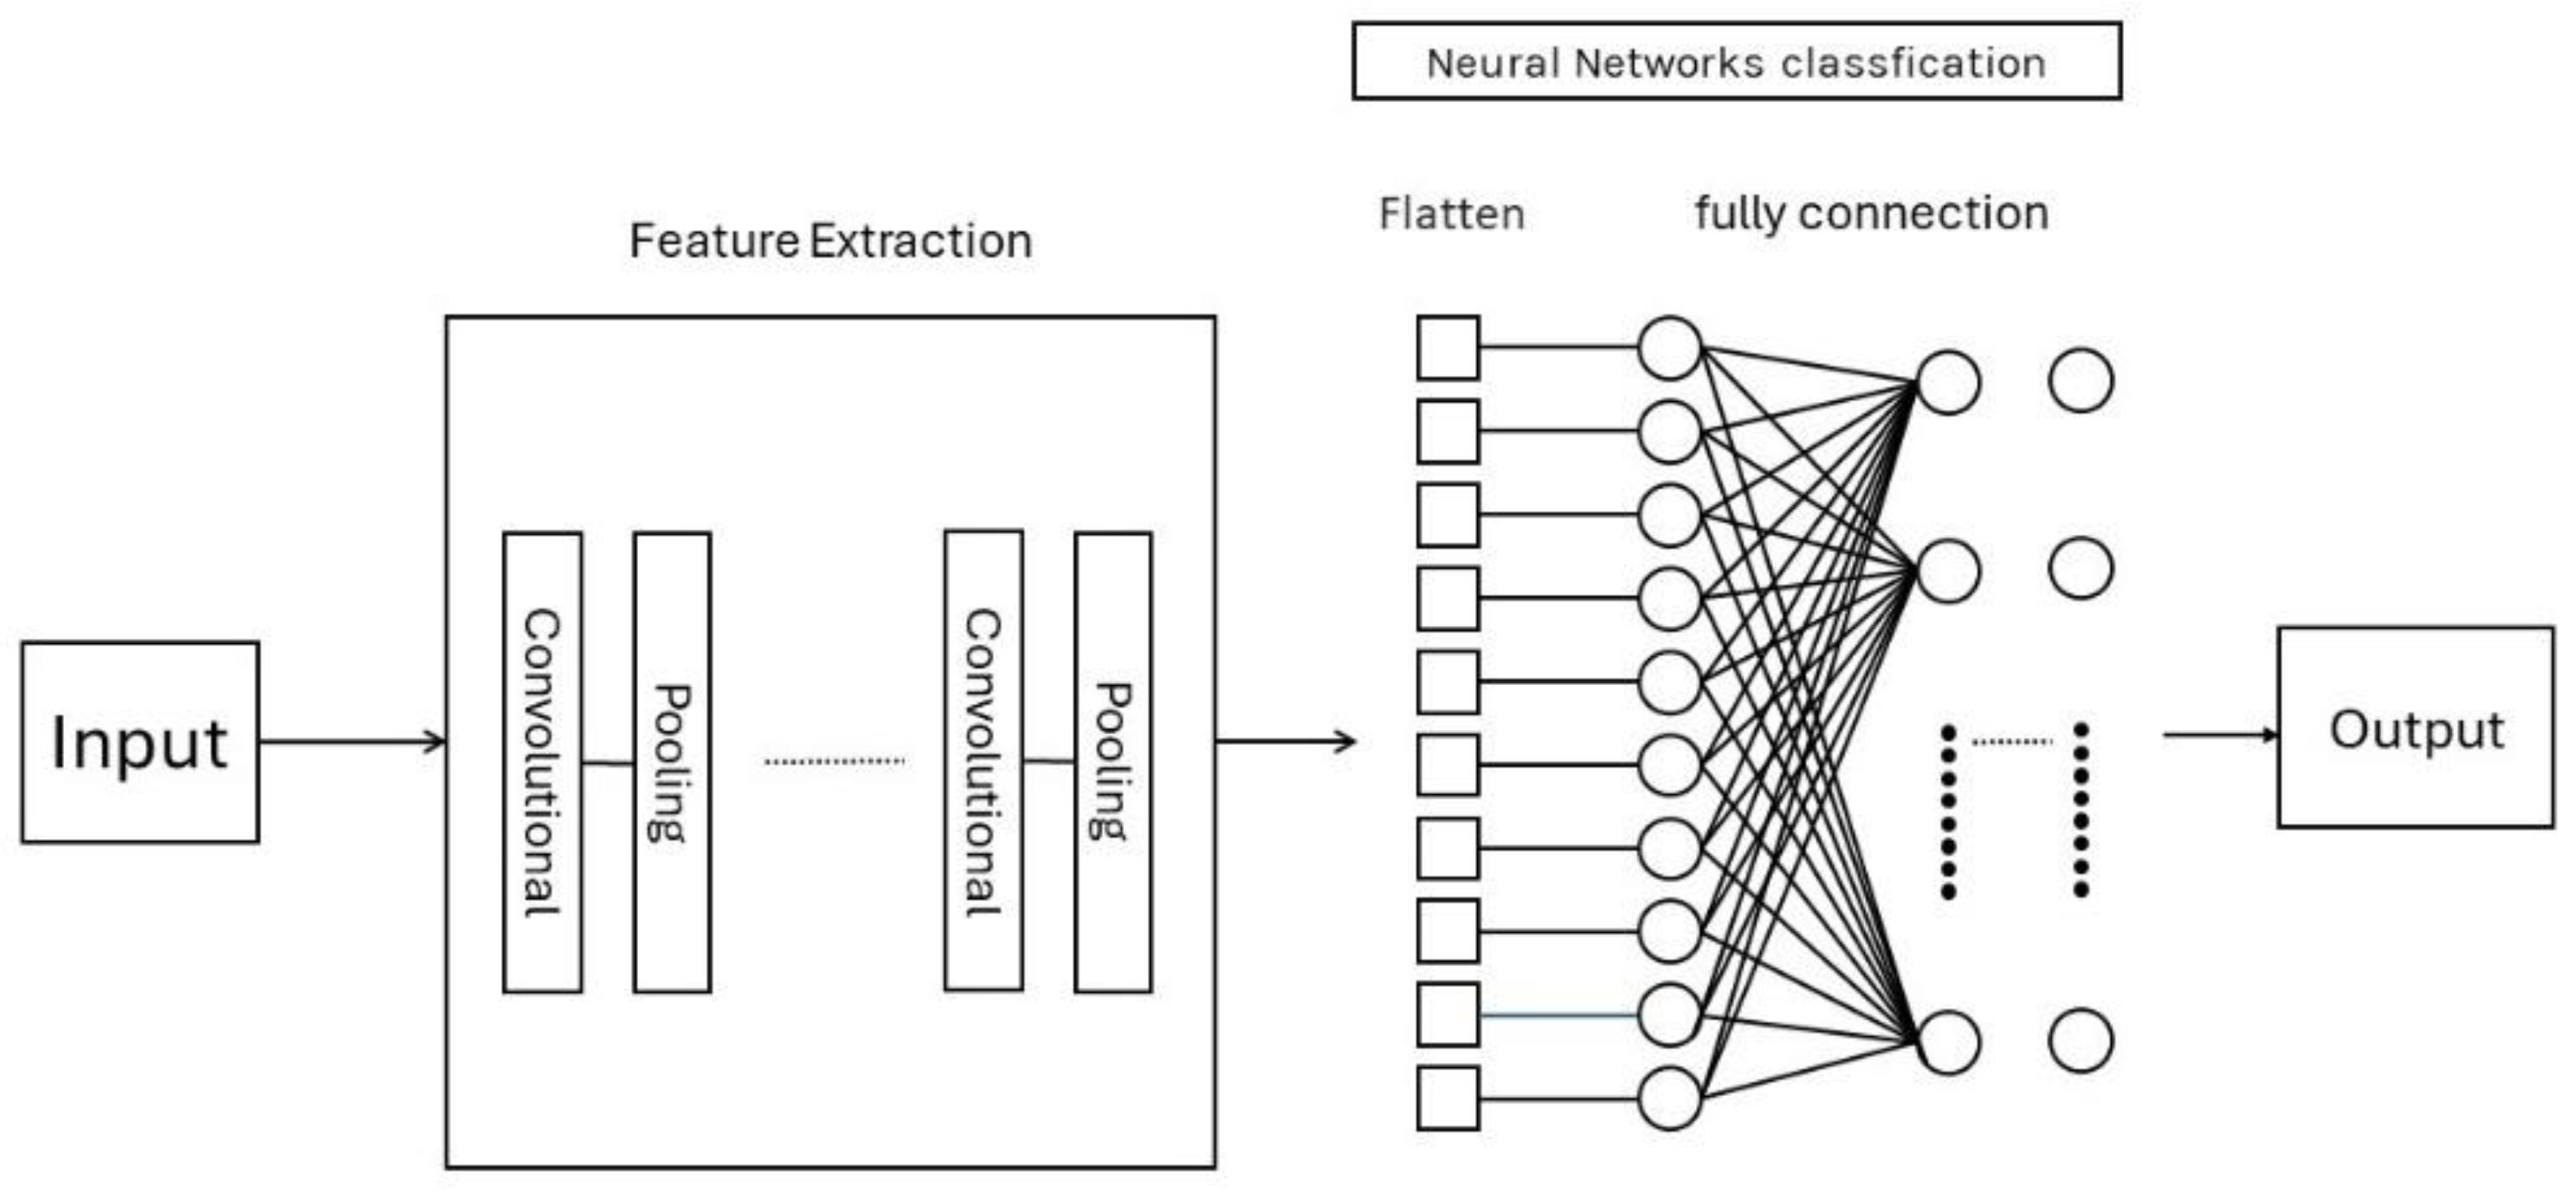
3.2.2. Convolutional Neural Network with Optuna (CNNOPT) for Classification Model
4. Results and Discussion
4.1. Numerical Results
4.2. Discussion
5. Conclusions and Future Research
Author Contributions
Funding
Data Availability Statement
Acknowledgments
Conflicts of Interest
Appendix A

| # | Abbreviation | Description |
|---|---|---|
| Sustainability and Corporate Responsibility | ||
| 1 | CSR | Corporate Social Responsibility |
| 2 | ESG | Environmental, Social, and Governance |
| 3 | CFP | Corporate Financial Performance |
| 4 | CSP | Corporate Social Performance |
| 5 | GRI | Global Reporting Initiative |
| 6 | SASB | Sustainability Accounting Standards Board |
| 7 | TCFD | Task Force on Climate-related Financial Disclosures |
| Financial and Economic Metrics | ||
| 1 | ROA | Return on Assets |
| 2 | ROE | Return on Equity |
| 3 | EBIT | Earnings Before Interest and Taxes |
| Data and Market Terms | ||
| 1 | TSEC | Taiwan Stock Exchange Corporation |
| 2 | OTC | Over the Counter |
| 3 | TEJ | Taiwan Economic Journal |
| Statistical, Machine Learning and Deep Learning Models | ||
| 1 | MLR | Multiple Linear Regression |
| 2 | RR | Ridge Regression |
| 3 | LR | Logistic Regression |
| 4 | NB | Naive Bayesian |
| 5 | ML | Machine Learning |
| 6 | DL | Deep Learning |
| 7 | SVR | Support Vector Regression |
| 8 | SVM | Support Vector Machine |
| 9 | DT | Decision Tree |
| 10 | RF | Random Forest |
| 11 | XGB | Extreme Gradient Boosting |
| 12 | LGBM | Light Gradient Boosting Machine |
| 13 | KNN | K Nearest Neighbor |
| 14 | MLP | Multi-layer Perceptron |
| 15 | ANN | Artificial Neural Network |
| 16 | RNN | Recurrent Neural Network |
| 17 | LSTM | Long Short-Term Memory |
| 18 | CNN | Convolutional Neural Network |
| 19 | XAI | Explainable Artificial Intelligence |
| 20 | 1D-CNN | One-Dimensional Convolutional Neural Network |
| Optimized Models | ||
| 1 | LSTMOPT | Long Short-Term Memory with Optuna |
| 2 | CNNOPT | Convolutional Neural Network with Optuna |
| 3 | R_XGBOPT | Extreme Gradient Boosting optimized with Optuna for Regression |
| 4 | R_LGBMOPT | Light Gradient Boosting Machine optimized with Optuna for Regression |
| 5 | C_DTOPT | Decision Tree optimized with Optuna for Classification |
| 6 | C_RFOPT | Random Forest optimized with Optuna for Classification |
| 7 | C_LGBMOPT | Light Gradient Boosting Machine optimized with Optuna for Classification |
| Evaluation Metrics | ||
| 1 | RMSE | Root Mean Square Error |
| 2 | MAE | Mean Absolute Error |
| 3 | R2 | Coefficient of Determination |
References
- Friedman, M. The social responsibility of business is to increase its profits. The New York Times Magazine, 13 September 1970; pp. 32–33, 122–124. [Google Scholar]
- Sheldon, O. The Philosophy of Management; Kenneth Thompson: London, UK, 1923. [Google Scholar]
- Bowen, H.R. Social Responsibilities of the Businessman; Harper and Brothers: New York, NY, USA, 1953. [Google Scholar]
- Carroll, A.B. The pyramid of corporate social responsibility: Toward the moral management of organizational stakeholders. Bus. Horiz. 1991, 34, 39–48. [Google Scholar] [CrossRef]
- Elkington, J. Cannibals with Forks: The Triple Bottom Line of 21st Century Business; Capstone Publishing: Oxford, UK, 1997. [Google Scholar]
- Porter, M.E.; Kramer, M.R. Strategy and society: The link between competitive advantage and corporate social responsibility. Harv. Bus. Rev. 2006, 84, 78–92. [Google Scholar] [PubMed]
- Waddock, S.A.; Graves, S.B. The corporate social performance–financial performance link. Strateg. Manag. J. 1997, 18, 303–319. [Google Scholar] [CrossRef]
- Fatemi, A.; Glaum, M.; Kaiser, S. Esg performance and firm value: The moderating role of disclosure. Glob. Financ. J. 2018, 38, 45–64. [Google Scholar] [CrossRef]
- Ramić, H. Relationship Between Esg Performance and Financial Performance of Companies: An Overview of the Issue. Master’s Thesis, University of Lausanne, Lausanne, Switzerland, 2019. [Google Scholar]
- Xie, J.; Nozawa, W.; Yagi, M.; Fujii, H.; Managi, S. Do environmental, social, and governance activities improve corporate financial performance? Bus. Strategy Environ. 2019, 28, 286–300. [Google Scholar] [CrossRef]
- Alareeni, B.A.; Hamdan, A. Esg impact on performance of us s&p 500-listed firms. Corp. Gov. Int. J. Bus. Soc. 2020, 20, 1409–1428. [Google Scholar]
- Ahmad, N.; Mobarek, A.; Roni, N.N. Revisiting the impact of esg on financial performance of ftse350 uk firms: Static and dynamic panel data analysis. Cogent Bus. Manag. 2021, 8, 1900500. [Google Scholar] [CrossRef]
- Ding, W.; Levine, R.; Lin, C.; Xie, W. Corporate immunity to the COVID-19 pandemic. J. Financ. Econ. 2021, 141, 802–830. [Google Scholar] [CrossRef]
- Mohammad, W.M.W.; Wasiuzzaman, S. Environmental, social and governance (esg) disclosure, competitive advantage and performance of firms in malaysia. Clean. Environ. Syst. 2021, 2, 100015. [Google Scholar] [CrossRef]
- Chen, S.; Song, Y.; Gao, P. Environmental, social, and governance (esg) performance and financial outcomes: Analyzing the impact of esg on financial performance. J. Environ. Manag. 2023, 345, 118829. [Google Scholar] [CrossRef] [PubMed]
- Ismail, A.M.; Azman, K.B.B. The impact of environmental, social, and governance performance on financial performance: Evidence from japanese companies. Edelweiss Appl. Sci. Technol. 2024, 8, 236–258. [Google Scholar] [CrossRef]
- Xu, Y.; Zhu, N. The effect of environmental, social, and governance (esg) performance on corporate financial performance in china: Based on the perspective of innovation and financial constraints. Sustainability 2024, 16, 3329. [Google Scholar] [CrossRef]
- Vance, S.G. Are socially responsible corporations good investment risks? Manag. Rev. 1975, 64, 18. [Google Scholar]
- Hillman, A.J.; Keim, G.D. Shareholder value, stakeholder management, and social issues: What’s the bottom line? Strateg. Manag. J. 2001, 22, 125–139. [Google Scholar] [CrossRef]
- Liao, P.-C.; Shih, Y.-N.; Wu, C.-L.; Zhang, X.-L.; Wang, Y. Does corporate social performance pay back quickly? A longitudinal content analysis on international contractors. J. Clean. Prod. 2018, 170, 1328–1337. [Google Scholar] [CrossRef]
- Duque-Grisales, E.; Aguilera-Caracuel, J. Environmental, social and governance (esg) scores and financial performance of multilatinas: Moderating effects of geographic international diversification and financial slack. J. Bus. Ethics 2021, 168, 315–334. [Google Scholar] [CrossRef]
- Ruan, L.; Liu, H. Environmental, social, governance activities and firm performance: Evidence from china. Sustainability 2021, 13, 767. [Google Scholar] [CrossRef]
- Zahid, R.A.; Khan, M.K.; Anwar, W.; Maqsood, U.S. The role of audit quality in the esg-corporate financial performance nexus: Empirical evidence from western european companies. Borsa Istanb. Rev. 2022, 22, S200–S212. [Google Scholar] [CrossRef]
- Nareswari, N.; Tarczyńska-Łuniewska, M.; Al Hashfi, R.U. Analysis of environmental, social, and governance performance in indonesia: Role of esg on corporate performance. Procedia Comput. Sci. 2023, 225, 1748–1756. [Google Scholar] [CrossRef]
- McGuire, J.B.; Sundgren, A.; Schneeweis, T. Corporate social responsibility and firm financial performance. Acad. Manag. J. 1988, 31, 854–872. [Google Scholar] [CrossRef]
- Mahoney, L.; Roberts, R.W. Corporate social performance, financial performance and institutional ownership in canadian firms. Account. Forum 2007, 31, 233–253. [Google Scholar] [CrossRef]
- Kang, K.H.; Lee, S.; Huh, C. Impacts of positive and negative corporate social responsibility activities on company performance in the hospitality industry. Int. J. Hosp. Manag. 2010, 29, 72–82. [Google Scholar] [CrossRef]
- Velte, P. Does esg performance have an impact on financial performance? Evidence from germany. J. Glob. Responsib. 2017, 8, 169–178. [Google Scholar] [CrossRef]
- Atan, R.; Alam, M.M.; Said, J.; Zamri, M. The impacts of environmental, social, and governance factors on firm performance: Panel study of malaysian companies. Manag. Environ. Qual. Int. J. 2018, 29, 182–194. [Google Scholar] [CrossRef]
- Goukasian, L.; Whitney, L.K. Corporate Socially Responsible Firms Perform Well! Evidence from Financial and Operating Performances. SSRN: 2019. Available online: https://papers.ssrn.com/sol3/papers.cfm?abstract_id=972649 (accessed on 11 January 2025).
- Lopez-de-Silanes, F.; McCahery, J.A.; Pudschedl, P.C. Esg performance and disclosure: A cross-country analysis. Singap. J. Leg. Stud. 2020, 217–241. [Google Scholar]
- Kalia, D.; Aggarwal, D. Examining impact of esg score on financial performance of healthcare companies. J. Glob. Responsib. 2023, 14, 155–176. [Google Scholar] [CrossRef]
- Narula, R.; Rao, P.; Kumar, S.; Matta, R. Esg scores and firm performance-evidence from emerging market. Int. Rev. Econ. Financ. 2024, 89, 1170–1184. [Google Scholar] [CrossRef]
- Biju, A.K.V.N.; Thomas, A.S.; Thasneem, J. Examining the research taxonomy of artificial intelligence, deep learning & machine learning in the financial sphere—A bibliometric analysis. Qual. Quant. 2024, 58, 849–878. [Google Scholar]
- Lim, T. Environmental, social, and governance (esg) and artificial intelligence in finance: State-of-the-art and research takeaways. Artif. Intell. Rev. 2024, 57, 76. [Google Scholar] [CrossRef]
- Zhang, C.; Yang, J. Artificial intelligence and corporate esg performance. Int. Rev. Econ. Financ. 2024, 96, 103713. [Google Scholar] [CrossRef]
- Teoh, T.-T.; Heng, Q.; Chia, J.J.; Shie, J.; Liaw, S.; Yang, M.; Nguwi, Y.-Y. Machine learning-based corporate social responsibility prediction. In Proceedings of the 2019 IEEE International Conference on Cybernetics and Intelligent Systems (CIS) and IEEE Conference on Robotics, Automation and Mechatronics (RAM), Bangkok, Thailand, 18–20 November 2019; IEEE: New York, NY, USA, 2019; pp. 501–505. [Google Scholar]
- De Lucia, C.; Pazienza, P.; Bartlett, M. Does good esg lead to better financial performances by firms? Machine learning and logistic regression models of public enterprises in europe. Sustainability 2020, 12, 5317. [Google Scholar] [CrossRef]
- Lachuer, J.; Jabeur, S.B. Explainable artificial intelligence modeling for corporate social responsibility and financial performance. J. Asset Manag. 2022, 23, 619. [Google Scholar] [CrossRef]
- Chowdhury, M.A.F.; Abdullah, M.; Azad, M.A.K.; Sulong, Z.; Islam, M.N. Environmental, social and governance (esg) rating prediction using machine learning approaches. Ann. Oper. Res. 2023, 1–25. [Google Scholar] [CrossRef]
- D’Amato, V.; D’Ecclesia, R.; Levantesi, S. Firms’ profitability and esg score: A machine learning approach. Appl. Stoch. Models Bus. Ind. 2024, 40, 243–261. [Google Scholar] [CrossRef]
- Han, S.; Liu, Z.; Deng, Z.; Gupta, S.; Mikalef, P. Exploring the effect of digital csr communication on firm performance: A deep learning approach. Decis. Support Syst. 2024, 176, 114047. [Google Scholar] [CrossRef]
- Liang, L.; Liu, B.; Su, Z.; Cai, X. Forecasting corporate financial performance with deep learning and interpretable ale method: Evidence from China. J. Forecast. 2024, 43, 2540–2571. [Google Scholar] [CrossRef]
- Lee, H.; Kim, J.H.; Jung, H.S. Deep-learning-based stock market prediction incorporating esg sentiment and technical indicators. Sci. Rep. 2024, 14, 10262. [Google Scholar] [CrossRef] [PubMed]
- Jin, Y. Distinctive impacts of esg pillars on corporate financial performance: A random forest analysis of korean listed firms. Financ. Res. Lett. 2025, 71, 106395. [Google Scholar] [CrossRef]
- Taiwan Stock Exchange Esg Infohub Website. Available online: https://esg.twse.com.tw/ESG/front/tw/#/main/home (accessed on 17 March 2024).
- Tej (Taiwan Economic Journal). Available online: https://schplus.tej.com.tw/ (accessed on 17 March 2024).
- Margolis, J.D.; Walsh, J.P. People and Profits? The Search for a Link Between a Company’s Social and Financial Performance; Lawrence Erlbaum Associates: Mahwah, NY, USA, 2001. [Google Scholar]
- Shu, P.-G.; Chiang, S.-J. The impact of corporate governance on corporate social performance: Cases from listed firms in taiwan. Pac. -Basin Financ. J. 2020, 61, 101332. [Google Scholar] [CrossRef]
- Akiba, T.; Sano, S.; Yanase, T.; Ohta, T.; Koyama, M. Optuna: A next-generation hyperparameter optimization framework. In Proceedings of the 25th ACM SIGKDD International Conference on Knowledge Discovery & Data Mining, Anchorage, AK, USA, 4–8 August 2019; pp. 2623–2631. [Google Scholar]
- Hochreiter, S.; Schmidhuber, J. Long short-term memory. Neural Comput. 1997, 9, 1735–1780. [Google Scholar] [CrossRef]
- You, Y. Forecasting stock price: A deep learning approach with lstm and hyperparameter optimization. Highlights Sci. Eng. Technol. 2024, 85, 328–338. [Google Scholar] [CrossRef]
- Yildirim, B.; Taskiran, M. Optuna based optimized transformer model approach in bitcoin time series analysis. In Proceedings of the 2024 26th International Conference on Digital Signal Processing and its Applications (DSPA), Moscow, Russia, 27–29 March 2024; IEEE: New York, NY, USA, 2024; pp. 1–6. [Google Scholar]
- Maharani, S.N.; Sugeng, B.; Makaryanawati, M.; Ali, M.M. Bank soundness level prediction: Anfis vs. deep learning. J. Appl. Data Sci. 2023, 4, 175–189. [Google Scholar] [CrossRef]
- Tang, W.; Yang, S.; Khishe, M. Profit prediction optimization using financial accounting information system by optimized dlstm. Heliyon 2023, 9, e19431. [Google Scholar] [CrossRef] [PubMed]
- Chollete, L.; Hughen, K.; Lu, C.-C.; Peng, W. Assessing the volatility of green firms. Financ. Res. Lett. 2024, 64, 105372. [Google Scholar] [CrossRef]
- Dey, D. Time series analysis of gss bonds. Br. Actuar. J. 2024, 29, e3. [Google Scholar] [CrossRef]
- LeCun, Y.; Boser, B.; Denker, J.S.; Henderson, D.; Howard, R.E.; Hubbard, W.; Jackel, L.D. Backpropagation applied to handwritten zip code recognition. Neural Comput. 1989, 1, 541–551. [Google Scholar] [CrossRef]
- Lai, C.-J.; Pai, P.-F.; Marvin, M.; Hung, H.-H.; Wang, S.-H.; Chen, D.-N. The use of convolutional neural networks and digital camera images in cataract detection. Electronics 2022, 11, 887. [Google Scholar] [CrossRef]
- Khan, A.; Sohail, A.; Zahoora, U.; Qureshi, A.S. A survey of the recent architectures of deep convolutional neural networks. Artif. Intell. Rev. 2020, 53, 5455–5516. [Google Scholar] [CrossRef]
- Alzubaidi, L.; Zhang, J.; Humaidi, A.J.; Al-Dujaili, A.; Duan, Y.; Al-Shamma, O.; Santamaría, J.; Fadhel, M.A.; Al-Amidie, M.; Farhan, L. Review of deep learning: Concepts, cnn architectures, challenges, applications, future directions. J. Big Data 2021, 8, 53. [Google Scholar] [CrossRef]
- Bhatt, D.; Patel, C.; Talsania, H.; Patel, J.; Vaghela, R.; Pandya, S.; Modi, K.; Ghayvat, H. Cnn variants for computer vision: History, architecture, application, challenges and future scope. Electronics 2021, 10, 2470. [Google Scholar] [CrossRef]
- Tavera Rodríguez, J.W. Towards a predictive model that supports the achievement of more assertive commercial kpis case: Wood trading company. In Proceedings of the Colombian Conference on Computing 2023, Medellin, Colombia, 10–11 August 2023; Springer: Berlin/Heidelberg, Germany, 2023; pp. 350–366. [Google Scholar]
- Jun, S.Y.; Kim, D.S.; Jung, S.Y.; Jun, S.G.; Kim, J.W. Stock investment strategy combining earnings power index and machine learning. Int. J. Account. Inf. Syst. 2022, 47, 100576. [Google Scholar] [CrossRef]
- Kong, L.; Zheng, G.; Brintrup, A. A federated machine learning approach for order-level risk prediction in supply chain financing. Int. J. Prod. Econ. 2024, 268, 109095. [Google Scholar] [CrossRef]
- Kanaparthi, V. Transformational application of artificial intelligence and machine learning in financial technologies and financial services: A bibliometric review. arXiv 2024, arXiv:2401.15710. [Google Scholar] [CrossRef]
- Gogineni, A.; Rout, M.D.; Shubham, K. Evaluating machine learning algorithms for predicting compressive strength of concrete with mineral admixture using long short-term memory (lstm) technique. Asian J. Civ. Eng. 2024, 25, 1921–1933. [Google Scholar] [CrossRef]
- Huang, S.; Liu, Q.; Wu, Y.; Chen, M.; Yin, H.; Zhao, J. Edible mushroom greenhouse environment prediction model based on attention cnn-lstm. Agronomy 2024, 14, 473. [Google Scholar] [CrossRef]
- Shi, X.; Chen, S.; Wang, Q.; Lu, Y.; Ren, S.; Huang, J. Mechanical framework for geopolymer gels construction: An optimized lstm technique to predict compressive strength of fly ash-based geopolymer gels concrete. Gels 2024, 10, 148. [Google Scholar] [CrossRef] [PubMed]
- Utama, A.B.P.; Wibawa, A.P.; Handayani, A.N.; Irianto, W.S.G.; Nyoto, A. Improving time-series forecasting performance using imputation techniques in deep learning. In Proceedings of the 2024 International Conference on Smart Computing, IoT and Machine Learning (SIML), Surakarta, Indonesia, 6–7 June 2024; IEEE: New York, NY, USA, 2024; pp. 232–238. [Google Scholar]

| Methods | Authors |
|---|---|
| Regression analysis | Waddock and Graves [7], Ramić [9], Ding et al. [13], Mohammad and Wasiuzzaman [14], Ismail and Azman [16], Xu and Zhu [17], Vance [18], Hillman and Keim [19], Liao et al. [20], Duque-Grisales and Aguilera-Caracuel [21], Zahid et al. [23], Atan et al. [29], Goukasian and Whitney [30], Lopez-de-Silanes et al. [31] |
| Two-stage least squares (2sls) regression analysis | Fatemi et al. [8] |
| Data envelopment analysis and regression analysis | Xie et al. [10] |
| Panel data regression | Alareeni and Hamdan [11], Mahoney and Roberts [26] |
| Random effects GLS regression | Ahmad et al. [12] |
| Multiple regression and categorized regression | Chen et al. [15] |
| Univariate analysis and OLS regression | Ruan and Liu [22] |
| Modified Sharpe ratio and panel data regression | Nareswari et al. [24] |
| Pooled linear regression | Kang et al. [27] |
| Correlation and regression analysis | Velte [28], Kalia and Aggarwal [32], McGuire et al. [25] |
| Independent t-test, Pearson correlation coefficients, and hierarchical regression | Narula et al. [33] |
| SVM, RF, NB, MLP, and LSTM | Teoh et al. [37] |
| RF, SVR, KNN, ANN, RR, and LR | De Lucia et al. [38] |
| XAI | Lachuer and Jabeur [39] |
| ANN, Bagging, KNN, NB, RF, SVM | Chowdhury et al. [40] |
| ML interpretability toolboxes | D’Amato et al. [41] |
| Cutting-edge deep learning-based NLP models | Han et al. [42] |
| 1D-CNN and LSTM | Liang et al. [43] |
| Bi-LSTM and Bi-RNN | Lee et al. [44] |
| RF | Jin [45] |
| The Category of Industry | The Number of Companies | The Category of Industry | The Number of Companies |
|---|---|---|---|
| Chemical industry | 5 | Communication network industry | 8 |
| Cement industry | 2 | Paper industry | 4 |
| Semiconductor industry | 23 | Retail trade industry | 1 |
| Biotechnology and medical industry | 4 | Plastic industry | 5 |
| Optoelectronics industry | 10 | Information services industry | 1 |
| Auto industry | 6 | Sports and leisure industry | 6 |
| Other industry | 2 | Electronic distribution industry | 4 |
| Other electronic industry | 10 | Electronic components industry | 15 |
| Green energy and environmental protection industry | 1 | Computer and peripheral equipment industry | 16 |
| Finance and insurance industry | 16 | Electric machinery industry | 7 |
| Building materials construction | 2 | Oil, electricity and gas industry | 1 |
| Food industry | 3 | Rubber industry | 2 |
| Textile fiber industry | 10 | Iron industry | 8 |
| Shipping business | 7 | Total | 179 |
| Dimensions | Variable# | Targets and Features |
|---|---|---|
| CFP | Y1 | ROA |
| Y2 | ROE | |
| Environmental | X1 | GHG Scope 1 Emissions |
| X2 | GHG Scope 2 Emissions | |
| X3 | Renewable Energy Percentage | |
| X4 | Water Consumption | |
| X5 | Waste Management | |
| Social | X6 | The Ratio of Female Executive |
| X7 | Number of Occupational Accidents | |
| X8 | Annual Trend of Employee Salary | |
| X9 | Salary of Full-Time Non-Executive Employees | |
| X10 | Average Expense of Employee Benefits | |
| Governance | X11 | The Ratio of Independent Directors vs. Directors |
| X12 | The Ratio of Female Directors | |
| X13 | Attendance of the Board of Directors | |
| X14 | The Ratio of Directors Meeting Directions for Continuing Education | |
| X15 | Number of Investor Conferences |
| Methods | Hyperparameters | Types | Search Ranges |
|---|---|---|---|
| R_XGBOPT | lambda | Real numbers | 0.00001, 10 |
| alpha | Real numbers | 0.00001, 10 | |
| colsample_bytree | Real numbers | 0.2, 0.6 | |
| subsample | Real numbers | 0.4, 0.8 | |
| learning_rate | Real numbers | 0.0001, 0.2 | |
| n_estimators | Integers | 50, 10000 | |
| max_depth | Integers | 2, 12 | |
| min_child_weight | Integers | 1, 300 | |
| R_LGBMOPT | feature_fraction | Real numbers | 0.01, 1.0 + EPS |
| subsample | Real numbers | 0.01, 1.0 | |
| learning_rate | Real numbers | 0.001, 0.1 | |
| max_depth | Integers | 2, 12 | |
| num_leaves | Integers | 2, 2048 | |
| n_estimators | Integers | 100, 1000 | |
| min_data_in_leaf | Real numbers | 1, 100 | |
| lambda_l1 | Real numbers | 1 × 10⁻⁸, 10.0 | |
| lambda_l2 | Real numbers | 1 × 10⁻⁸, 10.0 | |
| min_gain_to_split | Real numbers | 0, 15 | |
| bagging_fraction | Real numbers | 0.3, 1.0 + EPS | |
| bagging_freq | Integers | 1, 7 | |
| extra_trees | Categorical | True, False | |
| LSTMOPT | optimizer | Categorical | Adam, Adagrad, Adamax, Nadam, RMSprop, SGD |
| units | Integers | 50, 1000 | |
| epochs | Integers | 100, 500 | |
| batch_size | Categorical | 16, 32, 64, 128, 256, 512 | |
| dropout_rate | Real numbers | 0.1, 0.6 | |
| learning_rate | Real numbers | 1 × 10⁻³, 1 × 10⁻¹ |
| Methods | Hyperparameters | Types | Search Ranges |
|---|---|---|---|
| C_DTOPT | criterion | Categorical | ‘gini’, ‘entropy’ |
| splitter | Categorical | ‘best’, ‘random’ | |
| max_depth | Integers | 1, 10 | |
| min_samples_split | Integers | 2, 20 | |
| min_samples_leaf | Integers | 1, 10 | |
| max_features | Real numbers | 0.1, 1.0 | |
| C_RFOPT | n_estimators | Integers | 10, 1000 |
| criterion | Categorical | ‘gini’, ‘entropy’ | |
| max_depth | Integers | 1, 24 | |
| min_samples_split | Integers | 2, 20 | |
| min_samples_leaf | Integers | 1, 10 | |
| max_features | Real numbers | 0.1, 1.0 | |
| C_LGBMOPT | boosting_type | Categorical | ‘gbdt’, ‘dart’, ‘goss’ |
| num_leaves | Integers | 10, 200 | |
| learning_rate | Real numbers | 0.01, 0.5 | |
| max_depth | Integers | 1, 20 | |
| min_child_samples | Integers | 1, 20 | |
| subsample | Real numbers | 0.1, 1 | |
| colsample_bytree | Real numbers | 0.1, 1 | |
| reg_alpha | Real numbers | 1 × 10⁻⁸, 100.0 | |
| reg_lambda | Real numbers | 1 × 10⁻⁸, 100.0 | |
| CNNOPT | lr | Real numbers | 1 × 10⁻⁵, 1 × 10⁻¹ |
| batch_size | Integers | 2100 | |
| optimizer | Categorical | ‘sgd’, ‘adam’, ‘rmsprop’ | |
| filters_1 | Categorical | 16, 32, 64, 128 | |
| filters_2 | Categorical | 16, 32, 64, 128 |
| Methods | Hyperparameters | ROA | ROE |
|---|---|---|---|
| R_XGBOPT | lambda | 4.1888 × 10⁻³ | 1.0633 × 10⁻⁵ |
| alpha | 6.4829 × 10⁻⁴ | 4.1196 × 10⁻⁴ | |
| colsample_bytree | 3.8271 × 10⁻¹ | 3.3269 × 10⁻¹ | |
| subsample | 7.0626 × 10⁻¹ | 5.5720 × 10⁻¹ | |
| learning_rate | 8.5336 × 10⁻² | 1.5310 × 10⁻¹ | |
| n_estimators | 2228 | 4405 | |
| max_depth | 10 | 12 | |
| min_child_weight | 18 | 12 | |
| R_LGBMOPT | feature_fraction | 5.3813 × 10⁻² | 7.1434 × 10⁻¹ |
| subsample | 6.8759 × 10⁻¹ | 5.2976 × 10⁻¹ | |
| learning_rate | 7.0864 × 10⁻² | 7.1328 × 10⁻² | |
| max_depth | 2 | 11 | |
| num_leaves | 1700 | 1056 | |
| n_estimators | 570 | 935 | |
| min_data_in_leaf | 17 | 37 | |
| lambda_l1 | 1.4513 × 10⁻⁷ | 1.3802 × 10⁻⁴ | |
| lambda_l2 | 1.1461 × 10⁻⁷ | 6.1407 × 10⁻⁸ | |
| min_gain_to_split | 6.1928 | 2.8318 | |
| bagging_fraction | 8.7951 × 10⁻¹ | 9.7636 × 10⁻¹ | |
| bagging_freq | 5 | 5 | |
| extra_trees | FALSE | FALSE | |
| LSTMOPT | optimizer | Adam | Adam |
| units | 850 | 100 | |
| epochs | 350 | 200 | |
| batch_size | 128 | 128 | |
| dropout_rate | 5.6188 × 10⁻¹ | 1.3653 × 10⁻¹ | |
| learning_rate | 4.9687 × 10⁻² | 7.2607 × 10⁻² |
| Methods | Hyperparameters | ROA | ROE |
|---|---|---|---|
| C_DTOPT | criterion | ‘entropy’ | ‘gini’ |
| splitter | ‘random’ | ‘random’ | |
| max_depth | 8 | 9 | |
| min_samples_split | 12 | 9 | |
| min_samples_leaf | 4 | 1 | |
| max_features | 7.3206 × 10⁻¹ | 6.8707 × 10⁻¹ | |
| C_RFOPT | n_estimators | 32 | 100 |
| criterion | ‘gini’ | ‘gini’ | |
| max_depth | 19 | 7 | |
| min_samples_split | 14 | 4 | |
| min_samples_leaf | 1 | 3 | |
| max_features | 5.0455 × 10⁻¹ | 1.5870 × 10⁻¹ | |
| C_LGBMOPT | boosting_type | ‘goss’ | ‘goss’ |
| num_leaves | 29 | 60 | |
| learning_rate | 1.3350 × 10⁻¹ | 1.2114 × 10⁻² | |
| max_depth | 11 | 16 | |
| min_child_samples | 2 | 5 | |
| subsample | 8.8388 × 10⁻¹ | 6.8396 × 10⁻¹ | |
| colsample_bytree | 7.1277 × 10⁻¹ | 9.6565 × 10⁻¹ | |
| reg_alpha | 2.2414 × 10⁻¹ | 8.2534 × 10⁻⁴ | |
| reg_lambda | 3.9651 × 10⁻⁴ | 1.7167 × 10⁻⁵ | |
| CNNOPT | lr | 1.8631 × 10⁻⁴ | 2.3397 × 10⁻⁵ |
| batch_size | 43 | 36 | |
| optimizer | sgd | adam | |
| filters_1 | 128 | 128 | |
| filters_2 | 32 | 128 |
| Datasets | ROA | ROE | ||||
|---|---|---|---|---|---|---|
| Methods | RMSE | MAE | R2 | RMSE | MAE | R2 |
| MLR | 7.98 | 5.84 | −0.28 | 13.19 | 9.37 | 0.07 |
| R_XGBOPT | 6.03 | 4.42 | 0.27 | 11.81 | 8.59 | 0.25 |
| R_LGBMOPT | 6.00 | 4.19 | 0.28 | 10.44 | 7.93 | 0.42 |
| LSTMOPT | 3.92 | 3.23 | 0.71 | 7.43 | 4.46 | 0.72 |
| Datasets | ROA | ROE | ||||||||
|---|---|---|---|---|---|---|---|---|---|---|
| Methods | Accuracy | Precision | Recall | Specificity | F1-Score | Accuracy | Precision | Recall | Specificity | F1-Score |
| C_DTOPT | 55.56% | 47.06% | 53.33% | 57.14% | 50.00% | 66.67% | 71.43% | 33.33% | 90.48% | 45.45% |
| C_RFOPT | 58.33% | 50.00% | 46.67% | 66.67% | 48.28% | 69.44% | 75.00% | 40.00% | 90.48% | 52.17% |
| C_LGBMOPT | 77.78% | 76.92% | 66.67% | 85.71% | 71.43% | 77.78% | 88.89% | 53.33% | 95.24% | 66.67% |
| CNNOPT | 80.56% | 83.33% | 66.67% | 90.48% | 74.07% | 80.56% | 90.00% | 60.00% | 95.24% | 72.00% |
Disclaimer/Publisher’s Note: The statements, opinions and data contained in all publications are solely those of the individual author(s) and contributor(s) and not of MDPI and/or the editor(s). MDPI and/or the editor(s) disclaim responsibility for any injury to people or property resulting from any ideas, methods, instructions or products referred to in the content. |
© 2025 by the authors. Licensee MDPI, Basel, Switzerland. This article is an open access article distributed under the terms and conditions of the Creative Commons Attribution (CC BY) license (https://creativecommons.org/licenses/by/4.0/).
Share and Cite
Hsu, W.-L.; Lin, Y.-L.; Lai, J.-P.; Liu, Y.-H.; Pai, P.-F. Forecasting Corporate Financial Performance Using Deep Learning with Environmental, Social, and Governance Data. Electronics 2025, 14, 417. https://doi.org/10.3390/electronics14030417
Hsu W-L, Lin Y-L, Lai J-P, Liu Y-H, Pai P-F. Forecasting Corporate Financial Performance Using Deep Learning with Environmental, Social, and Governance Data. Electronics. 2025; 14(3):417. https://doi.org/10.3390/electronics14030417
Chicago/Turabian StyleHsu, Wan-Lu, Ying-Lei Lin, Jung-Pin Lai, Yu-Hui Liu, and Ping-Feng Pai. 2025. "Forecasting Corporate Financial Performance Using Deep Learning with Environmental, Social, and Governance Data" Electronics 14, no. 3: 417. https://doi.org/10.3390/electronics14030417
APA StyleHsu, W.-L., Lin, Y.-L., Lai, J.-P., Liu, Y.-H., & Pai, P.-F. (2025). Forecasting Corporate Financial Performance Using Deep Learning with Environmental, Social, and Governance Data. Electronics, 14(3), 417. https://doi.org/10.3390/electronics14030417