Abstract
Hyperspectral anomaly detection (HAD) refers to a method of identifying abnormal targets through the differences in spectral separabilities of anomaly versus background clutter. It plays a significant role in fields such as commercial agriculture, for instance, in pest and disease monitoring and environmental monitoring. Collaborative representation detector (CRD) is a classic hyperspectral anomaly detection method. However, by constructing a sliding dual window, it leads to a high computational complexity and thus takes a relatively long time. In response to the deficiencies existing in that CRD method, we propose a method that first extracts extended morphological profiles (EMP) and then uses the obtained feature images to construct K-means CRD (EMPKCRD). This method performs window reconstruction on complex hyperspectral background pixels through the K-means clustering algorithm to separate abnormal pixels with similar features and obtain the background dictionary matrix. The method leverages the observation that background pixels can be effectively approximated by a linear combination of their spatially adjacent pixels, whereas anomalous pixels, due to their distinct nature, cannot be similarly reconstructed from their local neighborhood. This fundamental disparity in reconstructibility is then exploited to separate anomalies from the background. Then, anomaly detection can be carried out on this matrix faster, avoiding the high computational complexity caused by the use of a sliding dual window. Through comparative simulation experiments with seven widely used algorithms at present on three real-world datasets, the empirical evaluations validate that this method has excellent performance while exhibiting a favorable balance between detection precision and operational speed.
1. Introduction
Hyperspectral images (HSI) are image cubes that combine two-dimensional space and one-dimensional spectra, describing the spectral–spatial signatures of the target. The spectral properties of materials are distinctive, allowing for their identification and differentiation [1]. HSI have the feature of “integration of image and spectrum”. These characteristics mentioned above enable it to be applied to abnormal target detection. The spectral characteristics of abnormal pixels are statistically divergent from surrounding background pixels and manifest distinctly in the feature space. This, coupled with their characteristically low prior probability, defines their anomalous nature [2]. Compared with traditional visible light imaging, hyperspectral imaging provides spectral data of each pixel in hundreds of bands, with richer data dimensions. It can capture the subtle differences between camouflaged targets and background in the spectral dimension, thereby making up for the deficiencies of traditional visible light image visual detection methods.
However, due to the large amount of data and spectral redundancy, researchers have also proposed various hyperspectral anomaly detection methods to overcome the shortcomings. Seven widely used methods at present are selected in this article: The RX algorithm is premised on the assumption that the background clutter within a hyperspectral image can be modeled by a multivariate Gaussian distribution for statistical modeling purposes [3]. The core distinction lies in the background modeling scope: the GRX is defined by its use of global image statistics, whereas the LRX, conversely, operates on a local context by estimating background parameters from a dual-window region surrounding each target pixel [4,5]. However, the spectral distribution of real-world HSI backgrounds frequently deviates from the idealized form of a multivariate Gaussian distribution, rendering the standard modeling assumption inadequate for complex scenes [6]. The Cluster-Based Anomaly Detection (CBAD) algorithm operates in a two-stage manner: it initially segments the entire image into multiple spectral clusters, and subsequently applies the RX detector within each resulting segment to identify potential anomalies [7]. The low-rank and sparse matrix decomposition-based Mahalanobis distance (LSMAD) method leverages low-rank and sparse matrix decomposition to exploit the structural prior of the background. This decomposition recovers a cleaner background representation by separating out anomalous and noisy components, thereby enabling more precise anomaly detection through subsequent Mahalanobis distance calculation. The CRD algorithm exploits the collaborative representability of background pixels: the property that they can be well approximated by a sparse linear combination of surrounding pixels in a dual-window region. Conversely, anomalies, being statistically distinct, are largely incoherent with this local background subspace and thus yield large representation residuals [8]. The proposed method’s principal strength is its ability to perform adaptive background modeling without significant performance degradation in the presence of anomalies, which often bias traditional estimators. The existing shortcomings of CRD are the use of sliding dual windows, which leads to high computational complexity. Operating by constructing two underlying transformation matrices according to pixel coordinates, the Recursive Collaborative Representation-based Detector (RCRD) employs a matrix inversion lemma to enhance the efficiency of the detection process. The Ensemble and Random Collaborative Representation Detector (ERCRD) enhances detection robustness by iteratively applying random sub-sampling to the collaborative representation framework, thereby generating an ensemble of detection outcomes for consolidated decision-making. A key departure of ERCRD is its elimination of the sliding dual-window mechanism, which is predominantly responsible for the high computational load in standard CRD. This design substantially lowers the algorithmic complexity, greatly improving its practicality and scalability for real-world deployment [9].
Readers are referred to Section 4.1 for a fuller treatment of the comparative methods utilized in this study, with the elaborate discussion dedicated to their specific configurations and rationale.
Furthermore, with the vigorous advances in deep learning theory in recent years, anomaly detection methods based on convolutional neural networks (CNN) have become a prominent research focus. Typical examples include autoencoder models [10], which can effectively measure pixel-wise anomaly levels through reconstruction error under the condition that anomalies occupy a relatively small proportion. Meanwhile, more advanced network architectures such as Deep Belief Networks (DBN) [11] and Transformer [12] have also been introduced into anomaly detection tasks, demonstrating notable superiority in complex background modeling and noise resistance.
In addition, large model-based (LLMs) anomaly detection methods for hyperspectral images have emerged as a cutting-edge direction along with the progress in deep learning. These approaches generally build upon pre-trained large models and are optimized according to the characteristics of hyperspectral imagery—namely, high-dimensional spectral data and coupled spatial–spectral information.
However, compared with deep learning and large model-based methods, traditional approaches offer several merits as follows:
- They exhibit lower dependency on labeled data. The method proposed in this paper does not require large-scale annotated samples. Effective detection can be achieved solely through unsupervised K-means clustering and window reconstruction, making it more suitable for scenarios with high labeling costs such as hyperspectral image analysis.
- The computational resource requirements are more moderate. In contrast to the complex architectures and massive parameters of deep learning or large models, the proposed method maintains detection accuracy while being more lightweight, demanding less hardware capability, and thus facilitating practical deployment.
- Traditional methods demonstrate better stability on medium and small-scale datasets and under non-uniform background conditions. By integrating local window information and global clustering features, the proposed approach is less sensitive to data distribution variations and exhibits stronger robustness compared with some deep learning models.
Therefore, in this paper, we continue to employ traditional methods for anomaly detection in hyperspectral images.
A predominant limitation of existing anomaly detectors is their heavy reliance on spectral information, while largely overlooking the rich spatial-contextual cues within hyperspectral imagery. This spectral-centric approach inevitably constrains their discriminative power and robustness in complex scenes.
To make up for these deficiencies, we introduce a rapid collaborative representation method utilizing EMPs (EMPKCRD) for hyperspectral abnormal detection. This method leverages the spatial features extracted by EMPs to achieve both high detection accuracy and significantly improved computational efficiency. The EMPKCRD algorithm is mainly divided into three parts. The procedure commences with the extraction of EMPs, whereupon the K-means clustering algorithm is employed to reconstruct the background dictionary matrix, a crucial step for subsequent analysis. Finally, the anomaly detection of the reconstructed background dictionary matrix is carried out by the method of collaborative representation.
2. Related Works
Premised on the fundamental premise that pixels constituting the background can be approximated by their spatial vicinity, anomalous targets, in contrast, defy such representation. The Collaborative Representation Detector (CRD) is utilized to detect anomaly targets in hyperspectral images. Inherently nonparametric, this approach dispenses with the need to estimate the background covariance matrix a priori, as it does not rely on predefined statistical distributions. Also, it is further regularized by a similarity matrix, which allows it to adapt to different circumstances.
The detected pixel is . With the pixel as the center, the outer window size is and the inner window size is . The background dictionary matrix is the set of pixels linearly arranged between the two windows. , . The objective of CRD lies in deriving an optimal weight vector a that minimizes while simultaneously minimizing . The objective function can be written as
is the regularization parameter. The value is set as . By differentiating the pertinent expression with reference to :
The objective function is therefore formulated as
Distance weighting Tikhonov regularization are introduced to modify the weight vector, and add a constraint with coefficient of 1 to the weight vector [13].
where . By taking the derivative of a in the above equation, we can obtain
Reconstructing the pixel representations using the learned dictionary and deriving the associated reconstruction error constitutes a critical step in the anomaly detection pipeline.
where is the reconstructed pixel. A pixel is adjudged anomalous provided that its reconstruction error exceeds a predefined decision threshold; otherwise, it is assigned to the background class.
3. Proposed Method
3.1. EMP Features
The EMP features are represented by the transformed images resulting from the application of Principal Component Analysis (PCA) to the original hyperspectral cube. The morphological profiles of each principal component image are generated by repeatedly using the open and close operations of different structural elements (SEs), and then these generated morphological profiles are connected to construct the EMP features of each pixel [14]. EMP characteristic matrix is expressed as
denotes the total count of bands. The quantity of and SEs are associated with principal component image number .
3.2. Rapid Collaborative Representation Method Based on EMP
The method adopted by the EMPKCRD algorithm for window reconstruction entails the application of K-means clustering algorithm to select the most representative pixel points in the image to form a new background matrix [15]. For hyperspectral images, given a dataset
denoted as the data matrix, where are pixels. Since anomaly detection is a binary classification problem, with one class representing the background and the other representing anomaly points, we select center points to constitute the background dictionary matrix, and constantly update the positions of center points, until they meet the set conditions. The reconstructed matrix :
Collaborative representation model is used for machine learning, whose pending sample is postulated that a test sample resides in the linear span of the training ones [16]. It can better reflect the intrinsic framework on which the data resides and also has good robustness. It is prevalently adopted in various fields such as image classification and object detection. This paper proposes an anomaly detection algorithm based on rapid collaborative representation of EMP. Construct the objective function based on the background dictionary matrix processed by the K-means clustering algorithm [17].
The algorithm follows these steps:
- Choose an initial value: k = 2.
- Assign each point to the nearest centroid to obtain k initial clusters.
- For each cluster, calculate a new centroid, determining the representative center of a cluster by averaging the coordinates of its constituent members.
- Reassign each pixel to the nearest new centroid.
- Repeat the above steps, until pixels no longer change clusters.
Based on the idea of collaborative representation, the objective function is constructed as follows:
is the regularization parameter (), and is the reconstructed dictionary matrix obtained through k-means clustering. Similarly, Tikhonov regularization with distance weights is incorporated to optimize the value of weight vector a, and the objective function can be rewritten as
In order to make the algorithm more stable, we added a constraint condition with a coefficient of 1 to the weight vector a. At this point, the objective function is modified to
where . Our goal is to find a weight vector a that minimizes while satisfying the constraint of minimizing . Taking the derivative of a provides the following:
Reconstruct the pixels and calculate the reconstruction error:
A pixel is adjudged anomalous provided that its reconstruction error exceeds a predefined decision threshold; otherwise, it is assigned to the background class.
4. Results
4.1. Compared Methods
- GRX: Global RX. The Global RX detector struggles with complex backgrounds and small-scale anomalies due to its reliance on global statistical data [18].
- LRX: Local RX algorithm. It is of great significance because when anomalies are locally perceptible yet globally concealed, global RX anomaly detectors will not work. Since the local background model can fit closely, this localized detection strategy resulted in a higher identification rate. However, this requires a critical yet unknown window size, with no one-size-fits-all approach to fully resolve the pitfalls of over-fitting or under-fitting.
- CBAD: Clustering-based anomaly detector. The Cluster-Based Anomaly Detection method is to classify similar or related data objects into a cluster [19]. However, the resulting outlier set may have a very large relationship with the number of classes [20].
- LSMAD: Low-rank and sparse matrix decomposition-based Mahalanobis distance method. Built upon the low-rank prior for background modeling, it first computes the background statistics and then identifies outliers by evaluating the Mahalanobis distance of candidate pixels [21].
- CRD: Collaborative Representation Detector. This method is grounded in the fundamental premise that background pixels are spatially correlated and can be effectively approximated by their local neighborhoods, whereas anomalies, lacking such consistency, cannot. However, due to its use of the sliding double-window strategy, the algorithm has a relatively high complexity and a long detection time in practical applications.
- RCRD: Recursive collaborative representation detector. To expedite computation, a recursive update mechanism is derived using the matrix inversion lemma. This is achieved by constructing two elementary transformation matrices tailored to pixel locations [22].
- ERCRD: Ensemble and random collaborative representation detection. The method leverages random sub-sampling on CRD (RCRD) to obtain a set of diverse detection outcomes, moving beyond the conventional sliding dual-window. Ensemble learning is then applied to fuse these outcomes into a single consensus result, enhancing its accuracy and generalization ability.
4.2. Datasets
- AVIRIS-I: The data was collected using the Airborne Visible/Infrared Imaging Spectrometer (AVIRIS) instrument stationed at the San Diego, California, USA facility. The visual representation of the scene spans a resolution of 400 pixels in both width and height, and is composed of 224 distinct spectral bands, each corresponding to a unique wavelength range that stretches from 370 to 2510 nanometers. The AVIRIS-I dataset occupies a specific region within the image, located at the upper-left quadrant and spans a dimension of 120 pixels by 120 pixels. Following the elimination of bands associated with water absorption, reduced signal-to-noise ratios, and suboptimal quality, a total of 189 distinct spectral components were retained during the experimental analysis. In this region, a cluster of three distinct planes each containing 58 pixels appears to be associated with anomalous data points.
- abu-urban-2: The abu-urban-2 dataset is a high-resolution urban landscape map derived from the ABU collection, comprising 210 spectral bands. This instrument operates across a broad spectral range, spanning from 400 to 2500 nanometers, and achieves a resolution of 10 nanometers in terms of wavelength. The Abu-urban-2 dataset is composed of a 100 by 100 spatial domain and spans a total of 207 distinct spectral bands, which are used for multispectral analysis. According to [23], various vehicles in the map are considered abnormal pixels and should be detected.
- abu-urban-4: The abu-urban-4 dataset is captured in Los Angeles. It is composed of a 100 by 100 pixel spatial domain, spanning a total of 205 spectral bands [24].
4.3. Evaluation Methods
In the present experiment, false-color images serve as a qualitative visualization tool for assessing detection outputs.
- False color refers to the process of applying a color scheme to an image, with the explicit aim of enhancing the discernibility of targeted image features or value ranges based on their underlying exposure or data intensity.
- Furthermore, the Receiver Operating Characteristic (ROC) curve and its corresponding Area Under the Curve (AUC) are employed as quantitative metrics to comprehensively verify the overall efficacy of HAD algorithms in identifying outliers. The construction of the ROC curve involves systematically traversing all conceivable thresholds, for each of which the False Positive Rate (FPR) and the True Positive Rate (TPR) are calculated. These coordinate FPR and TPR points are subsequently connected to delineate the curve. The proximity of the curve to the upper-left corner in the ROC coordinate system corresponds to a higher AUC value, and thus serves as a hallmark of the algorithm’s more exceptional predictive accuracy.
4.4. Experiment Results
The experimental work was conducted on a computational platform featuring an Intel Core i9-12900H processor (2.50 GHz), with all algorithms being implemented and run within the MATLAB 2024a environment.
To verify the accuracy and high efficiency of the method, experiments have been conducted on AVIRIS-I, abu-urban-2, and abu-urban-4 datasets.
The performance evaluation of the EMPKCRD algorithm is accomplished by comparing it with seven other currently widely used anomaly detection algorithms: GRX (Global Reed-Xiaoli), LRX (Locally RX), CBAD (Cluster-Based Anomaly Detection), LSMAD (Low-rank and Sparse Matrix Decomposition-based Mahalanobis Distance), CRD (Collaborative Representation-based Detection), RCRD (Recursive Collaborative Representation-based Detector), and ERCRD (Ensemble and Random Collaborative Representation Detector). The size of the exterior windows in the CRD method is set to 17 (), and the size of the interior windows is set to 13 (). We use ROC (Receiver Operating Characteristic) curve and AUC (Area under the ROC curve) to compare different methods performance on different datasets. The running time is as shown in Table 1.

Table 1.
Running times.
As shown in Figure 1, namely the detection results of the AVIRIS-I dataset, the EMPKCRD method proposed in this paper can accurately detect the positions of three aircraft and clearly describe the shapes of them. The expression of abnormalities is also more obvious. The most intuitive impression is that the targets appear brighter in the color detection map. In sharp contrast to this is that for the GRX, LRX, CBAD, and LSMAD anomaly detection algorithm, the positions of the three aircraft are hardly visible. Meanwhile, for the CRD, RCRD, and ERCRD algorithms, only a blurry outline of the aircraft can be seen.
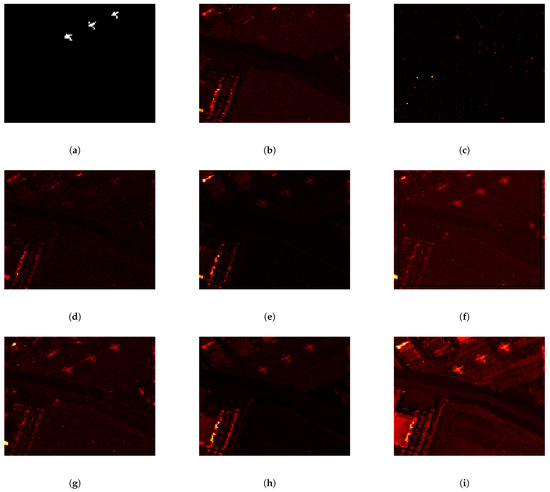
Figure 1.
Color detection maps of the AVIRIS-I dataset using different algorithms. (a) Ground truth. (b) GRX. (c) LRX. (d) CBAD. (e) LSMAD. (f) CRD. (g) RCRD. (h) ERCRD. (i) EMPKCRD.
Additionally, the ROC curve of the proposed EMPKCRD anomaly detection algorithm illustrated in Figure 2 is closer to the upper left corner of the coordinate plane than that of other algorithms. The AUC value of the EMPKCRD method is 0.9916, which is higher than that of all other methods. The subsequent one is CRD, which is 0.9896. However, CRD misclassifies many background pixels as abnomalies, with the running time reaching 9.5635 s, which is significantly longer than that of EMPKCRD, which is 0.1631 s. Therefore, the proposed EMPKCRD method achieved the best result in separating anomalies.
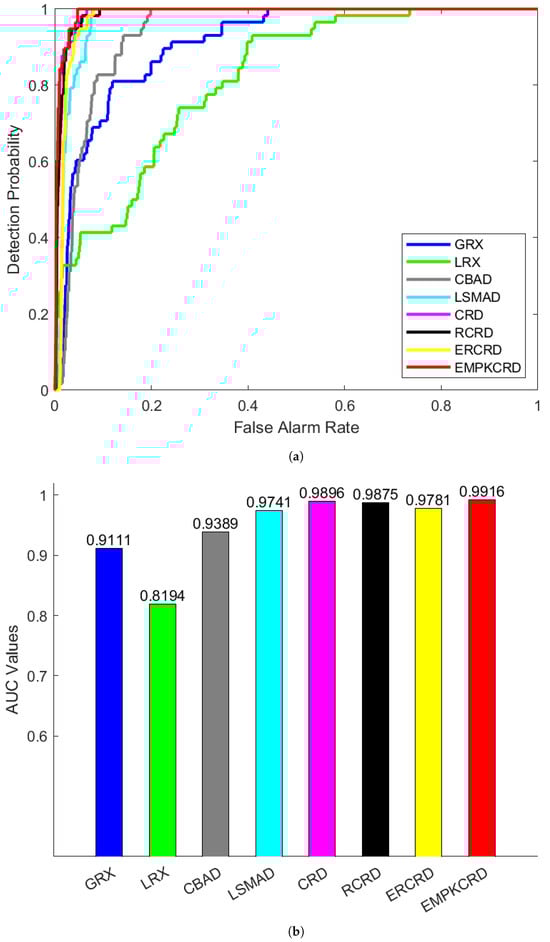
Figure 2.
The ROC (a) and AUC (b) curves of the AVIRIS-I dataset using different algorithms.
In Figure 3, the experimental results of abu-urban-2 were analyzed, and EMPKCRD demonstrated excellent performance. This was reflected in its ability to accurately detect the positions of all abnormal targets and to clearly extract their contours. ERCRD also detected the vast majority of the anomalous object, but it failed to accurately capture the outline of the target. Comparatively, EMPKCRD demonstrates superior capability in identifying the location and contour of anomalies. This enhanced detection performance is directly translated into a visual output where anomalous regions appear with markedly greater brightness. While for LRX, LSMAD, CRD, and RCRD, these algorithms only detected a portion of the anomalies. For GRX and CBAD, these two methods detected all abnormal targets, but the anomalies were rather blurry and not easy to identify. Notably, EMPKCRD also proves to be the most computationally efficient method in Table 1, with a running time of only 0.2656 s, outperforming the other two approaches. The ROC curve of EMPKCRD portrayed in Figure 4 is closest to the upper left corner. Its value of AUC is also the largest, which is 0.9986. These reflect the better performance of the EMPKCRD.
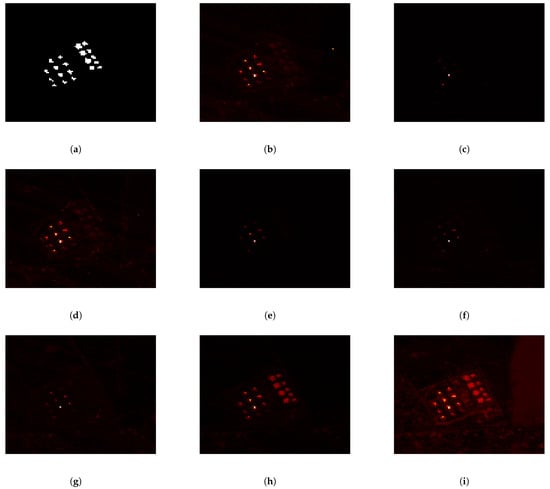
Figure 3.
Color detection maps of the abu-urban-2 dataset using different algorithms. (a) Ground truth. (b) GRX. (c) LRX. (d) CBAD. (e) LSMAD. (f) CRD. (g) RCRD. (h) ERCRD. (i) EMPKCRD.
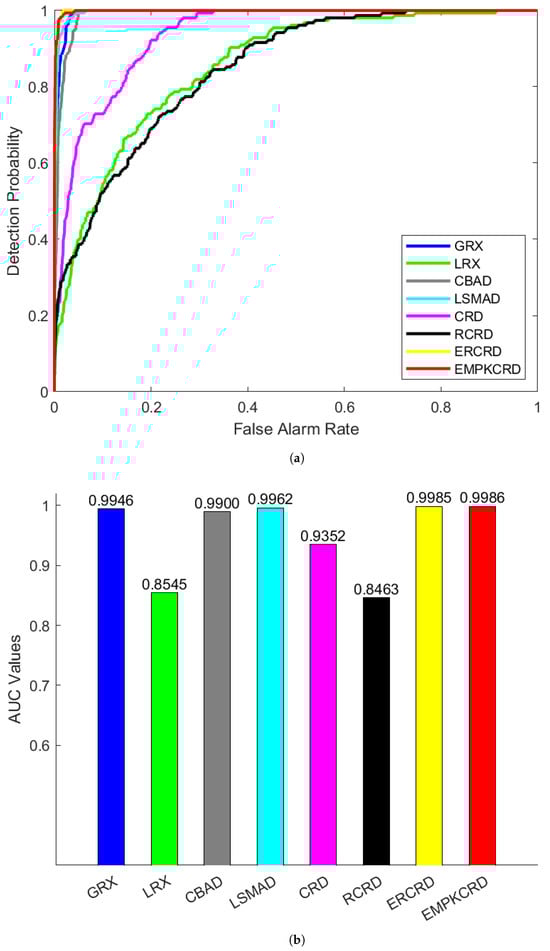
Figure 4.
The ROC (a) and AUC (b) curves of the abu-urban-2 dataset using different algorithms.
When analyzing the detection images of abu-urban-4, in Table 1, ERCRD has the shortest running time, but it, as well as LRX, LSMAD, CRD and RCRD, only detected very few abnormal targets, and was difficult to identify in Figure 5. The GRX detected most of the abnormal targets, but the extracted anomalies were rather blurry and it was impossible to clearly determine the exact positions of the targets. CBAD detected most of the anomalies, but was severely affected by the background, mistakenly classifying many background pixels as anomalies. This also resulted in a very low AUC value of 0.6010 in Figure 6.
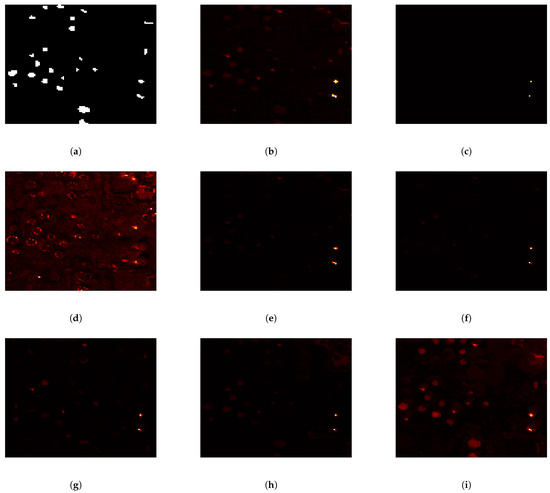
Figure 5.
Color detection maps of the abu-urban-4 dataset using different algorithms. (a) Ground truth. (b) GRX. (c) LRX. (d) CBAD. (e) LSMAD. (f) CRD. (g) RCRD. (h) ERCRD. (i) EMPKCRD.
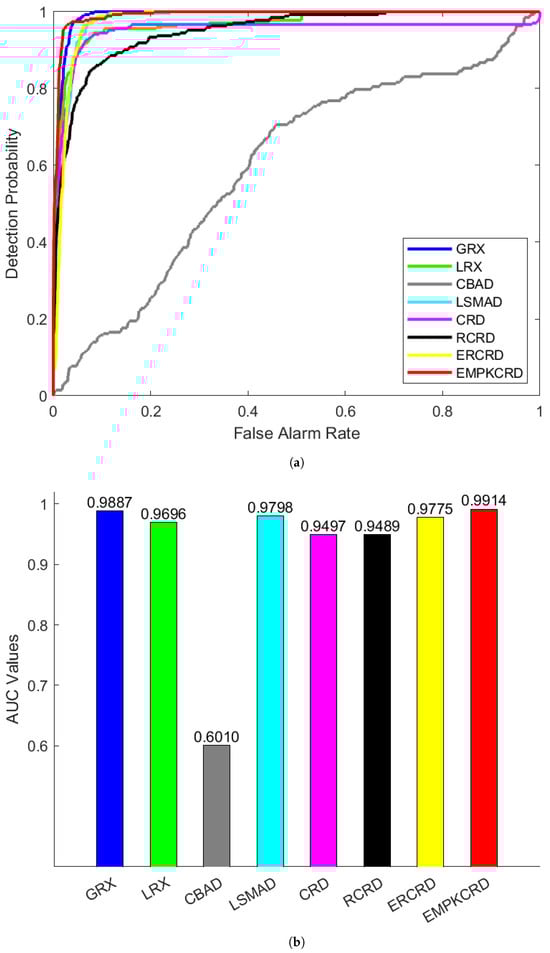
Figure 6.
The ROC (a) and AUC (b) curves of the abu-urban-4 dataset using different algorithms.
The detection results of EMPKCRD depicted its ability to detect most of the abnormal targets, showing less background interference. The running time of EMPKCRD displayed in Table 1 is 0.2217 s. The ROC curve of EMPKCRD shown in Figure 6 is always the closest to the upper left corner. The AUC of EMPKCRD shown in Figure 6 is always greater than that of other algorithms, reaching 0.9914.
The EMPKCRD algorithm detects abnormal targets in hyperspectral images by extracting EMP and performing window reconstruction and collaborative representation. Overall, for the selected datasets, compared with eight different algorithms, the comprehensive performance of EMPKCRD is the best. It can produce relatively complete result images. Also, the running time of EMPKCRD is shorter, which demonstrates the high performance and efficiency of the EMPKCRD algorithm.
5. Discussion
This paper presents a rapid CRD method built upon EMP features to address the issues of high computational complexity and prolonged processing time inherent in conventional CRD. Comparative experimental results with seven traditional HAD methods indicate that our proposed approach achieves exceptional performance in both detection accuracy and operational speed. When applied to three datasets utilized in this study for anomaly detection, our method attains higher AUC values compared to traditional techniques such as CRD, CBAD, LSMAD, and RX. Moreover, it identifies a greater number of anomalous targets with more precise localization and extracts clearer target contours. Regarding to processing speed, for instance, on the AVIRIS dataset, the proposed EMPKCRD method requires only 0.017 and 0.018 times the computational time of CRD and RCRD, respectively, representing a substantial acceleration.
Major advancements are attributed to two key innovations. First, by extracting the EMP of hyperspectral images, we innovatively achieve full utilization of spatial features, which effectively enhances detection accuracy. Second, the application of the K-means clustering algorithm to the construction of the background dictionary enables the selection of background pixels which are more representative. This reduces interference from anomalous pixels during background modeling. The dictionary is strategically compressed from N to k dimensions, thereby triggering an exponential decline in computational complexity, which is significantly curtailed. Collectively, our model offers significant optimization in suppressing background and noise interference while achieving markedly faster detection speeds.
Despite these enhancements in computational efficiency and accuracy, the method requires further optimization. First, its detection precision and robustness are inevitably influenced by inherent dataset characteristics—such as spatial resolution and anomalous target features—indicating a need for improved generalization capability. Second, the spatial feature extraction method based on EMP filtering is relatively simplistic and could be supplanted by spectral–spatial fusion techniques. Such an approach would allow for the simultaneous extraction of spatial and spectral features, facilitating the construction of an effective spatial–spectral fusion model.
6. Conclusions
In this project, we integrated EMP and K-means with the CRD method (EMPKCRD) to address the issues of high computational complexity and long computation time in CRD.
First, spatial features are derived from the hyperspectral data using extended morphological profile (EMP). This process effectively integrates spatial information from the HSI, thereby substantially enhancing the detector’s accuracy and robustness. Subsequently, the resulting feature map then undergoes k-means clustering, where representative pixels are judiciously selected for window reconstruction, enabling subsequent anomaly detection via a collaborative representation framework. This strategy, which capitalizes on spatial characteristics while purifying the background, simultaneously satisfies the dual demands for high precision and real-time processing efficiency. The experimental study involved a comprehensive evaluation conducted by comparing seven benchmarking methods across three datasets. Empirical results indicate that the EMPKCRD method delivers superior and consistent anomaly detection performance, securing the highest AUC values. An additional comparison focused on runtime and accuracy among EMPKCRD, CRD, and RCRD. Greater accuracy, alongside a reduction in processing time, is achieved by our method relative to the CRD approach. This empirical evidence collectively substantiates the outperformance of the proposed EMPKCRD framework.
Author Contributions
Conceptualization, J.L. and F.H.; methodology, J.L., F.H. and X.S.; writing—original draft preparation, J.L.; writing—review and editing, J.L. and F.H.; supervision, W.J., H.H. and X.S.; funding acquisition, J.Z. and F.H. All authors have read and agreed to the published version of the manuscript.
Funding
This research was supported by National Natural Science Foundation of China grant number 42301458 and 42401499, Postdoctoral Fellowship Program of CPSF (2023M744301), the Natural Science Basis Research Plan in Shaanxi Province of China (20230712) and the Youth Fund of PLA Rocket Force University of Engineering (2021-QNB-007).
Data Availability Statement
The original contributions presented in this study are included in the article. Further inquiries can be directed to the corresponding author.
Acknowledgments
The authors have reviewed and edited the output and take full responsibility for the content of this publication.
Conflicts of Interest
The authors declare no conflicts of interest.
Abbreviations
The following abbreviations are used in this manuscript:
| EMP | Extended morphological profile |
| HAD | Hyperspectral anomaly detection |
| CRD | Collaborative representation detector |
| HSI | Hyperspectral image |
| RX | Reed and Xiaoli |
| GRX | Global RX |
| LRX | Local RX |
| CBAD | Cluster-Based Anomaly Detection |
| RCRD | Recursive collaborative representation detector |
| LSMAD | Low-rank and sparse matrix decomposition based Mahalanobis distance method |
| ERCRD | Ensemble and Random Collaborative Representation Detector |
| AUC | Area Under the Curve |
| ROC | Receiver Operating Characteristic |
References
- Pan, L. Spatial-spectral feature extraction of hyperspectral images using tensor-based collaborative graph analysis. Electron. Lett. 2021, 57, 550–552. [Google Scholar] [CrossRef]
- Zhang, F.; He, F.; Hu, H. Laplacian matrix graph for anomaly target detection in hyperspectral images. Electron. Lett. 2022, 58, 312–314. [Google Scholar] [CrossRef]
- Reed, I.; Yu, X. Adaptive multiple-band CFAR detection of an optical pattern with unknown spectral distribution. IEEE Trans. Acoust. Speech Signal Process. 1990, 38, 1760–1770. [Google Scholar] [CrossRef]
- Molero, J.M.; Garzón, E.M.; García, I.; Plaza, A. Analysis and Optimizations of Global and Local Versions of the RX Algorithm for Anomaly Detection in Hyperspectral Data. IEEE J. Sel. Top. Appl. Earth Obs. Remote Sens. 2013, 6, 801–814. [Google Scholar] [CrossRef]
- Zhao, C.; Wang, Y.; Qi, B.; Wang, J. Global and Local Real-Time Anomaly Detectors for Hyperspectral Remote Sensing Imagery. Remote Sens. 2015, 7, 3966–3985. [Google Scholar] [CrossRef]
- Kwon, H.; Nasrabadi, N. Kernel RX-algorithm: A nonlinear anomaly detector for hyperspectral imagery. IEEE Trans. Geosci. Remote Sens. 2005, 43, 388–397. [Google Scholar] [CrossRef]
- Wang, R.; Nie, F.; Wang, Z.; He, F.; Li, X. Multiple Features and Isolation Forest-Based Fast Anomaly Detector for Hyperspectral Imagery. IEEE Trans. Geosci. Remote Sens. 2020, 58, 6664–6676. [Google Scholar] [CrossRef]
- Li, W.; Du, Q. Collaborative Representation for Hyperspectral Anomaly Detection. IEEE Trans. Geosci. Remote Sens. 2015, 53, 1463–1474. [Google Scholar] [CrossRef]
- Lu, Y.; Zheng, X.; Xin, H.; Tang, H.; Wang, R.; Nie, F. Ensemble and random collaborative representation-based anomaly detector for hyperspectral imagery. Signal Process. 2023, 204, 108835. [Google Scholar] [CrossRef]
- Su, H.; Wu, Z.; Zhang, H.; Du, Q. Hyperspectral Anomaly Detection: A survey. IEEE Geosci. Remote Sens. Mag. 2022, 10, 64–90. [Google Scholar] [CrossRef]
- Li, Z.; Zhang, Y.; Zhang, J. Hyperspectral Anomaly Detection via Optimal Kernel and High-Order Moment Correlation Representation. IEEE J. Sel. Top. Appl. Earth Obs. Remote Sens. 2022, 15, 3925–3937. [Google Scholar] [CrossRef]
- Xiao, S.; Zhang, T.; Xu, Z.; Qu, J.; Hou, S.; Dong, W. Anomaly Detection of Hyperspectral Images Based on Transformer with Spatial–Spectral Dual-Window Mask. IEEE J. Sel. Top. Appl. Earth Obs. Remote Sens. 2023, 16, 1414–1426. [Google Scholar] [CrossRef]
- Wang, J.; Lu, H.; Yan, K.; Ye, M. An Improved Tikhonov Method for Magnetic Induction Tomography. In Proceedings of the 2018 9th International Conference on Information Technology in Medicine and Education (ITME), Hangzhou, China, 19–21 October 2018; pp. 718–722. [Google Scholar] [CrossRef]
- Plaza, A.; Martinez, P.; Perez, R.; Plaza, J. A new method for target detection in hyperspectral imagery based on extended morphological profiles. In Proceedings of the IGARSS 2003, 2003 IEEE International Geoscience and Remote Sensing Symposium, Proceedings (IEEE Cat. No.03CH37477), Toulouse, France, 21–25 July 2003; Volume 6, pp. 3772–3774. [Google Scholar] [CrossRef]
- Xu, Y.; Wu, Z.; Li, J.; Plaza, A.; Wei, Z. Anomaly Detection in Hyperspectral Images Based on Low-Rank and Sparse Representation. IEEE Trans. Geosci. Remote Sens. 2016, 54, 1990–2000. [Google Scholar] [CrossRef]
- Wang, R.; Hu, H.; He, F.; Nie, F.; Cai, S.; Ming, Z. Self-weighted collaborative representation for hyperspectral anomaly detection. Signal Process. 2020, 177, 107718. [Google Scholar] [CrossRef]
- Macqueen, J. Some methods for classification and analysis of multivariate observations. In Proceedings of the Fifth Berkeley Symposium on Mathematical Statistics and Probability, Berkeley, CA, USA, 21 June–18 July 1967; Volume 1. [Google Scholar]
- Yego, A.K.; Nar, F. Ship Detection using Global-Local RX Detector. In Proceedings of the 2025 33rd Signal Processing and Communications Applications Conference (SIU), Sile, Istanbul, Turkiye, 25–28 June 2025; pp. 1–4. [Google Scholar] [CrossRef]
- Zhang, J.; Ye, Q.; Zhou, T. Anomaly Detection of Target Dynamics Based on Clustering. In Proceedings of the 2018 15th International Symposium on Pervasive Systems, Algorithms and Networks (I-SPAN), Yichang, China, 16–18 October 2018; pp. 287–291. [Google Scholar] [CrossRef]
- Han, J.; Kamber, M.; Pei, J. 8—Classification: Basic Concepts. In Data Mining: Concepts and Techniques, 3rd ed.; Han, J., Kamber, M., Pei, J., Eds.; The Morgan Kaufmann Series in Data Management Systems; Morgan Kaufmann: Boston, MA, USA, 2012; pp. 327–391. [Google Scholar] [CrossRef]
- Zhang, Y.; Du, B.; Zhang, L.; Wang, S. A Low-Rank and Sparse Matrix Decomposition-Based Mahalanobis Distance Method for Hyperspectral Anomaly Detection. IEEE Trans. Geosci. Remote Sens. 2016, 54, 1376–1389. [Google Scholar] [CrossRef]
- Ma, N.; Peng, Y.; Wang, S. A Fast Recursive Collaboration Representation Anomaly Detector for Hyperspectral Image. IEEE Geosci. Remote Sens. Lett. 2019, 16, 588–592. [Google Scholar] [CrossRef]
- Kang, X.; Zhang, X.; Li, S.; Li, K.; Li, J.; Benediktsson, J.A. Hyperspectral Anomaly Detection with Attribute and Edge-Preserving Filters. IEEE Trans. Geosci. Remote Sens. 2017, 55, 5600–5611. [Google Scholar] [CrossRef]
- Andika, F.; Rizkinia, M.; Okuda, M. A Hyperspectral Anomaly Detection Algorithm Based on Morphological Profile and Attribute Filter with Band Selection and Automatic Determination of Maximum Area. Remote Sens. 2020, 12, 3387. [Google Scholar] [CrossRef]
Disclaimer/Publisher’s Note: The statements, opinions and data contained in all publications are solely those of the individual author(s) and contributor(s) and not of MDPI and/or the editor(s). MDPI and/or the editor(s) disclaim responsibility for any injury to people or property resulting from any ideas, methods, instructions or products referred to in the content. |
© 2025 by the authors. Licensee MDPI, Basel, Switzerland. This article is an open access article distributed under the terms and conditions of the Creative Commons Attribution (CC BY) license (https://creativecommons.org/licenses/by/4.0/).