Abstract
To address the issue that prototypical networks in existing few-shot text classification methods suffer from performance limitations due to prototype shift and metric constraints, this paper proposes a meta-learning-based few-shot text classification method: Threshold Dynamic Multi-Source Decisive Prototypical Network (TDMP-Net) to solve these problems. This method designs two core components: the threshold dynamic data augmentation module and the multi-source information Decider. Specifically, the threshold dynamic data augmentation module achieves the optimization of the prototype estimation process by leveraging the multi-source information of query set samples, which thereby alleviates the prototype shift problem; meanwhile, the multi-source information Decider performs classification by relying on the multi-source information of the query set, thus alleviating the metric constraint problem. The effectiveness of the proposed method is verified on four benchmark datasets: under the five-way one-shot and five-way five-shot settings, TDMP-Net achieves average accuracies of 78.3% and 86.5%, respectively, which are an average improvement of 3.3 percentage points compared with current state-of-the-art methods. Experimental results show that this TDMP-Net can effectively alleviate the prototype shift problem and metric constraint problems, and has stronger generalization ability.
1. Introduction
Traditional deep learning methods are highly dependent on large-scale labeled datasets for text classification tasks [1]. However, in fields such as medicine [2] where data acquisition costs are high, the problem of sample scarcity severely limits model performance. The scarcity of labeled data not only makes it difficult for models to converge, but also, its high labeling cost becomes a bottleneck for practical applications. Few-shot learning (FSL), which enables rapid convergence through the transfer of prior knowledge, has emerged as an effective approach to address the issue of data scarcity [3,4].
Few-shot text classification (FSTC) aims to achieve accurate recognition of target categories using only an extremely small number of labeled samples [5]. Existing methods primarily focus on four directions: model fine-tuning, data augmentation, transfer learning, and meta-learning, among which meta-learning-based prototype network methods have shown particularly outstanding performance [1,3,6]. This method constructs class prototypes and performs classification using distance metrics through a three-way division mechanism of support set, query set, and validation set. Its core advantage lies in learning intra-class features from a small number of samples and transferring them to new categories [7]. Although this method significantly reduces reliance on the size of datasets, it faces issues of prototype drift and metric constraints during training. Specifically, under few-shot conditions, due to insufficient sample quantity or deviations in data distribution, the computed class prototypes may deviate from the true semantic center; meanwhile, relying solely on distance calculation makes it difficult to fully capture the complex semantic information in text, leading to misclassification [3,7].
Many previous studies have attempted to solve the aforementioned problems. Ren M.Y. et al. [3] adopted the idea of semi-supervised learning, incorporating unlabeled data into the training set to correct class prototypes, thereby alleviating the prototype drift issue. Gao T.Y. et al. [6] utilized sample-level and feature-level attention mechanisms to capture samples and features that are more critical for classification, respectively, and assigned different weights to samples during calculation. Sung F. et al. [8] proposed a relation network, which performs classification by calculating the similarity between the query set and the support set. Hoerl A.E. et al. [9] proposed the FERR method for feature extraction based on ridge regression; the representation coefficients obtained by solving the ridge regression model form a projection matrix for feature extraction. Under few-shot conditions, FERR is more efficient than other supervised feature extraction methods. Wang X. et al. [10] proposed the Task-Aware Feature Embedding Network (TAFE-Net), which uses label embeddings to predict the weights of the data feature extraction model. It decouples high-dimensional weights into low-dimensional vector predictions through weight decomposition technology, significantly reducing the complexity of weight prediction. In addition, this method introduces an embedding loss function to force the alignment of the semantic embedding space and the image embedding space, enhancing the consistency of cross-modal features. Although these methods have alleviated the prototype drift problem to a certain extent, they have not broken through the limitation of a single metric nor fully considered the uncertain factors of the support set.
To address the prototype drift problem and the metric constraint problem, this study proposes a “Threshold Dynamic Multi-Source Decisive Prototypical Network” based on meta-learning frameworks and prototype networks. This network comprises two core modules: the threshold dynamic data augmentation module and the multi-source information Decider. Specifically, this network first constructs an original 3D multi-source information space, which integrates three complementary information dimensions and is designed to overcome the limitations of single-dimensional feature representation in traditional prototype networks. For the prototype drift problem, we adopt multi-source information similarity retrieval as the basic retrieval logic, and on this basis, introduce the “threshold dynamic data augmentation module” to optimize the support set augmentation process. This module dynamically selects R query samples to augment the support set, where a threshold decision algorithm adaptively determines the value of R—thus avoiding the bias of “fixed R value selection” in traditional data augmentation methods for few-shot tasks. For the metric constraint problem, we focus on the imbalance between semantic information and distance information in traditional metric learning. The “multi-source information Decider” quantifies information uncertainty by calculating the entropy value of the query set, and further uses this entropy value to balance the importance of semantic information and distance information. This strategy enables the adaptive adjustment of metric weights, thereby achieving more accurate final category determination.
In summary, the main contributions of this paper are as follows:
- Propose a meta-learning-based Threshold Dynamic Multi-Source Decisive Prototypical Network (TDMP-Net) framework: it constructs a 3D multi-source information space of “semantics–distance–entropy”, provides fundamental architectural support for addressing the two core issues, and breaks the limitation of the single feature space in traditional prototypical networks.
- Design a threshold dynamic data augmentation module: based on multi-source information similarity retrieval, it dynamically selects R query set samples to augment the support set, effectively correcting the prototype deviation problem caused by insufficient samples or data distribution bias.
- Propose a multi-source information Decider: by calculating the entropy value of the query set, it quantifies and balances the importance of semantic information and distance information, breaks away from the limitation of traditional methods that only rely on distance metrics, and solves the metric constraint problem.
- Experimental results on four test datasets show that the proposed method achieves an average improvement of 3.3 percentage points compared to the current state-of-the-art few-shot text classification methods.
2. Related Work
The core challenge of few-shot text classification lies in the scarcity of labeled data, which leads to prototype shift and metric constraint. Existing models exhibit distinct limitations in addressing these two issues, as detailed below.
2.1. Optimization-Based Methods
This category of methods enhances adaptability through cross-task adaptive optimization, but suffers from insufficient handling of prototype shift and metric constraint: MAML [11] achieves rapid adaptation via “inner-loop task adaptation + outer-loop meta-parameter optimization”; in terms of prototype shift, it ignores the distributional heterogeneity of the support set, easily causing prototype bias; in terms of metric constraint, it lacks sample-level similarity measurement and cannot distinguish semantically ambiguous samples. AMGS [12] uses a masked language model (MLM) to calculate gradient similarity for guiding the optimization process; in terms of prototype shift, it involves no prototype estimation or adjustment, failing to alleviate the problem; in terms of metric constraint, it relies solely on task-level gradient information and lacks fine-grained information such as sample semantics or distance. TART [13] converts prototypes into fixed reference points and expands inter-class distances through regularization; in terms of prototype shift, the fixed reference points cannot dynamically adapt to distribution changes, easily exacerbating biases; in terms of metric constraint, it does not consider sample uncertainty and only covers the spatial distance dimension.
2.2. Metric-Based Methods
This category centers on similarity measurement but features a one-sided metric design and unresolved prototype shift: Matching Networks [14] calculate query-support sample similarity using attention; in terms of metric constraint, they only focus on semantics and lack distance/uncertainty dimensions; in terms of prototype shift, they have no explicit prototype concept, and support set bias tends to cause implicit prototype shift. Prototypical Networks [1] take the mean of support set embedding vectors as prototypes and perform classification via Euclidean distance; in terms of prototype shift, the mean is sensitive to outliers with no correction mechanism; in terms of metric constraint, Euclidean distance cannot reflect sample semantic ambiguity.
2.3. Data Augmentation-Based Methods
This category alleviates data scarcity by expanding the support set, but its strategies lack targeting: Protaugment [15] expands the support set by randomly generating text paraphrases; in terms of prototype shift, low-quality (redundant/biased) samples exacerbate prototype deviation; in terms of metric constraint, it does not optimize similarity measurement criteria. DE [16] assumes classes follow a Gaussian distribution, and estimates parameters to generate samples; in terms of prototype shift, the distribution assumption is inconsistent with real text data, leading to inaccurate prototype estimation; in terms of metric constraint, it lacks sample uncertainty guidance, resulting in weak robustness.
3. Problem Formulation
The meta-learning paradigm for few-shot text classification operates within the task framework of N-way K-shot. Under this setup, each task consists of N classes, with each class containing K support samples. Specifically, the dataset is divided into two disjoint subsets: a source class set and a target class set, where the source class set and target class set are mutually exclusive. The meta-learning process typically unfolds in two phases: the meta-training phase and the meta-testing phase.
3.1. Meta-Training Phase
During meta-training, the model is trained on multiple tasks. For each task, N classes are sampled from the training set. From each of these classes, K labeled instances are selected to form the support set S, and an additional M instances are chosen to create the query set Q. The formal definitions of the support set S and query set Q are as follows:
where X denotes the input text and Y represents the corresponding class label. The model learns to predict the labels of the query set Q using the provided support set S. Subsequently, the model parameters are updated by minimizing the loss computed on the query set Q.
3.2. Meta-Testing Phase
During meta-testing, the model is evaluated on unseen tasks derived from the target class set—these tasks are distinct from those used in training. For each test task, N unseen classes are sampled. The support set and query set are constructed in the same manner as in the meta-training phase. The performance of the model is evaluated based on the average classification accuracy on the query sets Q across all test tasks.
4. Method
4.1. TDMP-Net
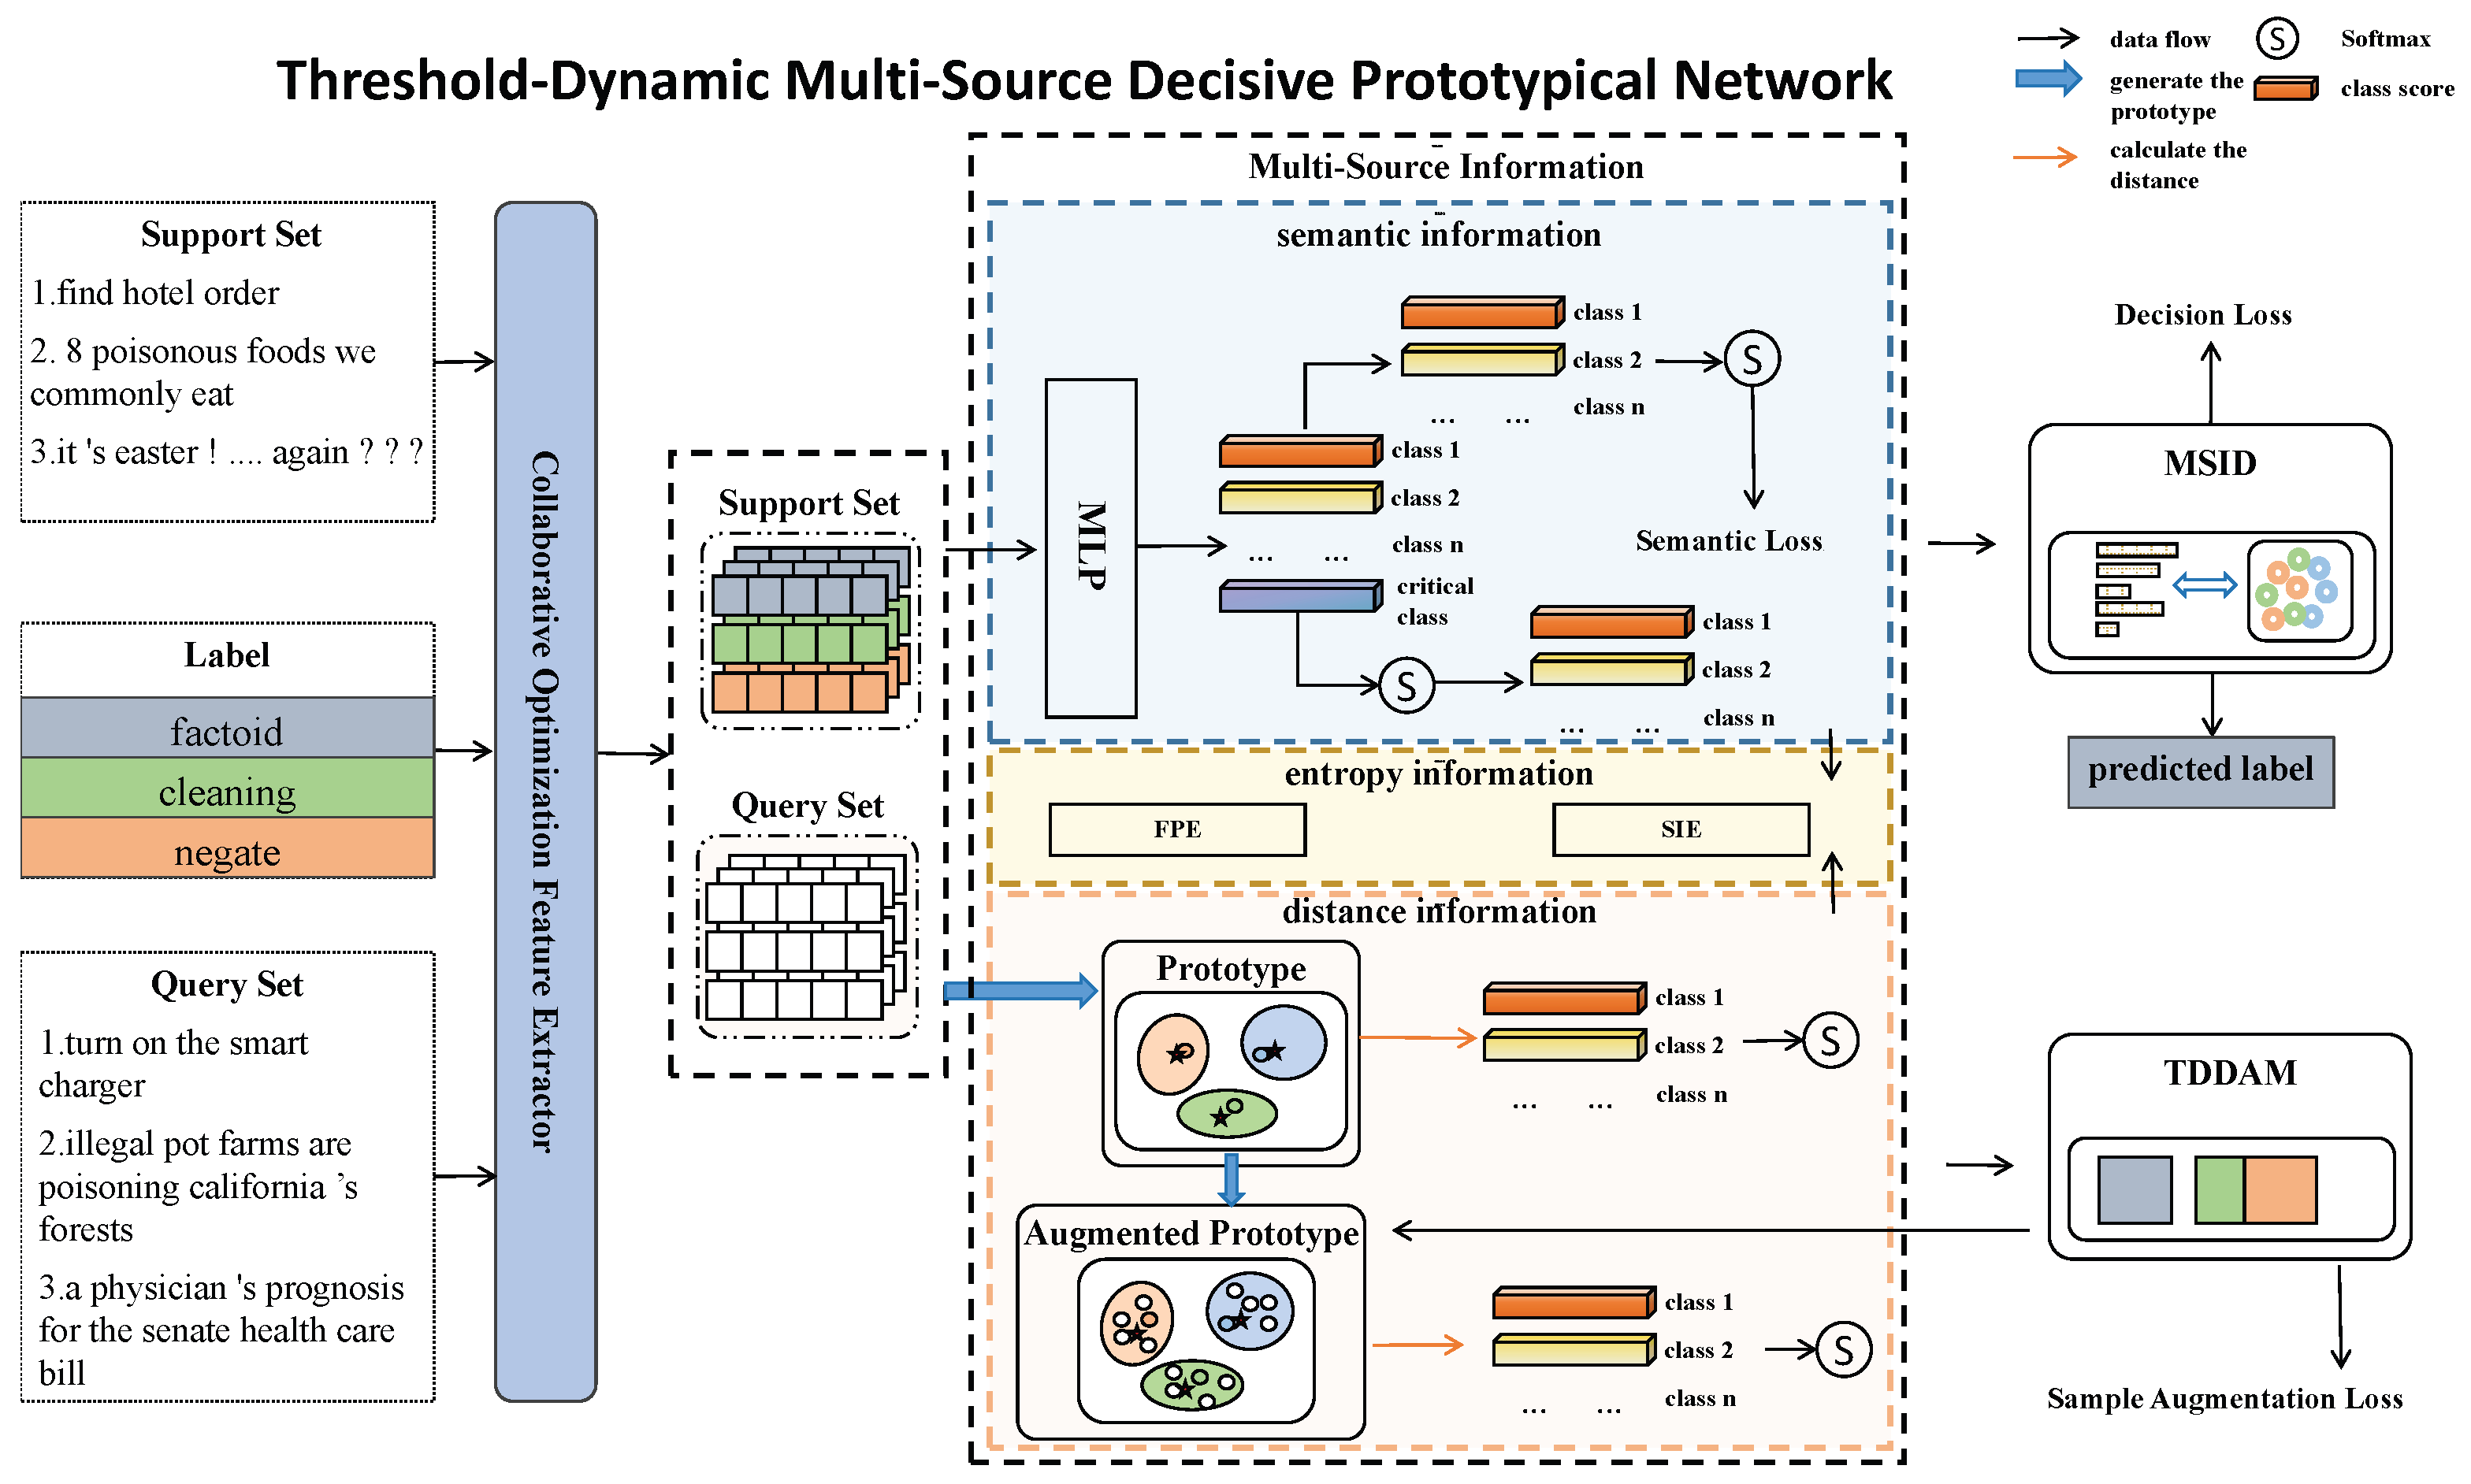
As illustrated in Figure 1, the architecture of the Threshold Dynamic Multi-Source Decisive Prototypical Network (TDMP-Net) comprises primarily four components: (1) collaborative optimization feature extractor, (2) 3D multi-source information space, (3) threshold dynamic data augmentation module, and (4) multi-source information decision. Each of these components is elaborated on in detail in the following sections.
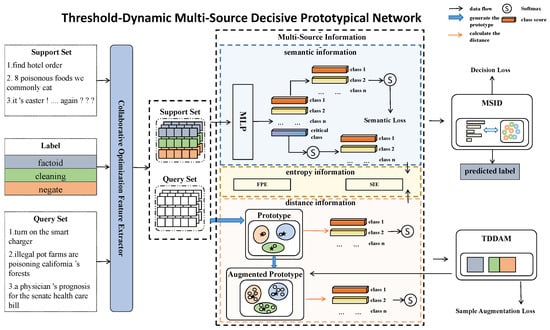
Figure 1.
TDMP-Net: Threshold Dynamic Multi-Source Decisive Prototypical Network model architecture diagram.
4.2. Collaborative Optimization Extractor
The Collaborative Optimization Extractor (COE) serves as the foundation of the TDMP-Net architecture, responsible for converting raw input text into semantically rich representations. In this method, a pre-trained BERT model [17] is employed as the feature extractor. To incorporate label information, a concatenation method is adopted.
Consider an N-way K-shot sample task, which contains m query samples. Support samples are denoted as , query samples as , and label samples as . The support set combined with labels is denoted as , while the query set combined with labels is denoted as .
These sets are then input into the feature extractor, yielding and . Here, denotes the resulting feature matrix, where n represents the sequence length and d denotes the feature dimension. Specifically, stands for the feature set of support samples, and stands for the feature set of query samples.
4.3. Multi-Source Information Space
TDMP-Net constructs a 3D multi-source information space of “semantics–distance–entropy”, and specifically, this process completes the extraction of dimensional information in three steps: for “distance information”, first calculate the mean value of the class features of support set samples output by the collaborative optimization feature extractor to obtain class prototypes, then calculate the distance between query set samples and class prototypes, which serves as the “distance information” in the 3D space; for “semantic information”, process the features of support set samples through a feedforward neural network and subsequently predict the class scores of the query set, with these scores used as the “semantic information” in the 3D space; and for “entropy information”, based on the previously obtained distance information and semantic information, calculate the fused feature entropy of the two, and this entropy value is taken as the “entropy information” in the 3D space to quantify the uncertainty of feature distribution.
4.3.1. Distance Information
For class j, the class prototype is obtained by calculating the average of feature representations of all samples belonging to this class:
where denotes the feature of the i-th sample in class j. The classification probability that the query sample belongs to class j is
represents the distance information vector of the query sample , where each element corresponds to the probability that the query belongs to one of the n classes: .
4.3.2. Semantic Information
For class j, the semantic information is defined as
where denotes the classifier function with parameters . represents the semantic information vector of the query sample , where each element corresponds to the probability that the query belongs to one of the n classes: .
To estimate the class center more accurately and reduce the interference of critical samples, we introduce a critical sample classification mechanism to estimate the critical score of samples. Specifically, for n-class query samples, the semantic enhancement module introduces a critical class decision: the first n classes represent the probabilities that the query sample belongs to each class, and the -th class represents the probability that the query sample belongs to the critical class. In the threshold dynamic data augmentation module, we input the semantic information of the first n classes, where the sum of probabilities of the classes is 1, i.e., . In the multi-source information decision, we input n classes, where the sum of probabilities of the n classes is 1, i.e., . The critical class mechanism effectively reduces the weight of critical samples in prototype estimation, thereby estimating the class center more accurately.
4.3.3. Entropy Information
To fully quantify the uncertainty of query samples in the multi-source information space and provide support for subsequent module decisions, TDMP-Net designs two typical entropy calculation paradigms, each corresponding to different uncertainty management requirements.
Fused Probability Entropy (FPE). This paradigm first fuses the probability distributions of distance information and semantic information into a unified fused distribution, then calculates the entropy of this fused distribution. Its core is to quantify the overall uncertainty of the query sample in the comprehensive feature space and output a single entropy value to reflect the global ambiguity. The fused probability that the query sample belongs to class j is defined as
where to ensure the validity of the probability distribution. is a hyperparameter that can adjust the importance of distance information and semantic information according to task characteristics. Subsequently, the Shannon entropy of the fused probability vector is calculated and taken as the FPE , which is used to quantify the overall uncertainty of the query sample:
where the physical meaning of is clear: a higher value indicates stronger ambiguity in the sample’s class attribution in the distance–semantic joint space, while a lower value means the sample’s class attribution is more certain. This entropy is mainly applied in the threshold dynamic data augmentation module: it serves as the core threshold criterion to screen samples. Specifically, if is lower, it indicates that the sample has high confidence in class determination, and the sample is incorporated into the support set augmentation process. This helps correct the class prototype drift caused by insufficient support set samples or distribution bias.
Source Information Entropy (SIE). This paradigm first calculates the entropy of each information source independently, then quantifies the relative uncertainty differences between sources through the ratio of the two entropies. Its core is to evaluate the reliability of each information source and guide the weight adjustment of multi-source features. First, the entropy of the distance information vector (denoted as ) and the entropy of the semantic information vector (denoted as ) are calculated separately:
This information is mainly used in the multi-source information decision (MSID): it guides the dynamic adjustment of feature weights. For example, when , the MSID assigns a higher weight to to avoid classification errors caused by unreliable distance metrics; conversely, the MSID increases the weight of to leverage the stability of prototype-based classification.
The two entropy calculation methods are not mutually exclusive but form a complementary uncertainty management mechanism in TDMP-Net: the FPE provides a global uncertainty indicator for screening samples that need augmentation, solving the prototype drift problem; the SIE provides a local reliability metric for balancing multi-source feature weights, solving the metric constraint problem.
4.3.4. Threshold Dynamic Data Augmentation Module
To address the prototype drift problem, the threshold dynamic data augmentation module (TDDAM) is designed based on the transductive few-shot learning assumption. Via multi-source information, the module filters out query set samples similar to the support set, and further leverages such similar query samples to augment support prototypes, ultimately improving the accuracy of class prototype estimation.
We retrieve the most similar R samples from the query set Q for each support sample in , the support set of class c. The objective of this retrieval is defined as
where denotes the set of class indices, and represents the similarity metric between the query set Q and the support set . The retrieved similar samples satisfy the following screening condition:
where denotes the set of feasible transport plans, is the distance metric between samples, C is the cost matrix, T is the transport plan, and denotes the inner product of C and T. The final set of retrieved similar samples is expressed as
The cost C is a cost matrix, where each element represents the matching cost between the i-th query sample and the j-th support sample . Physically, this cost is the ratio of matching confidence to prediction certainty, which characterizes the matching reliability of sample pairs by coupling the two dimensions of “confidence” and “prediction certainty” while avoiding the drawback that a single probability index is susceptible to noise interference, and its calculation is as follows:
The denominator in the formula represents the entropy of the fused probability distribution (formed by combining the semantic enhancement module probability and the prototype branch probability ). The negative sign ensures the entropy is non-negative, which conforms to the definition of information entropy.
A threshold determination method based on statistical distribution is used to calculate R (the number of similar samples to retrieve). The core idea of this method is to construct a threshold using the mean and standard deviation of sample data, count the number of samples that meet the threshold condition, and finally compute the average and convert it to an integer as R:
where m is the number of query samples, n is a learnable parameter, is the mean of the cost matrix, calculated as (where k is the number of support samples), and is the standard deviation of the cost matrix, calculated as ; is an indicator function, defined as
where denotes the i-th element in the cost matrix C.
Subsequently, an optimal transport plan is established between the support set and the query set Q using the augmented information . This transport plan is denoted as and is calculated using the Sinkhorn algorithm [18]. Then, the augmented information from the query set is adapted to the task through barycentric mapping, which minimizes the total transport cost. The augmented support set is calculated as follows.
First, the adapted representation of each augmented sample is determined by minimizing the total transport cost:
where is an element of the optimal transport plan , and denotes the cost associated with the augmented sample set .
The solution to this minimization problem corresponds to the weighted average of the support samples , leading to the final augmented support set:
where denotes a diagonal matrix constructed from the input vector, is a column vector of ones with length (number of samples in ), and the superscript denotes matrix inversion.
After adapting the augmented information , we combine it with the original support sample representations to compute the final class prototype for class c:
where denotes the union of the original support set and the augmented support set , and denotes the operation of computing the average of sample features in the set.
4.3.5. Multi-Source Information Decision
To address the metric constraint problem, this paper proposes a multi-source information decision (MSID), which realizes multi-source information through an uncertainty-guided weight mechanism.
The final predicted value is calculated as follows:
In this formula, denotes the predicted class label of the query sample . represents the entropy of the prototype branch probability of sample , defined as
where (the entropy of the semantic enhancement module probability) follows the same definition, i.e., . The entropy term quantifies the uncertainty of the prediction results of each branch, and the weighted fusion based on entropy enables the model to adaptively adjust the contribution of the two branches according to the prediction reliability.
4.4. Optimization Objective
This study adopts the cross-entropy function as the core loss metric, whose theoretical basis stems from information theory. In classification tasks, cross-entropy serves as a well-established indicator for quantifying the discrepancy between two probability distributions, and it can directly reflect the degree of deviation between the predicted distribution and the true label distribution. To achieve comprehensive optimization of the model, this paper designs three task-specific loss terms tailored to the learning objectives of each core component of the network; these loss terms are fused using uncertainty weights [19], jointly forming the overall optimization objective.
4.4.1. Semantic Loss
To quantify the difference between the predicted probabilities of the semantic enhancement module and the true labels, this study adopts the cross-entropy loss, which is theoretically grounded in information theory and can measure the Kullback–Leibler (KL) divergence between the true label distribution and the predicted distribution. For each sample with true label (where denotes the true label distribution, typically a one-hot vector), the semantic loss is defined as
where represents the predicted probability distribution of the semantic enhancement module for sample .
4.4.2. Sample Augmentation Loss
To measure the discrepancy between the predicted probabilities of augmented samples (screened by the entropy-threshold dynamic augmentation module) and their true labels, this study employs the cross-entropy loss for the screened augmented samples. This is intended to improve the prediction accuracy of the screened samples, thereby enabling class prototypes to be closer to class centers after calibration. For each augmented sample with true label , the sample augmentation loss is calculated as
In the formula, the numerator represents the fused probability of the j-th class, and the denominator denotes the entropy of the fused probability distribution.
4.4.3. Decision Loss
To evaluate the discrepancy between the final predicted probabilities output by the entropy-weighted Decider and the true labels, this study employs the cross-entropy loss, which is theoretically grounded in information theory. For each sample with true label , the decision loss is formulated as
4.4.4. Overall Loss Function
The total optimization objective integrates the three aforementioned loss terms using uncertainty weights [19]. These weights are learnable parameters that can automatically adjust their contributions based on the reliability of the training signals for each loss term—specifically, loss terms with smaller gradient variance are assigned larger weights. This avoids heuristic manual parameter tuning and thus enhances training stability:
where , , and are learnable uncertainty weights that prioritize loss terms with more reliable training signals.
4.5. Asymptotic Complexity and Bottleneck Analysis
This section presents an asymptotic complexity analysis and bottleneck evaluation of TDMP-Net. The computational complexity of TDMP-Net is predominantly governed by the COE, which is built upon the BERT pre-trained model with 12 Transformer layers, 12 self-attention heads, and a hidden dimension of 768. The experiments follow the 5-way 1-shot and 5-way 5-shot settings, with 25 query samples per class. Given 5 classes, the total number of query samples per task is , where and .
From a complexity decomposition perspective, the computational load of the COE dominates the total computational load of the model. Its complexity arises from the self-attention mechanism and feed-forward networks within the Transformer layers. The computational cost for encoding a single text sequence is where , , , and . For a single task, the total COE complexity, considering both support samples (, with or 5) and query samples (), is Substituting the parameter values, the computational scale reaches approximately operations, making COE the dominant component in terms of model complexity. In contrast, the Threshold-based Dynamic Data Augmentation Module (TDDAM) has a complexity of , and the multi-source information decisioner operates at . Both are significantly less complex than COE, thus having limited impact on the total complexity.
From a bottleneck analysis standpoint, the computation and memory constraints of COE constitute the primary bottlenecks: The self-attention component in BERT, particularly the term, is highly sensitive to the input sequence length L. Combined with the 12-layer Transformer structure, this significantly amplifies the computational overhead; the BERT model contains approximately 110M parameters. When stored in FP32 precision and combined with the AdamW optimizer states, it demands substantial memory. Furthermore, processing longer sequences or larger batches often causes out-of-memory errors.
To effectively control complexity and mitigate the computational and memory bottlenecks of COE, we adopt a text truncation strategy to 200 tokens. Given the characteristics of the experimental datasets, 200 tokens are sufficient to preserve the core semantic content, avoiding significant information loss. At the same time, this strategy reduces the term in the self-attention computation, effectively lowering the computational cost of COE, while also decreasing the memory footprint associated with caching sample features.
5. Results
5.1. Dataset
Following the experimental protocol of Chen et al. [20], we evaluate our approach on four widely used benchmark datasets for text classification: HuffPost [21], Amazon Reviews [22], Reuters [23], and 20News [23]. The HuffPost dataset contains approximately 36,000 news headlines collected from 2012 to 2018, spanning 41 trending social categories such as politics, technology, and entertainment. As headlines are concise yet information-dense, this dataset is particularly suitable for studying short-text semantic classification and sentiment analysis. The Amazon Reviews dataset consists of over 140 million product reviews from 1996 to 2014, covering 24 major categories including electronics, books, and home goods. Each review provides not only detailed textual feedback but also structured metadata such as star ratings, offering rich resources for fine-grained sentiment analysis and consumer behavior modeling. The Reuters dataset, derived from the 1987 Reuters Newswire, includes approximately 21,000 short news articles organized into 135 thematic categories, such as finance, politics, and energy. Characterized by its professional content and domain-specific terminology, this dataset has long been a standard benchmark for research in text classification, topic modeling, and information retrieval. The 20News dataset comprises 18,828 Usenet newsgroup posts from the 1990s, divided into 20 categories such as computer technology, religion, and sports. Compared with Reuters, the 20News dataset reflects more natural and colloquial discussion scenarios, featuring diverse language styles and informal user-generated content.
The average length, sample size, and data split of these four datasets are shown in Table 1.

Table 1.
Dataset statistics.
5.2. Comparison Models
Our method is compared with several well-established few-shot learning models, summarized as follows:
- PN [7]: Uses the mean value of support set features as the class prototype center, and calculates the similarity between query instances and class prototypes using Euclidean distance.
- MAML [11]: Proposes a two-level optimization mechanism for meta-learning, which uses meta-learning to optimize an initial model that can be fine-tuned for specific tasks.
- ContrastNet [20]: In a contrastive learning setup based on BERT representations, it uses instance-level regularization loss to bring different augmented views of the same sample closer and push views of different samples further apart; within each few-shot task, it uses task-level regularization loss to align the feature distribution of support set prototypes with query set samples.
- ProtoVerb [24]: Introduces contrastive loss into prompt learning to refine class prototypes.
- Shot-DE [16]: Adjusts data distribution using the nearest query samples; for each sample, new samples are generated using its nearest neighbor query samples in the feature space.
- TART [13]: Proposes to learn a linear transformation matrix for each task, converting class prototypes into task-adaptive reference points in the metric space.
- SPContrastNet [25]: Adopts a self-contrastive learning framework that dynamically adjusts contrastive objectives based on sample difficulty, and enhances prototype estimation in few-shot tasks by iteratively refining feature representations.
- ICDE-PN [26]: Employs category dimension-based multi-scale feature learning and an efficient channel attention mechanism, which enhances the generalization ability of few-shot text classification by expanding the inter-class distance in the embedding space and suppressing sample noise.
5.3. Evaluation Metrics and Parameter Settings
Following the method of Chen et al. [27], Accuracy (ACC) is used to evaluate model performance. The calculation formula is
where N is the total number of test samples, and is an indicator function, defined as 1 if , and 0 otherwise. All reported results are the average of three independent runs, with random resampling of training, validation, and test classes in each run.
The experimental settings largely follow Chen et al. [27] for five-way one-shot and five-way five-shot tasks. During each training process, 100 training tasks, 100 test tasks, and 1000 validation tasks are randomly sampled, with the random seed fixed at 802 to ensure reproducibility. The AdamW optimizer is employed with a learning rate of . An early stopping strategy is applied: training is terminated if the validation performance does not improve for 20 consecutive epochs, with the best-performing model checkpoint preserved for testing. All experiments are conducted on an NVIDIA RTX A6000 GPU, achieving a processing speed of approximately 20 epochs per hour. For news and review classification tasks, each class within a task is associated with 25 query samples. Regarding text representation, we adopt the pre-trained “bert-base-uncased” model as the embedding layer; to mitigate overfitting, the parameters of the first six transformer layers are frozen. Input text is truncated to a maximum of 200 tokens, and the [CLS] token embedding is used to represent sentence-level semantics.
5.4. Comparative Experiments
Table 2 presents the results of TDMP-Net on the HuffPost and Amazon datasets, Table 3 shows the results on the Reuters and 20News datasets, and Table 4 displays the average results of TDMP-Net across all four datasets. All reported values are in percentages.

Table 2.
TDMP-Net’s results of few-shot text classification task on the HuffPost and Amazon datasets.

Table 3.
TDMP-Net’s results of few-shot text classification task on the Reuters and 20News datasets.

Table 4.
TDMP-Net’s average results of few-shot text classification task on four datasets.
In Table 2, the SPContrastNet method [25] achieves an accuracy of 53.3% on the HuffPost dataset under the one-shot setting using contrastive learning. However, its ability to model semantic ambiguity in short texts is still insufficient. The proposed TDMP-Net method reaches accuracies of 59.2% (five-way one-shot) and 74.1% (five-way five-shot) on HuffPost, representing improvements of 5.9 and 8.6 percentage points compared to SPContrastNet, respectively. For the Amazon Reviews dataset, TDMP-Net outperforms the current state-of-the-art method with an accuracy of 81.4% under the five-way one-shot scenario, and achieves 89.2% accuracy under the five-shot scenario.
Table 3 shows the comparative results on the Reuters and 20News datasets. In the one-shot task on Reuters, TDMP-Net significantly outperforms the optimal method with an accuracy of 93.8%, and its five-way five-shot performance reaches 95.8%. Given the colloquial and diverse nature of the 20News dataset, TDMP-Net demonstrates strong generalization ability, achieving accuracies of 78.5% (five-way one-shot) and 86.9% five-way five-shot).
Table 4 presents the average performance metrics of all models across the four benchmark datasets. The results show that TDMP-Net achieves 78.3% (five-way one-shot) and 86.5% (five-way five-shot) accuracy, ranking first among all methods. This fully demonstrates its strong generalization ability in few-shot scenarios, particularly its enhanced discriminative power and stability under low-resource conditions.
TDMP-Net alleviates the prototype drift problem by dynamically selecting query samples to augment the support set via the threshold dynamic data augmentation module, thereby reducing distribution deviations. Additionally, TDMP-Net breaks through the limitation of metric constraints by enabling the capture of fine-grained multi-source information in long texts through the multi-source information decision. This indicates that entropy-guided multi-source information has significant advantages in mitigating prototype drift and overcoming metric constraints.
5.5. Ablation Experiments
To verify the effectiveness of the core components of the TDMP-Net model—namely the threshold dynamic data augmentation module (TDDAM) and multi-source information decision (MSID)—ablation experiments are conducted on both review and news datasets. The experiments cover two typical few-shot scenarios: five-way one-shot and five-way five-shot. By comparing the full model (TDMP-Net) with variants that remove specific components (TDMP-Net\MSID, TDMP-Net\TDDAM), the contribution of each module to model performance is systematically evaluated.
As observed in Table 5 and Table 6, removing either component leads to performance degradation, demonstrating the effectiveness of both the MSID and TDDAM modules. Particularly, when the TDDAM component is removed in the one-shot task on the 20News dataset, the performance drops by seven percentage points—highlighting TDDAM’s critical role in low-resource scenarios. Through horizontal comparison, it is found that the TDDAM component contributes significantly in tasks with more samples, especially in the five-way five-shot scenario, where it realizes prototype recalibration via the query set, which improves the clarity of classification boundaries and alleviates the prototype drift problem. The MSID component, on the other hand, plays a decisive role in time-sensitive data: it leverages multi-source information (including semantic information, distance information, and entropy information) of sample text for comprehensive discrimination, breaking through the limitations of metric constraints.

Table 5.
TDMP-Net ablation study results on HuffPost and Amazon datasets.

Table 6.
TDMP-Net ablation study results on Reuters and 20News datasets.
5.6. Sensitivity Analysis
5.6.1. Parameter N
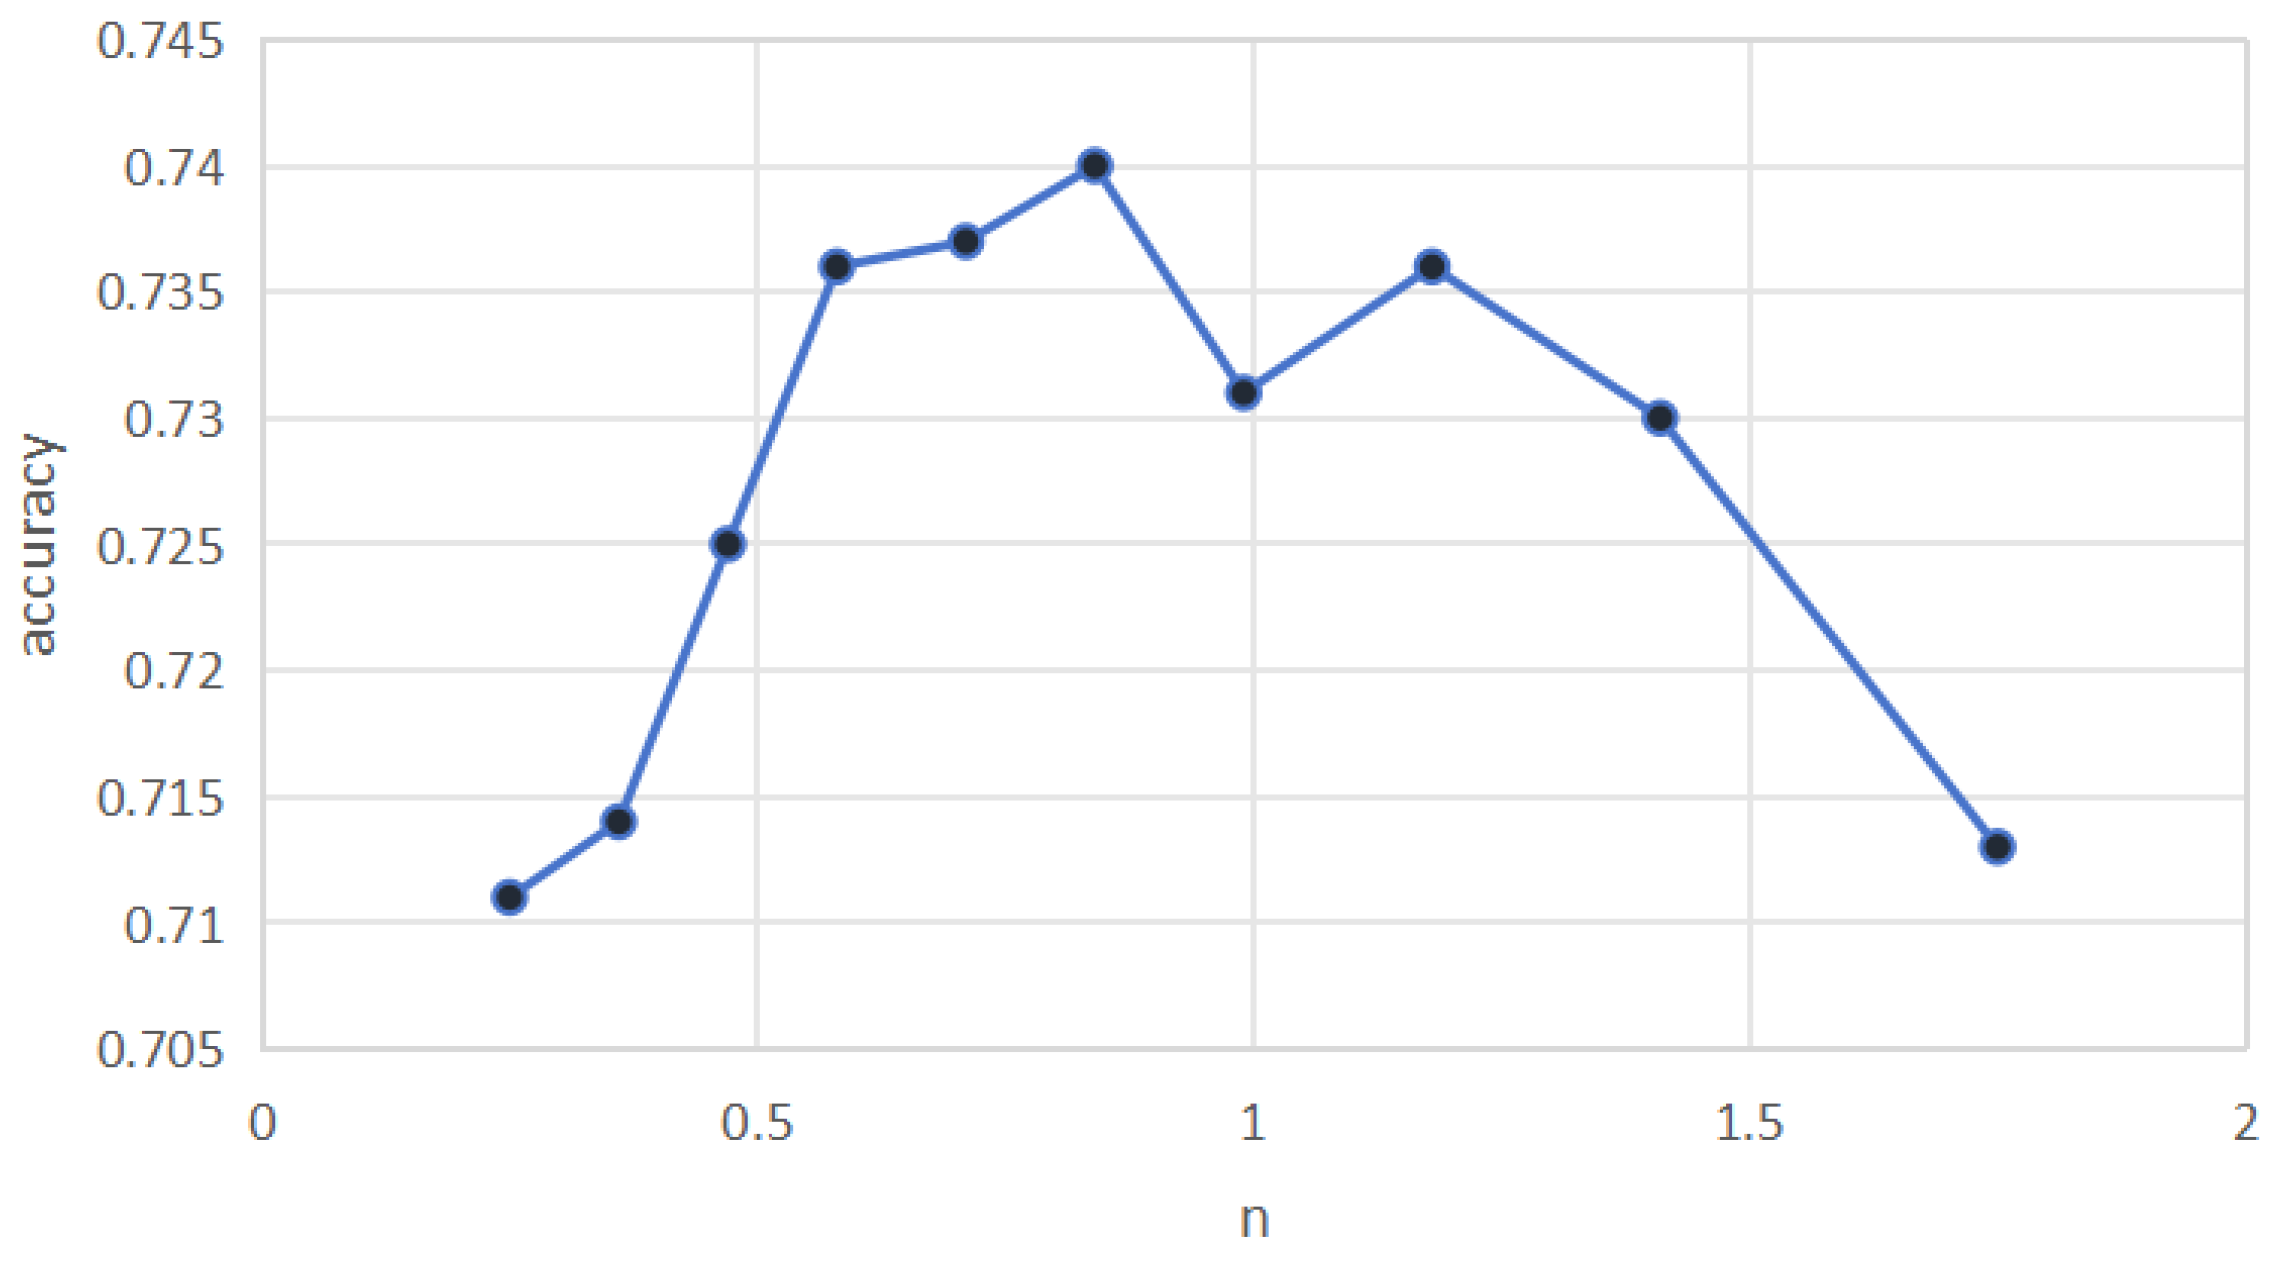
Parameter n is a core hyperparameter of TDDAM, as it directly determines the number of query samples selected for prototype refinement. To identify the optimal configuration and evaluate the model’s robustness, we conduct a sensitivity analysis of n on the HuffPost five-way five-shot dataset, with classification accuracy as the evaluation metric. The value of n is varied within the range . As shown in Figure 2, the performance exhibits a “rise–fall” trend: accuracy reaches its peak when ; for small values of n, the limited number of query samples provides insufficient correction to the prototypes, leading to biased estimates and lower accuracy; for large values of n, the inclusion of excessive noisy or weakly related samples causes prototype drift, which interferes with classification and results in performance degradation.
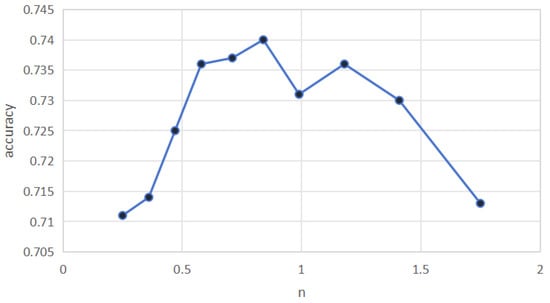
Figure 2.
Parameter sensitivity of n on HuffPost.
5.6.2. Parameter
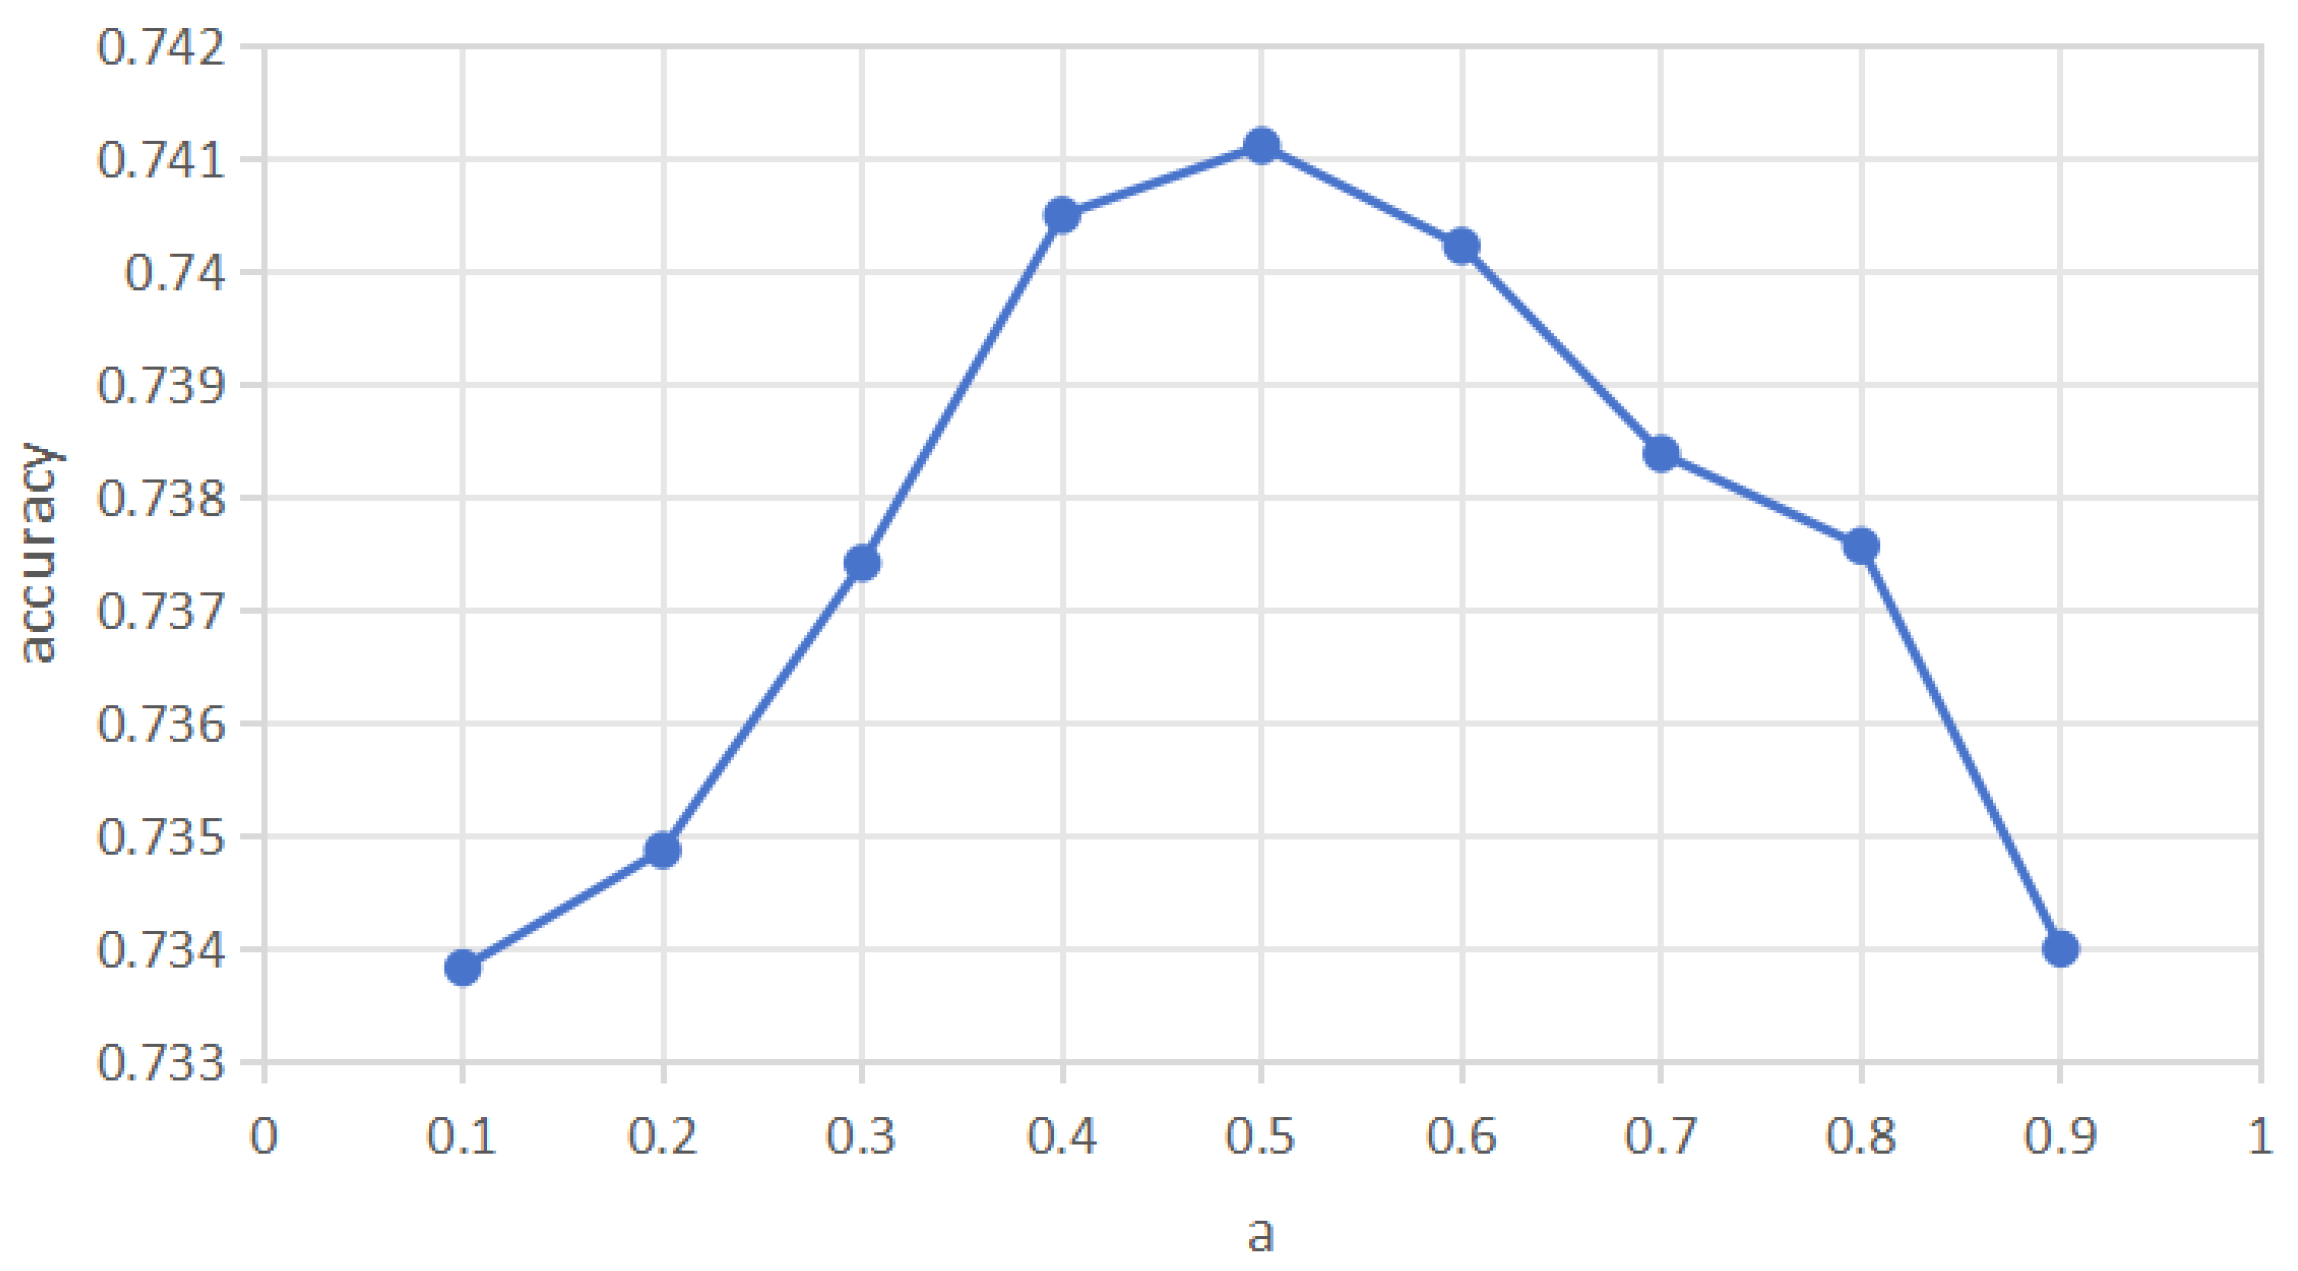
To investigate the impact of the parameter that balances the contributions of the prototype branch and the semantic branch on the model performance, this section fixes other experimental settings and only adjusts the value of . Sensitivity analysis is conducted on the five-way five-shot task of the HuffPost dataset, and the results are shown in Figure 3. It can be seen from the results that the model accuracy first increases and then decreases as a changes, reaching a peak when . This trend indicates that the value of a needs to find a balance between the weights of the prototype branch and the semantic branch: if is too small or too large, the contribution of one branch will be excessively weakened or over-strengthened, leading to a decline in the information fusion effect; while when , the information of the two branches can complement each other more efficiently, enabling the model to achieve the best performance in few-shot classification tasks.
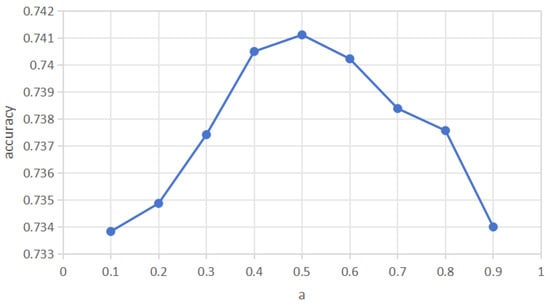
Figure 3.
Parameter sensitivity of on HuffPost.
5.7. Additional Experiments
To verify the effectiveness of the proposed semantic enhancement module, this study selects ridge regression (RR) [9] as the baseline for comparative experiments. RR is chosen because it exhibits distinct advantages that make it a suitable reference for evaluating semantic enhancement: first, RR can effectively alleviate the issue of feature multicollinearity, which is common in text semantic feature representation tasks, ensuring stable output of semantic-related predictions; second, in low-resource scenarios, RR maintains relatively robust generalization performance with simple model structure, avoiding the interference of complex model biases on the validation of the semantic enhancement module’s effectiveness. Based on this, the study conducts comparative experiments between TDMP-Net and the baseline model in which the semantic information acquisition method is replaced with RR within TDMP-Net. The experimental results of the two methods on the HuffPost dataset are shown in Table 7.

Table 7.
FSTC task results of TDMP-Net and RR on the HuffPost dataset.
In the few-shot scenarios on the HuffPost news dataset, TDMP-Net achieves accuracies of 59.2% (five-way one-shot) and 74.1% (five-way five-shot), realizing a stable improvement over the RR baseline. The experimental results further confirm the advantage of TDMP-Net in semantic feature extraction and its scale effect: when the sample size increases to the five-shot setting, the performance advantage of TDMP-Net expands to 0.7 percentage points, verifying the adaptability of deep semantic encoding to data scale.
5.8. Visualization
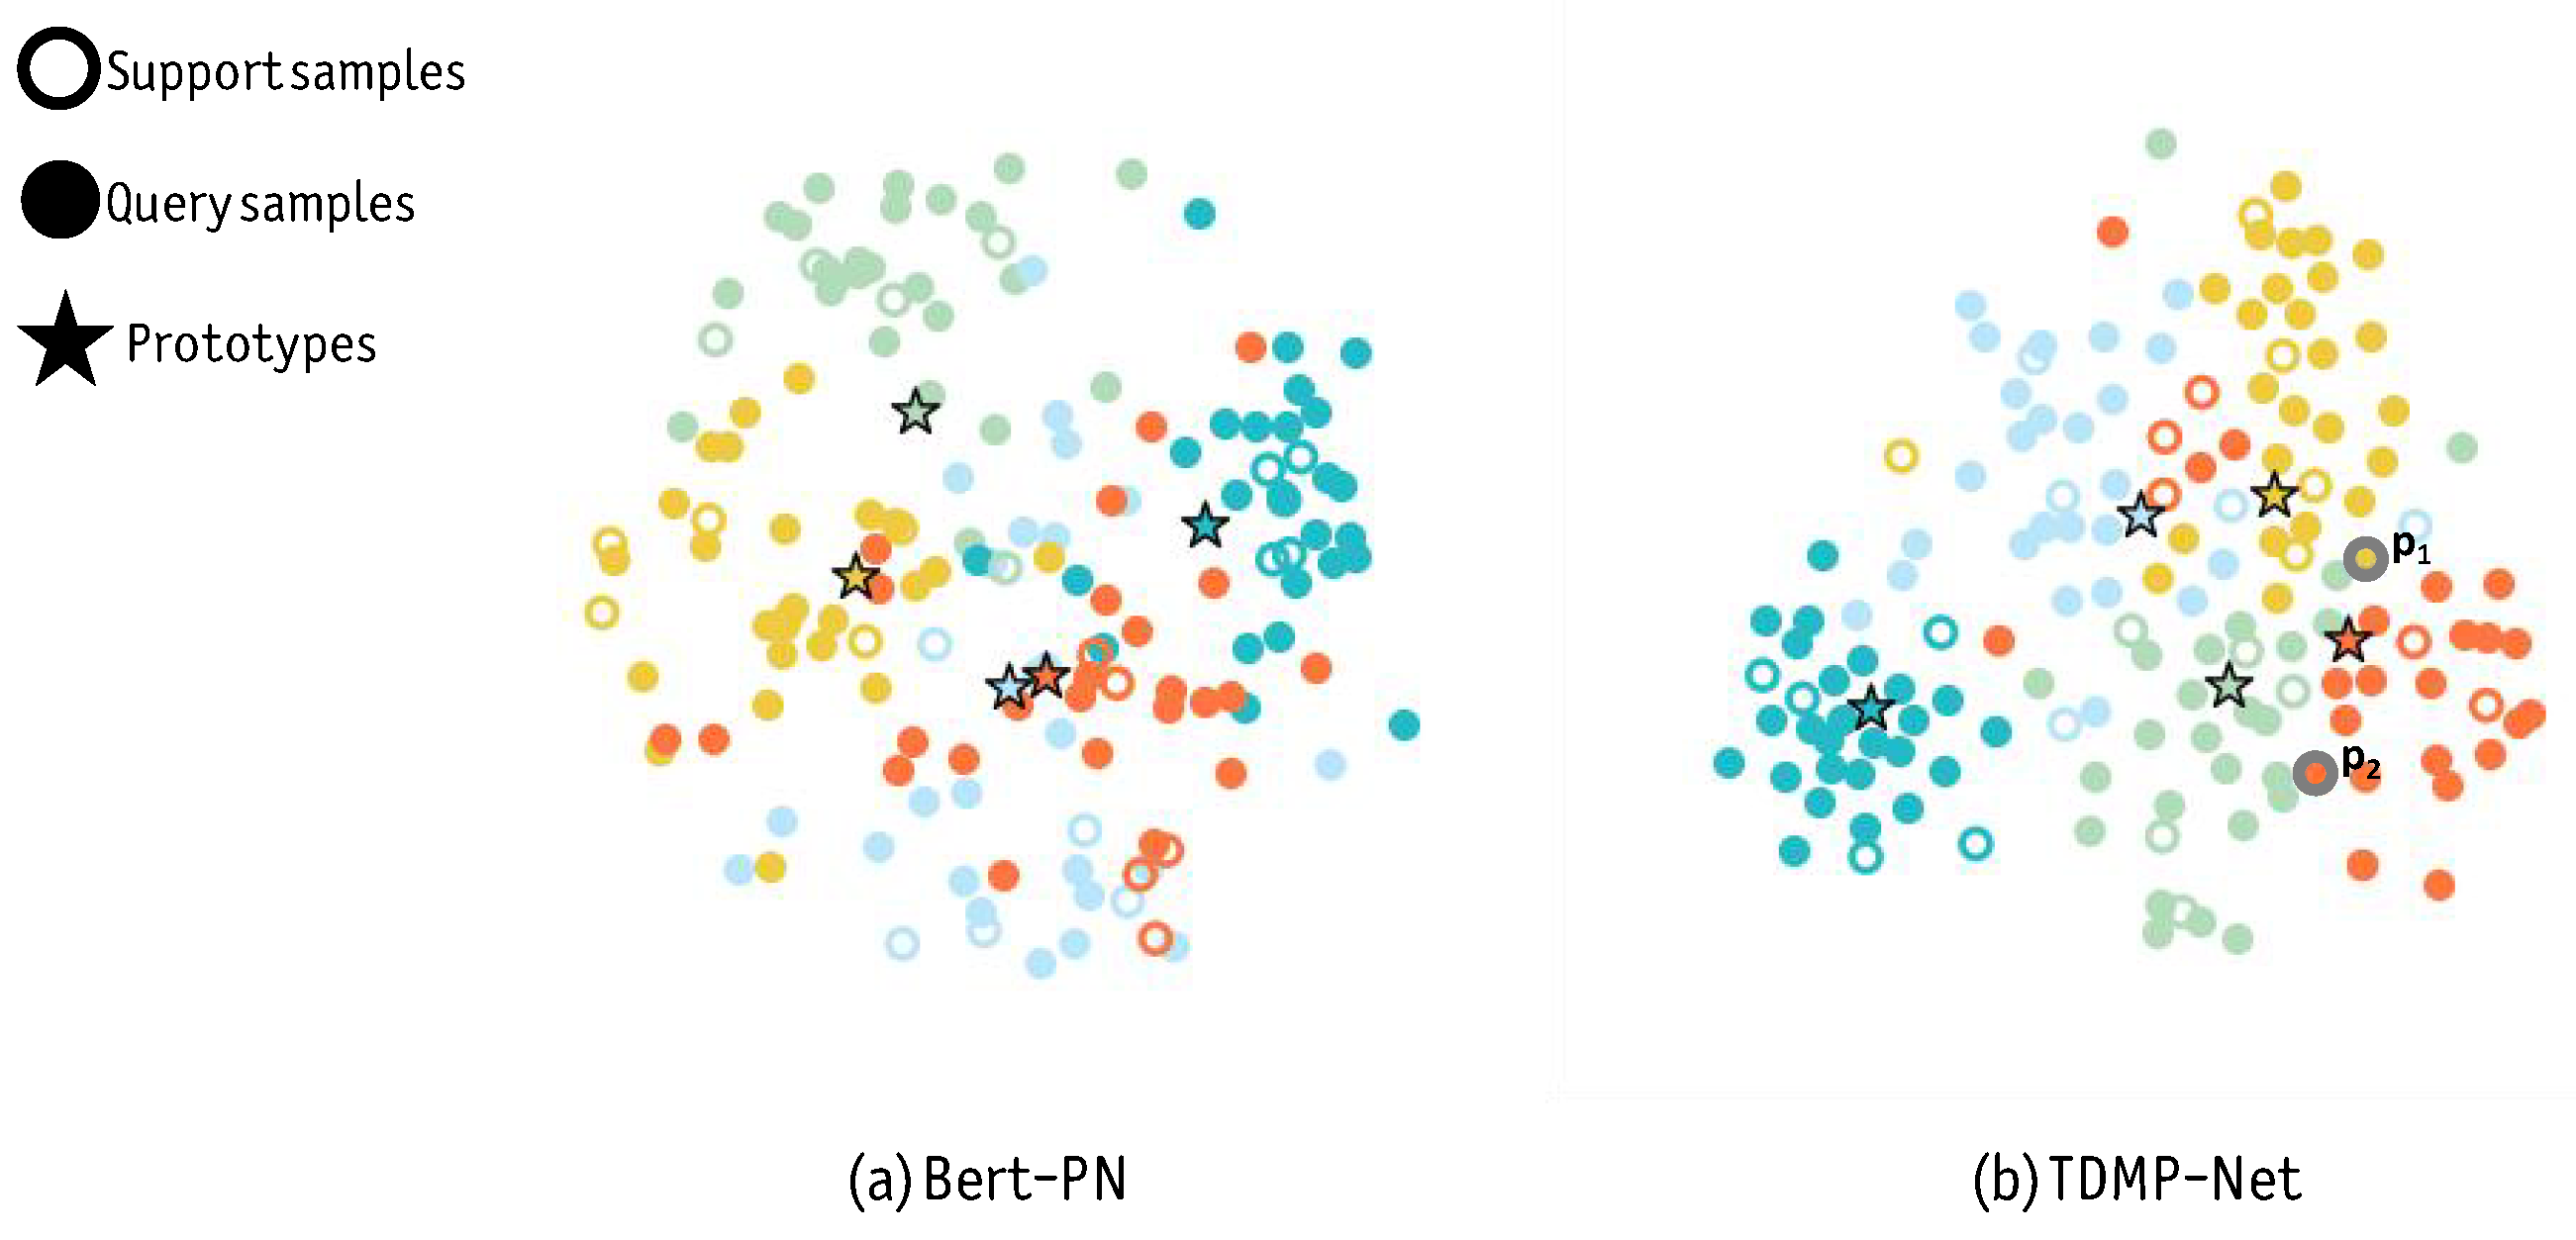
To investigate the model’s performance in generating more optimal prototypes and enhancing discriminative ability, we employ the t-SNE method [28] to visualize the sample representations and class prototypes generated by Bert-PN and TDMP-Net. We select Bert-PN as the comparative baseline because it represents a classic prototype-based framework in few-shot text classification: as a typical integration of BERT and the prototype network, Bert-PN employs a straightforward mechanism, which mainly relies on distance metrics between samples and class prototypes for classification—thus serving as a standard reference for assessing improvements in prototype-based models. Five classes are randomly selected from the HuffPost dataset; for each class, five samples are used as the support set, and 150 samples as the query set. The visualization results of sample representations are shown in Figure 4.
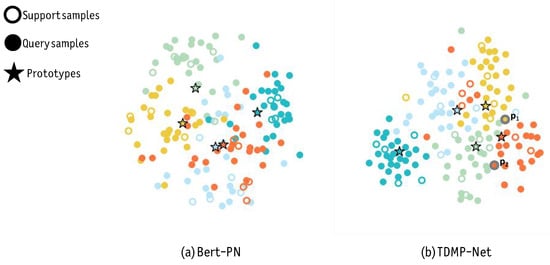
Figure 4.
Visualization of sample representations sampled from five novel classes on the HuffPost dataset.
It can be observed that, compared with the sample representations generated by the standard Bert-PN in Figure 4a, the sample representations generated by TDMP-Net in Figure 4b have higher discriminability—with smaller intra-class differences and larger inter-class gaps. This indicates that TDMP-Net can alleviate the prototype drift problem. Taking two points and in Figure 4b as examples, point is closer to the red prototype but is correctly classified into the yellow class; point is closer to the green prototype but is correctly classified into the red class. This demonstrates that TDMP-Net does not rely solely on distance-based information for classification, but also integrates semantic and other multi-source information to improve decision-making, thereby solving the metric constraint problem.
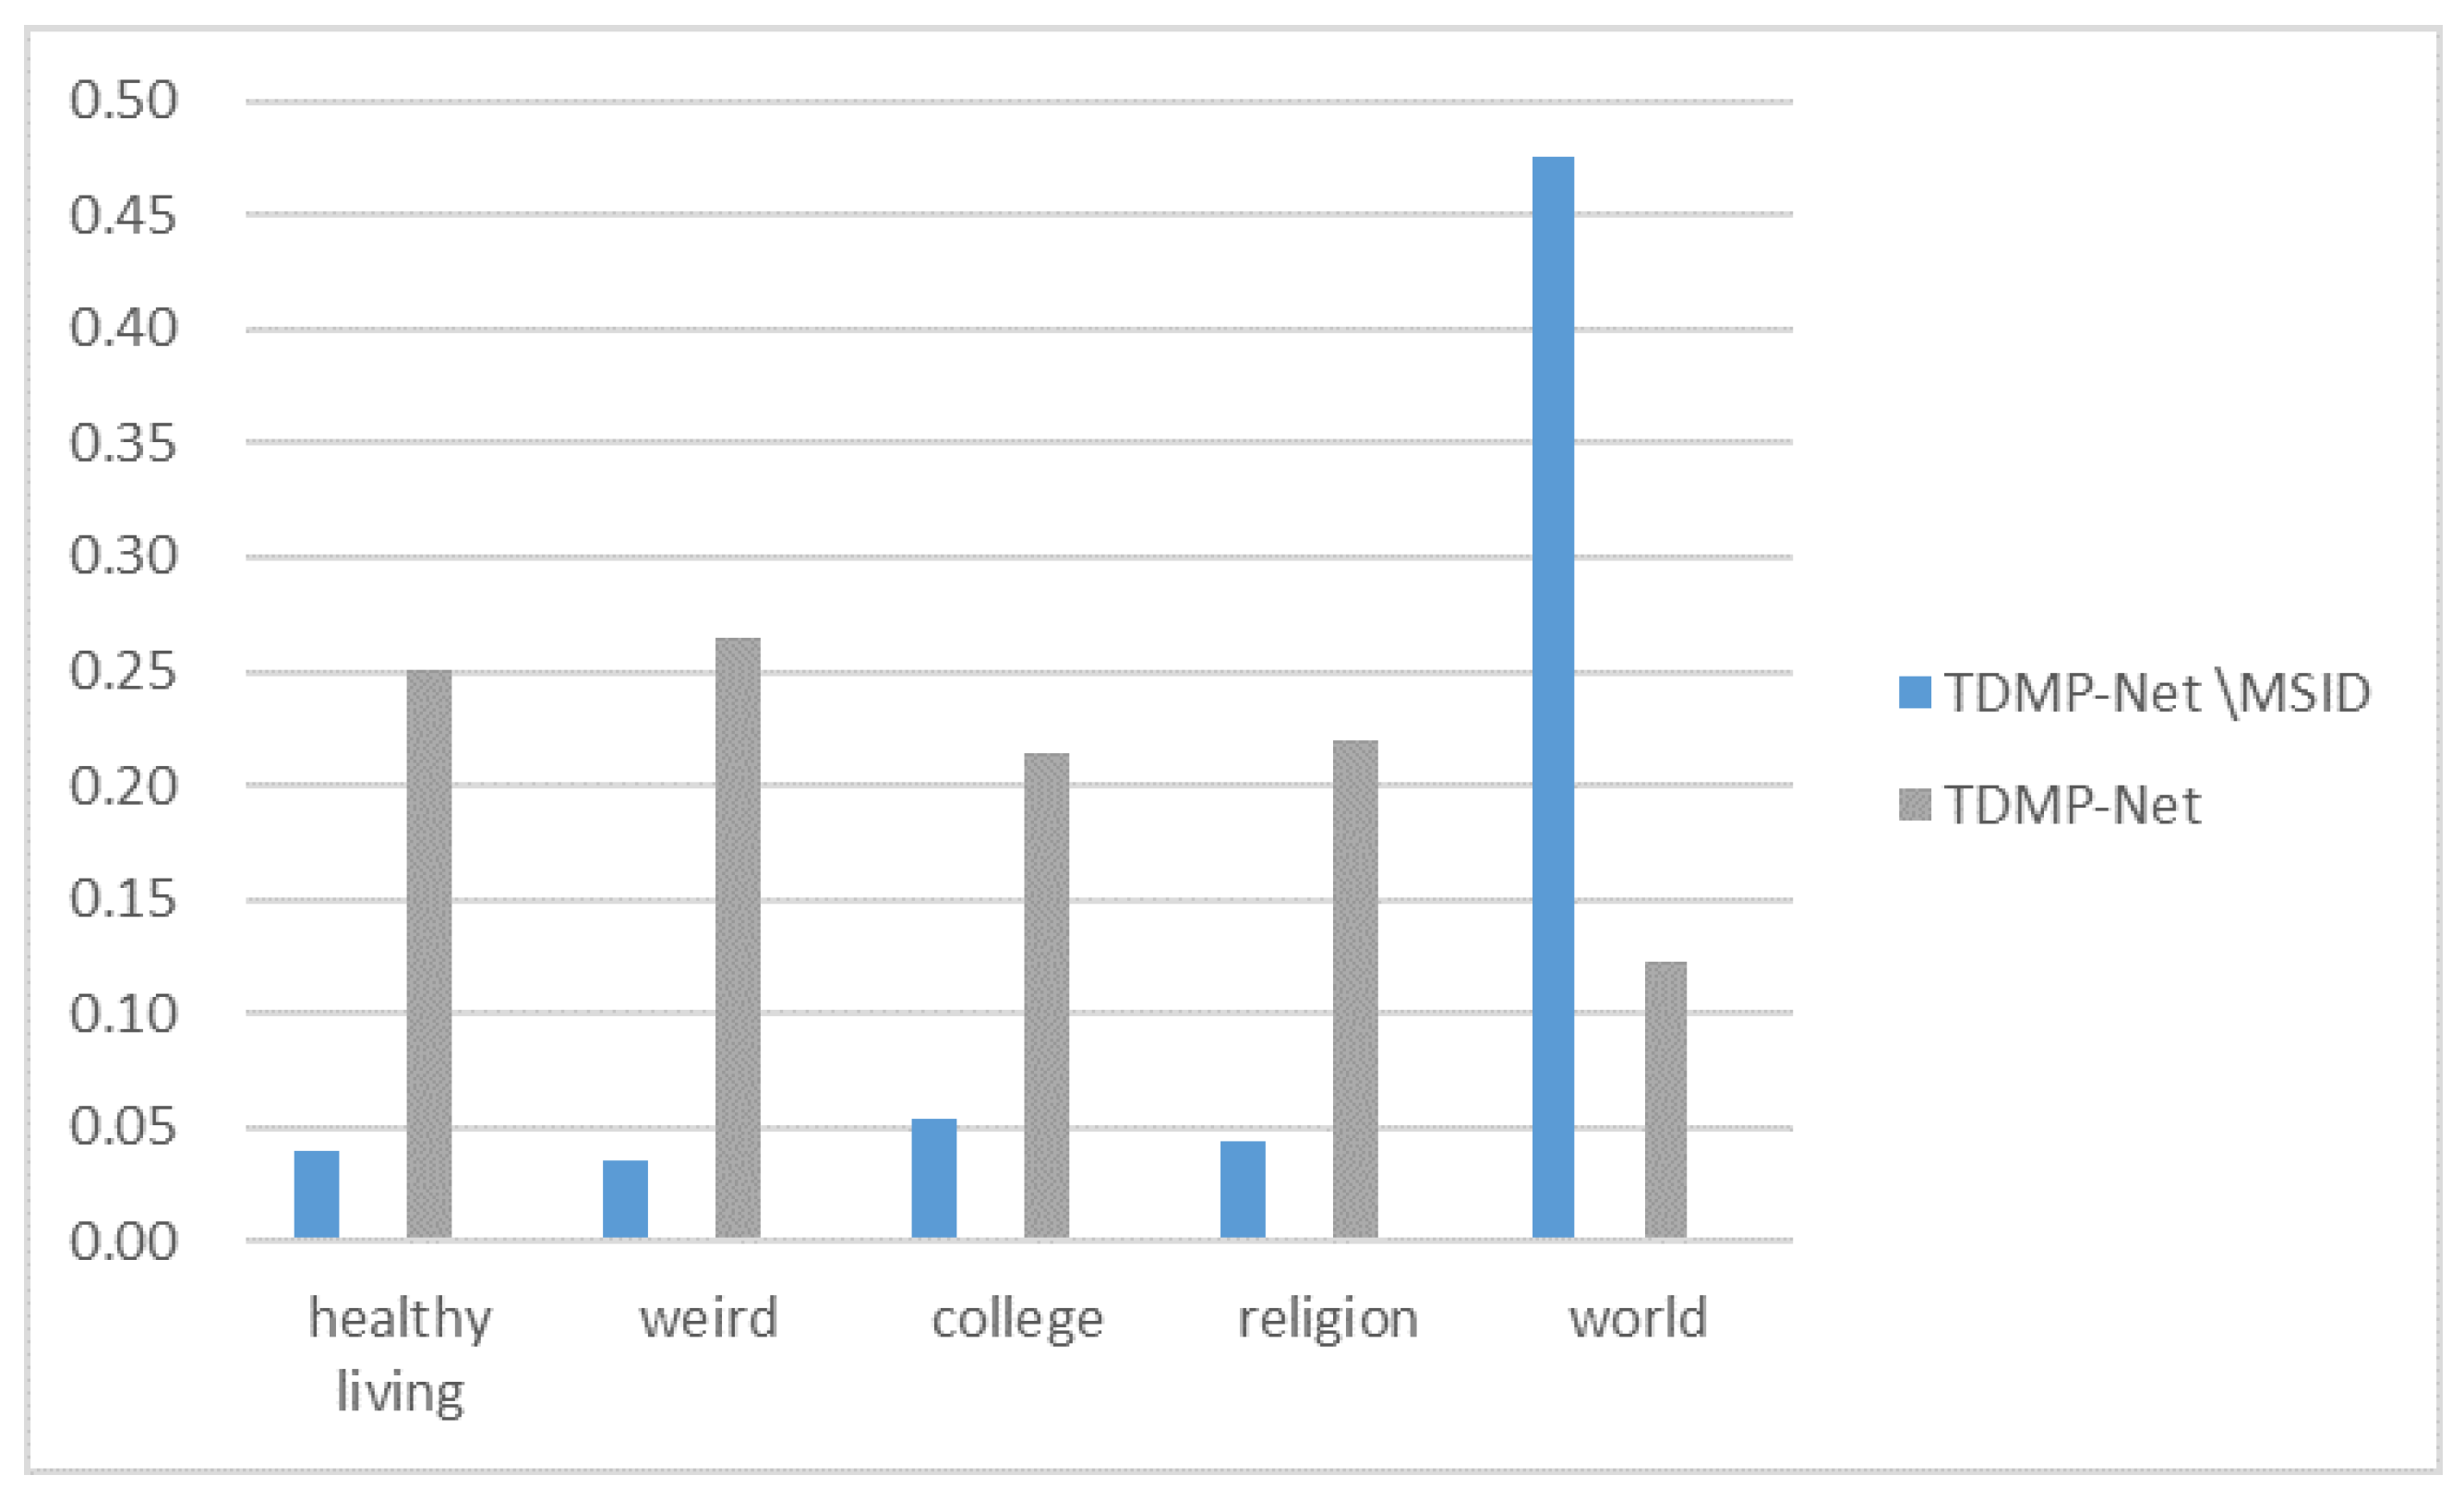
Moreover, we take the sample “a physician’s prognosis for the senate health care bill” as a case study, as shown in Figure 5. The results indicate that, after removing MSID, the model relying solely on distance misclassifies the sample as weird. In contrast, TDMP-Net correctly classifies it as a world, demonstrating the effectiveness of TDMP-Net in alleviating the metric constraint problem.
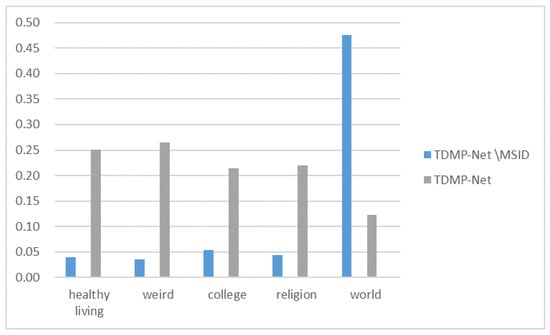
Figure 5.
Case study visualization of sample classification.
6. Conclusions
Traditional prototype networks are limited in classification performance due to metric space constraints and prototype drift issues. The TDMP-Net proposed in this paper constructs a 3D multi-source information space, and utilizes the threshold dynamic data augmentation module to dynamically adjust the prototype estimation process based on the multi-source information of query set samples, effectively alleviating the prototype drift problem. Additionally, it employs the multi-source information decision module to fuse multi-source information, which significantly improves the robustness of classification decisions while solving the metric constraint problem. Experimental results show that TDMP-Net achieves average accuracies of 78.3% and 86.5% in five-way one-shot and five-way five-shot tasks across four benchmark datasets, representing an average improvement of 3.3 percentage points over the current state-of-the-art methods. This verifies the role of the entropy-guided mechanism in enhancing the model’s generalization ability. Future research will focus on constructing a domain-adaptive framework, exploring dynamic entropy-threshold optimization strategies for TDMP-Net based on meta-learning, and further verifying the model’s applicability in low-resource language scenarios.
Author Contributions
Methodology, Q.M.; Software, G.P.; Resources, X.L.; Data curation, G.P.; Writing—original draft, G.P.; Writing—review & editing, G.P. and X.L.; Visualization, Q.M. and G.P.; Supervision, Q.M. and X.L.; Project administration, X.L.; Funding acquisition, X.L. All authors have read and agreed to the published version of the manuscript.
Funding
This research was funded by National Natural Science Foundation of China grant number 62476040.
Data Availability Statement
The data presented in this study are openly available, reference number [21,22,23].
Conflicts of Interest
Author Qibing Ma was employed by the company AVIC Shenyang Aircraft Design Research Institute. The remaining authors declare that the research was conducted in the absence of any commercial or financial relationships that could be construed as a potential conflict of interest.
References
- Kim, Y. Convolutional Neural Networks for Sentence Classification. In Proceedings of the 2014 Conference on Empirical Methods in Natural Language Processing, Doha, Qatar, 25–29 October 2014; pp. 1746–1751. [Google Scholar]
- Luo, Y.; Guo, X.; Li, L.; Yuan, Y. Dynamic Attribute-Guided Few-Shot Open-Set Network for Medical Image Diagnosis. Expert Syst. Appl. 2024, 726, 105–115. [Google Scholar] [CrossRef]
- Ren, M.Y.; Triantafillou, E.; Ravi, S.; Snell, J.; Swersky, K.; Tenenbaum, J.B.; Larochelle, H.; Zemel, R.S. Meta-Learning for Semi-Supervised Few-Shot Classification. In Proceedings of the International Conference on Learning Representations, Vancouver, BC, Canada, 30 April–3 May 2018. [Google Scholar]
- Schick, T.; Schutze, H. Exploiting Cloze Questions for Few-Shot Text Classification and Natural Language Inference. In Proceedings of the 2021 Conference on Empirical Methods in Natural Language Processing, Online, 7–11 November 2021; pp. 2355–2370. [Google Scholar]
- Zhao, K.; Jin, X.; Wang, Y. A review of research on small-sample learning. J. Softw. 2021, 32, 349–369. [Google Scholar]
- Chen, W.; Xie, E.; Li, Y.; Gao, Y.; Guo, G. A Simple and Effective Method for Few-Shot Text Classification with Pre-Trained Language Models. In Proceedings of the 2021 Conference on Empirical Methods in Natural Language Processing, Online, 7–11 November 2021; pp. 1954–1965. [Google Scholar]
- Snell, J.; Swersky, K.; Zemel, R. Prototypical Networks for Few-Shot Learning. In Advances in Neural Information Processing Systems 30, Proceedings of the Conference and Workshop on Neural Information Processing Systems, Long Beach, CA, USA, 4–9 December 2017; Wallach, H., Larochelle, H., Beygelzimer, A., d’Aspremont, A., Singer, Y., Eds.; NeurIPS Foundation: La Jolla, CA, USA, 2017; pp. 4077–4087. [Google Scholar]
- Sung, F.; Yang, Y.; Zhang, L.; Xiang, T.; Torr, P.H.S.; Hospedales, T.M. Learning to Compare: Relation Network for Few-Shot Learning. In Proceedings of the IEEE Conference on Computer Vision and Pattern Recognition, Honolulu, HI, USA, 18–23 June 2018; pp. 1199–1208. [Google Scholar]
- Hoerl, A.E.; Kennard, R.W. Ridge Regression: Biased Estimation for Nonorthogonal Problems. Technometrics 1970, 12, 55–67. [Google Scholar] [CrossRef]
- Wang, X.; Yu, F.; Wang, R.; Darrell, T.; Gonzalez, J.E. TAFE-Net: Task-Aware Feature Embeddings for Low Shot Learning. In Proceedings of the 2019 IEEE/CVF Conference on Computer Vision and Pattern Recognition (CVPR), Long Beach, CA, USA, 15–20 June 2019; pp. 1831–1840. [Google Scholar]
- Finn, C.; Abbeel, P.; Levine, S. Model-Agnostic Meta-Learning for Fast Adaptation of Deep Networks. In Proceedings of the 34th International Conference on Machine Learning, Sydney, Australia, 6–11 August 2017; pp. 1126–1135. [Google Scholar]
- Lei, T.; Hu, H.; Luo, Q.; Peng, D.; Wang, X. Adaptive Meta-learner via Gradient Similarity for Few-shot Text Classification. In Proceedings of the 29th International Conference on Computational Linguistics, Gyeongju, Republic of Korea, 12–17 October 2022; pp. 4873–4882. [Google Scholar]
- Lei, S.; Zhang, X.; He, J.; Chen, F.; Lu, C.T. TART: Improved Few-Shot Text Classification Using Task-Adaptive Reference Transformation. In Proceedings of the 61st Annual Meeting of the Association for Computational Linguistics, Toronto, ON, Canada, 9–14 July 2023; Volume 1, pp. 11014–11026. [Google Scholar]
- Vinyals, O.; Blundell, C.; Lillicrap, T.; Wierstra, D. Matching networks for one shot learning. In Advances in Neural Information Processing Systems, Proceedings of the Conference and Workshop on Neural Information Processing Systems, Barcelona, Spain, 5–10 December 2016; NeurIPS Foundation: La Jolla, CA, USA, 2016; pp. 3630–3638. [Google Scholar]
- Dopierre, T.; Gravier, C.; Logerais, W. ProtAugment: Intent Detection Meta-Learning through Unsupervised Diverse Paraphrasing. In Proceedings of the 59th Annual Meeting of the Association for Computational Linguistics and the 11th International Joint Conference on Natural Language Processing, Online, 1–6 August 2021; Association for Computational Linguistics: Stroudsburg, PA, USA, 2021; pp. 2454–2466. [Google Scholar]
- Liu, H.; Zhang, F.; Zhang, X.; Zhao, S.; Ma, F.; Wu, X.M.; Chen, H.; Yu, H.; Zhang, X. Boosting Few-Shot Text Classification via Distribution Estimation. In Proceedings of the Thirty-Seventh AAAI Conference on Artificial Intelligence, Washington, DC, USA, 7–14 February 2023; pp. 13219–13227. [Google Scholar]
- Devlin, J.; Chang, M.W.; Lee, K.; Toutanova, K. BERT: Pre-Training of Deep Bidirectional Transformers for Language Understanding. arXiv 2018, arXiv:1810.04805. [Google Scholar]
- Cuturi, M. Sinkhorn Distances: Lightspeed Computation of Optimal Transport. In Proceedings of the 27th International Conference on Neural Information Processing Systems (NIPS’13), Red Hook, NY, USA, 5–10 December 2013; pp. 2292–2300. [Google Scholar]
- Kendall, A.; Gal, Y.; Cipolla, R. Multi-Task Learning Using Uncertainty to Weigh Losses for Scene Geometry and Semantics. In Proceedings of the 2018 IEEE Conference on Computer Vision and Pattern Recognition (CVPR 2018), Salt Lake City, UT, USA, 18–23 June 2018; pp. 7482–7491. [Google Scholar]
- Chen, J.; Zhang, R.; Mao, Y.; Xu, J. ContrastNet: A Contrastive Learning Framework for Few-Shot Text Classification. In Proceedings of the Thirty-Sixth AAAI Conference on Artificial Intelligence, New Orleans, LA, USA, 22 February–1 March 2022; pp. 10492–10500. [Google Scholar]
- Bao, Y.; Wu, M.; Chang, S.; Barzilay, R. Few-shot Text Classification with Distributional Signatures. In Proceedings of the 8th International Conference on Learning Representations (ICLR), Virtual Event, 26–30 April 2020; Available online: https://iclr.cc/virtual_2020/poster_H1emfT4twB.html (accessed on 12 October 2025).
- He, R.; McAuley, J. Analyzing the Amazon Product Review Dataset. In Proceedings of the 22nd ACM SIGKDD International Conference on Knowledge Discovery and Data Mining, San Francisco, CA, USA, 13–17 August 2016; p. 655. [Google Scholar]
- Lang, K. NewsWeeder: Learning to Classify News Articles. In Proceedings of the International Conference on Machine Learning, Pittsburgh, PA, USA, 5–9 August 1995; p. 667. [Google Scholar]
- Cui, G.; Hu, S.; Ding, N.; Huang, L.; Liu, Z. Prototypical Verbalizer for Prompt-Based Few-Shot Tuning. In Proceedings of the 60th Annual Meeting of the Association for Computational Linguistics, Dublin, Ireland, 22–27 May 2022; Volume 1, pp. 7014–7024. [Google Scholar]
- Chen, J.; Zhang, R.; Jiang, X.; Hu, C. SPContrastNet: A Self-Paced Contrastive Learning Model for Few-Shot Text Classification. ACM Trans. Inf. Syst. 2024, 42, 1–25. [Google Scholar] [CrossRef]
- Wang, Y.Q.; Li, C.H. Inter-Class Distance Enhanced Prototypical Network for Few-Shot Text Classification. Multim. Syst. 2025, 31, 185. [Google Scholar] [CrossRef]
- Nichol, A.; Achiam, J.; Schulman, J. Reptile: A Scalable Meta-Learning Algorithm. arXiv 2018, arXiv:1803.02999. [Google Scholar]
- Rauber, P.E.; Falcão, A.X.; Telea, A.C. Visualizing Time-Dependent Data Using Dynamic t-SNE. In Proceedings of the 18th Eurographics Conference on Visualization, EuroVis 2016-Short Papers, Groningen, The Netherlands, 6–10 June 2016; pp. 73–77. [Google Scholar]
Disclaimer/Publisher’s Note: The statements, opinions and data contained in all publications are solely those of the individual author(s) and contributor(s) and not of MDPI and/or the editor(s). MDPI and/or the editor(s) disclaim responsibility for any injury to people or property resulting from any ideas, methods, instructions or products referred to in the content. |
© 2025 by the authors. Licensee MDPI, Basel, Switzerland. This article is an open access article distributed under the terms and conditions of the Creative Commons Attribution (CC BY) license (https://creativecommons.org/licenses/by/4.0/).

