Abstract
This work proposes multi-objective two-stage distribution optimal power flow (D-OPF) to coordinate the use of smart inverters (SIs) and existing voltage control legacy devices. The first stage of multi-objective D-OPF aims to solve a mixed-integer nonlinear programming (MINLP) formulation that minimizes both voltage variation and active power loss, with SI modes, SI settings, voltage regulator (VR) taps, and capacitor bank (CB) status as control variables. The Pareto Optimal Solutions obtained from the first-stage MINLP are used to determine the optimal active–reactive power dispatch from the SIs by solving a nonlinear programming formulation in the second stage of the proposed D-OPF. This model guarantees that the setpoints for active–reactive power align with the droop characteristics of the SIs, ensuring practicability and the autonomous dispatch of active–reactive power by the SIs according to IEEE 1547-2018. The effectiveness of the proposed method is tested on the IEEE 123 distribution network by contrasting the two proposed D-OPF models, with one prioritizing SIs for voltage control and power loss minimization and the other not prioritizing SIs. The simulation results demonstrate that prioritizing SIs with optimal mode and droop settings can improve voltage control and power loss minimization. The proposed model (with SI prioritization) also reduces the usage of traditional grid control devices and optimizes the dispatch of active–reactive power. The POS also shows that the SI modes, droops, and legacy device settings can be effectively obtained based on the desired objective priority.
1. Introduction
As inverter-based distributed energy resources (DERs) become more prevalent, smart inverters (SIs) are emerging as feasible alternatives for supplying voltage and reactive power support within electric power transmission and distribution grids.
In traditional control strategies, legacy grid components like on-load tap changers (OLTCs), voltage regulators (VRs), and capacitor banks (CAPs) are employed for volt-VAr (VV) control (VVC). Capacitor banks, widely used for reactive power compensation, face limitations primarily due to mechanical and electrical stress. The dielectric materials inside capacitors degrade over time, leading to reduced capacitance and potential failure. Transient overvoltages, harmonics, and temperature fluctuations also accelerate aging and can cause damage. Additionally, the switching mechanisms, such as contactors, experience mechanical wear, which reduces reliability. Capacitor banks are also susceptible to harmonic resonance, which can amplify specific frequencies, leading to overheating or other failures. These limitations make regular maintenance crucial to ensuring their effectiveness and longevity [1,2]
On-load tap changers (OLTCs) and voltage regulators (VRs), essential for voltage regulation in transformers, are constrained by their mechanical nature and slower response times. Frequent tap changes result in the mechanical wear of moving parts, such as diverter switches and contacts, leading to degradation over time. Arcing during operation erodes contacts, increasing resistance and the risk of overheating. Oil-immersed OLTCs face additional challenges, as arcing degrades the insulating properties of the oil, requiring periodic replacement. Furthermore, OLTCs operate on a timescale of seconds, making them unsuitable for responding to fast transients in the power system. Despite their robust design and longer lifespan compared with other devices, they require regular maintenance to mitigate mechanical and operational limitations [3,4]. However, due to mechanical switching and limitations on daily switching operations, these legacy devices may struggle to fully counteract rapid voltage fluctuations caused by photovoltaics (PVs).
The operational limitations of smart inverters are primarily tied to their reliance on advanced power electronics and control algorithms. While they offer features like voltage regulation and frequency support, their performance can be constrained by response times and thermal management. Prolonged operation under high loads or at extreme temperatures can cause overheating, reducing efficiency and lifespan. Frequent switching in power electronics, such as IGBTs or MOSFETs, accelerates wear and eventual failure. Moreover, smart inverters depend on communication protocols for grid coordination, introducing vulnerabilities such as latency, data loss, or cybersecurity risks, which can compromise reliability [5,6].
As PV systems proliferate within distribution networks, smart inverters (SIs) will become crucial assets for VVC both now and in the future. Inverter-based PV systems offer swift, adaptable, and precisely controlled active–reactive power support, making them suitable for participating in voltage control [7,8]. Hence, as responsive active–reactive power sources, PV-based inverters can be synchronized with legacy grid devices to regulate voltage and reactive power across different operational timescales. According to [7], SIs can switch between various modes of operation. The strategic selection of SI modes (such as volt-Watt (VW), VV, and constant power factor (CPF)) proves highly advantageous due to the fluctuating power output of PVs, particularly at high penetration levels. This flexibility also enables PV systems to offer ancillary services to the power grid based on current grid dynamics. However, integrating SI constraints into distribution optimal power flow (D-OPF) formulations poses a significant mathematical challenge due to the diverse options for SI mode selection and the complex characteristics of SI droop curves as outlined in IEEE 1547. Another main hurdle in integrating SIs and legacy devices into D-OPF models is the sub-optimal use of SI voltage control resources. When the SI variables are co-optimized with legacy devices, this often leads to SI droop settings that sometimes do not maximize the voltage control capabilities of the SIs. To address some of these issues, this paper aims to formulate two D-OPF models that assign the SI modes as integer control variables. In addition to the SI modes, we also present a simplified SI droop formulation and legacy devices for D-OPF. One of the proposed D-OPF models solves multi-objective MINLP without prioritizing the use of SIs and the second D-OPF prioritizes the use of SIs. This work is an extension to the conference paper [9], and its main technical contributions include the following:
- A novel approach to investigate the multi-mode and multi-droop configurations of smart inverters (SIs) for coordinated control alongside legacy devices across two distinct operational timeframes. Current D-OPF models lack the capability to optimize the selection of SI modes within their formulations. This is often desirable since power generation from inverter-based resources such as PV systems often varies intermittently, and the grid dynamics could require the SIs to operate in different modes throughout the day at high PV penetration.
- The prioritization of the use of SIs in order to maximize their voltage control and/or active power loss minimization contribution. Subsequently, the status of the capacitor banks (CAPs) and the tap position of the on-load tap changer (OLTC) are individually optimized. This approach is contrasted with an alternative D-OPF formulation that does not emphasize the utilization of smart inverters (SIs).
- The use of multi-objective optimization in the slow-timescale D-OPF formulation gives the flexibility of obtaining the SI modes and droop settings. The Pareto Optimal Solutions obtained using this approach allow for the flexible selection of the SI modes and droop settings based on the objective functions with higher priority. This also allows users (such as power utility companies) of the proposed formulation to observe the different trade-offs in optimization objectives in selecting SI modes, SI droop settings, CAP status, and VR tap position.
The rest of this paper is structured as follows: related works in Section 2; Section 3 details the mathematical formulation of SI modes and SI droops; Section 4 presents the D-OPF formulation; Section 5 presents the coordinated control algorithms; Section 6 presents the simulation validation of the proposed D-OPF models. The paper is concluded with future work in Section 7.
2. Related Works
To determine the optimal setpoints of voltage-regulating devices on the grid, an efficient D-OPF formulation is required. This allows for the determination of the optimal setpoints for devices such as VR, CAPs, and SIs. Numerous studies in the literature have introduced D-OPF models aimed at determining the optimal setpoints for SIs. In [10], a method to optimally select the active and reactive power setpoints for SIs with the aim of effective voltage regulation is proposed. To convexify the D-OPF problem, the authors adopted semidefinite relaxation and sparsity-promoting regularization methods. Similar to [10], the authors of [11,12] developed a multi-objective approach to solving the D-OPF problem using weighted sum. Their efforts were aimed at determining the optimal active–reactive power setpoints of the SIs to improve both the voltage and power loss performance of the distribution networks used in their studies. To leverage recent developments in machine learning techniques, the authors of [13,14] proposed coordinated VVC using deep reinforcement learning (DRL) soft actor–critic. The proposed DRL-based method achieved fast control of the SIs under uncertainties in power generation from solar PVs. In the proposed methods in these works [10,11,12,13,14], though the VVC was modeled, other inverter voltage control modes (such as VW and CPF) that might be more effective depending on the location of the PVs and the time of the day were not considered. Also, the inverter reactive dispatch solutions obtained in [10,11,12,15,16,17], which need to be sent from time to time to the SIs, disallow autonomous reactive power injection from the SIs based on the voltage at their point of interconnection.
Since the SIs are not solely responsible for voltage regulation and reactive power control in the distribution feeders, VV optimization (VVO) models that integrate the use of CBs, and VRs with SIs were proposed in [15,16,17]. In [15], a bi-level VV optimization (VVO) framework to enhance grid performance was proposed. At the first level, a linear approximate three-phase power flow model is employed to optimize the control of CBs, VRs, and SIs. At the second level, the control setpoints for SIs are modified to achieve an optimal solution. The first-level optimization is formulated as a mixed-integer linear program (MILP), while the second-level optimization is formulated as a nonlinear program. The results obtained from the proposed framework showed its effectiveness in achieving Conservative Voltage Reduction (CVR). The main drawback in the above work (though the legacy devices were considered) is the absence of the SI droop formulation and the use of reactive power control only. Similarly, reference [17] also coordinated SIs, CBs, and VRs to achieve energy savings. The first optimization layer is formulated to determine the optimal settings of the load tap changers (LTCs) and the CBs to achieve energy savings. The droops of the SIs are subsequently optimized to improve the energy savings within the network and achieve improved CVR. Though the authors of [17] modeled the SI VV droop, a single SI mode was considered in their formulation. To integrate the SI mode and droop mathematical formulation in D-OPF, a recent research study in [18] modeled the VV and VW droop constraints. This was performed by using a mixed-integer linear programming formulation, and these droop constraints were integrated into a linear-based D-OPF model through first-order voltage approximation methods. Similarly, the authors of [19] also formulated a two-stage VV control framework that dispatches the CB and the VRs on a slow timescale and the SI droop on a fast timescale. While the authors in [18,19,20,21,22,23,24,25] incorporated droop settings as variables in the D-OPF formulation, a significant limitation of these studies lies in their assumption of predefined SI mode selection. This assumption may result in sub-optimal solutions, as the sensitivity of the feeder voltage to various SI modes differs because of the variations in , as seen from each node of the feeder [26,27]. The variation in the feeder voltage sensitivity to changes in reactive or active power across its nodes means that allowing the SI to take up a single mode during operation will limit its ability to effectively carry out voltage regulation and manage the systems’ power loss. Also, for the effective operation of the distribution grids, SIs need to be coordinated with existing legacy control devices at different timescales to facilitate efficient voltage control and regulation. Thus, configuring the D-OPF to maximize the utilization of SI resources while minimizing the reliance on legacy devices becomes essential. Optimizing the use of relatively faster SIs can reduce the wear and tear of other legacy voltage control devices, thereby making distribution feeder management cost-effective. Addressing the prioritization of the use of SIs, modeling all the various SI modes and droops, and multi-objective D-OPF are the motivations for this work.
3. Mathematical Modeling of SI Modes and Droop Settings
The mathematical model for SI functionalities considering their various modes and droop settings, following the guidelines set by the IEEE 1547-2018 standard [7], is presented in this section.
3.1. VW Mode
In VW mode, the SI dynamically changes its active power injection in response to changes in the voltage at the point of interconnection (POI). A steep VW curve slope (illustrated in Figure 1a) indicates a more pronounced change in active power dispatch in response to voltage variations. This relationship is mathematically represented by Equation (1) [9,28].
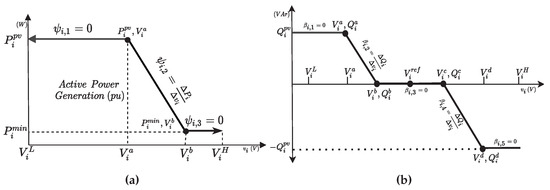
Figure 1.
(a) VW curve. (b) VV curve.
In VW mode, the active power constraint is defined as
3.2. VV Mode
In VV mode, the reactive power injection or absorption by the SI is modulated in response to the changes in voltage at the POI. As shown in Figure 1b, this is governed by the slope of the VV curve. This mode can be mathematically modeled as expressed in Equation (4).
Here, and are the VV curve gradients within their respective voltage ranges. Reactive power injection or absorption in this mode can be constrained as expressed in Equation (5):
In VV mode, the SI can operate in either VAr-priority (Q-priority) or Watt-priority (P-priority), as illustrated in Figure 2a.
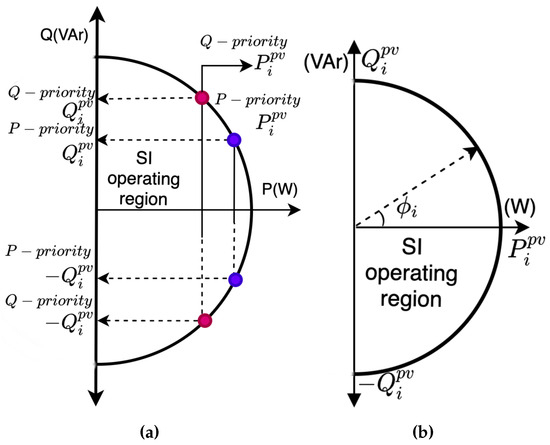
Figure 2.
(a) VV (P-/Q-priority) operating region [29]. (b) CPF mode.
3.2.1. VV Q-Priority
When SI is set to VV Q-priority mode, its reactive power injection or absorption is prioritized over active power. In this mode, the active power is constrained as expressed in Equation (8):
where , , and the curtailed active power is defined as .
3.2.2. VV P-Priority
When the smart inverter (SI) operates in VV mode with P-priority, the entire active power generated by the photovoltaic (PV) system is dispatched. Depending on the apparent power rating of the SI, the reactive power available for voltage control is as expressed in Equation (9).
3.3. CPF Mode
In CPF mode, the smart inverter is designed to absorb or inject reactive or active power based on a set of power factor settings as expressed in Equation (10). For given power factor settings (constrained between and ) and assuming a two-quadrant operation for the SIs, its reactive and active power dispatch is as shown in Figure 2b.
The reactive power that can be injected or absorbed in this mode is given by
4. OPF Mathematical Formulation
In this paper, the objective function for the OPF problem involves minimizing active power loss and the total voltage deviation. The first objective function, which is the total voltage deviations caused by the voltage control actions of SIs, CBs, and VRs, is expressed in Equation (11).
Minimizing the active power loss set as the second objective function is expressed in Equation (12):
The distribution grid model is incorporated into the optimization as constraints by using power flow equations, ensuring adherence to physical limitations, as shown in Equations (13)–(17) [30].
where
The nodal voltage constraint in the network is enforced as
5. Optimization and Coordinated Control of VRs, CBs, and SIs
As described earlier, to minimize voltage deviation and active power loss, alongside the control of VRs and CBs, we integrated five SI modes: VW, VV P-priority, VV Q-priority, CPF leading, and CPF lagging. We present two OPF methods, referred to as D-OPF-1 and D-OPF-2. D-OPF-1 co-optimizes the legacy devices and the SIs in a single multi-objective D-OPF, while D-OPF-2 prioritizes the use of the SIs and subsequently adds the legacy devices if they can be used to improve the performance of the objective functions.
5.1. D-OPF-1
This algorithm tackles power flow optimization in a two-stage approach:
- Stage 1: This stage focuses on broader grid management decisions made at hourly intervals. It considers five control modes for the SIs, breakpoint settings for their droop based on those modes, CPF values for the SI CPF mode, settings for the VRs, and the status of the CAPs. Here, the SIs are not prioritized over traditional grid devices for control purposes. The stage is as follows:
- -
- -
- The minimum POS values of the objective functions from this stage (denoted by , , , and ) provide the settings for the second stage.
- Stage 2: This stage focuses on fine-tuning power delivery by the SIs at a 1-minute resolution. It uses the optimal values from stage 1 and optimizes the actual active and reactive power dispatch setpoints for the SIs. The stage is as follows:
- -
- This stage is solved 60 times within each hour using the hourly optimal values from stage 1.
- -
- After each hour, the algorithm returns to stage 1 to determine new optimal settings for the next hour.
A detailed breakdown of the algorithm can be found in Figure 3.
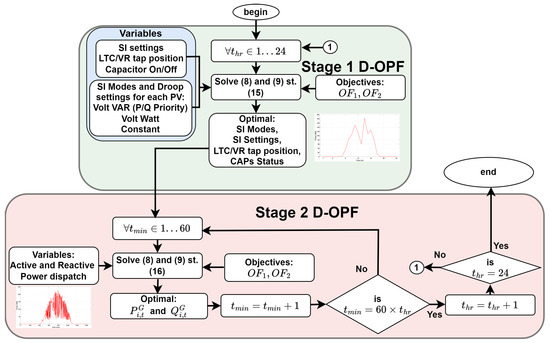
Figure 3.
Without SI priority (D-OPF-1).
5.2. D-OPF-2
The D-OPF-2 method addresses computational efficiency and prioritizes SI control over legacy grid devices. It achieves this by solving control variables sequentially in three steps within the first stage of D-OPF. In the first step in stage 1 of D-OPF-2, the optimal modes and settings for the SIs are solved.

Figure 4.
With SI priority (D-OPF-2) for improved voltage deviation minimization.
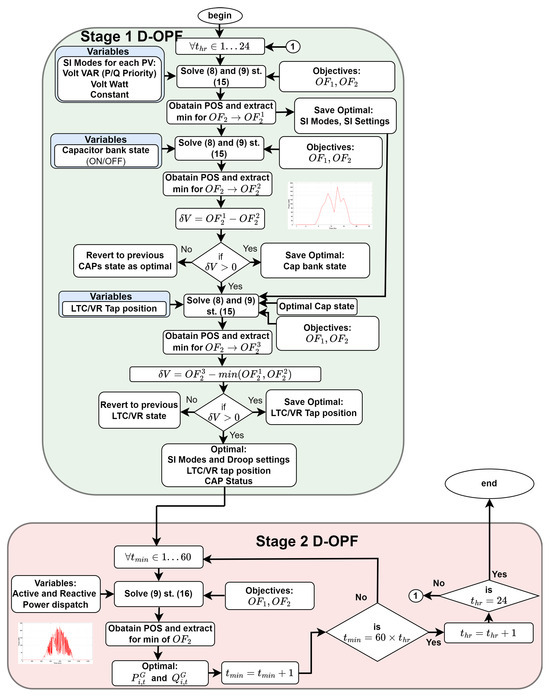
Figure 5.
With SI Priority (D-OPF-2) for improved power loss minimization.
- Stage 1: Here, the SIs are prioritized over traditional grid devices for control purposes. The stage is as follows:
- -
- -
- The minimum POS values of the objective functions from this stage (denoted by , , , and ) provide the settings for the second D-OPF problem in stage 1. This prioritization allows the SIs to reach their full potential in regulating voltage.
- -
- By using the SI modes and settings in the first solution, a second multi-objective D-OPF problem is solved by using the CAP status as the only control variable. The second set of POS in stage 1 can either be selected to minimize the voltage deviation or reduce the power loss . If any improvement is achieved, the new CAP status is used; otherwise, the previous state of the CAPs is used. The SI modes, SI settings, and CAP status are passed on to the third D-OPF problem in stage 1.
- -
- By using the SI modes and settings, and CAP status from the second solution, a third multi-objective D-OPF problem is solved using the VR Tap settings as the only control variables. The third set of POS in stage 1 can either be selected to improve the voltage deviation or reduce the power loss . If any improvement is achieved, the new VR Tap settings are used; otherwise, the previous VR Tap settings are used. The final set of optimal control variables for the SIs, CAPs and VRs are passed on to the second stage of D-OPF.
- Stage 2: This stage focuses on fine-tuning power delivery at a 1-minute resolution. It uses the optimal values from stage 1 and optimizes the actual active and reactive power setpoints for the SIs. The stage is as follows:
- -
- This stage is solved 60 times within each hour by using the hourly optimal values from stage 1.
- -
- After each hour, the algorithm returns to stage 1 to determine new optimal settings for the next hour.
6. Simulation Results and Analysis
Figure 6 shows the IEEE 123 bus distribution network used to evaluate the effectiveness of the proposed D-OPF models.
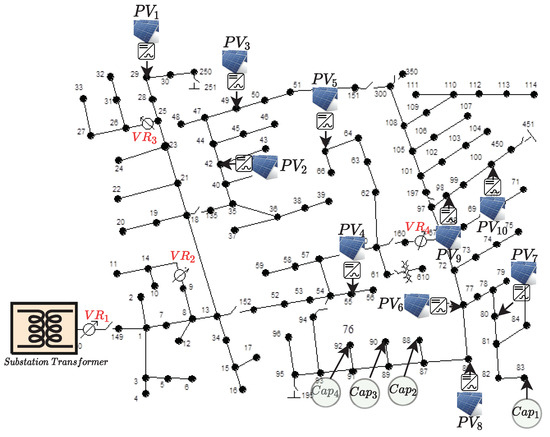
Figure 6.
IEEE 123 distribution network with ten solar PVs.
The nominal voltage for the IEEE 123 test feeder is 4.16 kV. The network incorporates four voltage regulators, denoted by VR1, VR2, VR3, and VR4, to maintain voltage levels. Additionally, four capacitor banks (Cap1, Cap2, Cap3, and Cap4) are installed to improve power quality. These capacitor banks consist of one three-phase unit rated at 600 kVAr and three single-phase units rated at 50 kVAr each. This feeder integrates ten photovoltaic (PV) systems, each with a capacity of 100 kW. To manage reactive power, the apparent power (kVA) rating of the inverter is set to 125% of the kW rating of the PVs. The maximum reactive power of the SIs is limited to in VV (P-priority) [31] to prioritize active power delivery. In VV (Q-priority), the SIs can curtail active power generation to meet the reactive power setpoint ( [32]). This mode allows for more flexibility in voltage regulation. The SIs have five operational modes: VW, VV (P-priority), VV (Q-priority), and CPF leading and lagging. Simulations are performed on a cloudy day with PV generation data. Hourly data are used to optimize the settings of voltage regulators (VRs), capacitor banks (CAPs), SI modes, and SI droop settings. However, for dispatching the actual active and reactive power output of the SIs, a higher resolution (1-minute) PV generation profile is employed.
6.1. Optimal SI Modes and Settings
The optimal SI modes and droop settings obtained from the two proposed D-OPF algorithms are presented.
6.1.1. D-OPF-1 Optimal SI Modes and Settings
The Pareto optimal SI modes and settings for minimum values of and for stage 1 of D-OPF-1 are as shown in Figure 7.
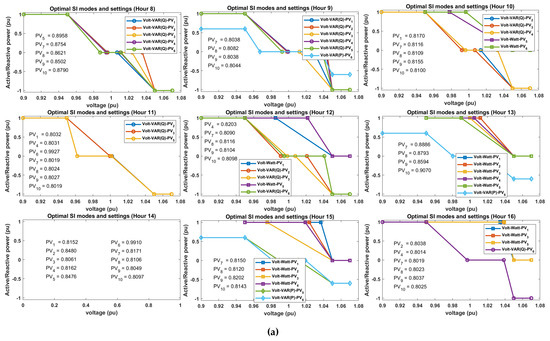
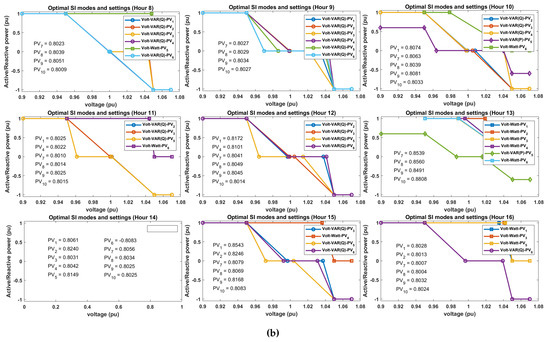
Figure 7.
Optimal SI modes and settings using D-OPF-1: (a) min ; (b) min .
The plots for 9 h between 8 am and 4 pm are presented due to space constraints. This time frame was chosen as it captures most of the solar generation period based on the solar power generation profile used. As shown in Figure 7a,b, the algorithm effectively chooses the optimal operating mode for each SI every hour. Notably, all the considered SI modes (VW, VV (P-priority), VV (Q-priority), and CPF leading and lagging) are utilized by the SIs to achieve effective voltage regulation and minimized power loss. Table 1 shows the number of times within a 24 h period each of the SI modes is selected by all the 10 PVs.

Table 1.
Hours 8-16 SI modes using D-OPF-1.
6.1.2. D-OPF-2 Optimal SI Modes and Settings
The Pareto optimal SI modes and settings for minimum values of and for stage-one of D-OPF-2 are as shown in Figure 8. The number of different SI modes and settings used using this approach within a 24 h period is presented in Table 2. Comparing the SI modes and settings for D-OPF-1 and D-OPF-2, the following differences can be observed: Firstly, D-OPF-2 uses more VV (Q-priority) compared with D-OPF-1. This is due to the effectiveness of this mode in carrying out voltage regulation since it curtails some active power in order to allow for more reactive power injection/absorption. The effectiveness of active or reactive power control for voltage regulation also depends on the X/R ratio of the feeder. secondly, it can also be seen from Figure 8a,b that the VV droop plots for D-OPF-2 has narrower dead-band compared to that of D-OPF-1. This allows the SIs to aggressively carry out voltage control and possible active power loss minimization. These plots highlight the benefits of prioritizing the use of SIs in D-OPF-2 compared with D-OPF-1.
Figure 8.
Optimal SI modes and settings using D-OPF-2: (a) min ; (b) min .
Table 2.
Hours 8-16 SI modes using D-OPF-2.
The results in Figure 7 and Figure 8 show that the algorithm dynamically selects the most suitable operational mode for each smart inverter (SI) on an hourly basis. This ensures adaptability to changing grid conditions, such as varying loads and solar generation throughout the day. Each mode is selected based on its effectiveness in addressing specific voltage regulation needs and minimizing power losses at a given time, thereby achieving both grid stability and energy efficiency. The algorithm ensures that droop settings align with grid requirements in real time by switching between different control modes.
6.2. Optimal Tap Positions and CAP Status
Figure 9 and Figure 10 show the optimal tap positions obtained by the proposed D-OPF-1 and D-OPF-2 algorithms for VR1, VR2, VR3, and VR4. The total number of tap changes from both algorithms’ POS is summarized in Table 3 and Table 4.
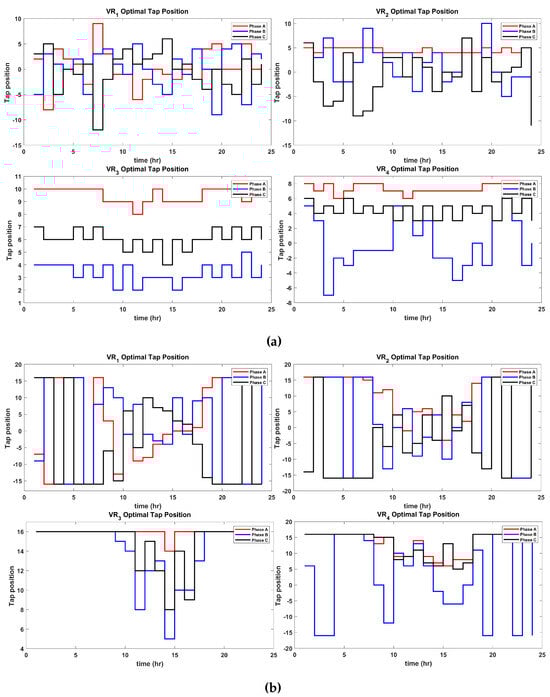
Figure 9.
D-OPF-1 Pareto optimal tap positions of VR1, VR2, VR3 and VR4 for (a) min and (b) min .
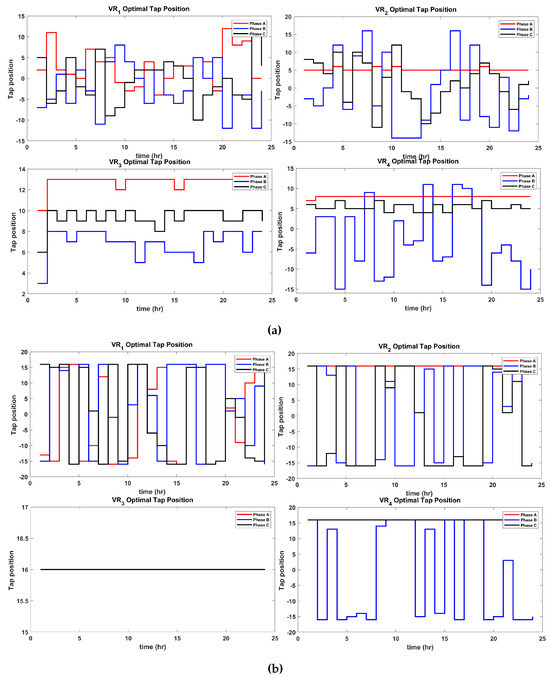
Figure 10.
D-OPF-2 Pareto optimal tap positions of VR1, VR2, VR3 and VR4 for (a) min and (b) min .
Table 3.
Tap changes for D-OPF-1.
Table 4.
Tap changes for D-OPF-2.
These values represent the Pareto optimal tap position that corresponds to the minimum values of and . As seen from the figures and tables, the total number of optimal tap changes made by using D-OPF-2 is much less than that of D-OPF-1. There is a 12.9% reduction in tap changes for minimizing by using D-OPF-2 compared with D-OPF-1 and a 27.5% reduction in tap changes for minimizing by using D-OPF-2 compared with D-OPF-1. It is also worthy of note that both algorithms made a higher number of tap changes to minimize compared with . This is expected since changes in the VR tap position have more influence on regulating the network voltage. The total numbers of the ON/OFF statuses of the four CAPs are presented in Table 5 and Table 6. The results show that the D-OPF-2 has fewer CAP ON statuses compared with D-OPF-1. This can be attributed to more reactive power control achieved by prioritizing the use of the SIs in D-OPF-2.
Table 5.
Total number of CAP ON/OFF statuses for D-OPF-1.
Table 6.
Total number of CAP ON/OFF statuses for D-OPF-2.
As seen in Figure 9 and Figure 10, tap changes are critical to adjusting the voltage on the grid. Fewer changes imply reduced wear of equipment, lower maintenance costs, and smoother voltage regulation, enhancing grid reliability. By leveraging reactive power from the SIs with D-OPF-2, the grid benefits from decentralized voltage support. This reduces the need for the frequent mechanical switching of CAPs or VRs, improving operational efficiency. D-OPF-2 demonstrates an advanced control mechanism by balancing reactive power contributions from the SIs and mechanical devices (VRs and CAPs). This synergy minimizes voltage deviations and power losses with fewer interventions, aligning with the goals of modern smart grid management.
6.3. Active and Reactive Power Dispatch
We use the POS obtained from stage 1 (, , , and ) to solve a one-minute resolution power flow (D-OPF) problem for each SI. This determines the optimal reactive power injection/absorption () and active power generation () for each SI. Figure 11 and Figure 12 show the combined active and reactive power dispatch of all SIs on a cloudy day for D-OPF-1 and D-OPF-2, respectively. Negative values on the Q plot indicate reactive power absorption, while positive values show reactive power injection.
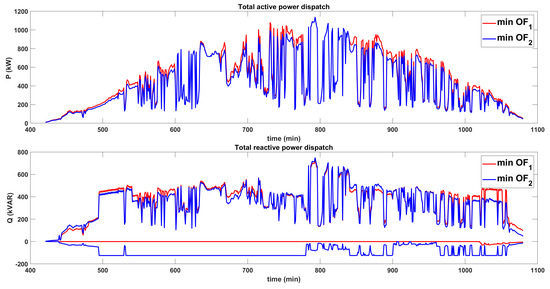
Figure 11.
Active–reactive power dispatch for D-OPF-1.
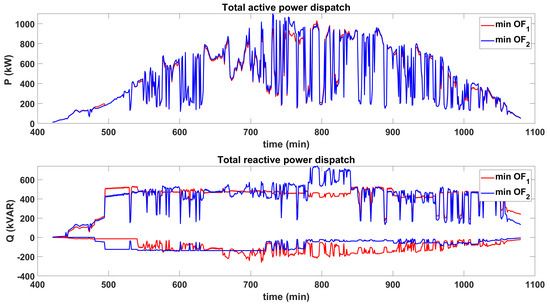
Figure 12.
Active–reactive power dispatch for D-OPF-2.
Figure 13 and Figure 14 also show the active power curtailment for both algorithms obtained from their POS for minimum values of and .
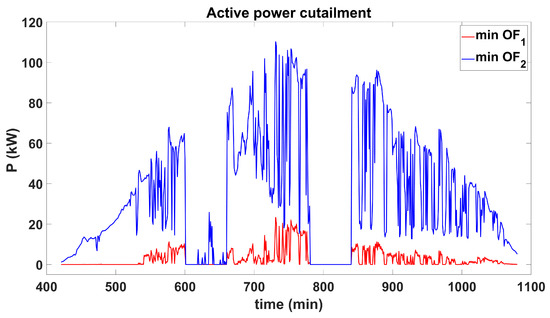
Figure 13.
Active power curtailment for and using D-OPF-1.
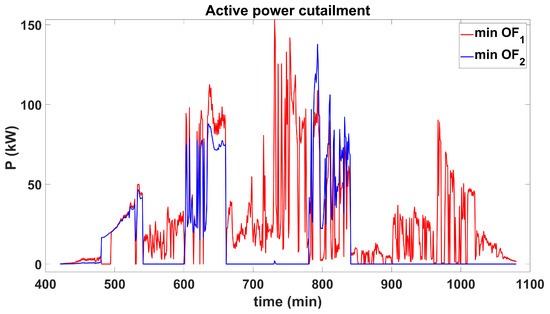
Figure 14.
Active power curtailment for and using D-OPF-2.
Both D-OPF algorithms reduce active power generation (curtailment) in some intervals. They also inject or absorb reactive power to regulate voltage and minimize the active power losses effectively. Over a day, D-OPF-1 curtails a total of 26.96 kWh of energy to minimize and 380.22 kWh of energy to minimize from the POS obtained. For the case of D-OPF-2, a total of 299.73 kWh of energy to minimize and 150.43 kWh of energy to minimize from the POS were obtained. The extent to which each algorithm limits active power is contingent upon the optimal settings and operational modes selected by the SI. Both algorithms use the VVC with Q-priority, enabling them to reduce/curtail active power generation as needed. As presented earlier in Table 1 and Table 2, D-OPF-2 uses more VVC with Q-priority, causing it to curtail more active power in minimizing the voltage deviation .
6.4. Comparison with Existing Method
To further investigate the benefits of the proposed D-OPF-1 and D-OPF-2 models, these algorithms are compared with an existing conventional D-OPF approach, given in [28]. The optimal tap positions, SI modes, and SI settings obtained by using the approach in [28] are shown in Figure 15 and Figure 16. The tap-changing and CAP operational summary by using this approach based on Figure 15 are presented in Table 7.
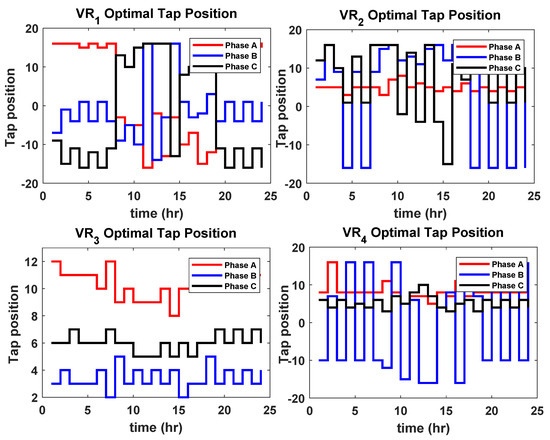
Figure 15.
Optimal tap positions for VR1, VR2, VR3, and VR4 [28].
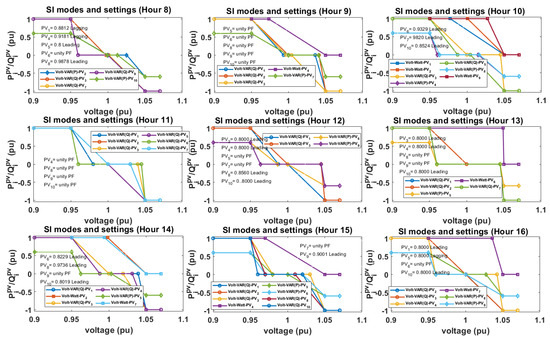
Figure 16.
Optimal SI modes and settings [28].
Table 7.
Tap-changing summary based on [28].
As seen in Table 7, the total tap changes for all four VRs over the time period considered is 230, which is higher than and for D-OPF-1 and and for D-OPF-2. The reduction in the VR tap operations by using the proposed D-OPF models compared with the one proposed in [28] further shows the effectiveness of the proposed multi-objective D-OPF models in this paper, increases the possibility of a longer lifespan of the VRs over a longer period, and indicates a more efficient use of the SIs, which can allow for better voltage regulation.
Also comparing the total number of CB ON/OFF status presented in Table 8 (obtained from [28]) with that of D-OPF-1 and D-OPF-2 (as presented in Table 5 and Table 6), it can be seen that the number of CB ON statuses (76) obainted from [28] is more than that of D-OPF-2 ( and ). This is due to the priotization of the use of SIs in D-OPF-2 in providing reactive power support in the network. The number of CB ON status ( and ) in D-OPF-1 is more (than 76 obtained using the method proposed in [28]), since the use of SIs is not priotized for reative power control in the D-OPF-1 algorithm. This further highlight the benefits of priotizing the use of SIs in reactive power injection for voltage regulation.
Table 8.
Total number of CAP ON/OFF statuses.
7. Conclusions
With the increasing penetration of renewable-energy systems, particularly those that rely on power electronics, the role of smart inverters (SIs) in voltage control and grid management has grown significantly. These systems, driven by clean energy sources such as solar and wind, necessitate advanced strategies to maintain grid stability and efficiency. A critical aspect of this development is the coordination of voltage control efforts between modern SIs and legacy voltage control devices, such as capacitor banks and voltage regulators, which were traditionally used in grid operations.
This study addresses these challenges by proposing two innovative distribution optimal power flow (D-OPF) frameworks designed to optimize the configuration and operation of SIs in accordance with IEEE 1547 standards. The first framework, referred to as D-OPF-1, minimizes reliance on SIs for voltage regulation and active power loss minimization, ensuring that the system remains flexible and can accommodate a variety of operational scenarios. In contrast, the second framework prioritizes the use of SIs, leveraging their advanced capabilities to enhance voltage regulation and minimize power losses.
To validate the proposed frameworks, this study utilizes the IEEE 123-node test feeder, incorporating ten solar power generation units equipped with SIs. For each solar photovoltaic (PV) plant, four SI operational modes are modeled: VW, VV (P-priority), VV (Q-priority), and CPF. These modes enable dynamic switching, ensuring optimal SI operation under varying grid conditions. Furthermore, binary control of legacy capacitor banks and discrete voltage regulator settings are integrated as control variables, enabling a comprehensive and coordinated approach to grid management.
The results of this analysis highlight the effectiveness of the proposed D-OPF algorithms in optimizing SI droop settings and mode selection in conjunction with legacy grid control devices. Notably, prioritizing SIs for voltage control demonstrated superior voltage regulation capabilities and a significant reduction in the system’s overall active power loss. These findings underscore the potential of advanced SI-based control frameworks to revolutionize voltage/var control strategies in modern power systems, paving the way for more efficient and sustainable grid operations in the era of renewable-energy dominance.
Author Contributions
Conceptualization, T.O.O. and O.O.; methodology, T.O.O. and O.O.; original draft preparation, T.O.O. and O.O.; writing—review and editing, T.O.O. and O.O. All authors have read and agreed to the published version of the manuscript.
Funding
This research received no external funding.
Data Availability Statement
The raw data supporting the conclusions of this article will be made available by the authors on request.
Conflicts of Interest
The authors declare no conflicts of interest.
Abbreviations
The following abbreviations are used in this manuscript:
| t | minute time index |
| i | index of buses |
| index of lines | |
| substation transformer voltage | |
| , | elements of admittance matrix’s real and imaginary parts |
| T | hourly time index |
| equivalent resistance and reactance at node i | |
| PV active power generation based on irradiance | |
| available reactive power based on SI rating at node i | |
| load at node i active and reactive power | |
| slope of volt-VAr and volt-Watt curve at node i | |
| curtailed PV generation at node i | |
| instantaneous voltage at node i | |
| set of all network nodes i | |
| , | set of SI setting and optimal setting [] |
| set of SI modes at node i | |
| set of SI optimal modes at node i | |
| set of branches | |
| active and reactive power flow on branch | |
| minimum active power dispatch from PV at node i | |
| instantaneous active and reactive power dispatch of PV at node i | |
| ,, | voltage deviations due to OLTC/VR tap change, change in status |
| of CAPs and PV active–reactive power injection at node i | |
| SI curve break points for SI at node i | |
| m | SI modes |
| , | tap ratio and maximum tap ratio |
| active and reactive power delivered from substation | |
| admittance matrix, impedance matrix, and current injection | |
| before tap change | |
| admittance matrix, impedance matrix and current injection | |
| change after change in tap on node i | |
| node i’s voltage angle | |
| , | minimum and maximum nodal voltages |
| capacitor bank at node i reactive power rating | |
| capacitor bank at node i reactive power injection | |
| SI kVA rating at node i | |
| set of nodes with CAPs | |
| set of branches with OLTC/VR | |
| set of nodes with PVs | |
| power factor of PV’s SI at node i | |
| , | minimum and maximum power factor SI setting at node i |
| ,, | tap and optimal tap position and maximum tap position for |
| , | CAP status and optimal CAP status |
References
- Li, P.; Ji, H.; Yu, H.; Wang, C. Chapter 2—Components and modeling of flexible distribution networks. In Flexible Distribution Networks; Li, P., Ji, H., Yu, H., Wang, C., Eds.; Elsevier: Amsterdam, The Netherlands, 2024; pp. 13–64. [Google Scholar] [CrossRef]
- Cunha, V.C.; Andrade, J.; Ricciardi, T.R.; Trindade, F.C.L.; Freitas, W.; Rosolen, R.A.G.; Vilibor, H.O. Assessment of Capacitor Banks Control Practices in Distribution Systems with High PV Penetration. In Proceedings of the 2020 IEEE Power & Energy Society General Meeting (PESGM), Montreal, QC, Canada, 2–6 August 2020; pp. 1–5. [Google Scholar] [CrossRef]
- Khan, H.A.; Zuhaib, M.; Rihan, M. Voltage fluctuation mitigation with coordinated OLTC and energy storage control in high PV penetrating distribution network. Electr. Power Syst. Res. 2022, 208, 107924. [Google Scholar] [CrossRef]
- Li, C.; Disfani, V.R.; Pecenak, Z.K.; Mohajeryami, S.; Kleissl, J. Optimal OLTC voltage control scheme to enable high solar penetrations. Electr. Power Syst. Res. 2018, 160, 318–326. [Google Scholar] [CrossRef]
- Fard, A.Y.; Shadmand, M.B. Multitimescale Three-Tiered Voltage Control Framework for Dispersed Smart Inverters at the Grid Edge. IEEE Trans. Ind. Appl. 2021, 57, 824–834. [Google Scholar] [CrossRef]
- Lyu, X.; Du, W.; Mohiuddin, S.M.; Nandanoori, S.P.; Elizondo, M. Improved Transient Stability Analysis of Multi-Loop Droop-Controlled Grid Forming Inverters with Current Limiter. In Proceedings of the 2024 IEEE Power & Energy Society Innovative Smart Grid Technologies Conference (ISGT), Washington, DC, USA, 19–22 February 2024; pp. 1–5. [Google Scholar] [CrossRef]
- 1547-2018; IEEE Standard for Interconnection and Interoperability of Distributed Energy Resources with Associated Electric Power Systems Interfaces. IEEE: Piscataway, NJ, USA, 2018; pp. 1547–2018.
- Babak, E.; Richard, B.; Michael, R.; Michael, H.; Julio, R.A.; Tom, K.; Frances, C.; Mark, S.; Ryan, Q.; Charlie, V.; et al. Impact of IEEE 1547 Standard on Smart Inverters and the Applications in Power Systems; IEEE PES Industry Technical Support Leadership Committee: Piscataway, NJ, USA, 2020. [Google Scholar]
- Olowu, T.O.; Inaolaji, A.; Paudyal, S.; Sarwat, A. Two-Timescale Control of Smart Inverters and Legacy Devices in Unbalanced Distribution Feeders. In Proceedings of the 2023 IEEE Industry Applications Society Annual Meeting (IAS), Nashville, TN, USA, 29 October–2 November 2023; pp. 1–6. [Google Scholar] [CrossRef]
- Dall’Anese, E.; Dhople, S.V.; Giannakis, G.B. Optimal Dispatch of Photovoltaic Inverters in Residential Distribution Systems. IEEE Trans. Sustain. Energy 2014, 5, 487–497. [Google Scholar] [CrossRef]
- Jabr, R.A. Linear Decision Rules for Control of Reactive Power by Distributed Photovoltaic Generators. IEEE Trans. Power Syst. 2017, 33, 2165–2174. [Google Scholar] [CrossRef]
- Su, X.; Masoum, M.A.; Wolfs, P.J. Optimal PV Inverter Reactive Power Control and Real Power Curtailment to Improve Performance of Unbalanced Four-wire LV Distribution Networks. IEEE Trans. Sustain. Energy 2014, 5, 967–977. [Google Scholar] [CrossRef]
- Xiong, K.; Cao, D.; Zhang, G.; Chen, Z.; Hu, W. Coordinated volt/VAR control for photovoltaic inverters: A soft actor-critic enhanced droop control approach. Int. J. Electr. Power Energy Syst. 2023, 149, 109019. [Google Scholar] [CrossRef]
- Takayama, S.; Ishigame, A. Volt–Var curve determination method of smart inverters by multi-agent deep reinforcement learning. Int. J. Electr. Power Energy Syst. 2024, 157, 109888. [Google Scholar] [CrossRef]
- Jha, R.R.; Dubey, A.; Liu, C.; Schneider, K.P. Bi-Level Volt-VAR Optimization to Coordinate Smart Inverters with Voltage Control Devices. IEEE Trans. Power Syst. 2019, 34, 1801–1813. [Google Scholar] [CrossRef]
- Farivar, M.; Clarke, C.R.; Low, S.H.; Chandy, K.M. Inverter VAR Control for Distribution Systems with Renewables. In Proceedings of the International Conference on Smart Grid Communications (SmartGridComm), Brussels, Belgium, 17–20 October 2011; pp. 457–462. [Google Scholar]
- Ding, F.; Baggu, M. Coordinated Use of Smart Inverters with Legacy Voltage Regulating Devices in Distribution Systems with High Distributed PV Penetration—Increase CVR Energy Savings. IEEE Trans. Smart Grid 2023, 14, 1804–1813. [Google Scholar] [CrossRef]
- Inaolaji, A.; Savasci, A.; Paudyal, S. Distribution Grid Optimal Power Flow in Unbalanced Multi-phase Networks with Volt-VAr and Volt-Watt Droop Settings of Smart Inverters. IEEE Trans. Ind. Appl. 2022, 58, 5832–5843. [Google Scholar] [CrossRef]
- Savasci, A.; Inaolaji, A.; Paudyal, S. Two-Stage Volt-VAr Optimization of Distribution Grids with Smart Inverters and Legacy Devices. IEEE Trans. Ind. Appl. 2022, 58, 5711–5723. [Google Scholar] [CrossRef]
- Lusis, P.; Andrew, L.L.; Liebman, A.; Tack, G. Interaction Between Coordinated and Droop Control PV Inverters. In Proceedings of the Eleventh ACM International Conference on Future Energy Systems, Virtual, 22–26 June 2020; pp. 314–324. [Google Scholar]
- Gush, T.; Kim, C.H.; Admasie, S.; Kim, J.S.; Song, J.S. Optimal Smart Inverter Control for PV and BESS to Improve PV Hosting Capacity of Distribution Networks Using Slime Mould Algorithm. IEEE Access 2021, 9, 52164–52176. [Google Scholar] [CrossRef]
- Olowu, T.O.; Inaolaji, A.; Sarwat, A.; Paudyal, S. Optimal Volt-VAR and Volt-Watt Droop Settings of Smart Inverters. In Proceedings of the 2021 IEEE Green Technologies Conference (GreenTech), Denver, CO, USA, 7–9 April 2021; pp. 89–96. [Google Scholar] [CrossRef]
- Dao, V.T.; Ishii, H.; Hayashi, Y. Optimal parameters of volt-var functions for photovoltaic smart inverters in distribution networks. IEEJ Trans. Electr. Electron. Eng. 2019, 14, 75–84. [Google Scholar] [CrossRef]
- Inaolaji, A.; Savasci, A.; Paudyal, S. Optimal Droop Settings of Smart Inverters. In Proceedings of the 48th Photovoltaic Specialists Conference (PVSC), Fort Lauderdale, FL, USA, 20–25 June 2021; pp. 2584–2589. [Google Scholar]
- Murzakhanov, I.; Gupta, S.; Chatzivasileiadis, S.; Kekatos, V. Optimal Design of Volt/VAR Control Rules for Inverter-Interfaced Distributed Energy Resources. arXiv 2022, arXiv:2210.12805. [Google Scholar] [CrossRef]
- Rylander, M.; Reno, M.J.; Quiroz, J.E.; Ding, F.; Li, H.; Broderick, R.J.; Mather, B.; Smith, J. Methods to determine recommended feeder-wide advanced inverter settings for improving distribution system performance. In Proceedings of the IEEE 43rd Photovoltaic Specialists Conference (PVSC), Portland, OR, USA, 5–10 June 2016; pp. 1393–1398. [Google Scholar] [CrossRef]
- Li, H.; Rylander, M.; Smith, J. Analysis to Inform CA Grid Integration: Methods and Default Settings to Effectively Use Advanced Inverter Functions in the Distribution System; EPRI: Palo Alto, CA, USA, 2015. [Google Scholar]
- Olowu, T.O.; Inaolaji, A.; Paudyal, S.; Sarwat, A. Optimal Mode and Droop Setting of Smart Inverters. In Proceedings of the 2023 IEEE Power & Energy Society General Meeting (PESGM), Orlando, FL, USA, 16–20 July 2023; pp. 1–5. [Google Scholar] [CrossRef]
- Giraldez, J.; Emmanuel, M.; Hoke, A.; Suryanarayanan, S. Impacts of Voltage-based Grid Support Functions on Energy Production of PV Customers. In Proceedings of the 2019 IEEE Power Energy Society General Meeting (PESGM), Atlanta, GA, USA, 4–8 August 2019; pp. 1–5. [Google Scholar] [CrossRef]
- Yang, Z.; Zhong, H.; Bose, A.; Xia, Q.; Kang, C. Optimal Power Flow in AC–DC Grids with Discrete Control Devices. IEEE Trans. Power Syst. 2018, 33, 1461–1472. [Google Scholar] [CrossRef]
- Jabr, R.A. Robust Volt/VAr Control with Photovoltaics. IEEE Trans. Power Syst. 2019, 34, 2401–2408. [Google Scholar] [CrossRef]
- Seuss, J.; Reno, M.J.; Broderick, R.J.; Grijalva, S. Analysis of PV Advanced Inverter Functions and Setpoints Under Time Series Simulation; Sandia National Laboratories: Albuquerque, NM, USA, 2016. [Google Scholar]
Disclaimer/Publisher’s Note: The statements, opinions and data contained in all publications are solely those of the individual author(s) and contributor(s) and not of MDPI and/or the editor(s). MDPI and/or the editor(s) disclaim responsibility for any injury to people or property resulting from any ideas, methods, instructions or products referred to in the content. |
© 2025 by the authors. Licensee MDPI, Basel, Switzerland. This article is an open access article distributed under the terms and conditions of the Creative Commons Attribution (CC BY) license (https://creativecommons.org/licenses/by/4.0/).