Abstract
Earthquakes can severely disrupt power distribution networks, causing extensive outages and disconnection from the transmission grid. This paper proposes a two-stage restoration method tailored for post-earthquake distribution systems. First, earthquake-induced damage is modeled using ground motion prediction equations (GMPEs) and fragility curves, and degraded network topologies are generated by Monte Carlo simulation. Then, a time-domain generator start-up model is developed as a mixed-integer linear program (MILP), incorporating cranking power and radial topology constraints. Further, a prioritized load recovery model is formulated as a mixed-integer second-order cone program (MISOCP), integrating power flow, voltage, and current constraints. Finally, case studies demonstrate the effectiveness and general applicability of the proposed method, confirming its capability to support resilient and adaptive distribution network restoration under various earthquake scenarios.
1. Introduction
The resilience of power distribution networks plays a critical role in maintaining societal stability, economic productivity, and public safety [,,]. In modern society, where electricity supports nearly all aspects of urban life, rapid restoration of power after extreme events is vital [,]. Among the various types of natural disasters, earthquake events have been shown to pose some of the most severe threats to distribution networks due to their sudden onset, large spatial footprint, and simultaneous impact on multiple infrastructure components [,].
In recent years, several earthquake events have demonstrated the fragility of power distribution systems. The 2011 earthquake in eastern Japan [], the 2020 Zagreb earthquake in Croatia [], and the 2023 Turkey–Syria earthquake [] underscore the severe consequences of earthquakes and highlight the need for effective restoration methods after an earthquake disaster.
A major challenge posed by extreme earthquakes is the potential loss of connection to the upstream transmission network, leading to the formation of outage distribution islands. In such scenarios, the restoration process cannot rely on external power sources and must use local resources with black-start capability. These resources must be coordinated to sequentially restart generators and loads under significant operational and topological constraints. It becomes essential to optimize the recovery strategy after an earthquake in a way that leverages internal generators, respects operational constraints, and prioritizes critical loads.
Recently, several studies have contributed to the understanding of post-disaster distribution system restoration [,,]. In terms of earthquake failure modeling, some researchers proposed fragility-based probabilistic approaches to estimate component failure under peak ground acceleration (PGA), enabling realistic scenario generation [,]. Others developed earthquake integration models to simulate geographically correlated damage patterns across urban grids []. Monte Carlo simulation has also been employed to construct degraded topologies for resilience evaluation and planning, improving the resilience and supplying the essential loads during and after the earthquake [].
In the studies of generator start-up, early studies formulated black-start scheduling problems for microgrids with simplified connectivity assumptions [,,]. An optimization-based framework for black-start resource allocation aimed at improving the efficiency of system restoration following a blackout []. Their model considered the interdependence between black-start and non-black-start generators, and formulated a MILP to determine the optimal allocation of black-start capabilities under various system constraints. However, the study primarily focused on high-voltage transmission networks and did not account for the topological degradation or resource limitations commonly observed in distribution networks following natural disasters such as earthquakes. Recent efforts have begun to address generator start-up in distribution systems. For example, a parallel black-start strategy for microgrids, considering the characteristics of distributed generators and proposing a sequencing method for restoration, is developed in []. Nevertheless, their method assumes a structurally intact system and does not consider the probabilistic damage patterns caused by natural disasters such as earthquakes. As a result, their model cannot be directly applied to post-earthquake scenarios where critical paths may be unavailable or uncertain. In addition, a coordinated recovery framework involving black-start and non-black-start generators is proposed in [], utilizing a deterministic optimization approach. While this work introduces cranking power constraints and generator dependencies, it lacks stochastic modeling of disaster impact and does not incorporate realistic restoration delays caused by infrastructure fragmentation.
Load restoration has also been extensively studied under normal outage scenarios [,,,]. A multi-step reconfiguration model is proposed for active distribution networks that integrates the start-up sequence of distributed generators while maximizing restored loads under power flow constraints []. However, its formulation does not consider the probabilistic failures induced by disasters, limiting its applicability in post-earthquake scenarios where system topology and supply capacity may be severely compromised. A microgrid-based framework for critical load service restoration is developed in [], where optimization aims to re-energize high-priority loads while respecting network operational constraints. While effective under controlled microgrid settings, their work does not model the stochastic degradation of network elements, nor does it support system-wide recovery strategies in damaged distribution systems. Moreover, a two-stage restoration method for distribution networks is introduced in [], combining component repair decisions with load restoration scheduling. Though the model accounts for time-based restoration dynamics, it is not specifically designed for earthquake-induced damage. More advanced approaches incorporated second-order cone relaxations to improve solution feasibility for power flow, though they often did not consider earthquake scenarios with probabilistic degradation and local generator start-up constraints [].
Despite these advancements having contributed significantly to either generator start-up scheduling or load restoration modeling, they often treat these processes independently, assuming one stage is complete before the other begins. However, the operational states of generators and the topology of the distribution system evolve dynamically and interdependently under earthquake damage. In reality, generator start-up directly influences the available supply capacity and network energization status, which in turn determines the feasibility and sequence of load restoration. Separating the two stages may lead to suboptimal recovery paths. For instance, neglecting the spatial and temporal coupling between generator energization and load pickup can result in infeasible load schedules or delayed service to critical infrastructure. Moreover, some loads may be essential not only from a consumer standpoint but also for supporting black-start operations and local grid stability.
Therefore, this paper proposes a two-stage restoration method for distribution networks after an earthquake. The approach explicitly accounts for stochastic damage modeling, generator start-up, and critical load restoration.
To summarize, our contributions are listed as follows:
- A fragility curve failure modeling approach is integrated with earthquake ground motion prediction to generate degraded distribution topologies through Monte Carlo simulation.
- A time-domain generator start-up model is developed based on MILP, incorporating segmented start-up curves, cranking power dependencies, and radial connectivity constraint.
- A load recovery model is formulated as a MISOCP, maximizing weighted load restoration, and taking power flow constraints, voltage and current limits, and radial constraints into account.
The rest of the paper is organized as follows: Section 2 describes the modeling of earthquake-induced damage, including PGA estimation, fragility analysis, and degraded topology generation using Monte Carlo simulation. Section 3 presents the two-stage restoration method, covering the MILP-based generator start-up model and the MISOCP-based load recovery model. Section 4 introduces the overall solution process. Section 5 provides case studies to verify the effectiveness of the proposed method. Section 6 concludes the paper.
2. Distribution Network Degradation After Earthquake Disaster
2.1. Earthquake Model Based on GMPE
To accurately assess the impact of earthquakes on distribution networks, it is essential to quantify the seismic intensity at different geographical locations within the network. This is typically achieved by estimating the PGA, which reflects the maximum ground acceleration experienced during the shaking phase of an earthquake. The spatial distribution of PGA serves as a fundamental input to the fragility analysis of distribution components and provides the basis for post-earthquake restoration planning.
The estimation of PGA values is conducted using GMPEs, which are widely recognized empirical models that relate earthquake characteristics and site-specific conditions to expected ground motion intensity. GMPEs enable the conversion of seismic source parameters—such as earthquake magnitude and epicentral distance—into quantitative estimates of PGA. These equations also incorporate the effects of local geological features that can amplify or attenuate seismic waves, thus allowing for site-specific disaster evaluation.
A commonly used functional form of the GMPE is expressed as follows:
In this equation, PGA denotes the peak ground acceleration at a specific site, measured in either or . The variable represents the earthquake magnitude, while denotes the rupture distance from the fault to the site. c1 is a constant term; it is used to set the benchmark level of the model and plays an overall offset adjustment role in the intensity of ground motion. c2 reflects the influence of the earthquake magnitude on ground motion, c3 controls the attenuation rate with distance, c4 adjusts the near-field distance effect, and c5 captures the interaction between magnitude and distance attenuation. The term is a site amplification factor that accounts for local soil conditions, including shear-wave velocity and soil layering effects.
This GMPE formulation captures the combined influence of the seismic source characteristics, wave propagation path, and local site effects on the resulting ground motion. Specifically, the logarithmic attenuation term accounts for energy loss over distance, while the exponential magnitude term reflects nonlinear source scaling. The site amplification term ensures that nodes located on soft soils or near-surface sediments receive appropriately adjusted PGA values, which can significantly differ from those on bedrock.
In this study, the GMPE is applied to each node in the distribution network to compute its expected PGA. For each node, its spatial coordinates are used to determine the rupture distance from the earthquake epicenter. Given the assumed magnitude and known site classification, the PGA value at each node is calculated accordingly. The result is a spatially continuous PGA field over the entire network, which captures the variation in seismic intensity due to geography.
This PGA serves as the primary input to the fragility damage model described in the following section. It allows for quantification of failure probabilities and facilitates the construction of realistic degraded topologies that are essential for post-earthquake restoration optimization. By integrating GMPE into the resilience framework, the proposed method ensures that the earthquake impact is consistently and accurately propagated through all stages of the restoration decision process.
2.2. Fragility Curve Probability Model
Following the establishment of the spatial PGA distribution across the distribution network, it becomes necessary to translate ground motion intensity into the likelihood of component failure. This is achieved through the use of fragility functions, which express the probability that a structural or electrical component will exceed a specific damage threshold when subjected to a given level of seismic demand. Fragility modeling plays a central role in probabilistic disaster impact analysis and provides the mathematical linkage between earthquake intensity and physical system vulnerability.
A fragility function is commonly represented by a cumulative lognormal distribution, formulated as follows:
In this equation, denotes the probability of failure for a given component under seismic excitation. The term is the cumulative distribution function of the standard normal distribution, which transforms the logarithmic ground motion ratio into a probability value ranging from 0 to 1. The variable θ is the median PGA value at which the component reaches the specified damage state, often derived from historical testing or empirical assessments. The parameter β is the standard deviation in natural log space, capturing the uncertainty in seismic response due to material variability, installation quality, and modeling assumptions.
This mathematical formulation implies that as PGA increases, the failure probability rises in a nonlinear, probabilistic manner. Different types of components—such as overhead lines, underground cables, transformers, and switches—have distinct fragility parameters based on their structural robustness and installation environment. For instance, overhead lines typically exhibit higher fragility at lower PGA thresholds due to their exposure and mechanical flexibility, while underground cables and transformers often have higher median capacities before failure is probable.
To apply the fragility function across the network, the node-specific PGA values calculated in Section 2.1 are used as inputs. For each component i, its geographic location determines the PGA value , which is then substituted into the fragility function to compute its individual failure probability . This approach allows for spatially differentiated risk modeling, wherein components located nearer to the earthquake epicenter or situated on soft soil are more likely to fail, while those farther away or on firmer ground have lower risk levels.
The resulting set of failure probabilities forms a probabilistic damage profile for the entire distribution system. The model recognizes disaster uncertainty and enables scenario generation through stochastic sampling. This probabilistic profile will be used in the following section to produce post-disaster degraded network topologies using Monte Carlo simulation techniques. By incorporating the fragility model, the proposed framework ensures that earthquake infrastructure vulnerability is quantitatively and realistically embedded into the restoration planning process.
2.3. Monte Carlo Simulation of Post-Disaster Network Degradation
Given the probabilistic nature of infrastructure failure under an earthquake, a deterministic damage assessment cannot sufficiently capture the diversity of potential outcomes. Instead, a scenario-based approach is required to account for the inherent uncertainty in the spatial and structural response of distribution networks. To this end, Monte Carlo simulation is employed to generate multiple realizations of network degradation caused by earthquake-induced component failures.
The Monte Carlo method is a statistical technique that approximates the behavior of a complex stochastic system through repeated random sampling. In this context, the distribution system is considered as a set of components , where each component is assigned a failure probability , computed based on the PGA field and the fragility model described in Section 2.2. For each simulation trial , a uniformly distributed random variable is drawn for every component. If , the component is deemed to have failed in that trial.
The operational status of component in trial is defined as follows:
This stochastic sampling procedure is repeated for trials, producing distinct post-earthquake failure scenarios. Each scenario captures a unique and feasible manifestation of the impact of an earthquake on the distribution infrastructure.
From each sampled set of component states, a degraded network topology is constructed, denoted by . Here, represents the subset of network nodes that remain accessible or energizable, while denotes the set of branches or lines that remain physically and electrically intact. Nodes that lose all adjacent connectivity due to failed branches are excluded from , while failed branches are similarly excluded from . Each degraded topology reflects the real-world possibility of network fragmentation and isolation caused by earthquake-induced component damage.
The collection of degraded topologies forms a representative scenario set that serves as the basis for subsequent restoration modeling. In particular, each degraded network is used as the input to the two-stage restoration strategy, where the feasible structure of the post-earthquake system constrains both the black-start optimization and load recovery scheduling processes. This approach enables robust evaluation and design of restoration strategies under uncertainty, ensuring critical loads can be recovered even in adverse and low-probability damage scenarios. The diagram of fault scenario generation is shown in Figure 1.
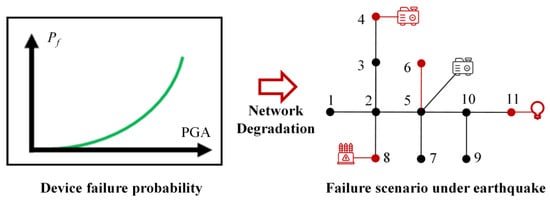
Figure 1.
Schematic diagram of fault scenario generation.
By combining fragility-informed failure probabilities with Monte Carlo scenario generation, this modeling framework captures the full spectrum of structural outcomes resulting from an earthquake. It provides a physically realistic and statistically grounded foundation for resilience-aware restoration planning in distribution networks.
3. Two-Stage Restoration Optimization of a Distribution Network After an Earthquake Disaster
3.1. Stage I: Generator Start-Up Model
After an earthquake, the distribution network typically suffers extensive structural damage and electrical isolation. Without connection to the upstream transmission network, the restoration process must begin with local black-start resources. This stage, called generator start-up, is critical for re-energizing the network and enabling subsequent load recovery. The generator start-up model identifies which distributed generators can be activated and determines an optimal time-sequenced recovery path that maximizes the total generation capacity. This section first evaluates the feasibility of black-start resources and then develops a optimization model to coordinate generator activation and energization of network elements.
3.1.1. Black-Start Resource Feasibility Evaluation
Black-start resources are generators that can initiate operation without requiring external power. In distribution networks, these typically include diesel generators, gas turbines, photovoltaic systems with battery energy storage systems, and islanded microgrids with inverter-based control. These resources exhibit varied technical characteristics, such as ramping behavior, energy autonomy, and control architecture.
To determine whether a generator can participate in post-disaster restoration, several feasibility conditions must be satisfied. First, the generator must remain structurally intact after the earthquake. Second, it must possess adequate energy reserves, such as fuel, gas, or battery, to support cranking power and initial power delivery. Third, it must be accessible either remotely or autonomously, allowing for controlled activation. Finally, it must maintain electrical connectivity to the grid to support power injection and distribution.
Generators satisfying these criteria are deemed feasible black-start resources. In the optimization model, these generators are treated as candidate sources and represented by binary variables, indicating whether they are activated.
3.1.2. Generator Start-Up Optimization Model
Following the feasibility screening of black-start resources, it is necessary to coordinate the sequential start-up of all generators to maximize the restoration pace and system recovery efficiency. From a practical perspective, starting non-black-start generators earlier accelerates the availability of the power supply throughout the system. Therefore, the generator start-up model is reformulated to minimize the cumulative start-up times of non-black-start generators, subject to operational feasibility constraints imposed by equipment dependencies, cranking power requirements, and network connectivity. The general generator start-up curve of non-black-start generators is shown in Figure 2.
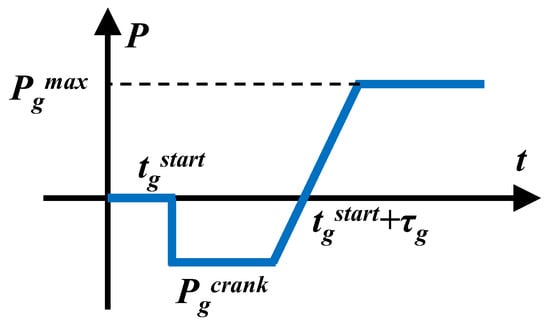
Figure 2.
General generator start-up curve of non-black-start generators.
Letting be the total number of discrete time periods in the planning horizon, the binary decision variables indicate whether generator is operational at time , indicates whether node is energized, and indicates whether branch is restored. For non-black-start generators , the continuous variable is defined as the first time period when the generator becomes operational.
The objective is to minimize the total start-up times of non-black-start generators:
The definition of is shown as follows:
To ensure that accurately reflects the activation time, the following relationship is imposed:
To capture generator behavior over time, each generator is assumed to follow a segmented start-up curve that can be piecewise-linearized. Letting represent whether generator begins its start-up process at time , and letting be the required start-up duration, the following time-dependent constraint models this ramp-up behavior:
In this representation, once the generator completes steps of start-up, it can transition to full operation. To prevent generators from being started multiple times, only one activation is allowed per generator:
Each non-black-start generator requires a certain amount of cranking power during its start-up window. Letting denote the real-time output from generator at time , then, at any time , the total generated power from all black-start generators must meet the cranking power demands from all generators that are in the process of being started:
The recovery of branches and nodes follows physical propagation constraints. A branch can only be energized if at least one of its connected nodes has already been energized:
Likewise, a node iii can only be energized at time if either a generator co-located at that node is activated, or it is connected to another energized node through a restored branch:
To ensure restoration consistency, once a generator, node, or branch is energized, it remains active for all subsequent time steps:
This temporal monotonicity ensures that restoration is unidirectional and avoids artificial deactivation.
Through this MILP formulation, the model provides not only an optimized generator activation schedule but also detailed restoration times for each component. This supports practical disaster recovery planning by enabling operators to allocate resources, coordinate field actions, and track generator start-up dependencies within a well-defined operational horizon.
3.2. Stage II: Load Recovery Optimization Model
After the successful black start of distributed generators, the next phase involves restoring customer loads in a priority-aware manner. In post-earthquake conditions, distribution systems often experience partial connectivity, generation constraints, and degraded topologies, necessitating an optimized strategy to allocate limited power resources to critical loads. The load recovery problem seeks to schedule the progressive re-energization of buses and branches, maximizing the weighted restoration of demand while satisfying power flow physics, operational boundaries, and topological constraints.
This section first establishes a load prioritization strategy that reflects disaster-specific recovery needs and then develops a mathematically rigorous optimization model for load recovery scheduling. The model is formulated as a MISOCP problem to accommodate nonlinear power flow constraints in a convex framework.
3.2.1. Identification and Weighting of Critical Loads
In traditional fault restoration practices, certain categories of electrical loads—such as hospitals, emergency medical centers, fire stations, water treatment plants, and communication hubs—are recognized as critical and are assigned high priority for post-outage recovery. These facilities are vital for maintaining public safety, basic services, and situational awareness during emergencies.
Under earthquake disaster scenarios, the definition of criticality expands. Temporary shelters, municipal coordination centers, logistics hubs, and facilities hosting displaced populations also become essential. Their continuous operation directly supports the societal response and the speed of recovery in affected regions.
To incorporate this prioritization into the optimization process, a load weighting is introduced. Letting denote the importance coefficient of load node , where higher values reflect higher restoration priority, these weights are directly embedded in the model’s objective function, ensuring that high-priority loads are preferentially restored when resource constraints are active.
3.2.2. Load Recovery Optimization Model
The goal of the load recovery optimization model is to maximize the total weighted active power demand restored across the earthquake-damaged distribution system, under constraints imposed by power flow physics, voltage and current limits, and radial topology requirements. Given the inherent nonlinearities in AC power flow equations, a convex formulation is adopted using MISOCP, which incorporates auxiliary variables and convex relaxations to enhance computational tractability and global solvability.
Letting be a binary variable that indicates whether node is energized, similarly, represents whether branch is active. The active power demand at node is denoted by , and its corresponding importance coefficient is represented by . The objective function aims to maximize the weighted sum of restored active loads, and is defined as follows:
To model the power flow, voltage, and current relationships, a set of continuous decision variables are introduced. For each branch , and denote the active and reactive power flow from node to node . At each node , is defined as the squared voltage magnitude, i.e., . For each branch, denotes the squared current magnitude, i.e., .
The nodal power balance must be maintained. Letting and be the active and reactive power generated at node , and are the active and reactive load demand. The active and reactive power balance equations at each node are given by the following:
To ensure the operating voltage remains within acceptable limits, the squared voltage variable must lie within the pre-defined bounds and . This is expressed as follows:
The relationship between voltage magnitude and power flow along a branch is established using the voltage drop equation, which links the voltage difference across a branch to power transfer and impedance parameters. For branch , with resistance and reactance , this is expressed as follows:
To preserve physical consistency between power, voltage, and current on a branch, a convex SOC constraint is used to relax the nonconvex equality . This relaxation is expressed in vector norm form as follows:
This constraint preserves the coupling between current and power flow without sacrificing convexity. Additionally, branch current limits are imposed by restricting , the squared current, to not exceed its maximum threshold conditioned on the activation status of the branch:
The topological structure of the restored network must be radial, as is typical for distribution systems. This is enforced through a tree constraint, which limits the number of active branches relative to the number of energized nodes:
Finally, connectivity consistency must be maintained. A branch can only be energized if both of its terminal nodes are also energized. This is enforced through the following logical constraints:
The final MISOCP model integrates load prioritization, network connectivity, and physical feasibility. It can be solved using commercial convex solvers such as Gurobi or MOSEK, delivering high-quality restoration plans that emphasize both efficiency and resilience in earthquake-disrupted power distribution systems.
4. Two-Stage Solution Method
To effectively recover earthquake-damaged distribution networks, this paper proposes a two-stage optimization-based restoration method. The first stage focuses on generator start-up scheduling, formulated as a MILP model. The second stage addresses prioritized load recovery, formulated as a MISOCP model. Both models are convex in nature, ensuring global optimality according to convex optimization theory. Therefore, the proposed framework guarantees mathematically reliable and practically feasible recovery decisions.
Each model requires specific inputs and produces distinct outputs to support the recovery process. The generator start-up model takes as input the degraded topology resulting from the earthquake, the available black-start and non-black-start generators, and their operational characteristics, such as start-up time and cranking power. The output is the optimal start-up schedule for all generators.
Subsequently, the load recovery model takes as input the restored topology, generator schedule, and load priority information. It produces an optimal load restoration plan that maximizes the total weighted active power restored while satisfying power flow, voltage, current, and radial topology constraints.
The complete solution process is as follows. First, earthquake parameters such as epicenter location, PGA, and intensity are used in GMPEs to estimate spatial ground shaking distribution. Then, fragility curves are used to compute the failure probabilities of individual components under the predicted PGA levels. Based on these probabilities, a Monte Carlo simulation is employed to generate possible fault scenarios and degraded network topologies. With these inputs, the MILP generator start-up model is solved to obtain a start-up schedule for non-black-start generators. Finally, the generator status, restored network topology, and load importance levels are input into the load recovery MISOCP model to compute the optimal power dispatch plan for prioritized loads.
The overall procedure is illustrated in Figure 3.
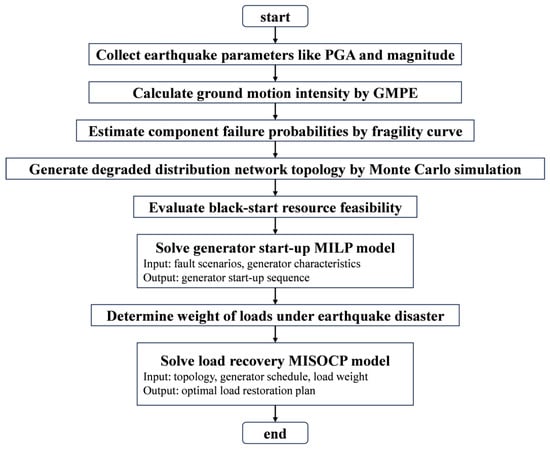
Figure 3.
Procedure of the two-stage solution method.
5. Case Study
To validate the effectiveness of the proposed two-stage restoration method, a modified IEEE 33-bus distribution network is adopted as the test system. The topology of the network under normal operation is shown in Figure 4.
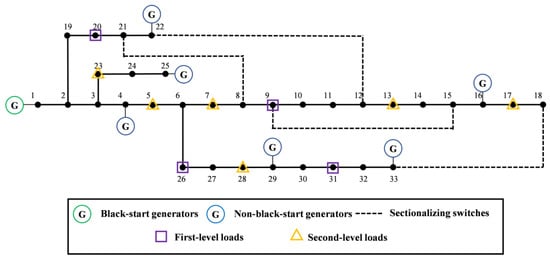
Figure 4.
Topology of the modified IEEE 33-bus distribution network.
All numerical experiments in this paper are conducted using the YALMIP toolbox in MATLAB for model formulation. YALMIP provides a high-level modeling interface for mixed-integer and convex optimization problems, which is well-suited for implementing the MILP and MISOCP models proposed in this study. The optimization problems are solved using the Gurobi solver, which offers efficient algorithms for large-scale linear and second-order cone programming tasks.
The simulation environment is set up on a PC with the following configuration: an Intel Core i7-12700, 32 GB of RAM, and the Windows 11 operating system. All models are implemented and executed in MATLAB R2022b. The Gurobi Optimizer version 11.0.0 is integrated with YALMIP as the solver.
In this test case, a total of seven distributed generators (DGs) are integrated into the network. Among them, the generator located at node 1 is designated as the black-start generator, possessing black-start capability without external power support. The remaining six generators are modeled as non-black-start generators, which require cranking power support from the black-start generator during the restoration process. The dashed lines represent sectionalizing switches. These switches are used by distribution system operators to flexibly reconfigure the network in the event of faults or during system restoration. During the restoration, operators are allowed to selectively close or open these switches to implement optimal restoration strategies or fault isolation. After the earthquake, the distribution network dispatchers adjusted the weights of the loads related to post-earthquake reconstruction. The purple squares and orange triangles represent first-level and second-level loads; in this paper, the weights of first-level loads and second-level loads are set to 100 and 1, respectively. The parameters of generators, loads, and branches are shown in Table A1, Table A2 and Table A3. and are set as 0.85 and 1.05, is set as 1.05, β and ln(θ) are set as 0.44 and 0.45 g, and c1 to c5 are set as −1.474, 0.718, −1.054, 0.00115, and 0.00035, according to [].
The restoration process is divided into 30 time intervals. All numerical simulations are implemented in MATLAB. The optimization models are constructed using the CVX, and Gurobi is adopted as the solver to compute the optimal solutions of the MILP and MISOCP, as presented in Section 3.1 and Section 3.2.
In this paper, an earthquake with an average PGA of 0.5 g was modeled across the region where the distribution network is located. The ranges of and are 4.2~8.0 and 2~80 km, and the PGA values and failure probabilities of buses and branches are shown in Table 1 and Table 2.

Table 1.
The PGA values of buses.

Table 2.
The PGA values of branches.
The fragility curve of distribution devices under the earthquake is shown in Figure 5 []. The horizontal axis represents the PGA, while the vertical axis indicates the corresponding failure probability of components such as poles, overhead lines, and transformers. The curve follows a typical lognormal cumulative distribution form, reflecting the probabilistic nature of infrastructure failure under an earthquake.
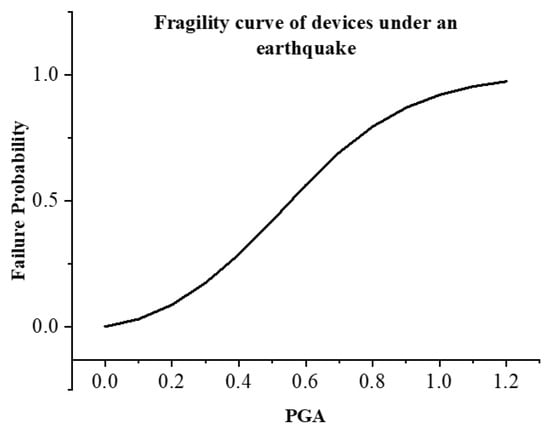
Figure 5.
A fragility curve of devices under an earthquake.
As shown, the failure probability remains below 0.1 when PGA is less than 0.2 g, indicating high survivability of most equipment under weak shaking conditions. However, as the PGA increases beyond 0.4 g, the failure probability grows significantly. At PGA ≈ 0.6 g, the failure probability reaches approximately 0.5, suggesting that half of the components subjected to such ground motion are likely to fail. For PGA values exceeding 1.0 g, the failure probability asymptotically approaches 1.0, indicating that component failure becomes certain in severe earthquakes.
This curve provides a quantitative basis for mapping ground motion intensity to physical failure likelihood across the distribution network. When combined with nodal PGA values obtained from GMPE models, this fragility function enables the Monte Carlo simulation process to accurately generate degraded network topologies. These topologies serve as essential inputs to the proposed two-stage restoration models developed in Section 3.1 and Section 3.2.
Subsequently, 1000 Monte Carlo trials were generated. In each trial, device states were sampled based on , producing a degraded topology of the distribution grid. On average, approximately 40–45% of the branches and 15–20% of the switches were found to be non-operational after a major earthquake. A representative degraded topology after an earthquake is shown in Figure 6; the lines and generators in red, such as line 23–24, line 6–7, and G25, represent devices destroyed by the earthquake which will not recover during restoration.
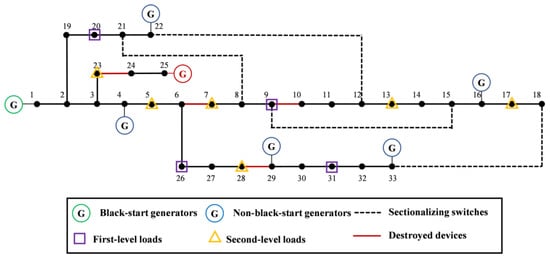
Figure 6.
A representative degraded topology after an earthquake.
Solving the generator start-up MILP model, the start-up time of each generator is shown in Table 3. During the restoration process, the black-start generator G1 is activated at t = 1, and ramps up quickly due to its characteristics. Then, G1 begins to energize adjacent transmission paths to support the restart of non-black-start generators. In order to deliver the required cranking power to downstream generators, sectionalizing switches between nodes 8 and 21, 9 and 15, and 18 and 33 are closed, thereby enabling flexible power routing through alternative paths.

Table 3.
Generator start-up times of IEEE 33-bus distribution network test case.
Figure 7 shows the progress of generator start-up; at t = 4, node 4 becomes energized via the transmission path 1–2–3–4, allowing the non-black-start generator G4 to initiate its start-up process. G4 receives cranking power from G1 and transitions into a self-sustained operating state. However, due to the permanent failure of line 28–29 caused by the earthquake, generators G29 and G33 must delay their restart until alternative transmission paths are established. With the aid of the sectionalizing switch at node pair 18–33, G33 is able to begin its start-up sequence after 12 time intervals and becomes fully operational at t = 18, while G29 requires a longer delay of 16 time intervals and completes its start-up at t = 22. It is important to note that generator G25 suffers irreparable damage during the earthquake and remains out of service throughout the entire restoration period. The transmission path of each generator is shown in Figure 8.
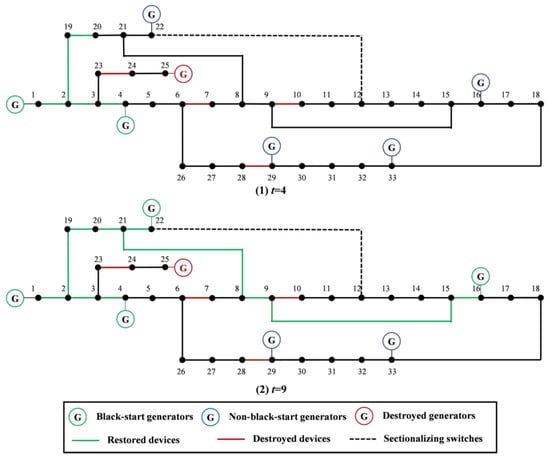
Figure 7.
Progress of generator start-up (t = 4 and t = 9).
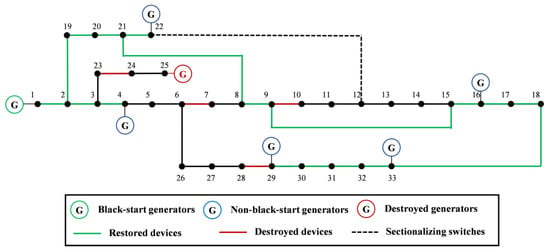
Figure 8.
Transmission path of each generator.
Figure 9 shows the total active power output of all generators in the system over the restoration timeline. This curve reflects the cumulative generation capability of the distribution network as black-start and non-black-start generators are sequentially re-energized. The horizontal axis represents the time interval since the onset of restoration, while the vertical axis indicates the total active power available in the system at each step.
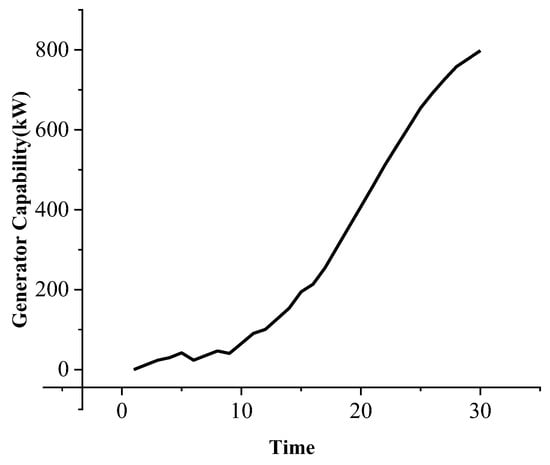
Figure 9.
Generator capability of the distribution network.
At the initial stage (t = 1), only the black-start generator G1 is restarted, providing limited generation capacity to support cranking power requirements for downstream generators. During the early phase (t = 1 to t = 5), the curve rises gradually, corresponding to the start-up of a small number of nearby non-black-start generators with minimal cranking delays and simple transmission paths. This phase marks the progressive energization of nodes located within a short electrical distance from G1.
Between t = 6 and t = 16, the slope of the generation curve increases significantly. This inflection corresponds to the activation of several mid-distance generators such as G4, G15, and G21, whose start-up becomes feasible once critical transmission paths are restored. The closing of key sectionalizing switches facilitates these power routes and enables multiple units to restart in parallel.
After t = 16, the generation capacity continues to rise but at a slower rate, approaching its maximum value. This stage involves the recovery of distant generators (G29 and G33), which require longer delays due to either broken transmission lines or limited cranking power availability. The final plateau of the curve indicates that all available generators, excluding permanently damaged units (G25), have completed their start-up procedures.
Solving the load recovery MISOCP model, Figure 10 shows the restoration result of the loads. According to the result of the generator capability curve, the total generation capacity of the system reaches 798 kW at time interval t = 30. At this stage, all available generators supply power to critical loads to ensure power supply.
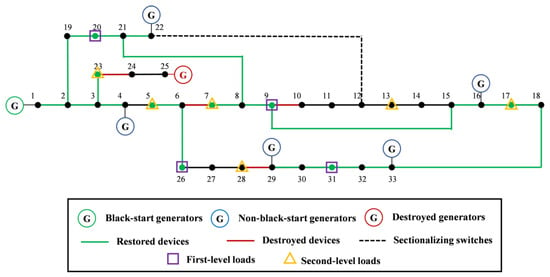
Figure 10.
Result of load restoration.
First-level loads are located at nodes 9, 20, 26, and 31, with load demands of 60 kW, 90 kW, 60 kW, and 150 kW, respectively. Second-level loads are assigned to nodes 5, 7, 13, 17, 23, and 28, with demands of 60 kW, 200 kW, 60 kW, 60 kW, 90 kW, and 60 kW, respectively. The restoration results in Table 4 show that all first-level loads are restored, totaling 360 kW. After satisfying all first-level loads, 438 kW of generation capacity remains available for second-level loads. Among the second-level loads, power is allocated to nodes 5, 7, 17, and 23, which collectively consume 410 kW. However, due to the limited residual capacity and network constraints, nodes 13 and 28 are not restored within this time interval.

Table 4.
Recovery rates of first- and second-level loads.
To validate the applicability and scalability of the proposed two-stage restoration method under a medium-scale test system, an additional case study is conducted based on a practical 61-bus distribution network. This system includes multiple generation resources and features a complex radial topology.
The network comprises a total of 61 nodes, with two black-start generators located at node 4 and node 43. The remaining six generators at nodes 8, 20, 24, 33, 36, and 45 are non-black-start generators that require cranking power from black-start generators to initiate their start-up processes. Figure 11 illustrates the original topology of the distribution network and marks the sectionalizing switches as well as the post-earthquake component failures.
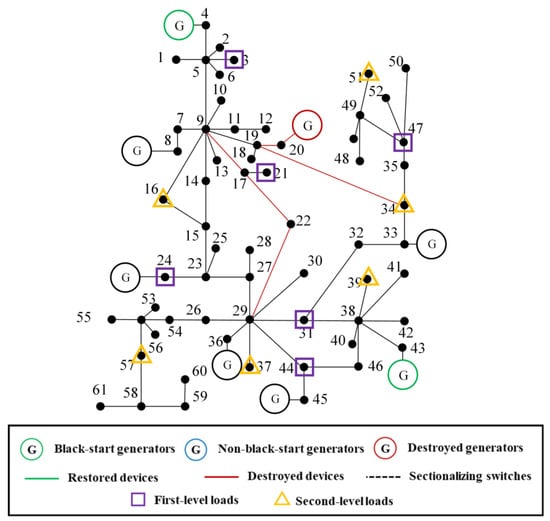
Figure 11.
Diagram of a practical 61-bus distribution network.
The simulation results of the 61-bus distribution network further demonstrate the effectiveness of the proposed two-stage restoration method under more realistic and larger-scale conditions. The results are shown in Table 5 and Table 6. Due to earthquake-induced damage, generator G20 is rendered inoperable and remains offline throughout the restoration process. In the initial time steps, both black-start generators located at nodes 4 and 43 are successfully energized and begin operation. The remaining non-black-start generators G8, G24, G33, G36, and G45 are sequentially restarted in t = 5 or t = 6 by receiving cranking power through feasible transmission paths.

Table 5.
Generator start-up times of the 61-bus distribution network test case.

Table 6.
Recovery rates of first- and second-level loads of the 61-bus test system.
During the subsequent load restoration phase, all first-level loads are fully restored, totaling 540 kW, which accounts for 100% of the first-level load demand. Additionally, 410 kW of second-level loads are restored, corresponding to 78.85% of their total demand. These results indicate that, despite earthquake-induced component failures and partial generator loss, the proposed method effectively coordinates generator start-up and load restoration under operational and topological constraints.
This case study confirms that the proposed framework is well-suited for medium-scale distribution systems, offering adaptive and efficient recovery strategies. The method can provide valuable operational guidance for post-earthquake distribution system dispatching by optimizing restoration decisions in a data-driven and scenario-specific manner.
In current practice, most distribution network restoration strategies rely on pre-defined black-start plans that are established under normal operating conditions. These pre-arranged schemes assume a fixed system topology and generator availability, and are not adapted in real-time to specific failure scenarios. While such strategies may be effective for predictable faults or controlled islanding events, they are often inadequate in the aftermath of large-scale natural disasters such as earthquakes. In particular, fixed black-start plans may fail to address topological fragmentation, component unavailability, or disrupted transmission paths, resulting in non-optimal or even infeasible restoration decisions. This can significantly reduce restoration efficiency and delay the recovery of critical loads.
In contrast, the method proposed in this paper dynamically adapts to post-disaster conditions by explicitly incorporating earthquake-induced damage scenarios into the restoration planning process. Through probabilistic failure modeling and scenario-based optimization, our approach identifies the optimal start-up sequence of available generators and coordinates load restoration pathways according to real-time system capabilities. This enhances the resilience of the distribution system by ensuring that restoration decisions remain feasible and efficient even under adverse conditions.
To evaluate the advantages of the proposed method, a comparative case study is conducted against an existing distribution network restoration approach that does not consider the impacts of earthquake-induced damage. Unlike our method, which explicitly models component failures and network degradation caused by seismic events, the existing approach assumes an intact system and follows a pre-defined black-start sequence. As a result, it may produce infeasible or suboptimal restoration decisions under disaster scenarios.
The simulation results demonstrate that the traditional approach, which assumes full connectivity and available resources, fails to restore critical generators and loads in scenarios with significant damage. The results of this method, the comparison method, are shown in Table 7 and Table 8. In this comparative case, only generators G1, G4, and G22 are successfully restarted, while the remaining units fail to recover due to disrupted energization paths affected by earthquake-induced line outages. Consequently, the available generation capacity for load restoration is significantly reduced to 440 kW. In the subsequent load recovery stage, only 210 kW of first-level loads are restored, accounting for 58.33% of total first-level demand. For second-level loads, 210 kW are restored, corresponding to 39.62% of the total. In contrast, the proposed method successfully navigates the degraded topology, achieves a higher critical load restoration rate, and ensures more reliable system recovery.

Table 7.
Comparison of generator start-up times.

Table 8.
Comparison of load restorations.
To further demonstrate the generality and robustness of the proposed two-stage restoration method, an additional simulation is conducted under a higher-intensity earthquake scenario. In this case, a more severe seismic event is assumed, characterized by increased PGA across the network area. The objective of this scenario is to evaluate the performance of the proposed method under extreme stress conditions where infrastructure damage is more extensive and restoration decisions are more challenging.
Specifically, the PGA at each node is scaled up by approximately 30% compared to the baseline scenario. This leads to higher failure probabilities for distribution components based on the fragility model. In particular, the average failure probability of overhead lines increases to approximately 0.60–0.85, while transformers and switching devices exhibit failure probabilities in the range of 0.40–0.60. As a result, the network experiences more severe fragmentation, with a larger number of nodes and feeders becoming electrically isolated. The degraded topology of a severe earthquake is shown in Figure 12.
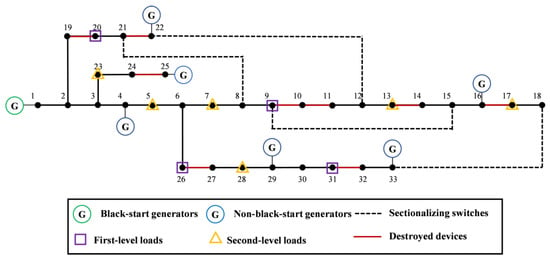
Figure 12.
A representative degraded topology after a severe earthquake.
Solving the MILP and MISOCP model, the test results are shown in Table 9 and Table 10. As a consequence, only three generators, G1, G4, and G16, are successfully restarted during the restoration process. G1 is energized at the beginning of the restoration because of its black-start capability. Subsequently, G4 and G16 are restarted after limited cranking support is routed through partially restored transmission paths. The remaining generators are unable to initiate start-up due to broken supply paths and insufficient cranking power, resulting in a severely constrained generation capacity throughout the recovery horizon.

Table 9.
Generator start-up times under a higher-intensity earthquake scenario.

Table 10.
Recovery rates of first- and second-level loads under a higher-intensity earthquake scenario.
The limited generation availability, combined with disrupted network connectivity, directly impacts the system’s ability to restore prioritized loads. By the end of the recovery process, only 58.33% of first-level loads and 37.73% of second-level loads are restored. The reduction in critical load recovery reflects not only the generation shortage but also the loss of network continuity to specific high-priority nodes. In particular, several first-level loads are located at nodes whose supply routes are permanently disconnected due to cascading line failures.
6. Conclusions
This paper presents a two-stage restoration method for distribution networks under earthquake conditions, which integrates generator start-up coordination and prioritized load recovery into a unified optimization framework. A seismic failure modeling approach is developed using GMPEs with fragility curves, enabling the construction of realistic degraded network topologies through probabilistic simulation. Then, a two-stage restoration is built. The generator start-up model incorporates cranking power constraints and radial connectivity to determine optimal generator activation sequences and timing. The load restoration model maximizes weighted load restoration under operational constraints, including power flow, voltage, current, and network topology. Simulation results demonstrate that the proposed method effectively captures the impact of earthquake-induced failures on distribution networks. The generator start-up model enables accurate estimation of recovery timelines and ensures early reestablishment of generation capacity, while the load recovery model enhances system resilience by prioritizing critical loads. Case studies under different earthquake intensities confirm the method’s feasibility, adaptability, and general applicability across varying disaster scenarios.
Future research will explore the integration of communication and transportation infrastructure interdependencies into the restoration planning process. In addition, incorporating uncertainty-aware robust optimization techniques, real-time adaptive control, and multi-agent coordination strategies may further enhance the practical applicability of the proposed method in complex disaster environments.
Author Contributions
Conceptualization, L.P.; methodology, L.P. and A.Z.; resources, J.Q. and Z.Q.; software, A.Z., Q.S. and S.P.; data curation, Q.S., Z.Q. and M.X.; writing—original draft, L.P. and A.Z.; writing—review and editing, J.Q. and M.X.; Supervision, J.Q. All authors have read and agreed to the published version of the manuscript.
Funding
This research was funded by Science and Technology Program of State Grid “Research on Data-Driven Operational Situation Analysis and Dynamic Optimization Technologies for Power Supply Services”. The grant number is 52100125002D-128-ZN.
Data Availability Statement
The original contributions presented in this study are included in the article. Further inquiries can be directed to the corresponding author.
Conflicts of Interest
Author Lin Peng, Aihua Zhou, Junfeng Qiao, Qinghe Sum, Min Xu and Sen Pan was employed by China Electric Power Research Institute. Author Zhonghao Qian was employed by the company State Grid Jiangsu Electric Power Co., Ltd.
Abbreviations
The following abbreviations are used in this manuscript:
| GMPE | Ground motion prediction equation |
| PGA | Peak ground acceleration |
| MILP | Mixed-integer linear programming |
| MISOCP | Mixed-integer second-order cone programming |
Appendix A

Table A1.
The parameters of generators.
Table A1.
The parameters of generators.
| Generator No. | Cranking Time | Cranking Power | Ramp Rate | Maximum Output |
|---|---|---|---|---|
| G1 | 1 | 0 | 70 | 120 |
| G4 | 6 | 5 | 80 | 160 |
| G16 | 6 | 18 | 86 | 180 |
| G22 | 6 | 30 | 80 | 160 |
| G25 | 6 | 16 | 100 | 200 |
| G29 | 6 | 22 | 60 | 140 |
| G33 | 6 | 20 | 60 | 140 |

Table A2.
The parameters of loads in the IEEE-33 system.
Table A2.
The parameters of loads in the IEEE-33 system.
| Bus No. | Load (kW) | Load Weight |
|---|---|---|
| 1 | 0 | 0.1 |
| 2 | 100 | 0.1 |
| 3 | 90 | 0.1 |
| 4 | 120 | 0.1 |
| 5 | 60 | 1 |
| 6 | 60 | 0.1 |
| 7 | 200 | 1 |
| 8 | 200 | 0.1 |
| 9 | 60 | 100 |
| 10 | 60 | 0.1 |
| 11 | 45 | 0.1 |
| 12 | 60 | 0.1 |
| 13 | 60 | 1 |
| 14 | 120 | 0.1 |
| 15 | 60 | 0.1 |
| 16 | 60 | 0.1 |
| 17 | 60 | 1 |
| 18 | 90 | 0.1 |
| 19 | 90 | 0.1 |
| 20 | 90 | 100 |
| 21 | 90 | 0.1 |
| 22 | 90 | 0.1 |
| 23 | 90 | 1 |
| 24 | 420 | 0.1 |
| 25 | 420 | 0.1 |
| 26 | 60 | 100 |
| 27 | 60 | 0.1 |
| 28 | 60 | 1 |
| 29 | 120 | 0.1 |
| 30 | 200 | 0.1 |
| 31 | 150 | 100 |
| 32 | 210 | 0.1 |
| 33 | 60 | 0.1 |

Table A3.
The parameters of branches in the IEEE-33 system.
Table A3.
The parameters of branches in the IEEE-33 system.
| Branch No. | From | To | R (Ω) | X (Ω) |
|---|---|---|---|---|
| 1 | 1 | 2 | 0.0922 | 0.0470 |
| 2 | 2 | 3 | 0.4930 | 0.2511 |
| 3 | 3 | 4 | 0.3660 | 0.1864 |
| 4 | 4 | 5 | 0.3811 | 0.1941 |
| 5 | 5 | 6 | 0.8190 | 0.7070 |
| 6 | 6 | 7 | 0.1872 | 0.6188 |
| 7 | 7 | 8 | 0.7114 | 0.2351 |
| 8 | 8 | 9 | 1.0300 | 0.7400 |
| 9 | 9 | 10 | 1.0440 | 0.7400 |
| 10 | 10 | 11 | 0.1966 | 0.0650 |
| 11 | 11 | 12 | 0.3744 | 0.1298 |
| 12 | 12 | 13 | 1.4680 | 1.1550 |
| 13 | 13 | 14 | 0.5416 | 0.7129 |
| 14 | 14 | 15 | 0.5910 | 0.5260 |
| 15 | 15 | 16 | 0.7463 | 0.5450 |
| 16 | 16 | 17 | 1.2890 | 1.7210 |
| 17 | 17 | 18 | 0.7320 | 0.5740 |
| 18 | 2 | 19 | 0.1640 | 0.1565 |
| 19 | 19 | 20 | 1.5042 | 1.3554 |
| 20 | 20 | 21 | 0.4095 | 0.4784 |
| 21 | 21 | 22 | 0.7089 | 0.9373 |
| 22 | 3 | 23 | 0.4512 | 0.3083 |
| 23 | 23 | 24 | 0.8980 | 0.7091 |
| 24 | 24 | 25 | 0.8960 | 0.7011 |
| 25 | 6 | 26 | 0.2030 | 0.1034 |
| 26 | 26 | 27 | 0.2842 | 0.1447 |
| 27 | 27 | 28 | 1.0590 | 0.9337 |
| 28 | 28 | 29 | 0.8042 | 0.7006 |
| 29 | 29 | 30 | 0.5075 | 0.2585 |
| 30 | 30 | 31 | 0.9744 | 0.9630 |
| 31 | 31 | 32 | 0.3105 | 0.3619 |
| 32 | 32 | 33 | 0.3410 | 0.5302 |
| 33 | 8 | 21 | 2.0000 | 2.0000 |
| 34 | 9 | 15 | 2.0000 | 2.0000 |
| 35 | 12 | 22 | 2.0000 | 2.0000 |
| 36 | 18 | 33 | 0.5000 | 0.5000 |
| 37 | 25 | 29 | 0.5000 | 0.5000 |
References
- Adibi, M.; Clelland, P.; Fink, L.; Happ, H.; Kafka, R.; Raine, J.; Scheurer, D.; Trefny, F. Power system restoration-a task force report. IEEE Trans. Power Syst. 1987, 2, 271–277. [Google Scholar] [CrossRef]
- Patsakis, G.; Rajan, D.; Aravena, I.; Rios, J.; Oren, S. Optimal black start allocation for power system restoration. IEEE Trans. Power Syst. 2018, 33, 6766–6776. [Google Scholar] [CrossRef]
- Khodaei, A. Resiliency-oriented microgrid optimal scheduling. IEEE Trans. Smart Grid 2014, 5, 1584–1591. [Google Scholar] [CrossRef]
- Sakaguchi, T.; Matsumoto, K. Development of a knowledge based system for power system restoration. IEEE Trans. Power Appar. Syst. 1983, PAS-102, 320–329. [Google Scholar] [CrossRef]
- Rugthaicharoencheep, N.; Sirisumrannukul, S. Feeder reconfiguration for loss reduction in distribution system with distributed generators by tabu search. GMSARN Int. J. 2009, 3, 47–54. [Google Scholar]
- Adibi, M.M.; Fink, L.H. Power system restoration planning. IEEE Trans. Power Syst. 1994, 9, 22–28. [Google Scholar] [CrossRef]
- Cotilla-Sanchez, E.; Hines, P.D.H.; Barrows, C.; Blumsack, S. Comparing the topological and electrical structure of the North American electric power infrastructure. IEEE Syst. J. 2012, 6, 616–626. [Google Scholar] [CrossRef]
- Shoji, G.; Takahashi, D.; Tsukiji, T.; Naba, S. Damage assessment on electric power failures during the 2011 off the pacific coast of tohoku earthquake. J. Disaster Res. 2012, 7, 491–499. [Google Scholar] [CrossRef]
- Čavlović, M.; Pirić, D.; Periša, I. Management of the distribution system operation during the crisis: Earthquake in Republic of Croatia in 2020. In Proceedings of the 27th International Conference on Electricity Distribution (CIRED 2023), Rome, Italy, 12–15 June 2023; IET: London, UK, 2023; pp. 3003–3007. [Google Scholar]
- Demir, A. Post-earthquake structural damage assessment, lessons learned, and addressing objections following the 2023 Kahramanmaras, Turkey earthquakes. Bull. Earthq. Eng. 2025, 23, 1107–1127. [Google Scholar] [CrossRef]
- Yuan, W.; Wang, J.; Qiu, F.; Chen, C.; Kang, C.; Zeng, B. Robust optimization-based resilient distribution network planning against natural disasters. IEEE Trans. Smart Grid 2016, 7, 2817–2826. [Google Scholar] [CrossRef]
- Khaledi, A.; Saifoddin, A. Three-stage resilience-oriented active distribution systems operation after natural disasters. Energy 2023, 282, 128360. [Google Scholar] [CrossRef]
- Bhusal, N.; Gautam, M.; Abdelmalak, M.; Benidris, M. Modeling of natural disasters and extreme events for power system resilience enhancement and evaluation methods. In Proceedings of the 2020 International Conference on Probabilistic Methods Applied to Power Systems (PMAPS), Liege, Belgium, 18–21 August 2020; IEEE: Piscataway, NJ, USA, 2020; pp. 1–6. [Google Scholar]
- Gol, E.A.; Erkal, B.G.; Göl, M. A novel MDP based decision support framework to restore earthquake damaged distribution systems. In Proceedings of the 2019 IEEE PES Innovative Smart Grid Technologies Europe (ISGT-Europe), Bucharest, Romania, 29 September–2 October 2019; IEEE: Piscataway, NJ, USA, 2019; pp. 1–5. [Google Scholar]
- Işık, İ.; Gol, E.A. Field teams coordination for earthquake-damaged distribution system energization. Reliab. Eng. Syst. Saf. 2024, 245, 110050. [Google Scholar] [CrossRef]
- Weinmann, R.; Cotilla-Sanchez, E.; Brekken, T.K.A. Toward models of impact and recovery of the us western grid from earthquake events. Energies 2022, 15, 9275. [Google Scholar] [CrossRef]
- Fard, M.F.; Sahraei-Ardakani, M.; Ou, G.; Liu, M. Targeted hardening of electric distribution system for enhanced resilience against earthquakes. In Proceedings of the 2022 IEEE 31st International Symposium on Industrial Electronics (ISIE), Anchorage, AK, USA, 1–3 June 2022; IEEE: Piscataway, NJ, USA, 2022; pp. 870–875. [Google Scholar]
- El Zonkoly, A. Renewable energy sources for complete optimal power system black start restoration. IET Gener. Transm. Distrib. 2015, 9, 415–424. [Google Scholar] [CrossRef]
- Chen, B. Black Start Restoration for Electric Distribution Systems and Microgrids. Ph.D. Thesis, Texas A&M University, College Station, TX, USA, 2017. [Google Scholar]
- Pardo-Martínez, R.A.; López-Lezama, J.M.; Muñoz-Galeano, N. Optimal generation start-up methodology for power system restoration considering conventional and non-conventional renewable energy sources. Appl. Sci. 2021, 11, 8246. [Google Scholar] [CrossRef]
- Qiu, F.; Wang, J.-H.; Chen, C.; Tong, J. Optimal black start resource allocation. IEEE Trans. Power Syst. 2016, 31, 1133–1141. [Google Scholar] [CrossRef]
- Wang, J.; Mu, L.; Zhang, F.; Zhang, X. A parallel restoration for black start of microgrids considering characteristics of distributed generations. Energies 2017, 11, 1. [Google Scholar] [CrossRef]
- Zhao, M.; Maloney, P.R.; Ke, X.; Ceballos, J.C.B.; Fan, X.; Elizondo, M.A. Power System Recovery Coordinated with (Non-) Black-Start Generators. In Proceedings of the 2023 IEEE Power & Energy Society General Meeting (PESGM), Orlando, FL, USA, 16–20 July 2023; IEEE: Piscataway, NJ, USA, 2023; pp. 1–5. [Google Scholar]
- Sekhavatmanesh, H.; Cherkaoui, R. Analytical approach for active distribution network restoration including optimal voltage regulation. IEEE Trans. Power Syst. 2018, 34, 1716–1728. [Google Scholar] [CrossRef]
- Wang, Y.; Xu, Y.; He, J.; Liu, C.-C.; Schneider, K.P.; Hong, M.; Ton, D.T. Coordinating multiple sources for service restoration to enhance resilience of distribution systems. IEEE Trans. Smart Grid 2019, 10, 5781–5793. [Google Scholar] [CrossRef]
- Asadi, Q.; Falaghi, H.; Ramezani, M. Load restoration of electricity distribution systems using a novel two-stage method. J. Eng. 2024, 2024, e12402. [Google Scholar] [CrossRef]
- Xu, Y.; Liu, C.C.; Schneider, K.P.; Tuffner, F.K.; Ton, D.T. Microgrids for service restoration to critical load in a resilient distribution system. IEEE Trans. Smart Grid 2016, 9, 426–437. [Google Scholar] [CrossRef]
- Sekhavatmanesh, H.; Cherkaoui, R. A multi-step reconfiguration model for active distribution network restoration integrating DG start-up sequences. IEEE Trans. Sustain. Energy 2020, 11, 2879–2888. [Google Scholar] [CrossRef]
- Fu, L.; Meng, K.; Liu, B.; Dong, Z.Y. Mixed-integer second-order cone programming framework for optimal scheduling of microgrids considering power flow constraints. IET Renew. Power Gener. 2019, 13, 2673–2683. [Google Scholar] [CrossRef]
- Boore, D.M.; Stewart, J.P.; Seyhan, E.; Atkinson, G.M. NGA-West2 equations for predicting PGA, PGV, and 5% damped PSA for shallow crustal earthquakes. Earthq. Spectra 2014, 30, 1057–1085. [Google Scholar] [CrossRef]
- Lu, X.; McKenna, F.; Cheng, Q.; Xu, Z.; Zeng, X.; Mahin, S.A. An open-source framework for regional earthquake loss estimation using the city-scale nonlinear time history analysis. Earthq. Spectra 2020, 36, 806–831. [Google Scholar] [CrossRef]
Disclaimer/Publisher’s Note: The statements, opinions and data contained in all publications are solely those of the individual author(s) and contributor(s) and not of MDPI and/or the editor(s). MDPI and/or the editor(s) disclaim responsibility for any injury to people or property resulting from any ideas, methods, instructions or products referred to in the content. |
© 2025 by the authors. Licensee MDPI, Basel, Switzerland. This article is an open access article distributed under the terms and conditions of the Creative Commons Attribution (CC BY) license (https://creativecommons.org/licenses/by/4.0/).