Abstract
Parkinson’s disease, a progressive neurodegenerative disorder of the motor system, shows non-motor symptoms up to 10 years before classic motor signs, highlighting the importance of early detection for effective treatment. This study proposes a severity index using an Artificial Neural Network (ANN) trained by the Self-Organizing Maps (SOM) algorithm, with data from the FOX Insight database. After pre-processing, 41,892 questionnaires were selected, covering 25 questions about non-motor symptoms, defined by a neurologist, and divided into four classes representing stages of the disease. The goal is to offer a tool to classify patients based on these symptoms, allowing for accurate monitoring and personalized interventions. Validation was carried out with data from patients responding to the questionnaire at spaced moments, simulating medical consultations. The study was successful in developing the severity index, highlighting the importance of gastrointestinal and urinary symptoms at different stages. The persistence of difficulty sleeping in group 3 indicates special attention must be paid to this symptom in the initial stages. These results highlight the clinical and practical relevance of the index, although more studies with real patients are needed for validation.
1. Introduction
Faced with the challenging scenario presented by Parkinson’s disease (PD), one of the world’s leading neurodegenerative diseases, it is crucial to understand its epidemiology and the challenges faced in early and accurate diagnosis. According to recent studies [1,2], the prevalence of PD has increased significantly, with estimates ranging from 257 to 1400 cases per 100,000 inhabitants in Europe. In addition, the World Health Organization (WHO) warns that the prevalence of PD increases considerably with age, affecting up to 4% of people over the age of 80, which implies more than 8.5 million people are affected globally, a figure that is expected to double by 2040 [3].
Diagnosing PD is a complex challenge that requires clinical experience and precise diagnostic methods. The criteria established by the Movement Disorder Society (MDS) are often used as a reference, emphasizing motor symptoms such as bradykinesia, resting tremor, and rigidity. However, the lack of specific biomarkers and in vivo tests makes diagnosis even more challenging [4]. In addition, non-motor symptoms can appear up to 10 years before motor symptoms, increasing the complexity of the diagnosis. Studies show that the diagnostic error rate can vary from 10% to 50%, often due to negligence in assessing and discussing non-motor symptoms [5].
In this context, predictive medicine and computerized diagnostic support systems, especially those based on Artificial Intelligence (AI) and Artificial Neural Networks (ANNs), have emerged as promising approaches to improving diagnostic accuracy. Modeled based on neural connections, ANNs have proven effective in individualized data analysis and more accurate clinical decision-making [6].
The application of machine learning (ML) and deep learning (DL) in predicting neurodegenerative diseases has gathered significant attention due to the potential for early diagnosis, prognosis, and therapeutic development for the automation of actionable insights and improved patient outcomes. Convolutional neural networks (CNNs) were used to predict Alzheimer’s disease (AD) from MRI images [7], and Parkinson’s disease (PD) from a non-invasive biomarker given by patients’ spiral drawings [8,9].
Also, a multi-modal DL approach has been shown to significantly improve the accuracy of predicting the evolution of AD [10]. A probabilistic programmed deep kernel learning approach presents a possibility for the personalized, predictive modeling of neurodegenerative diseases through the combination of Gaussian processes with neural networks [11].
ML and DL have been specifically applied to predict PD. Promising results have been described in diagnosis, progression tracking, and treatment efficacy evaluation. Watts et al. [12] developed an ML technique for candidate selection, programming optimization, and surgical targeting for Deep Brain Stimulation (DBS), a treatment for advanced PD. Sahu et al. [13] combined regression analysis and ANNs to diagnose PD with 93.46% accuracy.
Data sets based on motor and nonmotor symptoms were used. Wingate et al. [14] applied Deep Convolutional and Recurrent Neural Networks to analyze medical imaging such as MRI and DaTscans for PD diagnosis, showing effective prediction capabilities across different medical environments. Shubhangi and Gundagurti [15] applied a CNN, specifically the AlexNet architecture, to MR images for the diagnosis of PD, achieving high accuracy levels. Moreover, voice samples from healthy individuals and PD patients were used for early PD detection [16].
Therefore, within the challenges faced in the diagnosis and management of PD, the use of predictive approaches and AI technologies offers a new perspective for improving diagnostic accuracy, providing a significant impact on patients’ quality of life.
Considering these data, the current study follows a line of research [17] that used ANNs to develop a PD severity index based on motor symptoms. After validating the importance of non-motor symptoms, it became clear that it was pertinent to conduct this research focusing on these aspects. This study adopts the same methodological approach to develop a PD severity index, now focused on non-motor symptoms, to improve diagnostic accuracy.
The objectives of this study were to develop a severity index for PD taking into account the non-motor symptoms of the disease; to validate the comprehensive severity index for PD, using non-motor symptoms as the main evaluation criteria; and to evaluate the correlation between the specific characteristics of non-motor symptoms and the severity of PD.
In terms of contribution, this index allows for a more individualized approach to treatment, taking into account the diversity of non-motor symptoms. The early recognition of patterns of severity of clinical involvement is another advantage that allows for early intervention and the more effective management of the condition. In addition, the score provides information on the relationship between non-motor symptoms and disease severity, which guides more targeted treatment decisions. In conclusion, this project not only advances current research in PD but also provides a solid basis for future research.
2. Materials and Methods
2.1. Model Development
The variables considered in this project were selected to provide the ANN model with data that represent the scope of the non-motor symptoms of PD, according to the objectives of the work. This selection was made with the support of an expert in the field to ensure the inclusion of symptoms and characteristics relevant to the progression of the disease. This set of characteristics corresponds to the first layer of information available in the system. In general, these data can be obtained by a health professional during a consultation, which simplifies the practical use of the proposed scale.
2.2. Selection of Variables from Fox Insight
The data analyzed were extracted from the FOX Insight database [18], which stores information on patients suspected to have or diagnosed with PD. It is an international, longitudinal, and observational database that stores clinical variables and the quality of life of patients, with the aim of better characterizing their natural history. This record contributes to understanding the various clinical presentations of the disease and its evolution, helping to improve diagnostic research and treatment. This platform offers questionnaires in which patients indicate the presence of certain symptoms, as well as their intensity. It is a database of questionnaires answered by both patients and caregivers, which provides a wide range of information.
After a detailed analysis of the platform, the available questions and answers were reviewed. Subsequently, the questions considered relevant to the objectives of the study were selected. This stage was carried out under the supervision of a neurologist, taking into account the scientific basis in currently published articles related to the disease and the specialist’s clinical experience. This choice was made to maintain the heterogeneity of the sample and ensure the effectiveness of this work.
Three groups of questions related to non-motor symptoms were selected, each with its specification and relevance. Group 1 refers to questions related to gastrointestinal and urinary symptoms. Group 2 refers to questions related to pain symptoms, emotions, and behavior. Group 3 refers to questions related to sleep and sensory symptoms.
Table 1 provides details of the selected questions and their respective groups, which were used as input data for the neural network model developed in this study.

Table 1.
Description of the questions selected from the Fox Insight database.
2.3. Coding the Data into Numerical Variable
To feed the ANN, the Fox Insight data were coded. Categorical variables were coded 0 (yes) or 1 (no), indicating the presence or absence of the symptom, respectively.
2.4. Data Included and Excluded
Initially, all questions related to non-motor symptoms of PD were selected from the available database, totaling 102 questions. These questions were then subjected to analysis in conjunction with a neurologist, taking into consideration their clinical experience and the available scientific evidence. During this analysis, similar questions were identified and grouped, and those whose exclusion would not compromise the study were removed, resulting in 49 final questions. Subsequently, an assessment was conducted to identify blank or unusable questions due to lack of information, which were excluded from the dataset. Additionally, to avoid duplications, only the first available questionnaire from each participant was retained. As a result of this process, 25 essential questions remained, which were divided into 3 groups referring to different non-motor symptoms of the disease, as guided by the neurologist. This final dataset totaled 41,892 individual data points, representing the study population. This detailed and meticulous approach ensured the quality and reliability of the analyzed data, providing a solid foundation for the research findings.
2.5. Algorithm
In this work, a model was developed and implemented in MATLAB version R2022b to address the project’s objective of creating a severity scale for PD without relying on target labels during model training. The chosen approach was data clustering, considered most suitable for the task. This strategy employed a Self-Organizing Map (SOM), a type of ANN, to explore underlying patterns and relationships in observational data, contributing to a more comprehensive analysis.
The SOM was selected for its ability to map input signals of arbitrary dimensions into a two-dimensional space, making it particularly advantageous for visualizing complex data relevant to healthcare professionals. During the training process, a SOM’s topography is gradually adjusted based on the provided data, revealing implicit structures of similarity between observations. The SOM achieves dimension reduction intrinsically during training, initializing the weights of each neuron in the SOM grid and adjusting them based on presented input data samples (in this case, patients’ symptoms). Through multiple training epochs, the SOM grid self-organizes so that neurons close to each other represent similar patterns in the input data, effectively reducing data dimensionality and enabling visualization and analysis in a lower-dimensional space.
The model’s hyperparameters were configured according to MATLAB’s selfOrgMap function standards, except the topologyFcn parameter was set as ‘gridtop’ to create a rectangular topology. Data splitting for training and testing was performed internally by the algorithm, with 200 training epochs conducted using Mean Squared Error (MSE) as the performance metric. Data splitting for training and testing utilized the first questionnaire, while subsequent queries were used to validate the model.
Choice of Data Processing Strategy
The reason for grouping the data, in the case of this project, the questions related to non-motor symptoms, was to separate the different classes of disease manifestation and thus generate a severity index that is easy to use. Clustering aims to discover similar implicit structures in a data set. These “clusters” contain examples of data that are similar to each other and, in most cases, this similarity can be measured by geometric distance. The closer the feature vectors are, the more similar the individuals in a population are.
The SOM method was chosen for this work, as previously mentioned, with a map size of 6 × 6, totaling 36 neurons. This choice sought to balance the representativeness of the model and avoid overfitting. The 6 × 6 dimension was chosen to allow a clear visual representation, avoiding redundancy and maintaining interpretability. This decision met the scientific need for effective representation, considering the complexity of the data and the ease of visual interpretation [19,20].
Patient information from the FOX Insight database, after coding, was used as input information for the ANN. The SOM mapped the data in a two-dimensional grid of neurons, maintaining the notion of neighborhood [21].
The U-Matrix (Unified Distance Matrix) was then applied to visualize the “clusters” formed by the SOM. Given a neuron J and its respective weight Wj, the U-Matrix calculates the distance between the weights Wj of the neighboring neurons. The result is an image where each hexagon can be interpreted as the calculated distance, and the reading of this proximity is evaluated, in which dark, black colors indicate the proximity of the neurons (these neurons are activated by many inputs) and light, yellowish colors show their distance (few inputs activate these neurons).
Figure 1a shows the visual representation of the U-Matrix. The K-means method was then used to generate the data classes (from Class 1 to Class 4), as shown in Figure 1b [22]. For the K-means algorithm, the parameterization was also set to the default used by MATLAB. The maximum number of iterations was set to 100, centroid initialization was randomly adjusted using the ‘sample’ method, and the Euclidean distance as the distance metric.
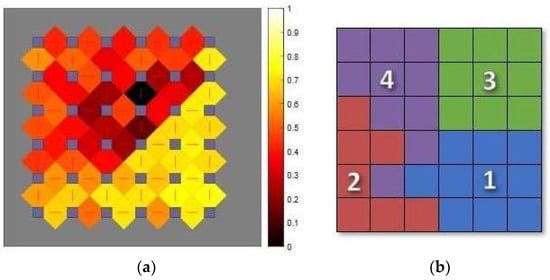
Figure 1.
(a) U-Matrix; (b) classes formed by the K-means method.
When the K-means algorithm was applied to the map, four classes were obtained, which were numbered according to the order of severity, when each symptom was analyzed individually. They were also differentiated by colors, chosen at random, to better identify each class.
2.6. Mapping of Subsequent Queries and Validation
In the training data set, 26,755 patients had records of medical consultations after the baseline. The data from each consultation were coded and organized into vectors according to the same procedures adopted previously. Each vector was then compared with the weight vectors to determine the most similar neuron (BMU, Best Matching Unit). At this stage, the network weights were not adjusted. The aim was to define the location of the neuron triggered in each consultation to obtain the patients’ trajectories through the map as their clinical condition progressed. In the project validation stage, the same procedure was adopted. Each input vector was compared to the neurons on the map to determine their BMU, without adjusting the neuronal network weights.
3. Results
3.1. Age Analysis
Analyzing the age distribution of PD patients and their non-motor symptoms in Figure 2 reveals a wide age range of 18 to 119 years, which includes different stages of the disease (classes are differentiated by colours). This age difference is significant, especially considering that non-motor symptoms can appear up to 10 years before motor symptoms.
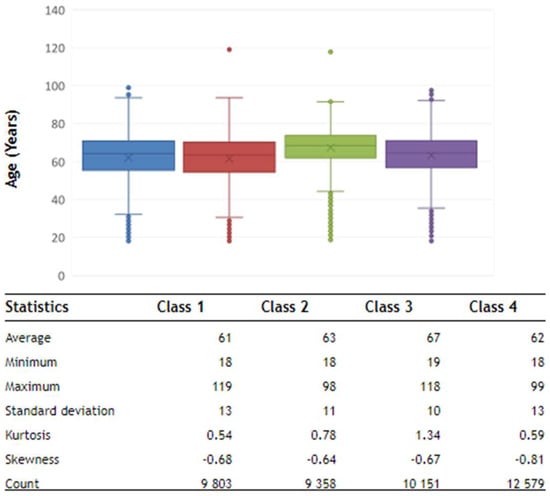
Figure 2.
Descriptive statistics of the ages of the patients in the database.
In the initial phase (Class 1—mild phase), where the frequency of symptoms is expected to be lower, the minimum age of the patients is 18. This finding confirms evidence that non-motor symptoms can appear early in PD, even in younger people, long before the classic motor symptoms appear.
As the disease progresses to a more pronounced stage, the age distribution widens, reflecting considerable diversity. This is observed in intermediate (Class 2), moderate (Class 3), and advanced (Class 4) patients, while continuing to occur in young patients, suggesting that PD with non-motor symptoms is not limited to a particular age group. This analysis reinforces the complexity of PD and the variability in the manifestations of non-motor symptoms in the different stages of the disease.
3.2. Component Maps
The component map is a convenient type of SOM visualization for analyzing the distribution of each patient symptom across a map. These maps should be interpreted according to the color scale, where yellow corresponds to the presence of the symptom and black indicates its absence. In addition, the symptoms are categorized according to the class in which the neurons were activated. Class 1, also known as the ‘Initial Stage’, represents the early stages of a disease. At this stage, symptoms can be subtle or almost unnoticeable. Some individuals in this class may not even have the disease, but are included because they have a few signs or symptoms. Class 2, labeled the ‘Intermediate Stage’, describes progression beyond the initial stage, but before reaching more serious levels. Class 3, labeled the ‘Advanced Moderate Stage’, indicates a more advanced phase of the disease, but before the more severe stages. Class 4, named the ‘Advanced Stage’, represents a significant progression of the disease, characterized by a more profound impact on quality of life.
In the analysis of Group 1, symptoms relating to gastrointestinal and urinary issues are presented, highlighting aspects of these patients’ daily lives. The analysis of the neuronal maps revealed distinct patterns of neuronal activation in response to specific questions about non-motor symptoms of PD.
In Figure 3, in MoveSaliva, which is associated with saliva dripping, the predominance of activated neurons in Classes 3 and 4 suggests a direct relationship between the severity of this symptom and the intensity of the neuronal response.
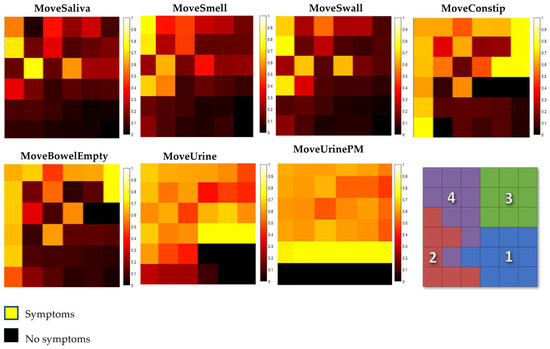
Figure 3.
Group referring to gastrointestinal and urinary symptoms.
The analysis of MoveSmell, related to the loss of or alteration in taste/olfaction, reveals predominant activation in Classes 3 and 4, along with presence in Class 2, indicating a diverse neuronal response to this symptom.
As for MoveSwall on difficulty swallowing food or drink and choking problems in the last month, a significant distribution of neuronal activation is revealed, with neurons concentrated in Class 4. This high concentration in Class 4 suggests a relationship between the symptoms and the severity of the disease.
MoveConstip and MoveBowelEmpty, referring to the questions about the feeling of incomplete emptying of the bowel and constipation in the last month, reveal specific patterns of neuronal activation. In the question about the feeling of incomplete emptying, the most significant concentration of neurons is in Class 4. As for the question about constipation, the highest concentration of neurons in Class 4 points to a significant neuronal response associated with this symptom, while Classes 2 and 3 indicate variations.
The analysis of the neuronal maps referring to the sensation of ‘urgently needing to urinate’ and the frequency of getting up at night to urinate in the last month (MoveUrine and MoveUrinePM) shows the complexity of the problems in the autonomic nervous system in PD. There is a higher concentration of neurons in Class 4 in the questions about urgency to urinate, which coincides with previous research showing problems in the autonomic nervous system as something common in PD, affecting several areas, including the urinary system. In addition, there is neuronal activation in Classes 1, 2, and 3, revealing that this symptom is present from the early stages of the disease.
Concerning the frequency of getting up at night to urinate, the consistently high activity in Classes 3 and 4 highlights the persistence of this symptom.
In the analysis carried out by Group 2, symptoms related to pain, emotions, and behavior in PD are addressed. When examining Figure 4, in the MovePain image associated with unexplained pain, there is a concentration of neurons in Classes 2, 3, and, more significantly, in Class 4. This neuronal activity covers many classes of neurons, indicating a possible association between the presence of unexplained pain and intermediate and advanced stages of PD.
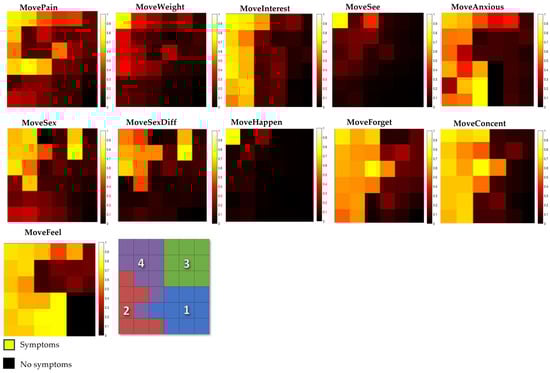
Figure 4.
Group referring to pain symptoms, emotions, and behavior.
As for MoveWeight, referring to the question about unexplained weight change, Class 4 again shows the greatest neuronal activation, indicating a more pronounced neuronal association with this condition.
Concerning MoveInterest, it can be seen that few neurons are activated in Class 1. However, as the severity of the disease increases, there is a significant change in this symptom. In Class 2, there is a considerable increase compared to Class 1. Surprisingly, in Class 3, there is a decrease in activated neurons, contrary to the upward trend observed in the previous classes. And when moving on to Class 4, characterized as severe, there is a marked increase.
Concerning MoveSee, notable activation is revealed in Class 4 regarding the perception of facts that the patient knows or has been told do not exist, indicating a more pronounced neuronal response to that specific experience in the more advanced class.
In MoveAnxious, when it comes to feelings of anxiety and panic, Class 4 demonstrates the greatest neuronal activation. There is higher activation in Class 2 compared to Class 3. This result may suggest a differential influence of disease progression on the manifestations of this symptom. Classes 1 and 3 show lower neuronal activations.
The analysis of the MoveSex image reveals marked neuronal activation in Class 4, corroborating previous studies that highlight sexual dysfunctions in Parkinson’s disease. While in Class 1, there is a low activation of neurons, a significant increase is observed in Classes 2 and 3. Specifically regarding difficulty in having sex, in the MoveSexDiff image, Class 4 also shows notable activation.
In MoveHappen, regarding the question about belief in events not perceived by other people in different classes, it is possible to observe a distinct pattern. In Class 1, this symptom is not present. In Class 2 and Class 3, there is a slight presence. However, it is in Class 4 that it stands out, suggesting a stronger association between this symptom and the more advanced stages of the disease.
Analyzing MoveForget and MoveConcent on recent memory problems and difficulty concentrating, a pattern of symptom evolution can be seen as PD progresses. Initially, in Class 1, a modest presence of these symptoms is observed. However, in Class 2, an increase in the prevalence of these symptoms is noted, in line with scientific findings on the progression of cognitive symptoms in PD.
In MoveFell, it is noted that this is also a symptom that is present from the beginning of the disease, being more present in Class 2 and Class 4.
Subsequently, the figures from group 3 were analyzed, which concerns questions related to sleep and sensory symptoms. In the neural maps associated with questions about sleep-related difficulties, distinct patterns are observed.
In Figure 5, in the MoveAwake image that corresponds to the question about difficulty staying awake during daytime activities, there is an initial lower representation in Class 1, followed by an increase in the following classes, culminating in the greatest representation in Class 4. In MoveSleep, related to the question about difficulty sleeping at night or staying asleep, a marked trend of progressive increases in the representation of classes is identified. Initially, there is considerable representation in Class 1; however, this representation increases significantly in later classes, suggesting a higher prevalence of difficulties sleeping or staying asleep during the night as the disease progresses to more advanced stages.
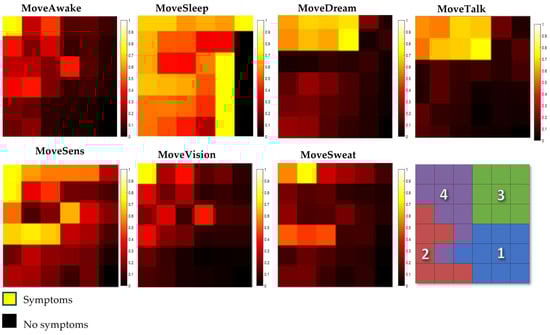
Figure 5.
Group referring to sleep and sensory symptoms.
Regarding MoveDream and MoveTalk, the data indicate that initially, lower representation is predicted in Class 1 and progressively increases in the following classes. This increase is notable in Class 4, indicating a greater prevalence of these symptoms in this specific class.
MoveSens, associated with unpleasant sensations in the legs at night or during rest and the need for movement, demonstrates a gradual increase with progression between classes. This progression highlights a higher incidence of these sensations in Class 4, suggesting a strong association of these discomforts with the progression of the disease.
MoveVision is related to the experience of double vision. Initially, it is less frequent in Class 1, but this symptom becomes more prevalent in Class 4. Finally, when examining MoveSweat, linked to excessive sweating, a consistent increase is observed when passing through the classes, starting with less expressive representation in Class 1 and reaching greater representation in Class 4.
3.3. Moving Patients around the Map
In this section, the general movement trends of patients across the map were analyzed. Table 2 indicates the number of patients in each class for whom there were records of consultations after the baseline.
Table 2.
Initial positioning of patients with consultations after baseline.
Migration Trends
From Table 3, we can observe the general movement trends of individuals in each class. In all cases, we notice that most patients remained in the same group.
Table 3.
Migration of patients between the first and last consultation.
The analysis of a patient’s transition between PD symptoms while taking non-motor symptoms into account shows clear patterns over time. Class 1 patients, characterized by the initial phase, have an expected tendency to remain in the same class as that of the last visit. This stability reflects the lower severity of symptoms in this initial phase of the disease, reinforcing the expectation of slower progression. However, Class 2 patients show more dynamic development. The retention of a significant proportion in this phase indicates some stability, but the transition to advanced phases (Classes 3 and 4) is significant, suggesting the possible intensification of non-motor symptoms over time. Concerning the moderate and advanced stages (Classes 3 and 4), the frequency of patients who remain in these categories corresponds to the established picture, where the majority remain in these stages. However, the presence of regression in the early stages highlights the variability in disease progression among patients.
3.4. Validation of Results
For validation, the complete data provided by the platform were used. Figure 6 shows the organization of the Artificial Neural Network map, indicating the location of each symptom within its corresponding class.
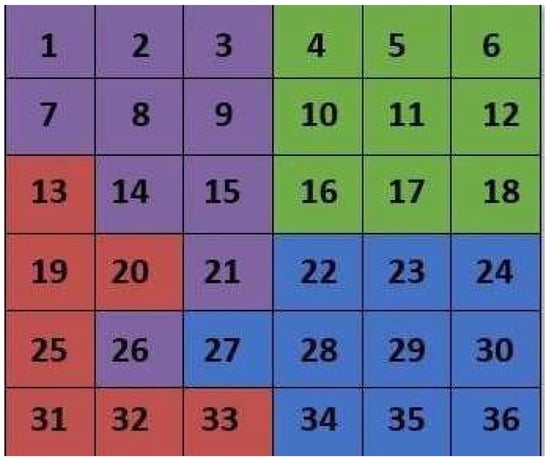
Figure 6.
Identification of the neuron by class.
In Figure 7, the evolution of a patient over the course of five consultations is observed, in which a complex trajectory of non-motor symptoms is noted. In the first consultation, at 74 years and 6 months, a patient was classified as being in the moderate stage of the disease (Class 3), activating neuron 10. This classification remained unchanged in the second consultation, carried out at 74 years and 9 months, demonstrating the initial stability of the symptoms. However, in the third consultation, carried out at 75 years and 3 months, the patient’s classification changed to Class 1. It is noted that although the class change occurred, the activated neuron was close to Class 3. On the fourth visit, the patient returned to Class 3. This return to the previous class highlights the fluctuating dynamics of non-motor symptoms. In the fifth consultation, at 75 years and 9 months, the activated neuron was number 9, classifying this patient in Class 4, in the advanced stage of the disease.

Figure 7.
Patient 1.
Figure 8 shows another patient who had four consultations. The first consultation was carried out at the age of 52 years and 7 months, in which the patient was classified as being in Class 2. In the second consultation, at the age of 54 years and 4 months, there was a transition to Class 3. In the third consultation, at the age of 55 years and 2 months, the patient returned to Class 2, even with neuronal activation close to Class 4. The last consultation, at 55 years and 4 months, indicated a significant change, placing the patient in Class 4. Therefore, this observation is of a patient who, in 2 years and 5 months, progressed from Class 2 to Class 4.
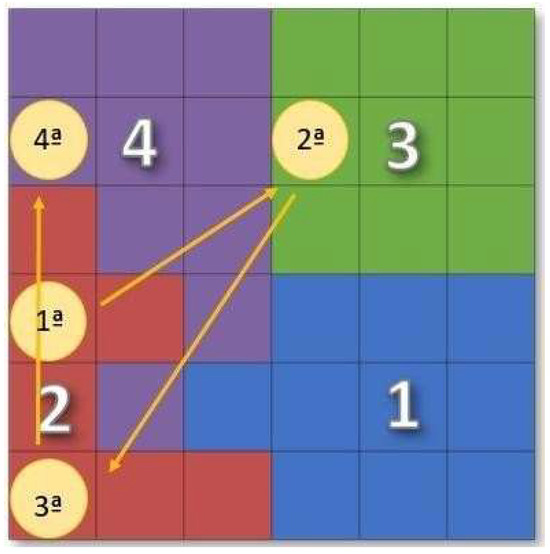
Figure 8.
Patient 2.
4. Conclusions
The study successfully developed a severity index for PD based on non-motor symptoms using an ANN. The resulting scale classified patients into four classes, representing different degrees of severity, highlighting the dynamic nature of the condition. The differentiation between classes was based on the number and frequency of symptoms, not their specificity.
The results emphasize the importance of gastrointestinal and urinary tract symptoms at different severity levels, especially the early association of urinary tract symptoms in the early stages of PD. The persistence of the symptom of difficulty sleeping in one of the groups suggested the need for special attention to be paid to this symptom in the early stages of the disease. The early detection of urinary and gastrointestinal symptoms indicated the importance of early monitoring and intervention, while the variability in symptoms in one of the groups highlighted the dynamic complexity of the condition. The practicality of the scale, which automatically converts various records into an index, was highlighted as a significant advantage.
The pictorial representation of the classes on the map allowed for a clear visualization of the patient’s condition and trajectory during the consultation, providing a useful graphical representation.
The age of the patients was also noted, with a considerable number of young patients, which may be justified by the onset of non-motor symptoms up to 10 years before motor symptoms.
These results underscore the clinical relevance and practical applicability of the developed scale. However, the need for further studies with real patients is emphasized to validate and further enhance the scale’s effectiveness in assessing the severity of PD. This approach will contribute to the validation of and improvement in the tool, strengthening its clinical utility and ability to provide valuable insights for disease management.
Author Contributions
Conceptualization, S.B.M.N., S.M.A. and B.G.M.; methodology, S.B.M.N., B.G.M. and K.J.S.d.A.; software, S.B.M.N. and B.G.M.; validation, B.G.M., K.J.S.d.A. and P.D.G.; formal analysis, B.G.M., K.J.S.d.A. and P.D.G.; investigation, S.B.M.N., S.M.A. and B.G.M.; data curation, S.B.M.N., B.G.M. and K.J.S.d.A.; writing—original draft preparation, S.B.M.N. and B.G.M.; writing—review and editing, B.G.M., K.J.S.d.A. and P.D.G.; supervision, B.G.M. and P.D.G. All authors have read and agreed to the published version of the manuscript.
Funding
This research was funded in part by the Fundação para a Ciência e Tecnologia (FCT) and C-MAST (Centre for Mechanical and Aerospace Science and Technologies) for their support in the form of funding, under the project UIDB/00151/2020 (https://doi.org/10.54499/UIDB/00151/2020; https://doi.org/10.54499/UIDP/00151/2020, accessed on 3 January 2024).
Data Availability Statement
All data underlying the results are available as part of the article and no additional source data are required.
Conflicts of Interest
The authors declare no conflicts of interest.
References
- Ou, Z.; Pan, J.; Tang, S.; Duan, D.; Yu, D.; Nong, H.; Wang, Z. Global Trends in the Incidence, Prevalence, and Years Lived with Disability of Parkinson’s Disease in 204 Countries/Territories from 1990 to 2019. Front. Public Health 2021, 9, 776847. [Google Scholar] [CrossRef]
- Simon, D.K.; Tanner, C.M.; Brundin, P. Parkinson Disease Epidemiology, Pathology, Genetics, and Pathophysiology. Clin. Geriatr. Med. 2020, 36, 1–12. [Google Scholar] [CrossRef] [PubMed]
- World Health Organization (WHO). Parkinson Disease. Available online: https://www.who.int/news-room/fact-sheets/detail/parkinson-disease (accessed on 15 October 2023).
- Ferreira, M.; Massano, J. An updated review of Parkinson’s disease genetics and clinicopathological correlations. Acta Neurol. Scand. 2016, 135, 273–284. [Google Scholar] [CrossRef] [PubMed]
- Souza, R.A.; Vieira, I.T.V.; Silva, J.P. Biomarcadores clínicos de sintomas não motores na doença de Parkinson. Rev. Neurociências 2021, 29, 1–14. [Google Scholar] [CrossRef]
- de Oliveira e Silva, V.; Karollyne de Siqueira Mendes, J.; Augusto de Barros Filho, V.; das Graças Loureiro das Chagas Campêlo, M.; Torres Pereira, E. Uso de Redes Neurais para a Predição de Diagnóstico de AVE: Uma Revisão Sistemática. Rev. Bras. Neurol. 2022, 58, 21. [Google Scholar]
- Myszczynska, M.; Ojamies, P.; Lacoste, A.; Neil, D.; Saffari, A.; Mead, R.; Hautbergue, G.; Holbrook, J.; Ferraiuolo, L. Applications of machine learning to diagnosis and treatment of neurodegenerative diseases. Nat. Rev. Neurol. 2020, 16, 440–456. [Google Scholar] [CrossRef]
- Shastry, K.A.; Janyani, N.; Greeshma, G.; Kruthina, U.; Patil, L. Advanced Deep Learning Techniques for Predicting Neurodegenerative Diseases. In Proceedings of the 2023 International Conference on Network, Multimedia and Information Technology (NMITCON), Bengaluru, India, 1–2 September 2023; pp. 1–8. [Google Scholar] [CrossRef]
- Yagis, E.; Herrera, A.; Citi, L. Generalization Performance of Deep Learning Models in Neurodegenerative Disease Classification. In Proceedings of the 2019 IEEE International Conference on Bioinformatics and Biomedicine (BIBM), San Diego, CA, USA, 18–21 November 2019; pp. 1692–1698. [Google Scholar] [CrossRef]
- Lee, G.; Nho, K.; Kang, B.; Sohn, K.; Kim, D. Predicting Alzheimer’s disease progression using multi-modal deep learning approach. Sci. Rep. 2019, 9, 1952. [Google Scholar] [CrossRef]
- Lavin, A. Neuro-symbolic Neurodegenerative Disease Modeling as Probabilistic Programmed Deep Kernels. arXiv 2020, arXiv:2009.07738. [Google Scholar]
- Watts, J.; Khojandi, A.; Shylo, O.; Ramdhani, R. Machine Learning’s Application in Deep Brain Stimulation for Parkinson’s Disease: A Review. Brain Sci. 2020, 10, 809. [Google Scholar] [CrossRef]
- Sahu, L.; Sharma, R.; Sahu, I.; Das, M.; Sahu, B.; Kumar, R. Efficient detection of Parkinson’s disease using deep learning techniques over medical data. Expert Syst. 2021, 39, e12787. [Google Scholar] [CrossRef]
- Wingate, J.; Kollia, I.; Bidaut, L.; Kollias, S. A Unified Deep Learning Approach for Prediction of Parkinson’s Disease. IET Image Process. 2019, 14, 1980–1989. [Google Scholar] [CrossRef]
- Shubhangi, D.C.; Gundagurti, P. Deep Learning Based Diagnosis of Parkinson’s Disease Using CNN. Int. J. Sci. Res. Comput. Sci. Eng. Inf. Technol. 2020, 6, 351–355. [Google Scholar] [CrossRef]
- Alagdeve, V.; Thatipudi, J.; Roy, P.; Nithya, R.N.A.; Ramesh, B. Deep Learning-based Prediction of Parkinson’s Disease Progression using Voice Recordings. In Proceedings of the 2023 7th International Conference on I-SMAC (IoT in Social, Mobile, Analytics and Cloud) (I-SMAC), Kirtipur, Nepal, 11–13 October 2023; pp. 843–847. [Google Scholar] [CrossRef]
- Araújo, S.M.; Nery, S.B.M.; Magalhães, B.G.; Almeida, K.J.; Gaspar, P.D. Disease Severity Index in Parkinson’s Disease Based on Self-Organizing Maps. Appl. Sci. 2023, 13, 10019. [Google Scholar] [CrossRef]
- Bock, M.A.; Brown, E.G.; Zhang, L.; Tanner, C.C. Association of Motor and Nonmotor Symptoms with Health-Related Quality of Life in a Large Online Cohort of People with Parkinson’s Disease. Neurology 2022, 98, e2194–e2203. [Google Scholar] [CrossRef]
- Pandove, D.; Shivan, G.; Rinkl Rani, E. Systematic Review of Clustering High-Dimensional and Large Datasets. ACM Trans. Knowl. Discov. Data 2018, 12, 1–68. [Google Scholar] [CrossRef]
- Figueiredo, E.; Macedo, M.; Siqueira, H.V.; Santana, C.J.; Gokhale, A.; Bastos-Filho, C.J.A. Swarm intelligence for clustering—A systematic review with new perspectives on data mining. Eng. Appl. Artif. Intell. 2019, 82, 313–329. [Google Scholar] [CrossRef]
- Kohonen, T. Self-Organizing Maps; Springer: Berlin/Heidelberg, Germany, 2001. [Google Scholar] [CrossRef]
- Santos, P.; Macedo, M.; Figueiredo, E.; Santana, C.J.; Soares, F.; Siqueira, H.; Maciel, A.; Gokhale, A.; Filho, C.J.A.B. Application of PSO-based clustering algorithms on educational databases. In Proceedings of the IEEE Latin American Conference on Computational Intelligence (LA-CCI), Arequipa, Peru, 8–10 November 2017. [Google Scholar] [CrossRef]
Disclaimer/Publisher’s Note: The statements, opinions and data contained in all publications are solely those of the individual author(s) and contributor(s) and not of MDPI and/or the editor(s). MDPI and/or the editor(s) disclaim responsibility for any injury to people or property resulting from any ideas, methods, instructions or products referred to in the content. |
© 2024 by the authors. Licensee MDPI, Basel, Switzerland. This article is an open access article distributed under the terms and conditions of the Creative Commons Attribution (CC BY) license (https://creativecommons.org/licenses/by/4.0/).