Abstract
This paper delves into the imperative need for coexistence and compatibility in the 470–694 MHz frequency band, as mandated by the World Radiocommunication Conference 2015 (WRC-15) and the WRC-23. It focuses on challenges in the coexistence of Digital Terrestrial Television Broadcasting (DTTB) and International Mobile Telecommunications-2020 (IMT-2020) services in downlink-only mode, particularly in adjacent-channel scenarios. Using Monte Carlo simulations, the study evaluates the probability of interference from IMT base stations with DTTB reception. The analysis thoroughly investigates the impact of the IMT transmitter’s Adjacent Channel Leakage Ratio (ACLR) and the DTTB receiver’s Adjacent-Channel Selectivity (ACS) on the probability of interference. The results demonstrate a significant degradation in the DTTB reception probability at the edge of coverage based on standard assumptions. To address these challenges, this paper provides recommendations for mitigating interference. These include defining enhanced ACLR regulations for IMT base stations, implementing antenna discriminations, providing specialized filters, and establishing national coordination procedures. The research provides valuable insights for informed decision making in spectrum management within the 470–694 MHz band, aiming to facilitate the coexistence of DTTB and IMT-2020 services, in line with international regulations and best practices.
Keywords:
IMT; DTTB; broadcasting; adjacent channels; ACLR; ACS; 470–694 MHz; WRC-23; interference; Monte Carlo simulation; SEAMCAT 1. Introduction
The need for wireless communication services is rapidly increasing due to the growing dependence on mobile technologies and the escalating demand for data-driven applications. Consequently, allocating frequency bands to various services and ensuring their interference-free coexistence has become a critical challenge for international regulatory bodies, with the International Telecommunication Union (ITU) at the forefront. Achieving this balance necessitates careful considerations to ensure optimal spectrum utilization while minimizing the risk of interference. It requires a delicate balance between ensuring efficient spectrum utilization and minimizing interference.
In acknowledgment of this challenge, the WRC-15 underscored the significance of compatibility between broadcasting and mobile services, particularly within the 470–694 MHz frequency band in ITU Region 1 [1,2]. This concern persists with the initial agenda item 1.5 of the WRC-23, reflecting a sustained commitment to exploring and resolving issues related to the sharing and compatibility of these vital services in this frequency range [3].
Within the frequency range of 470–694 MHz, DTTB services play a pivotal role as a global primary source of information and entertainment. The spectrum also accommodates other vital services, including wireless microphones and in-ear monitoring systems, particularly significant in the performing arts and broadcasting industries. The proposal of a new allocation for IMT within this band raises concerns about potential interference with current broadcasting services, potentially compromising signal quality and user experiences.
This study places a particular emphasis on assessing interference scenarios where IMT-2020 base stations impact DTTB reception in adjacent channels.
There is a scarcity of studies exploring the compatibility of mobile and broadcasting services, specifically within the 470–694 MHz frequency band.
The co-channel compatibility between IMT and DTTB systems in the 470–694 MHz frequency band was already examined in [4]. Utilizing Monte Carlo simulations via SEAMCAT (Spectrum Engineering Advanced Monte Carlo Analysis Tool), the study determined the minimum coordination distances for effective co-channel sharing, considering various interference scenarios and factors. Despite challenges in harmonizing IMT and DTTB systems, the study proposes that thorough parameter analysis and mitigation strategies can decrease required separation distances.
In a simulation-based study [5], an interference analysis considered scenarios where IMT interferes with DTTB and vice versa, focusing on various terrains in the Kingdom of Saudi Arabia. The study revealed that, in most situations, the separation distances between the two networks were within reasonable ranges. However, the IMT uplink was identified as the most critical link, requiring specific separation distances for effective mitigation, with variations based on terrain types. The study suggests reallocating frequencies and turning off IMT base station sectors as efficient interference mitigation techniques.
The various methodologies employed to address the challenges of the coexistence between mobile and broadcasting services in previous digital dividend bands were explored in [6]. This study provided a comprehensive review of the relevant literature for each approach and highlighted the distinct purposes, advantages, and limitations of simulations, link budget analysis, laboratory tests, and field measurements. The paper underscored that these methodologies complement each other, and the choice of a specific approach depends on the research objectives and available resources.
Citations [7,8,9,10] discussed the mutual interference between DTTB and IMT systems in the 700 MHz band. Monte Carlo simulations, the Minimum Coupling Loss (MCL) method, and the GE06 Agreement’s coordination trigger field strengths were employed for interference investigation. The findings indicated the minimum coupling distances needed to ensure satisfactory performance for both services.
References [11,12] evaluated the coexistence of LTE and DTTB systems in adjacent channels in the 700 MHz frequency range. These studies explored interference probability dependencies on factors like distance, transmission power, and the number of interferers for harmonious coexistence. The results of a measurement campaign validated the SEAMCAT software for simulating mutual interference in more complex scenarios.
Reference [13] employed simulations to evaluate the influence of IMT on DTTB services in collective antenna systems. Reference [14] focused on the effectiveness of inserting a 1 MHz guard band to mitigate interference. Reference [15] presented results on the harmonious coexistence of IMT and DTTB in the 700 MHz band, emphasizing the importance of maintaining necessary protection distances. Reference [16] conducted a comprehensive study assessing DTTB interference in IMT channels and highlighted the necessity for over 100 km of separation to safeguard IMT systems.
The research cited in [17] employed Monte Carlo simulation to assess the impact of various DTV classes on LTE and determined the minimum separation distances to mitigate interference. The results indicated that proper separation distances can reduce the LTE capacity loss by over 90%. The antenna height of the LTE system has minimal influence, and reducing DTV transmission power is crucial to minimizing interference. A previous paper [18] introduced an approach and model to determine suitable separation distances, considering frequency and power separation and excluding overload. A notable finding suggested that a straightforward coexistence method involves locating LTE base stations on the same TV transmitter towers. In ref. [19], planning for 5G implementation in the 700 MHz band involved addressing bandwidth requirements, allocation mechanisms (auction or spectrum sharing), and interference issues with DTTB services. The study recommended a guard band and adjusted protection ratio to ensure coexistence between 5G and DTTB services. A prior study [20] compared simulation and experimental results for proposed protection ratio values using Monte Carlo simulation and field measurements. The simulation-based protection ratio was 1 dB higher than the field test result, indicating that the simulation model can serve as a reference for regulators in estimating protection ratios without relying solely on field measurements.
Articles [21,22] explored the coexistence challenges between DTTB and LTE networks in the digital dividend bands. These studies analyzed interference protection ratios in various coexistence scenarios through laboratory tests. Their conclusions reveal that the LTE uplink causes more interference than the downlink, with worse protection ratios. Recommendations include the need for low-pass filters and minimum distances to address coexistence challenges effectively. The authors of [23] investigated the robustness of the LTE-DL system in the 800 MHz band, influenced by the DTTB system designed for fixed TV reception. Laboratory measurements evaluated multiple factors that affect LTE performance. The findings provided insights for optimizing LTE network configurations in the future. A notable contribution in [24,25,26,27] is the introduction of an innovative band-stop filter designed to enable DTTB reception in the presence of LTE interference. Laboratory tests conducted on these filters demonstrated strong alignment with simulations. Furthermore, the practical effectiveness of these filters was successfully verified through real case studies. The results of [28] indicated that interfering LTE-DL signals have a minimal impact on portable DTTB indoor reception with various configurations in adjacent bands. In [29], the study measured the shielding performance of consumer DTTB antenna cables in the laboratory, finding variations of up to 60 dB. It assessed the susceptibility to interference from LTE uplink traffic in the 700 MHz band. The results emphasize the need for guard bands to prevent adjacent-channel interference in DTT receivers. The paper in [30] explored utilizing TV white spaces for spectrum sharing between LTE-A and DTTB technologies. Laboratory emulation and field measurements demonstrated the feasibility of this spectrum sharing, considering scenarios from adjacent frequencies to full co-channel overlap. The study in [31] tested eight interference scenarios in a controlled laboratory environment to investigate the protection ratios and overload thresholds between analog/digital terrestrial TV and LTE systems in the 700 MHz band. The conclusions highlighted the superiority of digital TV over analog TV in handling LTE interference.
Article [32] introduced a comprehensive survey and methodologies for investigating the coexistence of DTTB and mobile broadband in the ultra-high-frequency (UHF) broadcasting band. It offered a detailed guide for conducting field measurements, explored European coexistence scenarios, and addressed regulatory aspects in the UHF TV broadcasting band. The article underscored the transition from static spectrum allocations to dynamic coexistence, contributing to the evolving landscape of wireless communication systems. The studies previously cited as [11,20,24,30] performed field measurements to explore the coexistence of DTTB and IMT systems in digital dividend bands, aiming to validate the results obtained through simulations and laboratory tests. The field study in [33] revealed significant interference from LTE UE affecting indoor digital and analog TV reception. Attempts to mitigate interference with UHF filters proved ineffective, as adjacent interference from LTE fell within the filter passband. Furthermore, interference from TV with LTE UE resulted in observed degradation in the uplink data rate.
The literature review reveals different approaches employed to investigate coexistence issues in previous digital dividend bands, including link budget analysis, simulations through the Monte Carlo method, laboratory measurements, and field measurements. Link budget analysis serves to estimate power budgets theoretically, providing insights into signal strength and quality. Simulations via the Monte Carlo method offer a statistical assessment of system performance, accommodating various parameters and mimicking real-world uncertainties. Laboratory measurements offer controlled experiments for precise assessments, while field measurements capture real-world data to understand system performance in diverse environments. Each approach has its advantages and limitations. However, the preference for the Monte Carlo simulation method arises from its ability to comprehensively evaluate scenarios, consider uncertainties, and provide statistically robust insights into the complex dynamics of coexistence issues between IMT and DTTB, balancing realism and control over parameters. Notably, simulations via the Monte Carlo method are formally adopted by international spectrum regulatory authorities based on international agreements.
This paper responds to the mandates of the ITU-WRCs by presenting a comprehensive technical sharing study that meticulously examines the interference dynamics between DTTB reception and IMT-2020 base stations in the 470–694 MHz frequency range, focusing on the scenarios of adjacent-channel interference.
This contribution aims to assess the probability of interference from IMT-2020 downlink transmissions with DTTB reception within the 470–694 MHz band, particularly at the edge of DTTB coverage. Utilizing the Monte Carlo simulation method through SEAMCAT software version 5.4.2, the probability of interference () was converted into a measure of the degradation of DTTB reception location probability (). Crucial parameters influencing interference effects, namely, the Adjacent-Channel Leakage Ratio (ACLR) and Adjacent-Channel Selectivity (ACS), are examined in detail. The study delves into the impact of the IMT transmitter’s ACLR on , highlighting the role of unwanted emissions (out-of-block emissions). Additionally, it explores the influence of the DTTB receiver’s ACS on due to blocking from adjacent IMT signals.
These analyses provide valuable insights into the complex relationship between DTTB and IMT-2020 services in adjacent channels. The detailed results serve as a foundation for making informed decisions in spectrum management and allocation for DTTB and IMT-2020 services, contributing to ongoing efforts to ensure the harmonious coexistence of these vital communication services.
The organization of this article is as follows: Section 2 discusses potential coexistence scenarios between IMT downlink and DTTB service based on the frequency distribution in the 470–694 MHz band. Section 3 explores the technical characteristics and parameters examined in the simulation. Section 4 details the methodology followed to evaluate the electromagnetic compatibility in the considered coexistence scenarios. Section 5 focuses on presenting the simulation results and conducting a compatibility analysis. Lastly, in Section 6, the article concludes by summarizing the key results.
2. Compatibility Scenarios
A thorough examination of future options for the 470–694 MHz band in Europe was conducted in [34]. This analysis delved into the advantages and implications associated with each option. According to this research, the recommended course of action is to implement a secondary allocation for mobile services in downlink-only mode alongside the existing traditional broadcasting services in the 470–694 MHz band. Figure 1 depicts the proposed frequency allocation for the 470–694 MHz band in accordance with this recommendation.
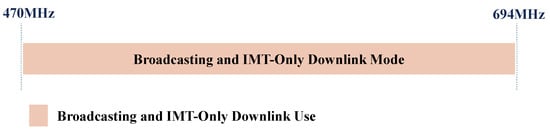
Figure 1.
Frequency allocation according to a future option in the 470–694 MHz band.
It is essential to emphasize that this option assumes sufficient capacity in the interleaved spectrum for IMT downlink-only use alongside traditional broadcast services.
In practical terms, each country safeguards access to the 470–694 MHz spectrum for DTTB as needed, allowing unused DTTB channels to be available for downlink-only services or applications. Many broadcasting and mobile manufacturers support the proposed option, citing positive economic outcomes and minimal adverse social consequences [35,36]. The proposed option allows mobile operators to enhance the downlink capacity to address the growing demand for mobile data traffic while also securing the essential spectrum for future DTTB development in Europe. Data traffic statistics indicate a greater need for downlink capacity, driven by increased video consumption and mobile app usage [37]. Moreover, permitting services to downlink only will streamline UHF spectrum utilization, effectively mitigating interference between IMT and DTTB services. The exclusion of uplink services is intentional, as their inclusion would necessitate significant interference mitigation efforts to comply with the ITU Radio Regulations and the Geneva Agreement (GE-06), particularly at the European Union’s outer borders [38].
Hence, the primary objective of this contribution is to evaluate interference scenarios arising from IMT downlink into DTTB reception in adjacent channels within the 470–694 MHz frequency range. Figure 2 depicts the basic coexistence scenario investigated in this article.
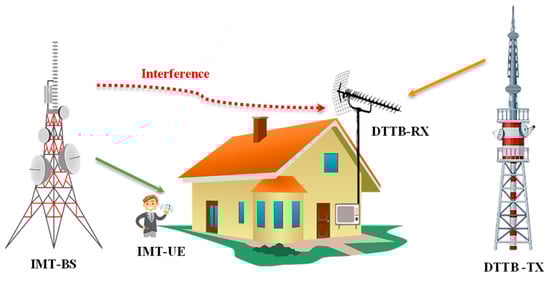
Figure 2.
Coexistence scenario where IMT downlink interferes with fixed rooftop DTTB receiver.
The basic scenario includes a High-Power High-Tower (HTHP) DTTB transmitter providing coverage for fixed rooftop reception and a macro-cellular homogeneous IMT network operating in downlink mode.
Three interference scenarios were simulated based on the frequency distribution, considering DTTB services with an 8 MHz bandwidth and IMT downlink with bandwidths of 5 MHz, 10 MHz, or 15 MHz. Figure 3, Figure 4 and Figure 5 depict the patterns of the interleaved spectra for these three scenarios. The study calculated the degradation of the reception location probability () for DTTB in each interference scenario.
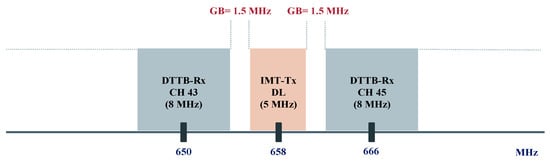
Figure 3.
Scenario 1: DTTB reception with a bandwidth of 8 MHz and IMT downlink with a bandwidth of 5 MHz.
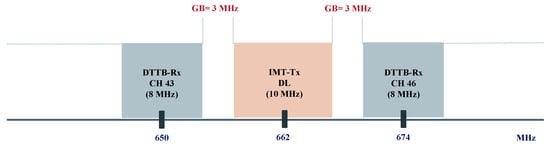
Figure 4.
Scenario 2: DTTB reception with a bandwidth of 8 MHz and IMT downlink with a bandwidth of 10 MHz.
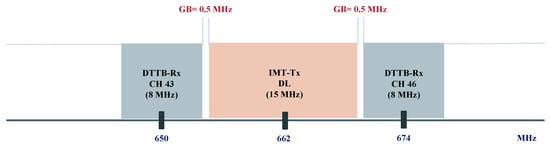
Figure 5.
Scenario 3: DTTB reception with a bandwidth of 8 MHz and IMT downlink with a bandwidth of 15 MHz.
3. Technical Characteristics
3.1. IMT Parameters
The essential technical specifications applied in the simulations for the IMT system were drawn from the insights provided by Working Party 5D to ITU Task Group TG 6/1 [39], aligning with the guidelines outlined in Recommendation ITU-R M.2101 [40]. Table 1 and Table 2 provide a summarized overview of the parameters relevant to IMT systems operating in the 470–694 MHz band.

Table 1.
Parameters of the IMT-BS employed in the simulations.
Table 2.
Parameters of the IMT-UE utilized in the simulations.
3.2. DTTB Parameters
The standards and settings for the DTTB system operating in the 470–694 MHz frequency range were established through the guidance of ITU-R BT.2383-4 and the contribution from WP 6A to ITU TG 6/1 [41,42]. Table 3 compiles the DTTB parameters within the 470–694 MHz band.
Table 3.
Characteristics of DTTB employed in the simulations.
As summarized in Table 3, the characteristics of the DTTB system operating in the 470–694 MHz frequency range include various parameters related to transmission and reception.
The DTTB system employs an 8 MHz channel bandwidth, experiences a 4 dB feeder loss in the transmission line or feeder between the transmitter and the antenna, and maintains a degradation in the signal-to-noise ratio introduced by the system of 6 dB noise figure, with a 95% probability that the signal strength remains above a specified threshold at the edge of the DTTB coverage area.
The DTTB transmitter (Tx) belongs to the HTHP (High-Tower, High-Power) category, indicating a transmitter with high power and coverage capabilities, boasting an Equivalent Isotropic Radiated Power (EIRP) of 85.15 dBm, covering a radius of 74.8 km. The DTTB Tx’s antenna stands at 300 m in height above average terrain, 200 m above ground level, with a gain of 10 dBi. The antenna radiates uniformly in all directions horizontally, while the vertical-plane pattern utilizes a 24λ aperture with a 1° beam tilt, where λ is the wavelength of the signal.
On the receiving end, the DTTB receiver (Rx) operates in a fixed outdoor reception configuration, positioned at the edge of the DTTB coverage area, covering a 100 m × 100 m pixel at the edge. The DTTB Rx’s antenna, at a height of 10 m, has a gain of 9.15 dBi and exhibits the ability to discriminate against signals with polarization orthogonal to the desired polarization at a level limited to −3 dB in cases without antenna discrimination.
3.3. Investigated Parameters
The Adjacent-Channel Leakage Ratio (ACLR) and Adjacent-Channel Selectivity (ACS) are crucial parameters to evaluate the compatibility of IMT downlink signals and DTTB reception in adjacent bands. To perform a thorough analysis, Monte Carlo simulation is adopted to model various scenarios and assess the impact of these parameters.
3.3.1. ACLR
The ACLR is a critical metric employed to quantify the unwanted emissions, often referred to as out-of-block emissions, caused by a transmitter operating in one channel to receivers in adjacent channels [43,44]. Figure 6 illustrates the interference arising from the unwanted emissions emitted by the interfering transmitter, which intrude into the bandwidth of the victim receiver.
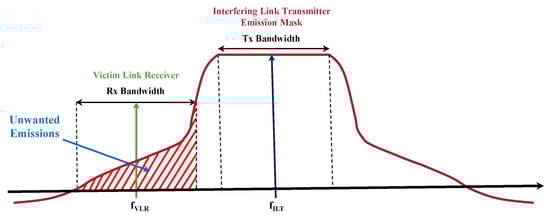
Figure 6.
Illustration of interference due to unwanted emissions.
In the context of IMT and DTTB coexistence, the ACLR measures the power emitted by an IMT downlink transmitter into adjacent frequency channels where DTTB reception occurs. It is expressed in decibels (dB) and indicates how effectively a transmitter suppresses emissions in adjacent channels. A lower ACLR value implies more unwanted emissions, while a higher ACLR value signifies better spectral containment.
3.3.2. ACS
ACS is a critical metric used to quantify the ability of a receiver to reject or tolerate strong unwanted signals or interference from adjacent or nearby channels, often referred to as receiver blocking, without experiencing a significant degradation in performance [43,44]. Figure 7 illustrates the overall emission power of the interfering transmitter mitigated by the blocking attenuation function of the victim receiver.
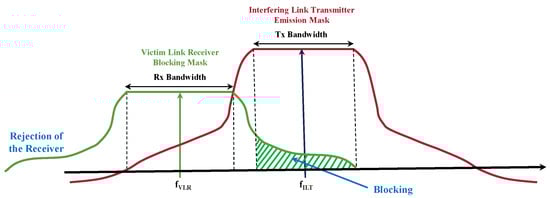
Figure 7.
Illustration of the blocking of the victim receiver.
In the context of IMT and DTTB coexistence, ACS represents the ability of a DTTB receiver to reject unwanted signals from adjacent channels, such as those emanating from the IMT downlink. ACS is also expressed in decibels (dB), and a high ACS value indicates a receiver’s effectiveness in filtering out unwanted interference from adjacent channels, ensuring that it only captures the desired signal.
3.3.3. Combination of ACLR and ACS
When designing and deploying communication systems, it is important to consider both the transmitter’s ACLR and the receiver’s ACS to minimize the potential for interference [43,44]. Figure 8 illustrates the combined unwanted emissions and the receiver-blocking mechanism.
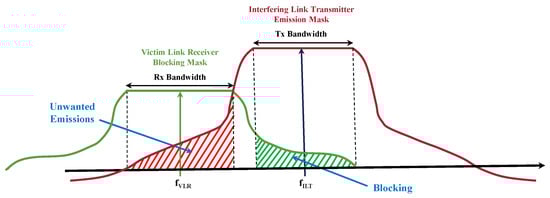
Figure 8.
Illustration of the combined effect of unwanted emissions and receiver blocking.
The combination of the ACLR and ACS is crucial for a thorough compatibility analysis between the IMT downlink and DTTB reception. In practice, if the transmitter has a good ACLR (i.e., it contains its emissions well within the allocated frequency band), and the receiver has a high ACS value (i.e., it is selective and can reject adjacent channel interference effectively), the probability of interference between different systems operating in proximity is significantly reduced.
4. Methodology
The methodology employed in this study assesses the electromagnetic compatibility between the IMT downlink and DTTB reception for various scenarios outlined in Section 2.
The evaluation employed a Monte Carlo simulation conducted through SEAMCAT software version 5.4.2, as specified in Report ITU-R SM.2028 [45]. This simulation generates a range of IMT downlink signals, which are subsequently integrated with DTTB reception in adjacent channels within the 470–694 MHz band. The assessment covers urban, suburban, and rural environments.
To begin, DTTB broadcasting planning is built based on the DTTB parameters detailed in Section 3 [41,42]. This involves deploying an HTHP (High-Tower, High-Power) DTTB transmitter to provide coverage for fixed rooftop reception. Within this coverage area, a 100 m × 100 m pixel is defined at the edge. The DTTB receivers are randomly placed, adhering to a uniform distribution, within this pixel. The main objective is to attain an accurate probability of reception within this pixel. This probability signifies the percentage of locations where the DTTB receiver functions without issues within a specific timeframe.
The IMT network planning follows the methodology outlined in Annex 1 of Recommendation ITU-R M.2101, along with the IMT parameters specified in Section 3 [39,40]. A cluster of 7 three-sectorial IMT base stations (BSs) are deployed around the DTTB receiver. The cell radius is configured at 1.5 km for urban, 3 km for suburban, and 8 km for rural scenarios. Each sector accommodates 3 users, evenly distributed within the cell’s coverage area based on the radius. The assessment of interference from the IMT network considers two different network activity factors, namely, the load factors 50%LF and 20%LF. The positioning of the DTTB receiver in relation to the central interfering BS is randomly placed, adhering to a uniform polar distribution within the radius of the interfering BS. Specific exceptions are defined based on minimum separation distances () around the victim receiver, as depicted in the model configuration in Figure 9.
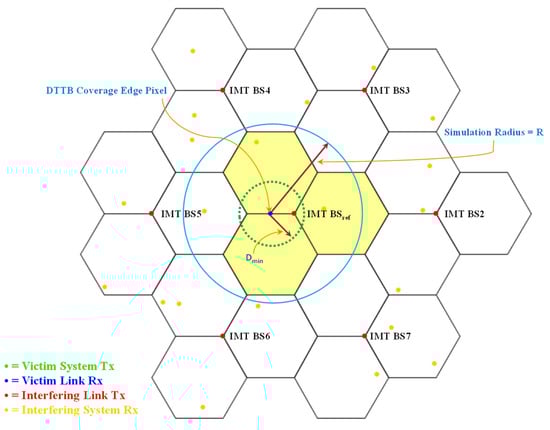
Figure 9.
Model configuration for DTTB reception interfered with by IMT downlink.
The levels of received useful and interfering signals, referred to as (Desired Received Signal Strength) and (Interfering Received Signal Strength), respectively, are calculated and stored. Approximately 20,000 positions are randomly chosen for each specified distance, and 20,000 frames are transmitted from each IMT BS ( = 20,000, representing the total number of generated events).
The probability of interference () from the IMT downlink with DTTB reception at the DTTB coverage edge is calculated and then converted to the degradation of the reception location probability of DTTB () using the methodology outlined in Annex 1 of Recommendation ITU-R BT.2136 [46]. This calculation is performed based on the following formula:
where the following definitions apply:
- ;
- : the number of interfering transmitters;
- : Desired Received Signal Strength;
- : Interfering Received Signal Strength;
- : the received interfering signal level for the maximum transmit power invariant in time;
- : the predominant level for all the interfering signals;
- the interference criterion (Carrier to (Interference + Noise));
- : the number of events where DRSS is larger than DTTB receiver sensitivity;
- : the number of events generated (in most cases, M < K);
- : the probability of non-interference of the receiver;
- : the degradation of the reception location probability of DTTB.
The degradation of the reception location probability () of DTTB is determined for the three interference scenarios described in Section 2, considering four different IMT BS-DTTB Rx values. The IMT BS-DTTB Rx is defined as the horizontal separation between an interfering IMT BS and the victim DTTB receiver (Rx), with the goal of reducing interference from the IMT network with DTTB reception.
It is important to highlight that the maximum allowable value is limited to 750 m for urban settings due to the considered IMT network topology (cell radius = 1.5 km), while the highest value of is limited to 1500 m for suburban areas (IMT BS cell radius = 1.5 km) and 4000 m for rural areas (IMT BS cell radius = 8 km).
In the context of mitigating interference between IMT networks and DTTB receivers, two receiver model configurations are considered [41,42]. In the first configuration, full DTTB antenna discrimination is implemented. This involves leveraging advanced receiver features to differentiate and prioritize DTTB signals over potential interference from IMT networks, thereby ensuring the high quality of DTTB reception. On the contrary, the second configuration lacks DTTB antenna discrimination, leading to the potential for compromised DTTB reception. This degradation occurs particularly when IMT network signals overlap or conflict with DTTB signals.
For each interference scenario, the DTTB is evaluated for the interfering signal’s total power (), in-block power (), and out-of-block power ().
5. Simulation Results and Compatibility Analysis
Extensive simulation campaigns were conducted for the three scenarios in different propagation environments. The degradation of the DTTB reception location probability () caused by IMT BS transmissions intruding into the DTTB service was calculated for four IMT BS DTTB Rx values. The DTTB receiver’s ACS, crucial for adjacent-channel compatibility studies, was calculated using the DTTB protection ratio from Rec. ITU-R BT.2033 [47]. The IMT BS ACLR value in the 8 MHz DTTB channel, for both paired and unpaired spectrum configurations, must exceed the specified value in Table 6.6.3.2-1 in 3GPP TS 38.104 v.16.6.0 [48].
The detailed results in the tables below illustrate the impact of the IMT Tx ACLR on the probability of interference () with adjacent DTTB due to unwanted out-of-block emissions (). Additionally, the DTTB Rx ACS effect on due to blocking () from the adjacent signal and the interfering signal’s total power on due to () are presented comprehensively.
5.1. Scenario 1
Table 4 and Table 5 report the probability of interference from 5 MHz IMT DL with 8 MHz DTTB reception at the DTTB coverage edge in an urban area (cell radius = 1.5 km) in the cases of IMT network load factors of 50% and 20%, respectively. The DTTB receiver model configuration is considered without antenna discrimination.
Table 4.
Probability of interference from 5 MHz IMT DL with 8 MHz DTTB reception—urban (cell radius = 1.5 km); IMT BS-DTTB guard band = 1.5 MHz; IMT activity factors = 50%.
Table 5.
Probability of interference from 5 MHz IMT DL with 8 MHz DTTB reception—urban (cell radius = 1.5 km); IMT BS-DTTB guard band = 1.5 MHz; IMT activity factor = 20%.
In this scenario, the IMT BS-DTTB guard band is 1.5 MHz, and the interfering Tx ACLR is 44 dB/8 MHz, which fulfills the condition of >45 dB/5 MHz [48]. The ACS value of the DTTB receiver is 51 dB, with overloading thresholds (Oth) set at −6 dBm for a frequency offset of 8 MHz [47].
The Monte Carlo simulation results indicate that at the edge of DTTB coverage in an urban environment, using basic assumptions, there is a significant degradation in the DTTB location reception probability due to IMT BS downlink-only interference. Importantly, interference from the IMT network persists even with increased separation distance, attributed to the cumulative effects of in-block and out-of-block emissions (OOBEs) from the interfering signals. This is influenced by the low ACS value of the DTTB receiver and the low ACLR value of the IMT BS.
Reducing the IMT activity factor from 50% to 20% does not notably improve the probability of interference from the IMT network with DTTB reception. This lack of improvement is due to the sensitivity of the DTTB reception to the maximum interfering signal power, as outlined in Rec. ITU-R BT.2136 [46].
Table 6 reports the probability of interference from a 5 MHz IMT downlink with DTTB reception at the DTTB coverage edge in an urban area, considering scenarios where the DTTB receiver benefits from full antenna discrimination.
Table 6.
Probability of interference from 5 MHz IMT DL with 8 MHz DTTB reception—urban (cell radius = 1.5 km); IMT BS-DTTB guard band = 1.5 MHz; IMT activity factor = 50%; full DTTB antenna discrimination.
The results indicate that implementing full antenna discrimination in the DTTB receiver results in an improved probability of interference from the IMT network with DTTB reception.
Table 7 and Table 8 report the probability of interference from a 5 MHz IMT downlink with 8 MHz DTTB reception in suburban (cell radius = 3 km) and rural (cell radius = 8 km) areas, respectively. The IMT network load factor considered for both scenarios is 50%.
Table 7.
Probability of interference from 5 MHz IMT DL with 8 MHz DTTB reception in a suburban area (cell radius = 3 km); IMT BS-DTTB guard band = 1.5 MHz; IMT activity factor = 50%.
Table 8.
Probability of interference from 5 MHz IMT DL with 8 MHz DTTB reception in a rural area (cell radius = 8 km); IMT BS-DTTB guard band = 1.5 MHz; IMT activity factor = 50%.
When switching to suburban and rural environments, the probability of interference remains high, resulting in a degradation in the DTTB location reception probability of at least 68.3% in suburban areas and 49% in rural areas. This is attributed to better propagation conditions, leading to a higher interfering signal from the IMT BS, which partly offsets the positive effects of a larger cell radius.
In alignment with the ECC Decision dated 30 October 2009, which establishes harmonized conditions for Mobile/Fixed Communications Networks (MFCN) in the 790–862 MHz frequency band, specifically regarding the protection of DTTB frequencies where broadcasting is protected, Table 9 outlines the impact of improving the IMT BS ACLR from 44 to 60 dB/8 MHz [49].
Table 9.
Probability of interference from 5 MHz IMT DL with 8 MHz DTTB reception—urban (cell radius = 1.5 km); IMT BS-DTTB guard band = 1.5 MHz; IMT activity factor = 50%; IMT BS ACLR = 60 dB/8 MHz.
However, practical ACLR values might be better than the minimum harmonized conditions found in ECC/DEC/(09)03 [49]. Accordingly, Table 10 reports the impact of enhancing the IMT BS ACLR from 44 to 70 dB/8 MHz. This analysis considers the configuration of the DTTB receiver model without antenna discrimination.
Table 10.
Probability of interference from 5 MHz IMT DL with 8 MHz DTTB reception—urban (cell radius = 1.5 km); IMT BS-DTTB guard band = 1.5 MHz; IMT activity factor = 50%; IMT BS ACLR = 70 dB/8 MHz.
The results presented in Table 9 and Table 10, when compared to those in Table 4, demonstrate that increasing the ACLR value of the IMT BS, aligning with established practices to protect broadcasting from IMT usage in the 790–862 MHz band in Europe, helps mitigate the impact of interference on DTTB. Practical implementations of IMT BSs may exhibit even better ACLR characteristics, further reducing the probability of interference.
Table 11 reports the impact of enhancing both the DTTB ACS from 51 to 60 dB and the IMT BS ACLR from 44 to 60 dB/8 MHz. The hypothetically improved value of DTTB ACS from 51 to 60 dB aligns with observations from LTE deployments in the 800 MHz band [50]. In contrast, the enhanced value of the IMT BS ACLR from 44 to 60 dB/8 MHz is consistent with ECC/DEC/(09)03 regarding the protection of DTTB frequencies where broadcasting is protected [49].
Table 11.
Probability of interference from 5 MHz IMT DL with 8 MHz DTTB reception—urban (cell radius = 1.5 km); IMT BS-DTTB guard band = 1.5 MHz; IMT activity factor = 50%; IMT BS ACLR = 60 dB/8 MHz; ACS = 60 dB.
Enhancing the ACLR of the interfering IMT BS primarily affects the probability of interference, with the ACS value of the DTTB receiver playing a crucial role. Improvements in this aspect will contribute to better coexistence conditions between IMT and DTTB services.
5.2. Scenario 2
Table 12 provides the probability of interference from a 10 MHz IMT downlink with 8 MHz DTTB reception in a 100 m × 100 m pixel at the DTTB coverage edge in an urban area (cell radius = 1.5 km). In this scenario, the IMT BS-DTTB guard band is 3 MHz; ACS = 60 dB [50]; the overloading threshold (Oth) is set at −8 dBm for a frequency offset of 12 MHz [47]; the ACLR = 47 dB/8 MHz, which fulfills the condition of >45 dB/10 MHz [48]. The scenario considers an IMT activity factor of 50%, and the DTTB receiver model configuration is without antenna discrimination.
Table 12.
Probability of interference from 10 MHz IMT DL with 8 MHz DTTB reception—urban (cell radius = 1.5 km); IMT BS-DTTB guard band = 3 MHz; IMT activity factor = 50%.
In this scenario, the improved ACS value of the DTTB receivers contributes to a reduced probability of interference due to receiver blocking.
Table 13 reports the impact of enhancing the IMT BS ACLR from 47 to 60 dB/8 MHz in this scenario.
Table 13.
Probability of interference from 10 MHz IMT DL with 8 MHz DTTB reception—urban (cell radius = 1.5 km); IMT BS-DTTB guard band = 3 MHz; IMT activity factor = 50%; IMT BS ACLR = 60 dB/8 MHz.
The IMT BS ACLR is still a driver of the probability of interference, and the increase in the minimum separation distance produces good effects.
Table 14 reports the probability of interference from a 10 MHz IMT downlink with DTTB reception at the DTTB coverage edge in an urban area. This scenario considers a DTTB receiver benefiting from full antenna discrimination, along with the enhancement of the IMT BS ACLR from 47 to 60 dB/8 MHz [49].
Table 14.
Probability of interference from 10 MHz IMT DL with 8 MHz DTTB reception—urban (cell radius = 1.5 km); IMT BS-DTTB guard band = 3 MHz; IMT activity factor = 50%; IMT BS ACLR = 60 dB/8 MHz; full DTTB antenna discrimination.
The results demonstrate that the combination of an enhanced IMT BS ACLR value of 60 dB/8 MHz and full antenna discrimination in the DTTB receiver significantly improves the probability of interference from the IMT network with DTTB reception.
5.3. Scenario 3
Table 15 provides the probability of interference from a 15 MHz IMT downlink with 8 MHz DTTB reception in a 100 m × 100 m pixel at the DTTB coverage edge in an urban area (cell radius = 1.5 km). In this scenario, the IMT BS-DTTB guard band is 0.5 MHz; ACS = 60 dB; the overloading threshold (Oth) is set at −8 dBm for a frequency offset of 12 MHz [47]; and ACLR = 49 dB/8 MHz, which fulfills the condition of >45 dB/15 MHz [48]. The scenario considers an IMT activity factor of 50%, and the DTTB receiver model configuration is without antenna discrimination.
Table 15.
Probability of interference from 15 MHz IMT DL into 8 MHz DTTB reception—urban (cell radius = 1.5 km); IMT BS-DTTB guard band = 0.5 MHz; IMT activity factor = 50%.
Table 16 illustrates the impact of enhancing the IMT BS ACLR from 49 to 60 dB/8 MHz [49].
Table 16.
Probability of interference from 15 MHz IMT DL with 8 MHz DTTB reception—urban (cell radius = 1.5 km); IMT BS-DTTB guard band = 0.5 MHz; IMT activity factor = 50%; IMT BS ACLR = 60 dB/8 MHz.
The observations made about Scenario 2 also apply to this scenario. Additionally, the following findings are noteworthy:
- The reduction in the guard band has a slight effect since the same DTTB receiver ACS value is retained for both Scenarios 2 and 3.
- The increase in the effective interfering bandwidth slightly raises the probability of interference due to receiver blocking. However, in the case of the basic IMT BS ACLR assumptions, blocking is not the dominant factor in interference.
- Due to the increased ACS value compared to Scenario 1, the impact remains lower in this case than in the case of Scenario 1.
6. Conclusions
This study investigated the compatibility of IMT downlink deployment with DTTB services in the 470–694 MHz band, focusing on coexistence requirements in adjacent channels. Three scenarios were analyzed, involving an IMT downlink with bandwidths of 5, 10, or 15 MHz and DTTB service using an 8 MHz bandwidth. Monte Carlo simulations assessed the probability of interference from the IMT downlink with DTTB reception, considering the IMT transmitter’s ACLR and the DTTB receiver’s ACS.
The simulation results revealed a significant degradation in the DTTB reception probability at the coverage edge, with a minimum degradation of 58.8% observed across the three analyzed scenarios under basic assumptions in urban environments. An increased separation distance offered limited improvement due to the low useful signal level received by DTTB receivers. Even reducing the IMT activity factor from 50% to 20% did not notably enhance the probability of interference. However, utilizing an enhanced IMT BS ACLR value when the DTTB receiver benefits from the full antenna discrimination reduced degradation to at least 27.8% among the three scenarios in urban environments, with a substantial part of the interference attributed to DTTB receiver blocking.
In light of these findings, if IMT downlink-only mode operation with DTTB service in the 470–694 MHz band is considered, several key steps are crucial. These include establishing national/regional regulations mandating improved ACLRs for IMT base stations. Technical measures like antenna discriminations and specialized filters for DTTB receivers are essential. Given the interleaved spectrum use, more advanced filters, such as band-reject filters, are necessary to effectively reject adjacent IMT channels. Additionally, implementing national coordination procedures is recommended to proactively prevent interference risks before IMT downlink deployment and address cases on a case-by-case basis.
Author Contributions
Conceptualization, H.T. and P.V.; methodology, H.T.; formal analysis, H.T.; writing—original draft preparation, H.T.; writing—review and editing, H.T., P.V. and S.N.; supervision, P.V. and S.N. All authors have read and agreed to the published version of the manuscript.
Funding
This research received no external funding.
Data Availability Statement
Data are available upon request.
Acknowledgments
The authors thank the editor and the reviewers for their contributions.
Conflicts of Interest
The authors declare no conflicts of interest.
References
- ITU. The Final Acts of the World Radiocommunication Conference 2015 (WRC-15); ITU: Geneva, Switzerland, 2015; Available online: http://handle.itu.int/11.1002/pub/80d4e1c0-en (accessed on 7 September 2023).
- The European Parliament and the Council of the European Union. Decision (EU) 2017/899 of the European Parliament and of the Council of 17 May 2017 on the Use of the 470–790 MHz Frequency Band in the Union; The European Parliament and the Council of the European Union: Strasbourg, France, 2017; pp. 1–7. Available online: http://data.europa.eu/eli/dec/2017/899/oj (accessed on 16 September 2023).
- ITU. Agenda items and status of studies. In Proceedings of the World Radiocommunication Conference 2023 (WRC-23), Dubai, United Arab Emirates, 20 November–15 December 2023; Available online: https://www.itu.int/wrc-23/ (accessed on 6 September 2023).
- Taha, H.; Vári, P.; Nagy, S. Co-Channel Compatibility Analysis of IMT Networks and Digital Terrestrial Television Broadcasting in the Frequency Range 470–694 MHz Based on Monte Carlo Simulation. Sensors 2023, 23, 8714. [Google Scholar] [CrossRef] [PubMed]
- Alghaihab, A.; Ragheb, A.M.; El Falou, A.; Khan, P.Z.; Alhawas, I.Y.; Almanea, M.M.; Maghrabi, A.; Aljanoobi, M.S.; Alja-noobi, M.S.; Alabdulqader, M.A.; et al. Sharing and Compatibility Studies for IMT and DTTB Systems in the Sub-700 MHz UHF Band. IEEE Access 2023, 11, 87626–87640. [Google Scholar] [CrossRef]
- Taha, H.; Vári, P.; Nagy, S. Survey on Coexistence of Terrestrial Television Systems and Mobile Fixed Communications Networks in Digital Dividend Bands. Proc. Tech. Univ. Sofia 2022, 72, 29–36. [Google Scholar] [CrossRef]
- Ancans, G.; Stankevicius, E.; Bobrovs, V.; Paulikas, S. Evaluation of LTE 700 and DVB-T electromagnetic compatibility in adjacent frequency bands. In Proceedings of the Electromagnetics Research Symposium Proceedings, Prague, Czech Republic, 6–9 July 2015; pp. 585–589. [Google Scholar]
- Ancans, G.; Stankevicius, E.; Bobrovs, V. Assessment of DVB-T compatibility with LTE in adjacent channels in 700 MHz band. Elektron. Ir Elektrotechnika 2015, 21, 69–72. [Google Scholar] [CrossRef]
- Ancans, G.; Stankevicius, E.; Bobrovs, V.; Ivanovs, G. Estimation of electromagnetic compatibility between DVB-T/DVB-T2 and 4G/5G in the 700 MHz band for co-channel case. Latv. J. Phys. Tech. Sci. 2020, 57, 30–38. [Google Scholar] [CrossRef]
- Więcek, D.; Niewiadomski, D.; Mora, M. Compatibility analysis of the 4G/5G systems with DTT in the 700 MHz frequency band. In Proceedings of the 2018 Baltic URSI Symposium (URSI), Poznań, Poland, 15–17 May 2018; pp. 261–264. [Google Scholar] [CrossRef]
- Okamoto, D.; Mello, L.; Almeida, M.; Rodriguez, C. Performance evaluation of digital TV and LTE systems operating in the 700 MHz band under the effect of mutual interference. J. Microw. Optoelectron. Electromagn. Appl. 2016, 15, 441–456. [Google Scholar] [CrossRef]
- Okamoto, D.; Mello, L.; Almeida, M. Analysis of the interference from LTE system in ISDB-TB Digital TV system at 700 MHz. In Proceedings of the SBMO/IEEE MTT-S International Microwave and Optoelectronics Conference (IMOC), Porto de Galin-has, Brazil, 3–6 November 2015; pp. 1–5. [Google Scholar] [CrossRef]
- Vita, A.; Milanesio, D.; Sacco, B.; Scotti, A. Assessment of interference to the DTT service generated by LTE signals on existing head amplifiers of collective distribution systems: A real case study. IEEE Trans. Broadcast. 2014, 60, 420–429. [Google Scholar] [CrossRef]
- Sanusi, O.; Gbenga-Ilori, A. LTE and Future DTV Compatibility Study in the UHF band in Nigeria. Int. J. Sci. Eng. Res. 2014, 5, 491–497. [Google Scholar]
- Bakare, B.; Idigo, V.; Nnebe, S. Interference Management for the Coexistence of DTTV and LTE Systems within the Proposed Digital Dividend Band in Nigeria. Eur. J. Electr. Eng. Comput. Sci. 2021, 5, 1–9. [Google Scholar] [CrossRef]
- Carciofi, C.; Garzia, A.; Lucidi, F.; Neri, A. Coexistence of DVB Television and 5G Services in Adjacent Bands. In Proceedings of the AEIT International Annual Conference (AEIT), Florence, Italy, 18–20 September 2019; pp. 1–6. [Google Scholar] [CrossRef]
- Mathe, D.; Farias, F.; Costa, J. Digital television interference on the LTE system in the 700 MHz band. In Proceedings of the XXXIII Simpósio Brasileiro de Telecomunicações (SBrT2015), Juiz de Fora, Brazil, 1–4 September 2015; p. 1. [Google Scholar] [CrossRef]
- Lysko, A.; Dludla, G. Considerations for coexistence: DVB-T2 broadcasting and LTE base stations in 700/800 MHz bands in South Africa. In Proceedings of the IEEE 4th Global Electromagnetic Compatibility Conference (GEMCCON), Stellenbosch, South Africa, 7–9 November 2018; pp. 1–6. [Google Scholar] [CrossRef]
- Laksana, G.; Linawati; Wiharta, D. Radio Frequency Band 700 MHz Utilization Plan for 5G Technology Implementation in Bali Province. In Proceedings of the 2021 IEEE Asia Pacific Conference on Wireless and Mobile (APWiMob), Bandung, Indonesia, 8–10 April 2021; pp. 167–172. [Google Scholar] [CrossRef]
- Aji, L. Field Measurement Test on Protection Ratio for DVB-T2 Interfered by TV White Space Devices. Syntax. Lit. J. Ilm. Indones. 2022, 7, 815–829. [Google Scholar] [CrossRef]
- Fuentes, M.; Pardo, C.; Garro, E.; Barquero, D.; Cardona, N. Coexistence of digital terrestrial television and next generation cellular networks in the 700 MHz band. IEEE Wirel. Commun. 2014, 21, 63–69. [Google Scholar] [CrossRef]
- Ramírez, J.; Martínez, G.; Barquero, D.; Cardona, N. Interference analysis between digital terrestrial television (DTT) and 4G LTE mobile networks in the digital dividend bands. IEEE Trans. Broadcast. 2015, 62, 24–34. [Google Scholar] [CrossRef]
- Polak, L.; Milos, J.; Kresta, D.; Kratochvil, T.; Marsalek, R. LTE and DVB-T2 networks in the first digital dividend band in Europe: A coexistence study. In Proceedings of the 28th International Conference Radioelektronika, Prague, Czech Republic, 19–20 April 2018; pp. 1–4. [Google Scholar] [CrossRef]
- Borrego, J.; Gómez-García, R.; Carvalho, N.; Sanchez-Soriano, M.; Vieira, J. Coexistence without interference: Interference mitigation on DVB-T reception caused by neutral systems operating in the digital dividend band. IEEE Microw. Mag. 2018, 19, 29–43. [Google Scholar] [CrossRef]
- Chuma, E.; Lano, Y.; Cardoso, P.; Loschi, H.; Pajuelo, D. Design of stepped impedance microstrip lowpass filter for coexist-ence of TV broadcasting and LTE mobile system close to 700 MHz. SET Int. J. Broadcast Eng. 2018, 4, 53–57. [Google Scholar] [CrossRef]
- Fernández, O.; Fernández, T.; Gómez, Á. Compact Low-Cost Filter for 5G Interference Reduction in UHF Broadcasting Band. Electron. J. 2021, 10, 974. [Google Scholar] [CrossRef]
- Ferrante, M.; Fusco, G.; Restuccia, E.; Celidonio, M.; Masullo, P.; Pulcini, L. Experimental results on the coexistence of TV broadcasting service with LTE mobile systems in the 800 MHz band. In Proceedings of the Euro Med Telco Conference (EMTC), Naples, Italy, 12–15 November 2014; pp. 1–6. [Google Scholar] [CrossRef]
- Polak, L.; Kresta, D.; Milos, J.; Kratochvil, T.; Marsalek, R. Coexistence of DVB-T2 and LTE in the 800 MHz band: Analysis of DVB-T2 System Configurations. In Proceedings of the IEEE International Symposium on Broadband Multimedia Systems and Broadcasting (BMSB), Valencia, Spain, 6–8 June 2018; pp. 1–5. [Google Scholar] [CrossRef]
- Kalliovaara, J.; Ekman, R.; Jokela, T.; Arajärvi, A.; Gylen, H.; Paavola, J. 700 MHz Band LTE Uplink Interference to DTT Re-ception System Cabling. In Proceedings of the IEEE International Symposium on Broadband Multimedia Systems and Broadcasting (BMSB), Valencia, Spain, 6–8 June 2018; pp. 1–5. [Google Scholar] [CrossRef]
- Martínez-Pinzón, G.; Cardona, N.; Garcia-Pardo, C.; Fornés-Leal, A.; Ribadeneira-Ramírez, J. Spectrum Sharing for LTE-A and DTT: Field Trials of an Indoor LTE-A Femtocell in DVB-T2 Service Area. IEEE Trans. Broadcast. 2016, 62, 552–561. [Google Scholar] [CrossRef]
- Pupo, E.; Alvarez, R.; García, A.; Hernández, R. Protection ratios and overload thresholds between 700 mhz fdd-lte and analog/digital terrestrial television. In Proceedings of the 2020 IEEE International Symposium on Broadband Multimedia Systems and Broadcasting (BMSB), Paris, France, 27–29 October 2020; pp. 1–5. [Google Scholar] [CrossRef]
- Kalliovaara, J.; Ekman, R.; Talmola, P.; Höyhtyä, M.; Jokela, T.; Poikonen, J.; Paavola, J.; Jakobsson, M. Coexistence of DTT and Mobile Broadband: A Survey and Guidelines for Field Measurements. Wirel. Commun. Mob. Comput. 2017, 2017, 1563132. [Google Scholar] [CrossRef]
- Odiaga, M.; Joussef, H.; Medina, Y.; Augusto, M. Interference between UHF analog/digital television and LTE APT 700 MHz band: A field evaluation. In Proceedings of the 8th IEEE Latin-American Conference on Communications (LATINCOM), Medellin, Colombia, 15–17 November 2016; pp. 1–5. [Google Scholar] [CrossRef]
- Taha, H.; Vári, P.; Nagy, S. Analysis of the WRC-23 Agenda Item Concerning the Future Use of the 470–694 MHz Band in Europe. Infocommun. J. 2023, 15, 2–10. [Google Scholar] [CrossRef]
- Lamy, P. Results of the work of the high-level group on the future use of the UHF band (470–790 MHZ). Rep. Eur. Comm. 2014, 1, 1–34. Available online: https://ec.europa.eu/newsroom/dae/document.cfm?doc_id=6721 (accessed on 11 October 2023).
- RSPG Secretariat. In Proceedings of the RSPG Opinion on a Long-Term Strategy on the Future Use of the UHF Band (470–790 MHz) in the European Union, Brussels, Belgium, 19 February 2015; pp. 1–34. Available online: https://circabc.europa.eu/d/a/workspace/SpacesStore/c88af26c-0f24-4431-8647-56deaa917307/RSPG15-595_final-RSPG_opinion_UHF.pdf (accessed on 11 October 2023).
- DataReportal; We Are Social; Hootsuite. Distribution of Global Monthly Cellular Data Volume for Mobile Apps as of January 2023, by Category [Graph]. In Statista. Available online: https://www.statista.com/statistics/383715/global-mobile-data-traffic-share/. (accessed on 16 December 2023).
- ITU. Final Acts of the Regional Radiocommunication Conference for Planning of the Digital Terrestrial Broadcasting Service in Parts of Regions 1 and 3, in the Frequency Bands 174–230 MHz and 470–862 MHz (RRC-06), Geneva, Switzerland, 15 May–16 June 2006. Available online: https://www.itu.int/pub/R-ACT-RRC.14-2006/en (accessed on 14 October 2023).
- ITU. ITU-R TG6.1, Contribution 28. In Reply Liaison Statement from Working Party 5D to Task Group 6/1 (Copy to Working Parties 3K, 3M, 5A, 5B, 5C, 6A, 7D)—Preparations for WRC-23 Agenda Item 1.5—Information for Sharing and Compatibility Studies; ITU: Geneva, Switzerland, 2021; Available online: https://www.itu.int/md/R19-TG6.1-C-0028/en (accessed on 22 October 2023).
- ITU. Recommendation ITU-R M.2101-0. In Modelling and Simulation of IMT Networks and Systems for Use in Sharing and Compatibility Studies; ITU: Geneva, Switzerland, 2017; Available online: https://www.itu.int/rec/R-REC-M.2101-0-201702-I/en (accessed on 22 October 2023).
- ITU. Report ITU-R BT.2383-4. In Typical Frequency Sharing Characteristics for Digital Terrestrial Television Broadcasting Systems in the Frequency Band 470–862 MHz; ITU: Geneva, Switzerland, 2022; Available online: https://www.itu.int/pub/R-REP-BT.2383-4-2022 (accessed on 23 October 2023).
- ITU. ITU-R TG6.1, Contribution 32. In Liaison Statement from Working Party 6A to Task Group 6/1 (Copy to Working Parties 3K, 3M, 5A, 5B, 5C, 5D, and 7C)—Information Regarding the Broadcasting Service in the Band 470–960 MHz in Region 1; ITU: Geneva, Switzerland, 2021; Available online: https://www.itu.int/md/R19-TG6.1-C-0032/en (accessed on 23 October 2023).
- ECC. ECC Report 252. In Seamcat Handbook, 2nd ed.; ECC: Copenhagen, Denmark, 2016; Available online: https://docdb.cept.org/download/1270 (accessed on 12 September 2023).
- ITU. Report BT.2215-7. In Measurements of Protection Ratios and Overload Thresholds for Broadcast TV Receivers; ITU: Geneva, Switzerland, 2018; Available online: https://www.itu.int/pub/R-REP-BT.2215-7-2018 (accessed on 20 October 2023).
- ITU. Report ITU-R SM.2028-2. In Monte Carlo Simulation Methodology for the Use in Sharing and Compatibility Studies between Different Radio Services or Systems; ITU: Geneva, Switzerland, 2017; Available online: https://www.itu.int/pub/R-REP-SM.2028-2-2017 (accessed on 27 October 2023).
- ITU. Recommendation BT.2136-0. In Assessing Interference into Digital Terrestrial Television Broadcasting from Other Services by Means of Monte Carlo Simulation; ITU: Geneva, Switzerland, 2020; Available online: https://www.itu.int/rec/R-REC-BT.2136-0-202012-I (accessed on 27 October 2023).
- ITU. Recommendation BT.2033-2. In Planning Criteria, Including Protection Ratios, for Second Generation of Digital Terrestrial Television Broadcasting Systems in the VHF/UHF Bands; ITU: Geneva, Switzerland, 2022; Available online: https://www.itu.int/rec/R-REC-BT.2033-2-202201-I/en (accessed on 28 October 2023).
- ETSI. Technical Specification 138 104 V16.6.0. 5G.; NR.; Base Station (BS) Radio Transmission and Reception (3GPP TS 38.104 Version 16.6.0 Release 16); ETSI TS 138 104, V16.6.0, France, 2021–01. Available online: https://www.etsi.org/deliver/etsi_ts/138100_138199/138104/16.06.00_60/ts_138104v160600p.pdf (accessed on 29 October 2023).
- ECC. ECC Decision of 30 October 2009 on Harmonised Conditions for Mobile/Fixed Communications Networks (MFCN) Operating in the Band 790–862 MHz; ECC/DEC/(09)03; ECC: Copenhagen, Denmark, 2009; Available online: https://docdb.cept.org/document/422 (accessed on 4 November 2023).
- ITU. Report BT.2301. In National Field Reports on the Introduction of IMT in the Bands with Co-Primary Allocation to the Broadcasting and the Mobile Services; ITU: Geneva, Switzerland, 2021; Available online: https://www.itu.int/pub/R-REP-BT.2301 (accessed on 4 November 2023).
Disclaimer/Publisher’s Note: The statements, opinions and data contained in all publications are solely those of the individual author(s) and contributor(s) and not of MDPI and/or the editor(s). MDPI and/or the editor(s) disclaim responsibility for any injury to people or property resulting from any ideas, methods, instructions or products referred to in the content. |
© 2024 by the authors. Licensee MDPI, Basel, Switzerland. This article is an open access article distributed under the terms and conditions of the Creative Commons Attribution (CC BY) license (https://creativecommons.org/licenses/by/4.0/).