Abstract
An accurate method for predicting wind power is crucial in effectively mitigating wind energy fluctuations and ensuring a stable power supply. Nevertheless, the inadequacy of the stability of wind energy severely hampers the consistent functioning of the power grid and the reliable provision of electricity. To enhance the accuracy of wind power forecasting, this paper proposes an ensemble model named the complete ensemble empirical mode decomposition with adaptive noise (CEEMDAN) and convolutional bidirectional long short-term memory (CNN-BiLSTM), which incorporates a data preprocessing technique, feature selection method, deep ensemble model, and adaptive control. Initially, CEEMDAN is utilized to decompose wind speed and power sequences and hence obtain decomposed subsequences for further analysis. Subsequently, the CNN is used to extract features from each subsequence, whereas each subsequence is processed by BiLSTM to obtain an ultra-short-term deterministic prediction model. Additionally, the adaptive kernel density estimation (AKDE) method is employed to estimate the probabilistic distribution of prediction error, enabling ultra-short-term probabilistic wind power prediction. Finally, based on real datasets, the reliability of the model in probabilistic prediction is verified through the evaluation metrics of multi-step prediction intervals (PIs).
1. Introduction
As the worldwide energy demand persistently increases, it has become essential to actively advocate for the advancement of renewable resources [1,2]. In densely populated countries such as China, the imperative to tackle challenges related to energy provision is evident [3]. Wind energy, recognized as an eco-friendly resource, has garnered global interest due to its merits, including ample energy storage, extensive distribution, and low carbon emissions [4,5]. Nevertheless, the variability of wind energy, as a consequence of natural meteorological factors, introduces significant uncertainty. Integrating wind power extensively into the grid further complicates the task of ensuring grid stability [6,7]. Thus, the pursuit of high-precision wind power prediction holds immense importance.
Given the issues posed by the unique characteristics of wind power and its data defects, conventional deterministic approaches frequently struggle to accurately assess the uncertainty linked to wind power [8,9]. It is imperative to advance probabilistic prediction to efficiently manage variations in power system operations and obtain more comprehensive predictive information. Probabilistic wind power forecasting methods can be categorized into parametric and nonparametric approaches [10,11,12]. The parametric approaches rely on ideal assumptions and prior knowledge, and their core idea is to establish a prediction model by assuming the distribution of the data. Commonly used methods include Gaussian distribution [13], Beta distribution [14], t-distribution [15], Alpha stable distribution [16], etc. These models are easy to implement and have high efficiency, but the disadvantage is that if the actual data distribution does not match the assumed distribution, the prediction results may feature significant deviations. Conversely, nonparametric approaches do not rely on explicit assumptions about data distribution. Instead, they infer the distribution or model directly from the data, allowing them to dynamically adjust to diverse and intricate data distributions [11]. Therefore, among the current probabilistic forecasting methods, nonparametric approaches dominate because they are better able to cope with the uncertainty of actual wind power data and provide more accurate probabilistic prediction.
Compared with deterministic prediction, wind power probabilistic prediction technology emerged relatively late and has only made rapid progress in the past few years [17]. Its prediction intervals (PIs) can be estimated through various nonparametric approaches. Quantile regression (QR) [18] is an important method that estimates predicted values for different quantiles, such as the 25th, median, and 75th, to form PIs. Bootstrap [19] is a statistical approach based on resampling, which determines the distribution of statistics by repeatedly sampling observation data, and ultimately generates PIs. In the realm of probability density, kernel density estimation (KDE) [20] plays a significant role as it calculates the probability density interval of wind power by choosing appropriate kernel functions and bandwidths to fit the probability density function (PDF) during the prediction process. When dealing with complex high-dimensional data, the Monte Carlo [21] method has certain advantages. It can be used to simulate the randomness of meteorological variables such as wind speed, and then generate PIs of wind power based on the simulation results.
Integrating two or more methods into hybrid models has become a trend in order to maximize the utilization of the information in historical data [22,23]. Although, under certain conditions, individual models can fully mine historical information, due to a variety of constraints, the adaptability and robustness of a single model are lacking, and in some cases the prediction accuracy cannot meet the requirements. Hence, to enhance model accuracy and stability, an increasing number of researchers are turning their attention to ensemble forecasting techniques. A QR model based on the kernel extreme learning machine (ELM) is introduced in reference [24], which takes advantage of the efficient training capabilities of ELM to establish variability intervals for wind power. In reference [25], an optimized KDE method is suggested, while genetic algorithms (GA) are utilized to identify the parameters of a support vector machine (SVM), thereby revealing the fluctuation trend of the wind power output. A model based on LSTM is proposed in reference [26], and a multi-objective optimization framework is employed to study the relationship between the estimation error and the average width of the PIs. In reference [27], a hybrid prediction model for photovoltaic power generation is presented, which combines a CNN-LSTM network with multiple meteorological parameters, achieving higher accuracy compared to individual CNN and LSTM models. In reference [28], a multi-bandwidth KDE method is proposed, which utilizes a BiLSTM model to generate a KDE of different bandwidths based on different confidence levels, achieving an ultra-short-term adaptive probabilistic prediction of wind power. The above references indicate that the ensemble models based on LSTM have strong universality in the probabilistic prediction of large amounts of data. However, traditional ensemble models do not take into account the characteristics and differences between different sets of historical data, and therefore cannot fully tap into the potential of historical data, inevitably leading to some problems. The contributions of this article are as follows:
(1) Traditional ensemble forecasting methods do not involve preprocessing the input features of wind farms, which leads to an explosive increase in model complexity. Conducting feature correlation analysis first is an important step that can help the model understand the relationship between different features and the output power.
(2) On actual wind farms, wind power sequences are frequently subject to a multitude of influences, such as wind speed signals, noise signals, etc. However, traditional ensemble models often use the same algorithm to directly predict power sequences, which cannot effectively process multiple signals with different features.
(3) When employing a nonparametric approach like KDE for estimating the PDF, considerable variations in the probability density curves of prediction errors may arise as a consequence of the differing input characteristics of various wind farms. It is advisable to consider the integration of an adaptive bandwidth strategy to ensure that the estimated probability density closely approximates the actual distribution.
Based on the above survey, this paper proposes a novel deep ensemble model designed for the probabilistic prediction of wind power. Firstly, the Spearman correlation coefficient is computed for all features within the historical data, enabling the selection of features with a strong correlation to wind power for subsequent deterministic and probabilistic modeling. Secondly, CEEMDAN is applied to decompose high-correlation features and power sequences, resulting in multiple subsequences that serve as inputs to the prediction model. Then, CNN and BiLSTM models are combined to predict the outputs of each subsequence and superimpose them to achieve the deterministic prediction of wind power. Finally, an adaptive strategy is employed to modify the bandwidth of the kernel density function, and an approximate PDF is estimated to obtain the PIs of wind power.
This paper’s remaining sections are structured as follows: In Section 2, an introduction to the relevant principles utilized in the deterministic prediction model is provided, encompassing rank correlation analysis, CEEMDAN, CNN, and LSTM, and the establishment process of the CNN-BiLSTM deep ensemble model is described. In Section 3, the KDE method used for an adaptive bandwidth is proposed, and the calculation process of the PIs is outlined, along with the presentation of relevant indicators for both deterministic and probabilistic prediction. In Section 4, simulation results of cases are demonstrated to validate the enhanced precision achieved by the proposed model. Finally, in Section 5, the conclusion is presented, and potential directions for future research are outlined.
2. A Model for the Deterministic Prediction of Wind Power Based on Deep Ensemble Learning
2.1. Rank Correlation Coefficient
The rank correlation coefficient is a statistical metric that reflects the correlation degree. It is based on the rank of the variable rather than the original data value, and is therefore suitable for situations where the data do not meet a specific distribution [29]. Given the intricate nature of natural climate conditions, wind power data are frequently challenging to characterize using conventional probability distributions. Consequently, the Spearman correlation coefficient is adopted to depict the connections between various features and the output power.
For random variables and with length N, the elements in X and Y are sorted in either ascending or descending order. Then, the i-th set of elements and are selected from the sorted variables [29]. The calculation formulas are shown in Equations (1) and (2).
where represents the correlation coefficient, with a value range of [−1, 1], where a higher absolute value signifies a stronger correlation, while a lower absolute value implies a weaker one; represents the difference between the i-th set of elements. For the convenience of subsequent discussion and analysis, the relationship between the correlation coefficient and correlation degree is given in Table 1.

Table 1.
The relationship between correlation coefficient and correlation degree.
2.2. Complete Ensemble Empirical Mode Decomposition with Adaptive Noise (CEEMDAN)
CEEMDAN is a data-driven signal decomposition method that plays a crucial role in processing complex time series [30]. To overcome the problem of modal aliasing in empirical mode decomposition (EMD) [31] and random residual noise in ensemble empirical mode decomposition (EEMD) [32], CEEMDAN introduced adaptive noise processing, which improves the stability and reliability of modal decomposition by adding Gaussian white noise to the original signal [30]. The CEEMDAN process is described as follows:
Step 1. For the original wind power signal , add a set of Gaussian white noise , as shown in Equation (3).
where I represents the total count of the white noise additions.
Step 2. Utilize EMD to perform a decomposition of , yielding the intrinsic mode function and residual . Repeat I times to obtain the first intrinsic mode function and the average residual , as shown in Equations (4)–(6).
Step 3. The set represents the n-th order component obtained from EMD. Add a noise signal to to obtain a new signal, and then apply EMD again to obtain the second intrinsic mode function and average residual , as shown in Equations (7) and (8).
Step 4. Reiterate the previous steps to calculate the k-th intrinsic mode function and its residual, ultimately resulting in and , as demonstrated in Equations (9) and (10).
Step 5. Finally, the original signal can be represented as
At this point, CEEMDAN has completed the decomposition of the original wind power sequence.
2.3. Convolutional Neural Network (CNN)
A CNN is a feedforward deep neural network composed of input, convolutional, pooling, fully connected, and output layers. CNN has translation invariance during the convolution process, meaning that the convolution kernel can detect the target wherever it appears in the time series, and this makes CNN more robust in processing time series. Then, as a CNN typically consists of multiple convolutional and pooling layers, it can learn abstract representations of data at different levels, and this enables the CNN to gradually extract hierarchical features from low-level primitive features to high-level abstract features, indicating that the CNN has strong feature extraction capabilities [33]. The output of one-dimensional convolution for the feature extraction of a time series can be represented as
where Y represents the extracted features; represents the sigmoid function; W represents the weight matrix; X represents the time series; and b represents the bias vector.
2.4. Bidirectional Long Short-Term Memory (BILSTM)
LSTM, as an enhanced iteration of a recurrent neural network (RNN), successfully addresses gradient vanishing and can handle long sequence data [34,35,36]. LSTM comprises forget, input, and output gates, which can limit the removal or addition of memory units. In contrast to RNNs, LSTM not only involves the propagation of the hidden layer state, but it also introduces the concept of a cell state. The LSTM network structure is shown in Figure 1.
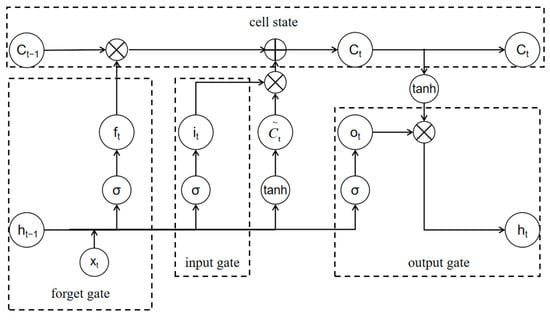
Figure 1.
LSTM network structure diagram.
Firstly, in forward propagation, LSTM selectively forgets information unrelated to the current task, and the output of the forget gate is
where represents the sigmoid function; represents the weight of the forget gate; represents the external state at time step t − 1; represents the input vector at time step t; and represents the deviation of the forget gate.
Subsequently, the candidate value and the cell state value are calculate at time step t based on , as shown in Equations (14)–(16).
where represents the cell state value at time step t − 1; represents the output of the input gate; represents the weight of the input gate; represents the deviation of the input gate; tanh represents the hyperbolic tangent function; represents the new state weight of the input gate; and represents the new state deviation of the input gate.
Ultimately, the outputs are shown in Equations (17) and (18).
where represents the weight of the output gate; represents the deviation of the output gate; represents the input of the output gate; and represents the output of the output gate.
In a BiLSTM network structure, data can be transmitted to forward and backward LSTM units, meaning that the model can take into account both the previous and the next moment of information [36]. Therefore, in most cases, BiLSTM offers enhanced sequence modeling accuracy in comparison to unidirectional LSTM. The BiLSTM network structure is shown in Figure 2.
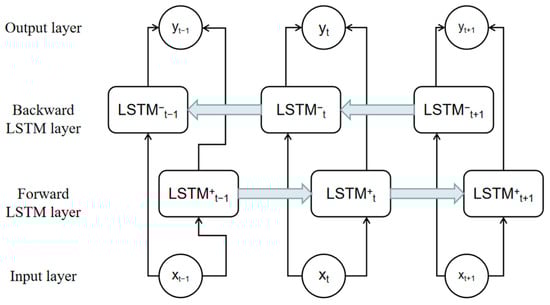
Figure 2.
BiLSTM network structure diagram.
The calculation process of BiLSTM is shown in Equation (19).
where represents the BiLSTM output; represents the output of forward LSTM; represents the output of backward LSTM; and represents the vector concatenation operation.
2.5. CNN-BiLSTM Ensemble Model
In this paper, the strong feature extraction capabilities of the CNN and the robust sequence modeling capabilities of BiLSTM are leveraged. In the CNN module, convolution and activation are performed twice before reducing the data dimension through the maximum pooling layer. The fusion of CNN and BiLSTM involves connecting the BiLSTM layer through a sequence unfolding layer and a flatten layer. Following the double-layer BiLSTM operations, the information is then passed to the fully connected layer to generate the final predicted output. The CNN-BiLSTM network structure is shown in Figure 3.
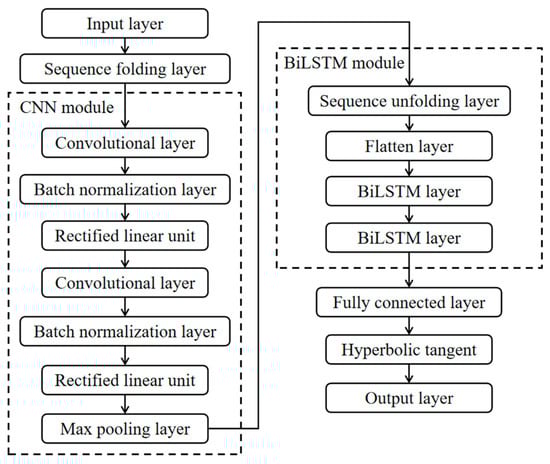
Figure 3.
CNN-BiLSTM network structure diagram.
3. Probabilistic Prediction of Wind Power Based on Nonparametric Estimation
3.1. Kernel Density Estimation
Nonparametric estimation is a statistical approach for fitting the distribution of random variables without any prior knowledge. Unlike parametric approaches, nonparametric approaches can flexibly adapt to various types of data without being constrained by specific distributions [11].
KDE is a nonparametric approach that uses a kernel function to place kernels around each data point, and estimates the PDF via the weighted summation of these kernels [37,38]. For a set of wind power prediction errors , where n is the number of samples, the PDF can be represented as
where represents the PDF obtained through KDE; represents the kernel function, commonly either Gaussian, uniform, or Epanechnikov [39]; and h represents the bandwidth of , which is used to control the PDF’s smoothness. According to the research in reference [40], once h is determined, the selection of has a minimal impact on accuracy. This paper selects the most commonly used Gaussian kernel, whose kernel function can be represented as
Substituting Equation (21) into Equation (20) obtains a PDF such that
3.2. A Method Based on an Adaptive Bandwidth
The core issue of KDE is the choice of bandwidth. If the bandwidth is too large, it will cause the fitted PDF to be too smooth and deviate from the true distribution. If the bandwidth is too small, the fitted PDF is susceptible to single-point values and may experience significant fluctuations [41]. Therefore, bandwidth optimization is necessary for KDE.
Typical bandwidth optimization techniques, like the mean square error (MSE) and integrated square error (ISE), can enhance estimation accuracy to some extent, but have limitations. MSE is sensitive to outliers and prone to overfitting, while ISE sacrifices local feature fitting. To address global and local features simultaneously, some researchers have introduced the use of a mean integrated square error (MISE) for bandwidth optimization. The calculation formula is shown in (23).
where represents the kernel function; represents the true PDF.
According to Equation (23), calculating the MISE requires understanding the true distribution. However, since the true distribution of the prediction error is usually unknown, an accurate MISE cannot be directly calculated. Therefore, the MISE criterion is usually applied to theoretically analyze the characteristics of KDE and compare the performance of different KDE methods. Instead, a method based on sample data is used, such as introducing adaptive strategies to estimate the optimal bandwidth. This paper uses Silverman’s rule to select an appropriate bandwidth to achieve an adaptive kernel density estimation (AKDE). The bandwidth calculation formula is shown in (24).
where represents the standard deviation of the prediction error; IQR represents the interquartile range of the prediction error; and n represents the number of samples.
3.3. The Prediction Process of the Proposed Method
The wind power forecasting process mainly includes feature selection, CEEMDAN decomposition, CNN-BiLSTM deterministic prediction, and KDE probabilistic prediction. The flowchart of the prediction model is shown in Figure 4.
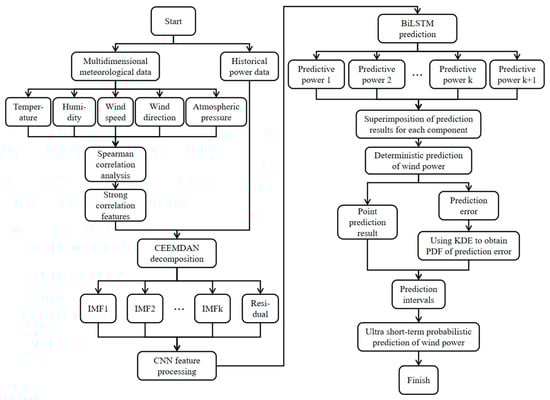
Figure 4.
The flowchart of the prediction model.
Step 1. Data preparation and analysis. Begin by inputting historical data from the wind farm, including multidimensional meteorological and power information. Then, calculate correlations between the meteorological data features and wind power, and strongly correlated features are selected as subsequent model inputs along with the historical power data.
Step 2. CEEMDAN decomposition. Apply the CEEMDAN method to decompose the input data, resulting in the extraction of multiple intrinsic mode functions (IMFs) and residuals.
Step 3. CNN-BiLSTM deterministic prediction. Input multiple IMFs and residuals into the CNN-BiLSTM prediction model, and superpose each predictive component to derive final prediction results, represented by . Assuming represents the real wind power sequence, the prediction error e can be expressed as
Step 4. Nonparametric KDE probabilistic prediction. Based on KDE with adaptive bandwidth, estimate the PDF of e. Subsequently, the PDF is integrated to derive the cumulative distribution function (CDF), represented by . For the parameter , the upper and lower limits of PIs with confidence levels of can be expressed as
where represents the lower limit of the PIs; represents the upper limit of the PIs; represents the inverse function of , ; and X takes and , respectively.
3.4. Evaluation Metrics
For deterministic prediction, the root mean square error (RMSE), mean absolute error (MAE), mean absolute percentage error (MAPE), and R-squared (R2) are used to measure the accuracy of the prediction model [42]. The calculation formulas are
where N, , , and , respectively, represent the total number of samples, predicted values, true values, and the average of the true values.
For probabilistic prediction, the PI coverage probability (PICP), mean PI width (MPIW), and interval score (IS) are used as evaluation metrics [43]. The calculation formulas are
where PICP measures how well the PIs cover true values, which can measure the reliability of PIs; the definitions of and are the same as Equations (26) and (27); represents the significance level.
where MPIW can gauge the width of the PIs. A smaller value represents a better performance.
where IS represents a comprehensive assessment of the probabilistic prediction. A smaller, closer-to-zero IS value signifies a superior predictive performance; represents the score of the i-th sampling point; represents the width of the i-th sampling point.
4. Case Studies
4.1. Dataset Description
To validate the effectiveness and superiority of the model introduced in this study, a wind farm in northwest China has been chosen as an example for this research. Constrained by a data confidentiality agreement, historical data spanning 1 January 2021 to 30 January 2021 was selected for analysis, with a resolution of 15 min. This dataset includes power, wind speed, and direction at 10 m, 30 m, 50 m, and hub height, as well as meteorological information. The original wind power sequence is presented in Figure 5. This dataset contains a total of 2880 samples, split in a 9:1 ratio for the training and test sets. Table 2 provides some information about this dataset.
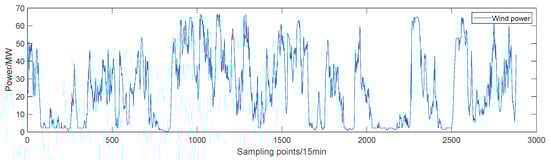
Figure 5.
Original wind power sequence.
Table 2.
Dataset information.
4.2. Feature Selection Based on Spearman
To reduce the complexity of data modeling, the Spearman correlation coefficient is utilized to evaluate the correlation between different features and wind power. For a visual representation, a heat map is employed to illustrate the associations between different variables, as depicted in Figure 6.
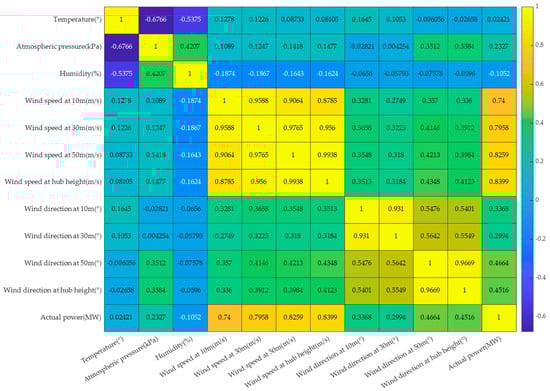
Figure 6.
Heat map of Spearman correlation coefficients.
The heat map reveals a notably strong correlation, even an extremely strong one, between actual power and wind speed at various heights. It is evident that the highest correlation is observed between the wind speed at hub height and actual power, with a value of 0.8399, as shown in Figure 6. Consequently, this study selects wind speed at hub height and wind power as feature inputs. To avoid potential issues related to varying feature dimensions and their impact on model performance, normalization is used to process these two sets of features. The normalization formula is
where and represent the original value and normalized value of a certain type of data, respectively; and represent the maximum and minimum value in the data, respectively.
4.3. Time Series Decomposition Based on CEEMDAN
Based on CEEMDAN, the wind speed at hub height and the power are decomposed into two sets of sequences. The results of each set of sequences contain 11 IMFs and a residual, as shown in Figure 7.
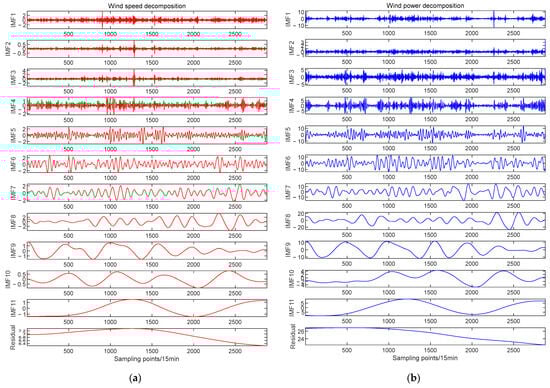
Figure 7.
(a) Wind speed decomposition results; (b) wind power decomposition results.
In Figure 7, the horizontal axis represents the sampling time, while the vertical axis displays the frequency of IMFs and the residual. In the high-frequency range (IMF1–IMF6), the IMFs show a significant fluctuation trend, indicating rapid changes in the signal, highlighting the instability of the signal. In the intermediate frequency range (IMF7–IMF9), the fluctuation frequency of the IMFs gradually decreases and periodic fluctuations begin to appear, indicating that the change in signal amplitude gradually tends to stabilize. In the low-frequency range (IMF10–IMF11), the fluctuation of the IMFs is slower, indicating a gentle change in signal amplitude, which is beneficial for subsequent ultra-short-term deterministic and probabilistic modeling analysis.
4.4. Analysis of Ultra-Short-Term Deterministic Prediction
In order to quantitatively compare the deterministic prediction results of various models, representative benchmark models such as BiLSTM and LSTM are selected for comparison with the CEEMDAN-CNN-BiLSTM ensemble model proposed in this paper. The wind speed at hub height and power data from 4 h prior are used for model inputs to predict wind power for the subsequent 1 to 4 h. The parameters for the models are detailed in Table 3.
Table 3.
Settings of model parameters.
Based on the above parameter settings, LSTM, BiLSTM, CNN-LSTM, CNN-BiLSTM, and CEEMDAN-LSTM are used as comparative models to provide prediction results 1 h, 2 h, and 4 h in advance, as shown in Figure 8.
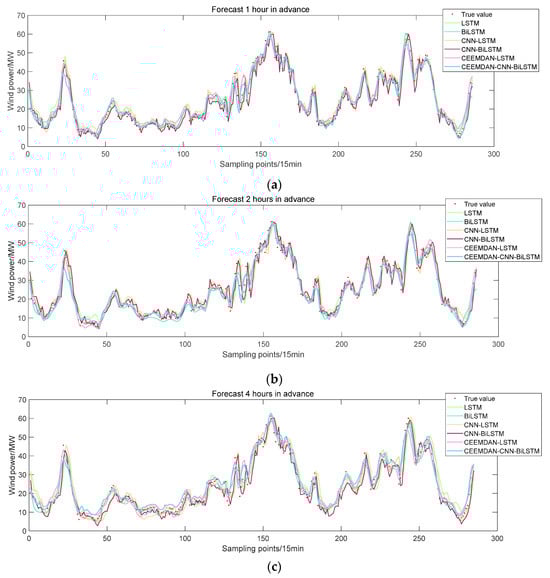
Figure 8.
Ultra-short-term deterministic prediction of wind power: (a) 1 h in advance; (b) 2 h in advance; and (c) 4 h in advance.
Furthermore, the computation of deterministic predictive performance metrics for each model is carried out, and the results are presented in Table 4. From Figure 8 and Table 4, it can be seen that the predictive performance of the CEEMDAN-CNN-BiLSTM ensemble model is the best. According to the average prediction results, compared with LSTM, the RMSE of BiLSTM, CNN-LSTM, and CEEMDAN-LSTM decrease by 0.7071 MW, 0.7051 MW, and 1.1006 MW, respectively; the MAE decreases by 0.5161 MW, 0.586 MW, and 1.2066 MW, respectively; the MAPE decreases by 2.7131%, 3.4484%, and 6.1364%, respectively; R2 increases by 0.023, 0.0224, and 0.0329, respectively. These results indicate that a single LSTM model cannot effectively extract the temporal and spatial features of time series, and its prediction accuracy needs to be improved. The BiLSTM, CNN, and CEEMDAN proposed in this paper can all improve the predictive performance of LSTM to a certain extent, obtaining a curve of predicted values that is closer to the true values. This is because BiLSTM can effectively leverage both past and future information within sequential data, making it proficient at capturing long-term dependencies; a CNN can better extract spatial features to help LSTM understand the key information in sequence data; CEEMDAN can help LSTM capture data fluctuations of different frequencies and scales, thereby better understanding data structures. Therefore, the CEEMDAN-CNN-BiLSTM deep ensemble model proposed in this study amalgamates the strengths of various methodologies, leading to enhanced prediction accuracy.
Table 4.
Deterministic prediction results of different models.
As shown in Table 4, compared with the average prediction results of the LSTM, BiLSTM, CNN-LSTM, CNN-BiLSTM, and CEEMDAN-LSTM models, the CEEMDAN-CNN-BiLSTM model shows a decrease in RMSE of 1.7606 MW, 1.0535 MW, 1.0555 MW, 0.9158 MW, and 0.6596 MW, respectively; a MAE decrease of 1.3196 MW, 0.8035 MW, 0.7336 MW, 0.6614 MW, and 0.113 MW, respectively; a MAPE decrease of 6.7629%, 4.0498%, 3.3145%, 2.8541%, and 0.6265%, respectively; and R2 increase of 0.0458, 0.0228, 0.0234, 0.0194, and 0.0129, respectively.
4.5. Analysis of Ultra-Short-Term Probabilistic Prediction
Through the comparison of deterministic prediction results, the proposed model shows good superiority. However, if the model can only provide a single numerical prediction, it usually cannot provide a sufficient reference for decision making. Hence, to enhance the dependability and practicality of prediction results, and facilitate decision-making under diverse uncertain scenarios, this section utilizes a KDE to construct a probabilistic distribution based on the deterministic prediction.
To verify the effectiveness of the AKDE proposed in this paper, a KDE with random bandwidth was selected as a comparison method with the representative Gaussian distribution estimation method in the parametric methods. The PDF fitting curves based on prediction error are shown in Figure 9a. From Figure 9a, it can be seen that the AKDE method used in this paper produces the best PDF fitting effect, and the curve also has good smoothness. The CDF curves of prediction error obtained through different methods are shown in Figure 9b.
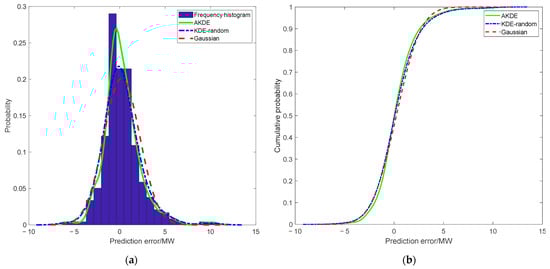
Figure 9.
(a) PDF fitting curves of prediction error; (b) CDF curves of prediction error.
As shown in Figure 10, deterministic results based on the CEEMDAN-CNN-BiLSTM model show the PIs of the AKDE method at the 85%, 90%, and 95% confidence level. PI nominal confidence (PINC) represents the given confidence level, with the associated evaluation metrics presented in Table 5.
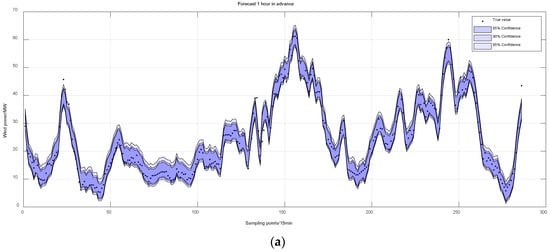
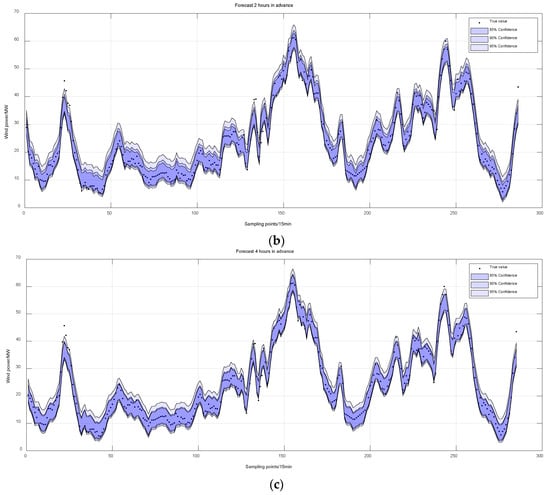
Figure 10.
Ultra-short-term probabilistic prediction of wind power: (a) 1 h in advance; (b) 2 h in advance; and (c) 4 h in advance.
Table 5.
Probabilistic prediction results of different models.
From Figure 10 and Table 5, it can be seen that the Gaussian method has a higher PICP at low PINCs, and a lower PICP at high PINCs, indicating that the distribution of prediction error does not fully conform to the Gaussian distribution. The coverage of the PIs generated by the AKDE method in this article is significantly closer to the given confidence level, proving that nonparametric approaches can provide more accurate probability estimates.
Taking the 2 h advance forecast as an example, when the PINC = 85%, despite Gaussian and KDE-random models exhibiting a higher PICP compared with the AKDE, the MPIW of the AKDE is smaller than that of the Gaussian and KDE-random models. Moreover, considering the IS metric comprehensively, the AKDE performs better in prediction results. When PINC = 90%, the PICP of Gaussian and KDE-random is higher than 92%, while the PICP of AKDE is 90.91%, which is closer to 90%, indicating that AKDE can reflect the distribution of actual data more accurately. When PINC = 95%, the IS metric of AKDE is superior to the other two methods. In addition, the difference between the PINC and PICP of AKDE does not exceed 2%, while the difference of the other two methods even exceeds 4% in some cases. The PICP significantly deviates from the expected PINC, indicating that these two methods have failed to capture the uncertainty in wind power data reasonably. The model proposed in this paper not only satisfies PINC requirements, but also significantly improves IS, outperforming KDE-random and Gaussian methods in overall performance.
To further verify the AKDE method across various point prediction models, an illustrative instance, taking a 1 h advance forecast, is considered. Table 6 presents the probabilistic prediction results of different point prediction models based on the AKDE method.
Table 6.
Probabilistic prediction results based on different point prediction models.
As indicated in Table 6, although the PICP of other comparative models can also meet the requirements of the PINC, the MPIW is much larger than the CEEMDAN-CNN-BiLSTM model. Compared with LSTM, BiLSTM, CNN-LSTM, CNN-BiLSTM, and CEEMDAN-LSTM, when PINC = 85%, the comprehensive metric IS of CEEMDAN-CNN-BiLSTM increased by 2.1657, 0.3914, 2.0409, 2.0476, and 0.3455, respectively; When PINC = 90%, the IS of CEEMDAN-CNN-BiLSTM increased by 1.6151, 0.3203, 1.5249, 1.4474, and 0.3008, respectively; When PINC = 95%, the IS phase of CEEMDAN-CNN-BiLSTM increased by 0.9258, 0.2875, 0.8253, 0.8057, and 0.2025, respectively. The results indicate that the deep ensemble model introduced in this study exhibits notable accuracy and outperforms the other five models across a wide range of scenarios. Moreover, the proposed AKDE method has strong universality and robustness and can be applied to different deterministic prediction models. In summary, the introduction of a deep ensemble strategy and adaptive strategy effectively enhances the accuracy of prediction models, thereby alleviating the randomness and volatility in wind power forecasts.
5. Conclusions
In this paper, a deep ensemble model for ultra-short-term probabilistic prediction has been proposed, which integrates the nonlinear multiscale decomposition technology of CEEMDAN, the strong spatial feature extraction technology of CNNs, strong temporal data modeling technology of BiLSTM, and nonparametric modeling technology of KDE, achieving wind power predictions at multiple time scales. The experimental results indicate that the proposed model outperforms comparative models, achieving high-precision predictions. As a result, this model contributes to enhancing the efficiency and planning of wind power generation systems.
At the same time, the probabilistic prediction model proposed in this article is still in its early stages and needs to rely on deterministic prediction results to generate PIs. Hence, the predictive performance of the model may be influenced under extreme circumstances or when numerous uncertain factors come into play. In addition, wind speed and wind power may exhibit different patterns in different seasons and over time periods, such as day and night variations, seasonal variations, etc. That is to say, wind speed and wind power usually have spatiotemporal dependence, which are not considered in this paper. As a result, there remains potential for enhancing the model’s prediction accuracy further.
Our forthcoming research focus involves adeptly characterizing the spatiotemporal dependence of wind speed and power through deep ensemble models. This aims to enhance the comprehension of patterns and trends in wind power, particularly concerning seasonality, periodicity, and instability, to meet the specific requirements of the wind power industry, thereby advancing the predictability and sustainability of wind power generation.
Author Contributions
Conceptualization, Y.Z.; methodology, Y.Z. and F.W.; data curation, Y.Z., F.W. and K.K.; formal analysis, Y.Z., F.W. and K.K.; software, Y.Z. and F.W.; validation, Y.Z. and F.W.; writing—review and editing, F.W. and R.J.M.; investigation, Y.Z. and F.W.; supervision, K.K. and R.J.M.; writing—original draft preparation, F.W. All authors have read and agreed to the published version of the manuscript.
Funding
This research was funded by the Fundamental Research Funds for the Central Universities (No. B220201034).
Data Availability Statement
The data that support the findings of this study are available on request from the corresponding author. The data are not publicly available due to privacy or ethical restrictions.
Conflicts of Interest
The authors declare no conflicts of interest.
References
- Zhou, Y.; Sun, Y.H.; Wang, S.; Bai, L.Q.; Hou, D.C.; Mahfoud, R.J.; Wang, P. Very short-term probabilistic prediction method for wind speed based on ALASSO-Nonlinear quantile regression and integrated criterion. CSEE J. Power Energy Syst. 2023, 9, 2121–2129. [Google Scholar]
- Zhou, Y.; Sun, Y.H.; Wang, S.; Mahfoud, R.J.; Alhelou, H.H.; Hatziargyriou, N.; Siano, P. Performance improvement of very short-term prediction intervals for regional wind power based on composite conditional nonlinear quantile regression. J. Mod. Power Syst. Clean Energy 2022, 10, 60–70. [Google Scholar] [CrossRef]
- Sun, Y.H.; Zhou, Y.; Wang, S.; Mahfoud, R.M.; Alhelou, H.H.; Sideratos, G.; Hatziargyriou, N.; Siano, P. Nonparametric probabilistic prediction of regional PV outputs based on granule-based clustering and direct optimization programming. J. Mod. Power Syst. Clean Energy 2023, 11, 1450–1461. [Google Scholar] [CrossRef]
- Yang, M.; Guo, Y.F.; Huang, Y.T. Wind power ultra-short-term prediction method based on NWP wind speed correction and double clustering division of transitional weather process. Energy 2023, 282, 128947. [Google Scholar] [CrossRef]
- Niu, D.X.; Sun, L.J.; Yu, M.; Wang, K.K. Point and interval forecasting of ultra-short-term wind power based on a data-driven method and hybrid deep learning model. Energy 2022, 254, 124384. [Google Scholar]
- Wan, C.; Song, Y.H. Theories, methodologies and applications of probabilistic forecasting for power systems with renewable energy sources. Autom. Electr. Power Syst. 2021, 45, 2–16. [Google Scholar]
- Yu, G.Z.; Lu, L.; Tang, B.; Wang, S.Y.; Chung, C.Y. Ultra-short-term wind power subsection forecasting method based on extreme weather. IEEE Trans. Power Syst. 2023, 38, 5045–5056. [Google Scholar] [CrossRef]
- Fan, H.J.; Zhen, Z.; Liu, N.; Sun, Y.Q.; Chang, X.Q.; Li, Y.; Wang, F.; Mi, Z.Q. Fluctuation pattern recognition based ultra-short-term wind power probabilistic forecasting method. Energy 2023, 266, 126420. [Google Scholar] [CrossRef]
- Wang, Z.; Wang, L.; Revanesh, M.; Huang, C.; Luo, X. Short-term wind speed and power forecasting for smart city power grid with a hybrid machine learning framework. IEEE Internet Things J. 2023, 10, 18754–18765. [Google Scholar] [CrossRef]
- Yang, M.; Zhu, L. Error analysis of photovoltaic power short-term prediction based on non-parametric estimation. Power Syst. Clean Energy 2020, 36, 107–114. [Google Scholar]
- He, Y.Y.; Wang, Y.; Wang, S.; Yao, X. A cooperative ensemble method for multistep wind speed probabilistic forecasting. Chaos Solitons Fractals 2022, 162, 112416. [Google Scholar] [CrossRef]
- Liao, W.; Wang, S.; Bak-Jensen, B.; Pillai, J.R.; Yang, Z.; Liu, K. Ultra-short-term interval prediction of wind power based on graph neural network and improved bootstrap technique. J. Mod. Power Syst. Clean Energy 2023, 11, 1100–1114. [Google Scholar] [CrossRef]
- Wang, S.; Sun, Y.H.; Zhou, Y.; Wang, J.X.; Hou, D.C.; Zhang, L.C. Ultra-short term conditional probability prediction of wind power considering error time dependence. Electr. Power Autom. Equip. 2022, 42, 40–46. [Google Scholar]
- Chen, H.; Xie, L.R.; Xin, B.W.; Bao, H.Y.; Li, J.; Abulizi, M.R. Research on minimum interval of energy storage capacity configuration of tower elevator based on beta distribution. Acta Energ. Sol. Sin. 2021, 42, 454–459. [Google Scholar]
- Zhao, K.N.; Pu, T.J.; Wang, X.Y.; Li, Y. Probabilistic forecasting for photovoltaic power based on improved Bayesian neural network. Power Syst. Technol. 2019, 43, 4377–4386. [Google Scholar]
- Mo, X.J.; Wen, H.T.; Yang, Y.M.; Zhou, H.T.; Chen, S.; Wei, S.Y. A parameter estimation method ofαstable distribution and its application in the statistical modeling of ice-generated noise. Acta Acust. 2023, 48, 319–326. [Google Scholar]
- Sun, R.F.; Zhang, T.; He, Q.; Xu, H.X. Review on key technologies and applications in wind power forecasting. High Volt. Eng. 2021, 47, 1129–1143. [Google Scholar]
- Wang, X.D.; Ju, B.G.; Liu, Y.M.; Zang, T.L. Probability prediction of wind power based on QR-NFGLSTM and kernel density estimation. Acta Energ. Sol. Sin. 2022, 43, 479–485. [Google Scholar]
- Wan, C.; Xu, Z.; Pinson, P.; Dong, Z.Y.; Wong, K.P. Probabilistic forecasting of wind power generation using extreme learning machine. IEEE Trans. Power Syst. 2014, 29, 1033–1044. [Google Scholar] [CrossRef]
- Luo, Y.H.; Wang, X.; Yan, S.J. Risk assessment of photovoltaic distribution network based on adaptive kernel density estimation and cumulant method. Energy Rep. 2022, 8, 1152–1159. [Google Scholar] [CrossRef]
- Yang, M.; Dong, H. Short-term wind power interval prediction based on wind speed of numerical weather prediction and Monte Carlo method. Autom. Electr. Power Syst. 2021, 45, 79–85. [Google Scholar]
- Gao, B.X.; Huang, X.Q.; Shi, J.S.; Tai, Y.H.; Zhang, J. Hourly forecasting of solar irradiance based on CEEMDAN and multi-strategy CNN-LSTM neural networks. Renew. Energy 2020, 162, 1665–1683. [Google Scholar] [CrossRef]
- Hu, C.J.; Zhao, Y.; Jiang, H.; Jiang, M.K.; You, F.C.; Liu, Q. Prediction of ultra-short-term wind power based on CEEMDAN-LSTM-TCN. Energy Rep. 2022, 8, 483–492. [Google Scholar] [CrossRef]
- Yang, X.Y.; Xing, G.T.; Ma, X.; Fu, G. A model of quantile regression with kernel extreme learning machine and wind power interval prediction. Acta Energ. Sol. Sin. 2020, 41, 300–306. [Google Scholar]
- Xiao, B.; Xing, S.H.; Wang, M.C.; Yang. S.L.; Gou, X.K. Prediction method of output power long-term fluctuation characteristic for multiple wind farms after aggregation based on improved KDE method and GA-SVM. Electr. Power Autom. Equip. 2022, 42, 77–84. [Google Scholar]
- Zhou, M.; Wang, B.; Guo, S.D.; Watada, J. Multi-objective prediction intervals for wind power forecast based on deep neural networks. Inf. Sci. 2021, 550, 207–220. [Google Scholar] [CrossRef]
- Wang, K.J.; Qi, X.X.; Liu, H.D. A comparison of day-ahead photovoltaic power forecasting models based on deep learning neural network. Appl. Energy 2019, 251, 113315. [Google Scholar] [CrossRef]
- Wang, S.; Sun, Y.H.; Hou, D.C.; Zhou, Y.; Zhang, W.J. Very short-term adaptive probabilistic forecasting of wind power based on multi-band width kernel density estimation. High Volt. Eng. 2023, 1–10. [Google Scholar] [CrossRef]
- Yang, P.; Lu, L.; Wang, J.B.; Chen, H.C. Analysis of water quality trend in the main stream of the yangtze river based on principal component analysis. Environ. Eng. 2019, 37, 76–80. [Google Scholar]
- Feng, H.F.; Yu, C.S. A novel hybrid model for short-term prediction of PV power based on KS-CEEMDAN-SE-LSTM. Renew. Energy Focus 2023, 47, 100497. [Google Scholar] [CrossRef]
- Hao, H.; Wang, H.L.; Wei, Q. Theory of empirical mode decomposition and its application. Chin. High Technol. Lett. 2016, 26, 67–80. [Google Scholar]
- Zheng, J.D.; Cheng, J.S.; Yang, Y. Modified EEMD algorithm and its applications. J. Vib. Shock. 2013, 32, 21–26+46. [Google Scholar]
- Deng, J.L.; Dong, L.H.; Song, W.; Zhao, X.B.; Liu, T.M.; Pang, Y.T. Processing of seabed polymetallic nodule images based on Sea-thru and Mask R-CNN. Min. Metall. Eng. 2022, 42, 9–13. [Google Scholar]
- Hochreiter, S.; Schmidhuber, J. Long short-term memory. Neural Comput. 1997, 9, 1735–1780. [Google Scholar] [CrossRef]
- Sun, Y.H.; Wang, P.; Zhai, S.W.; Hou, D.C.; Wang, S.; Zhou, Y. Ultra short-term probability prediction of wind power based on LSTM network and condition normal distribution. Wind. Energy 2020, 23, 63–76. [Google Scholar] [CrossRef]
- Zhang, D.D.; Chen, B.; Zhu, H.Y.; Goh, H.H.; Dong, Y.X.; Wu, T. Short-term wind power prediction based on two-layer decomposition and BiTCN-BiLSTM-attention model. Energy 2023, 285, 128762. [Google Scholar] [CrossRef]
- Du, B.G.; Huang, S.; Guo, J.; Tang, H.T.; Wang, L.; Zhou, S.W. Interval forecasting for urban water demand using PSO optimized KDE distribution and LSTM neural networks. Appl. Soft Comput. 2022, 122, 108875. [Google Scholar]
- Yang, X.Y.; Liu, Y.X.; Xing, G.T. Analysis of wind farm participation in the frequency regulation market considering wind power uncertainty. Int. J. Electr. Power Energy Syst. 2021, 130, 106946. [Google Scholar] [CrossRef]
- Xiong, M. Probability interval prediction of short-term wind power based on BP neural network and non-parametric kernel density estimation. J. Beijing Inf. Sci. Technol. Univ. 2020, 35, 51–56. [Google Scholar]
- Dong, W.C.; Sun, H.X.; Tan, J.X.; Li, Z.; Zhang, J.X.; Yang, H.F. Regional wind power probabilistic forecasting based on an improved kernel density estimation, regular vine copulas, and ensemble learning. Energy 2022, 238, 122045. [Google Scholar] [CrossRef]
- Lang, W.M.; Ma, X.J.; Zhou, B.W.; Yang, D.S.; Luo, Y.H.; Liu, L.Q. Wind power probabilistic intervals prediction based on LSTM and nonparametric kernel density estimation. Smart Power 2020, 48, 31–37+103. [Google Scholar]
- Wang, Y.; Xu, H.H.; Zou, R.M.; Zhang, L.J.; Zhang, F. A deep asymmetric laplace neural network for deterministic and probabilistic wind power forecasting. Renew. Energy 2022, 196, 497–517. [Google Scholar] [CrossRef]
- Wang, S.; Sun, Y.H.; Zhang, S.M.; Zhou, Y.; Hou, D.C.; Wang, J.X. Very short-term probabilistic prediction of PV based on multi-period error distribution. Electr. Power Syst. Res. 2023, 214, 108817. [Google Scholar] [CrossRef]
Disclaimer/Publisher’s Note: The statements, opinions and data contained in all publications are solely those of the individual author(s) and contributor(s) and not of MDPI and/or the editor(s). MDPI and/or the editor(s) disclaim responsibility for any injury to people or property resulting from any ideas, methods, instructions or products referred to in the content. |
© 2024 by the authors. Licensee MDPI, Basel, Switzerland. This article is an open access article distributed under the terms and conditions of the Creative Commons Attribution (CC BY) license (https://creativecommons.org/licenses/by/4.0/).