1. Introduction
Crowd counting is a classical computer vision task employed to generate an estimated count in an image or a dynamic video sequence. In scenes such as tourist attractions and public gatherings, overcrowding can cause crowd crushing, blockages, and even stampedes. Thus, accurately determining the number of people in a crowd in an image or video has become an increasingly important application [
1].
Because of heavy occlusions and multiscale variations in heads in crowds, crowd counting is a challenging task. In recent years, there have been many algorithms [
2,
3] for crowd counting, the density-estimation methods being the mainstream ones. For example, the MCNN [
2] adopted three columns with different receptive fields to capture the scale variations of heads in crowds. CSRNet [
3] adopted dilated convolutional layers with different dilated rates, which can capture useful information about the context to better distinguish between the foreground and the background. However, these methods require fine-grained point-level annotations, which require much human effort.
In order to reduce the dependence on fine-grained point-level annotations, some works have made full use of weakly supervised learning paradigms to calculate the number of people in an image. For example, Liang et al. [
4] proposed Transcrowd, which explored the potential of the vision Transformer [
5] for weakly supervised crowd counting. Savner et al. [
6] adopted the pyramid vision Transformer [
7] with count-level annotations to capture the multiscale information. However, Transformer requires a great amount of computational resources, making it challenging for real applications.
Since 2020, some scholars have explored more diverse models beyond convolutional neural networks and Transformer models. Recently, the re-emergence of multilayer perceptrons (MLPs) has achieved excellent classification performance, benefiting from the inherent advantages of the underlying fully connected layers: much more global receptive fields than the CNN model and simpler Self-Attention layers than in the Transformer model. Meanwhile, the potential of the MLP model in regression tasks has not been fully explored. Wang et al. [
8] proposed a weakly supervised crowd-counting network, CrowdMLP, by constructing a multi-particle MLP regulator to capture global information.
However, the CrowdMLP network has the following limitations: (1) CrowdMLP ignores the dependencies between regions. It uses multiple columns to predict different densities of regions independently. Effectively, different densities of areas are correlated in the scenes. In congested scenarios, there are certain configuration rules for an approximately constant density of crowds per square meter in the physical world. This configuration rule is a constant approximate change in density along the direction away from the camera. The density distribution in many scenes (e.g., streets, squares, stadiums, etc.) is governed by the configuration rules. These rules can be used to further improve the capabilities of crowd counting. (2) CrowdMLP [
8] introduces the ranking mechanism and designs auxiliary branches to improve the accuracy of predicting counts, but these auxiliary branches are cut in the original images and put into the basic network, which is equivalent to computing the model three times in parallel for each training, which inadvertently increases the computational load of the network.
To overcome the above two issues, we designed a scale-reasoning module based on the graph convolutional network and a scale-ranking module based on the ranking mechanism, respectively. The role of the scale-reasoning module is to capture the dependencies between the regions in the image, and the role of the scale-ranking module is to solve the overfitting of complex networks due to limited datasets. For the scale-reasoning module, we considered graph neural networks [
9], which have been demonstrated to be a suitable way for relational modeling and inference, which contain nodes and edges, where the nodes stand for the pixels in the image and the edges represent the tightness of the relationship between the nodes.
For the scale-ranking module, instead of using the ranking mechanism directly to process the original images, we directly applied the ranking mechanism to the final extracted feature maps. We used the scale-ranking module as an auxiliary branch to improve the accuracy of the estimated counts in the images. Based on the proposed scale reasoning and ranking modules, we propose a novel weakly supervised MLP-based crowd-counting network, termed SR2, which contains the scale-reasoning module, scale-ranking module, and regression branch. Finally, we performed extensive experiments on the popular crowd-counting datasets. Compared with other outstanding approaches, our proposed SR2 achieved promising counting results on ShanghaiTech [
2], UCF-QNRF [
10], JHU-CROWD++ [
11], and NWPU-Crowd [
12]. For more details, please visit our code which has been released at
https://github.com/MingfangDeng/GRMlpCrowd-main (accessed on 18 December 2022).
Broadly speaking, our efforts can be summarized as the following three aspects:
We designed a scale-reasoning module fusing the information of the region-to-region dependencies that can capture the multiscale information by the pyramid nodes.
We propose a scale-ranking module fusing the tightness of the whole image with the selected region and reducing the computational load.
SR2 provides higher accuracy compared to either the fully supervised counting method or the weakly supervised counting method.
3. Method
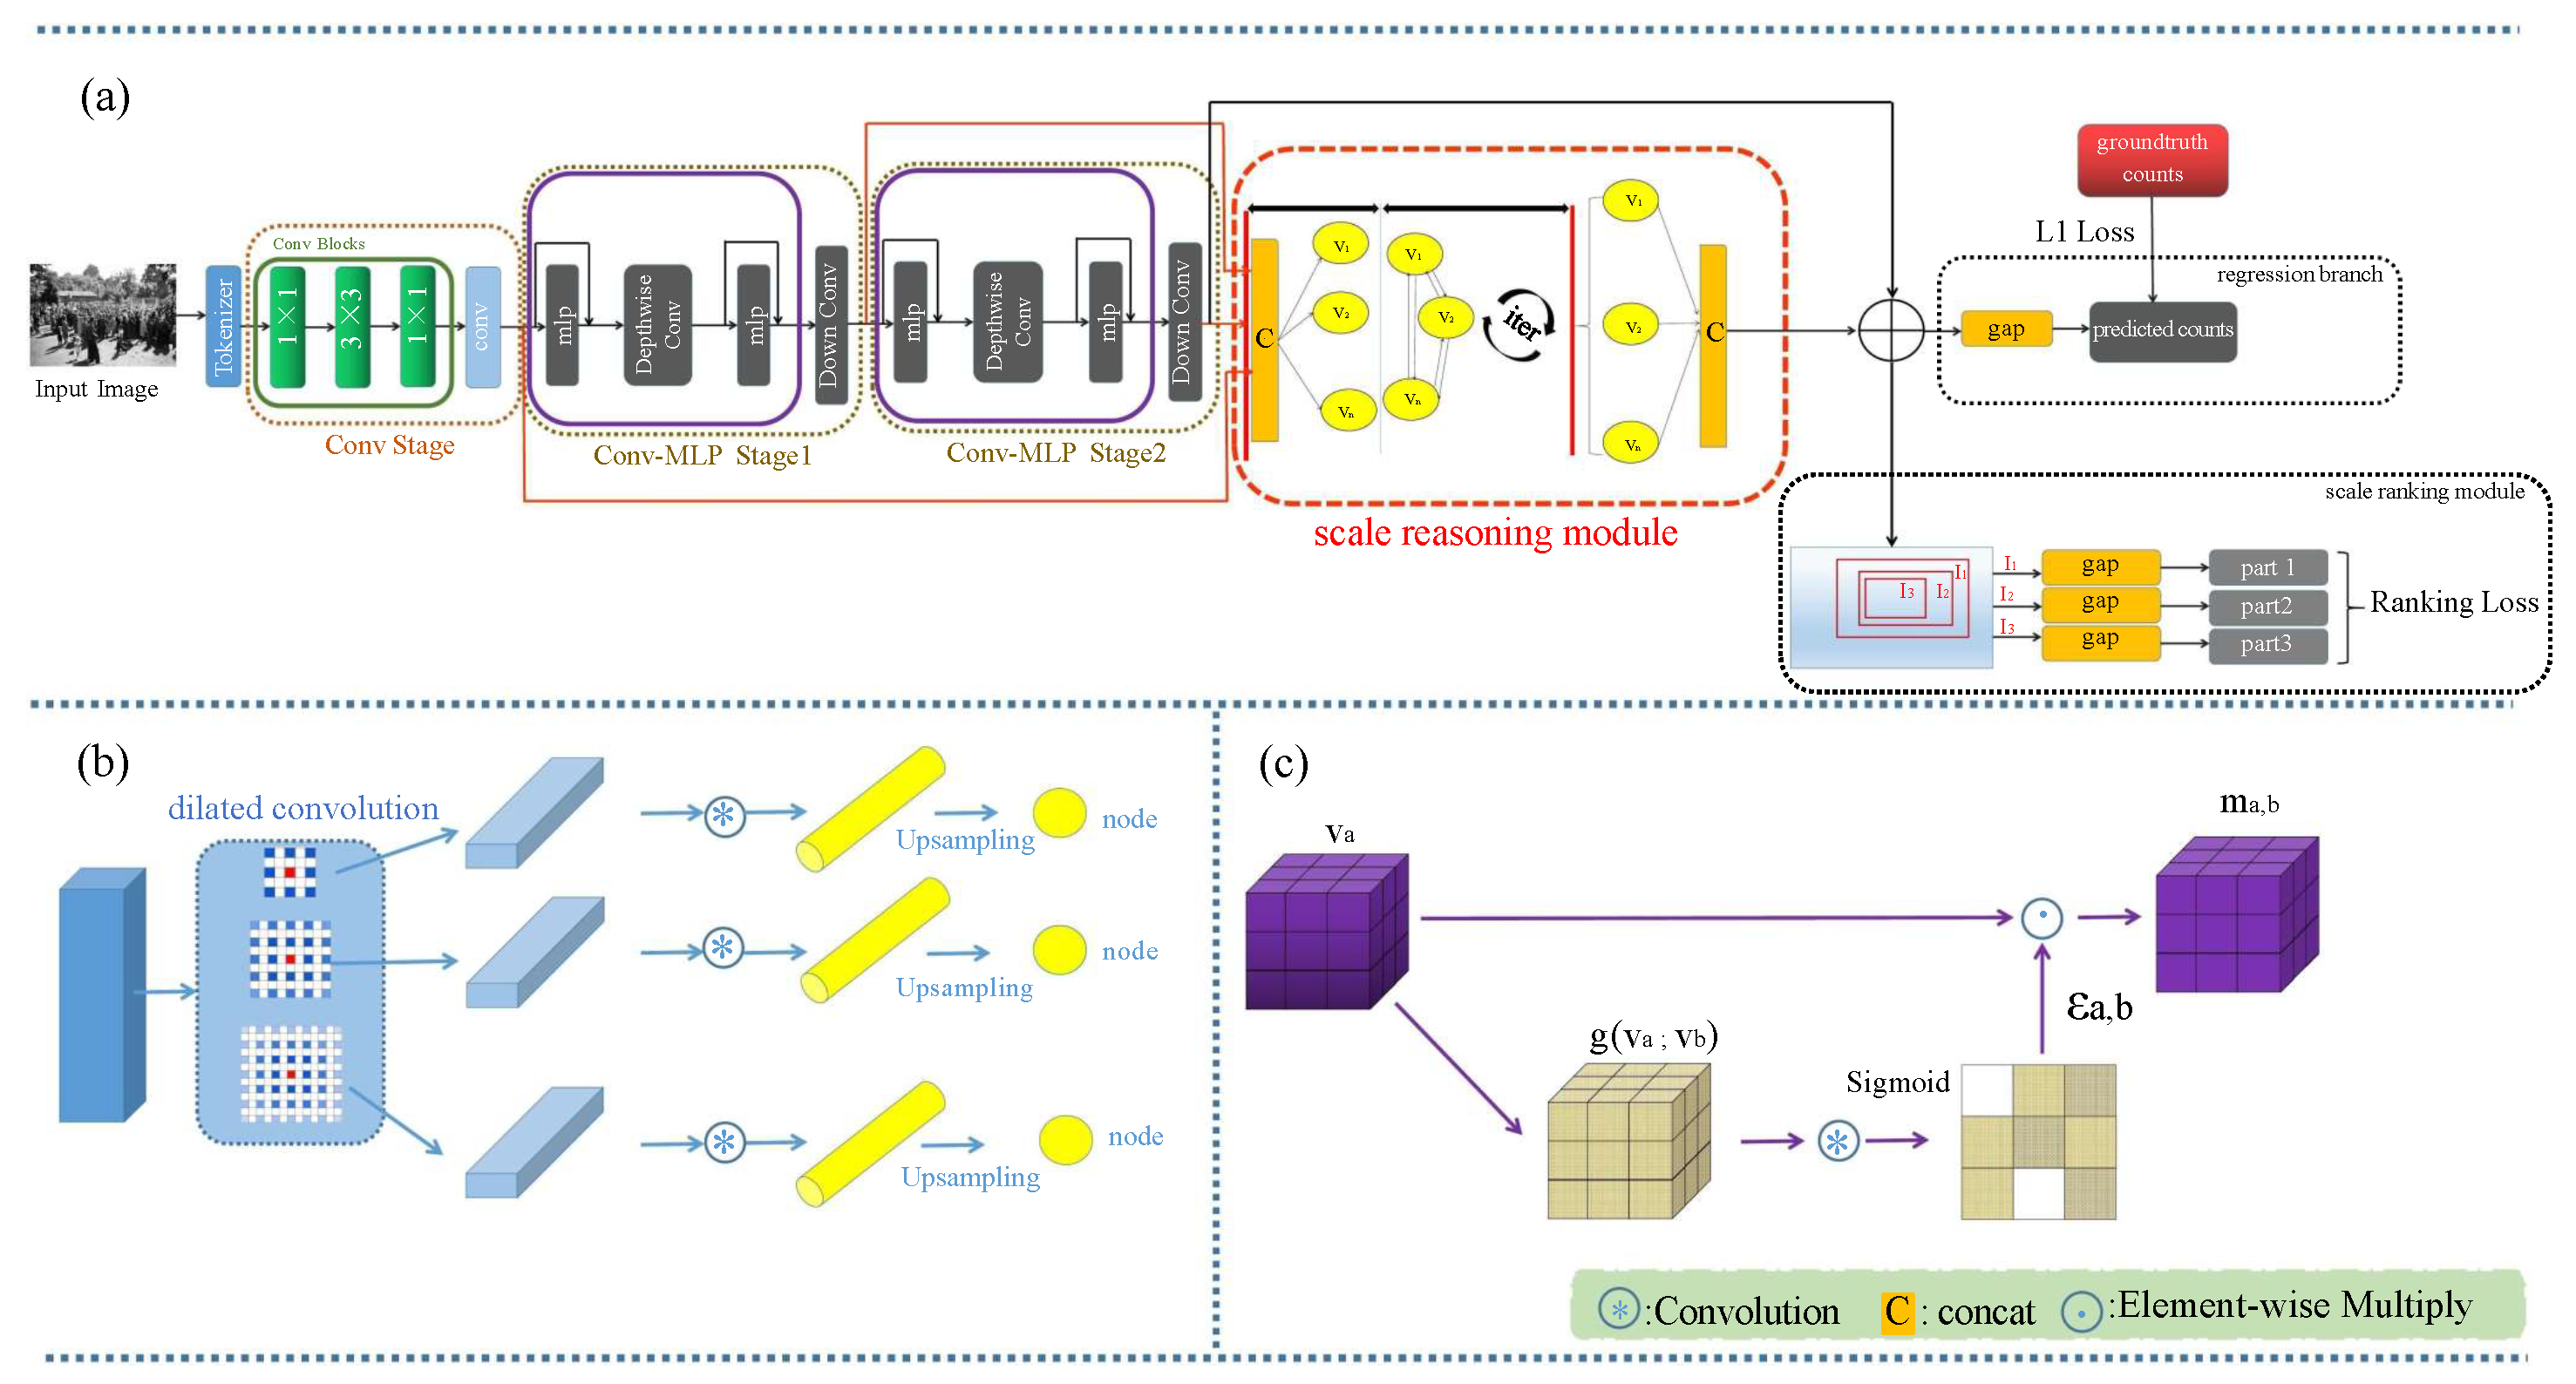
SR2 consists of the MLP encoder, scale-reasoning module, scale-ranking module, and the regression branch, as illustrated in
Figure 1. Specifically, given an imported image, it is firstly fed into the MLP encoder, which has a tokenizer, which can extract the initial features, the convolution stage, which improves the connectivity of the space, and two MLP stages for extracting global features
. Then, the features
are fed into the scale-reasoning module. The scale-reasoning module adopts the different dilated rates to capture the multiscale information. Furthermore, the scale-reasoning module has a graph neural network that contains nodes and edges, where the nodes stand for the pixels in the image and the edges represent the tightness of the relationship between the nodes. Thus, the scale-reasoning module can fuse the region-to-region dependency in the images. Then, the fused feature maps are sent to the regression branch and scale-ranking module, respectively.
The regression branch can obtain the estimated counts by GAP. The scale-ranking module adopts the ranking mechanism, selecting a random resolution rectangular region (
) from the input features
, and obtains sub-rectangular regions (
,
) at a certain downsampling rate, followed by the GAP to obtain the part estimated counts, as illustrated in
Figure 1. Finally, the scale-ranking module uses the ranking loss to improve the accuracy of the estimated counts in the regression branch.
3.1. Problem Formulation
We define the crowd-counting method of weak supervision according to [
4,
33]. The input image
I is putinto the counting networks, and the acquired feature map is returned to the estimated counts
using the GAP method. More specifically, the estimated counts
are modeled as follows:
where
represents the estimated counts of the
i-th input image
.
stands for the crowd-counting network.
represents the GAP.
is the feature map following the counting network.
The counting method learns the drift among the estimated counts and the ground truth counts of the
i-th image. We opted for the
loss to improve the precision of the crowd-counting network. The
is defined as:
where
is a ground truth count from the
i-th input image.
3.2. The MLP Encoder
The MLP encoder consists of the convolution tokenizer, the convolution stage, the MLP stage, and the graph stage. Next, we will introduce these parts.
3.2.1. Convolution Tokenizer
Unlike other Transformer-based models, we adopted the convolution tokenizer to extract the preliminary feature maps. It comprises triple convolutional blocks. Each block comprises a 3 × 3 convolution and normalization and activation functions. The tokenizer is succeeded by the maximum pooling layer.
3.2.2. Convolution Stage
To decrease the calculations and optimize the connectivity of the space, we used a pure convolution stage after tokenization, which can produce a feature map. The convolution stage has three blocks, where each block consists of two 1 × 1 convolution layers having a 3 × 3 convolution layer in the center. As stated, we adopted the convolution stage to augment the connectivity of the space.
3.2.3. MLP Stage
Most current MLP-based models use the spatial MLP approach, which has constraints on the visual representation. Spatial MLP accepts only fixed-resolution inputs, making it difficult to transfer to downstream tasks. To reduce the input dimensionality constraints, we adopted an MLP stage, which contains only the channel MLP, which means allowing feature extraction between different channels. However, using only the channel MLP ignores the spatial information in the feature map. Therefore, we added a depthwise convolution in each MLP stage to compensate for the missing spatial interactions. Meanwhile, inspired by the use of the linear layer-based patch-merging method in the Swin Transformer to downsample the feature maps to obtain the overlap of the spatial information, we introduced the down convolution blocks, aiming to improve the regression accuracy by obtaining the overlap of spatial information in the dense population. The down convolution block uses a convolutional layer with a stride of 2 to replace the Swin Transformer’s patch merging. Compared with the Swin Transformer’s patch merge, our down convolution block introduces only a few parameters.
3.3. Scale-Reasoning Module
Meanwhile, we designed the scale-reasoning module to capture the multiscale information and mixture of the region-to-region dependency in the images. In our approach, the scale-reasoning module is described as a function , with the arguments ; the input space X reflects the space of the input images; the target M is the relation map, which contains the relationship of the heads and the background, specifically the input feature map , and we study the mapping function , which can deduce the relation map . We represent the extracted multiple scales features with a directed graph , where represents the edges among the . For each node in , we learn its renewable representation, called , by assembling the representations of its neighbors. Finally, the renewable features are merged to yield a final relation map.
Multiple scale nodes: Given the feature maps
, we employed different dilated rates for the dilated convolution and, then, extracted multiple scale features characterizing the same modality (
n scale) as the initial node by convolutional and interpolation layers, obtaining a total of
nodes. Their original node denotations
can be calculated as:
where
stands for the dilated convolution operation with a rate of
.
denotes the interpolation operation to ensure that multiscale feature maps have the same dimensions
.
where
and
are nodes in
.
represents a function that binds the node embeddings
and
.
is the edge between the node
a and the node
b in set
.
The edges are updated by all its neighboring nodes. The edge information
is passed from all neighboring nodes
and
, and the edge information function
:
where
represents the edge information of node
a and node
b at
t time.
Finally, we used the edge’s information to upgrade the information of nodes. The node is updated by the following formula:
where
denotes the Gated Recurrent Unit [
37].
Finally, we adopted the merge and interpolate operation to generate the final relation map
:
where
is the merge function, which comprises a connected layer after a
convolutional layer.
indicates the readout function, which is used for mapping the learned representations. The
is used to resize the generated results.
3.4. Regression Branch
The regression branch has an operation called GAP. Specifically, we concatenated the relation map (
) and the output features of the MLP stages (
), followed by a regression head, which is the GAP operation to regress the estimated counts. The equation is as follows:
3.5. Scale-Ranking Module
The scale-ranking module is guided by the fact that a smaller region must have fewer crowd numbers than or equal crowd numbers as a larger region. This fact led us to understand the internal information of the image better and expand the datasets efficiently. We randomly selected the initial rectangle area
in the feature map
, followed by the downsampling ratio
r to obtain the subrectangle area
and
. Finally, we adopted the GAP to generate the part estimated counts. The equation is as follows:
where
stands for the subrectangle regions with the following downsampling rate
r. The
is the part estimated counts of the
j-th subrectangle areas (
) in the
i-th images.
is the first randomly selected region in the input image.
3.6. Loss Function
To train SR2, we directly improved the accuracy of the estimated counts by minimizing the gap between the estimated counts and the ground truth. Specifically, we used the
loss and the rank loss in the regression branch and the ranking branch. The loss function
is shown as:
where the best experimentally analyzed
is 0.7.
The rank loss
is as follows:
where
S represents the amount of the selected patches.
4. Experiment
In this part, we first present the execution details and the setting of the experiment, and we utilized the popular crowd counting datasets. Meanwhile, we measured our approach against other superior approaches. Lastly, we carried out ablation tests to validate the efficiency and effectiveness of every component included in our approach.
4.1. Execution Details
We applied the Adam optimizer, which was trained for 1000 epochs. We configured the batch size as 8, the weight decay as , and the learning rate as , and with more than 300 epochs of training, the rate of learning was decreased to 0.1-times the original learning rate. Meanwhile, the weights pre-trained on the ImageNet dataset were applied to initialize the MLP. Furthermore, the in the regression branch was (4, 8, 16), and the downsampling ratio r was set to 0.75 in the ranking branch. The margin we set was 0.03 in the rank loss. Lastly, it was implemented on a single NVIDIA RTX 3060Ti GPU (Santa Clara, CA, USA) with the Pytorch framework.
4.2. The Datasets Used
ShanghaiTech [
2] is grouped into two segments, which are ShanghaiTechA, which comprises 300 images used for training and 182 images for testing, and ShanghaiTechB, which has 400 images used for training and 316 images used for testing.
UCF-QNRF [
10] has one million annotations of 1535 images. The range of counts is extensive, spanning from 49 to 12,865. Additionally, it involves 1201 images for training and 334 images for testing.
NWPU-Crowd [
12] is a dataset that is enormous and challenging. It includes 5109 images, and the number of instances is 2,133,375 with detailed annotations. Furthermore, the dataset was stochastically separated into two segments: the training dataset and the test dataset, which comprised 3,109,500 and 1500 images, respectively.
JHU-CROWD++ [
11] consists of 2722 images used for training, 500 images used for estimating, and 1600 images for testing from a wide range of scenes. The total number of people in each image varies from 0 to 25,791.
EoCo [
38] comprises two parts, Part A and Part B, and includes a total of 6885 images, with 2859 images in Part A and 4026 images in Part B. Part A is divided into six classes: person, jujube, cherry, tulip, chicken, and vehicle. All samples in the dataset are sourced from public datasets or competitions and are classified into four categories: face, wheat, person (ShanghaiTech Part B), and penguin.
4.3. Evaluate Metrics
We opted for the mean absolute error along with the mean-squared error as evaluation metrics to assess the counting results of our approach:
where
N is the amount of testing images and
and
are the predicted and ground truth count of the
i-th image, respectively.
4.4. Compared Crowd Counts
We carried out an extensive experiment on four prevailing datasets [
10,
11,
12] to verify the usefulness of the proposed approach. In this part, we compare with previous state-of-the-art methods. Finally, we demonstrate the ablation studies to verify the effectiveness of the different parts of our approach.
Comparing the counting methods with full supervision: Specifically, on the ShanghaiTechA dataset, our approach improved by
on the MAE and
on the MSE with respect to CSRNet, which benefited from the ranking branch to understand more inner information. On the ShanghaiTechB dataset, our approach improved by
on the MAE and
on the MSE with respect to CSRNet and improved by
on the MAE and
on the MSE compared with BL, which benefited from the MLP architecture and could obtain the global information. The specifics of the ShanghaiTech datasets are shown in
Table 1.For the QNRF dataset, we found that our approach improved by
on the MAE and
on the MSE with respect to CSRNet and benefited from the the MLP architecture, which could acquire more global information and the pyramid pooling in the graph stage. The results of the QNRF dataset are shown in
Table 2. For the NWPU dataset, our approach improved by
on the MAE with respect to CSRNet and improved by
on the MSE with respect to PCC-Net-VGG, which benefited from the MLP architecture and the ranking branch. Besides, our approach improved by
on the MAE and
on the MSE with respect to C3F-VGG on the NWPU dataset.
Comparing the counting methods with weak supervision: Specifically, on the ShanghaiTechA dataset, our approach improved by
on the MAE and
on the MSE with respect to MATT due to the graph stage, capturing more information between the heads and the background. Our approach also improved by
on the MAE and
on the MSE with respect to Transcrowd-GAP, which benefited from the convolution tokenizer being replaced by the traditional tokenizer, which could acquire the global information.For the QNRF dataset, our approach improved by
on the MAE and
on the MSE with respect to Transcrowd [
4]. The specifics of the QNRF dataset can be seen in
Table 2. Furthermore, we also validated the effectiveness of our approach on the JHU-Crowd++ dataset and the NWPU dataset, as illustrated in
Table 3 and
Table 4. For the JHU-Crowd++ dataset, our approach improved by
on the MAE and improved by
on the MSE with respect to Transcrowd [
4]. For the NWPU dataset, our approach improved by
on the MAE and
on the MSE compared to the Transcrowd [
4].For the NWPU dataset, our approach improved by 1.5% on the MAE and 5.8% on the MSE with respect to Transcrowd-Token. For the JHU-Crowd++ dataset, our approach improved by 6.2% on the MAE and 8.0% on the MSE with respect to Transcrowd-Token. To verify the generalization ability of our model, we conducted a validation on the EoCo dataset, and the performance on this dataset was also very excellent, as shown in
Table 5. For the cherry class, our approach improved by 43.31% on the MAE and 27.23% on the MSE with respect to the MCNN and improved by 14.55% on the MAE and 13.89% on the MSE with respect to CSRNet. As shown in
Table 5, we also demonstrate that counting performance was comparable to the popular fully supervised networks on other classes of the EoCo dataset.
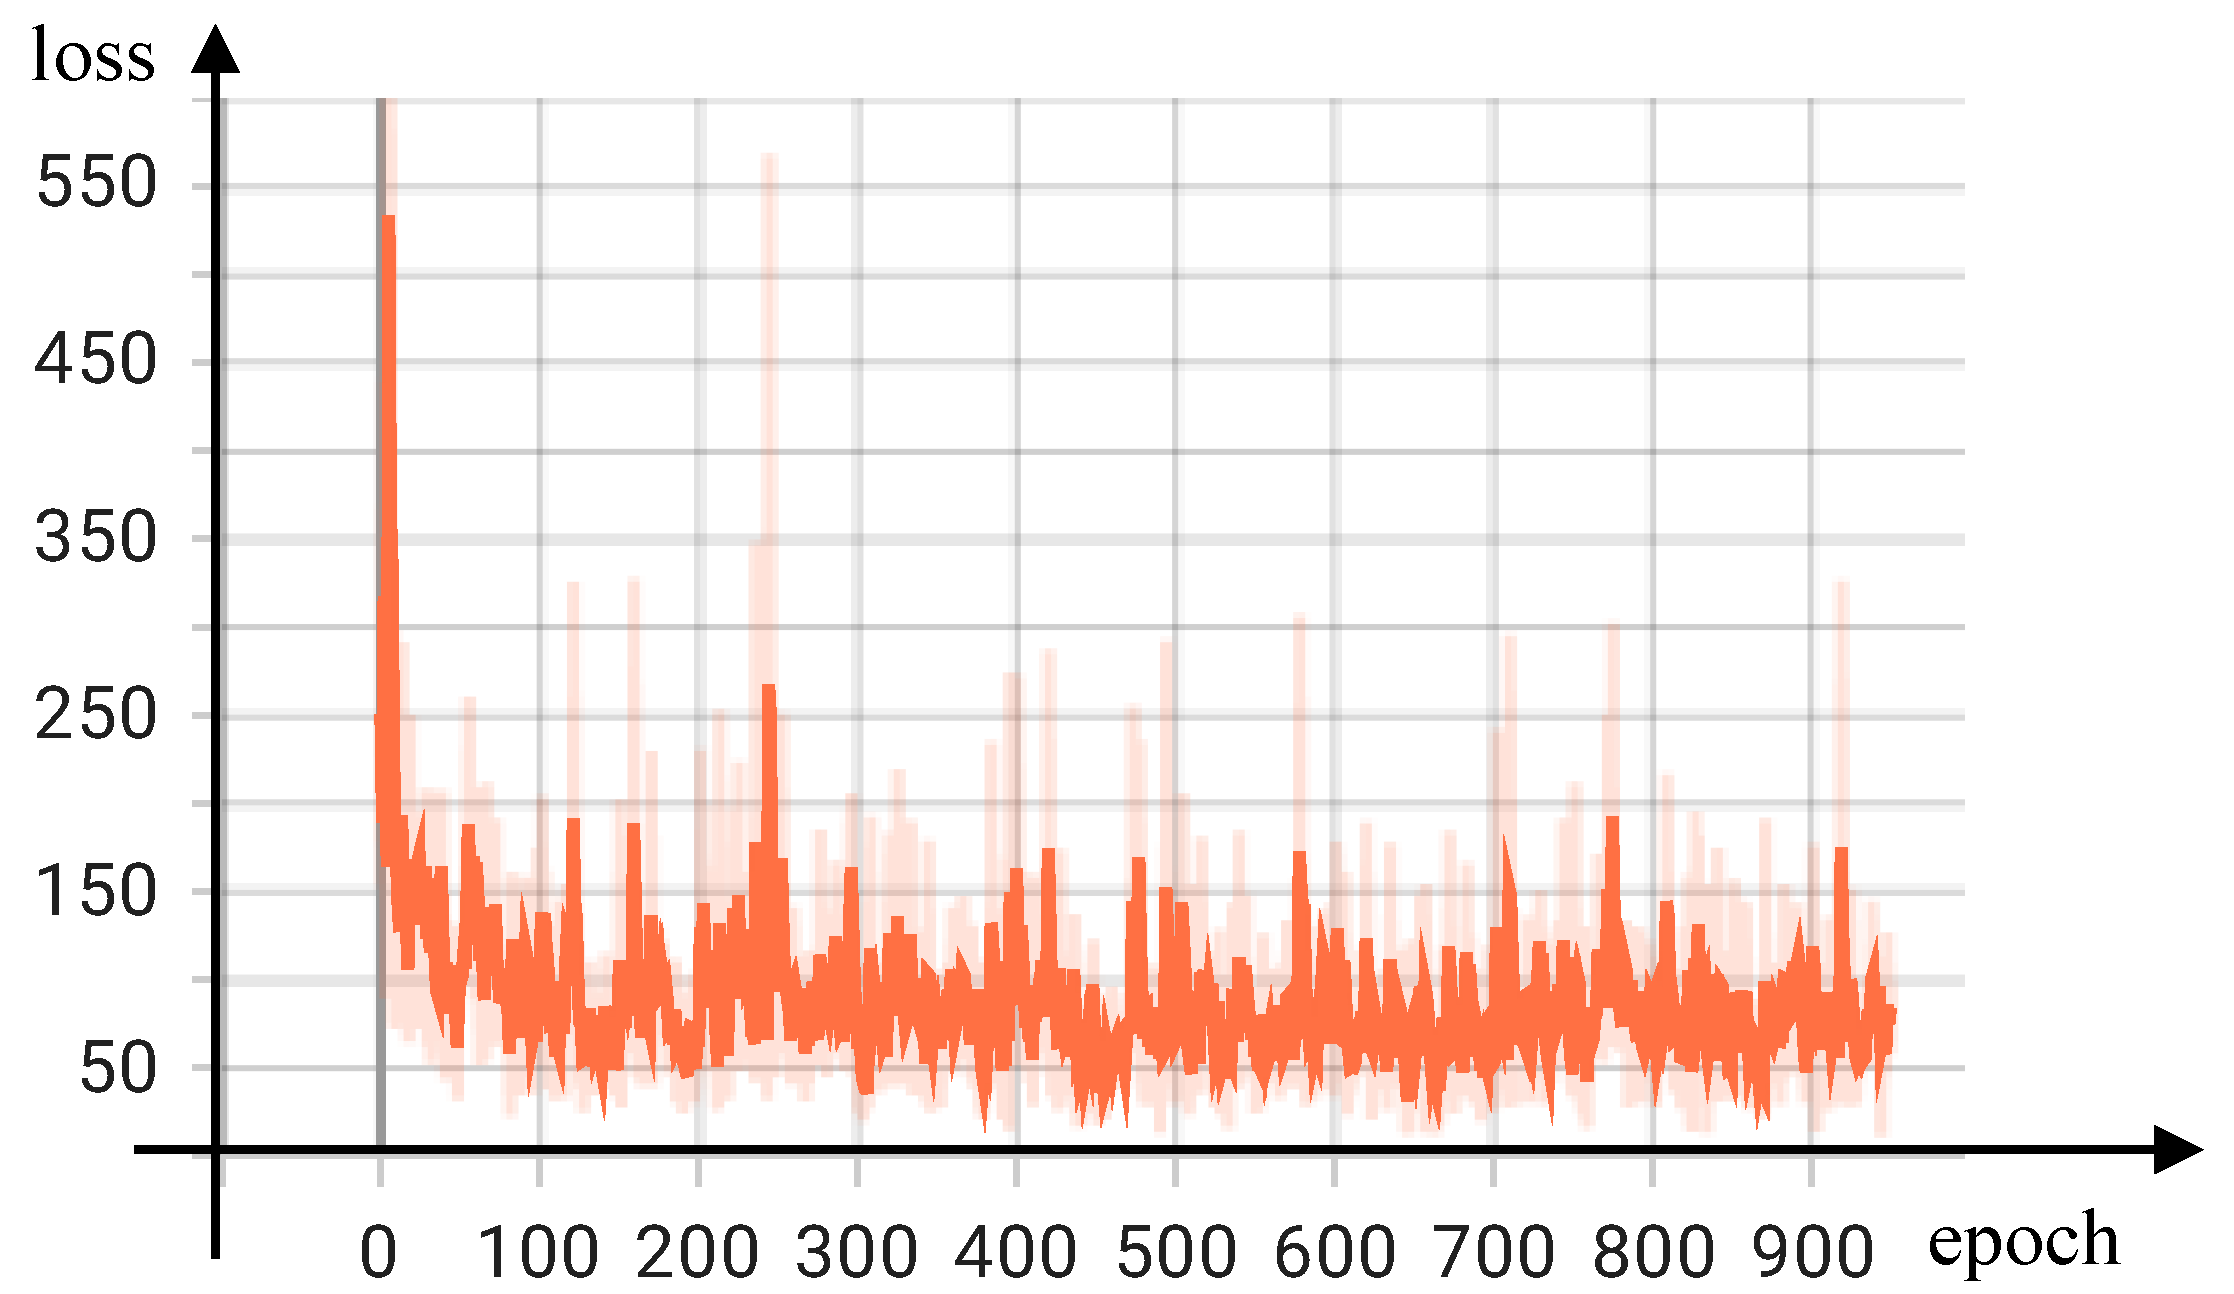
Moreover, we also show the results of the training loss value with the number of training epochs on ShanghaiTech Part A in
Figure 2. As can be seen, our model had rapid convergence within the first 100 epochs of the training phase and consistently stayed within the designated convergence interval.
4.5. Visualization and Analysis
To discern whether our proposed method learned the crowd changes in the spatial scales and spatial semantics, we divided the image into equal parts and predicted the count of each part separately, as illustrated in
Figure 3. Specifically, the leftmost image (yellow) cluster had large-scale variation. The rightmost image (green) cluster had auniformly distributed crowd.
4.6. Inference Time Calculation Comparison
As illustrated in
Table 6, we compared two popular counting approaches with full supervision, BL [
39] and CSRNet [
3]; we also make a comparison between two popular weakly supervised counting methods, Transcrowd-Token [
4] and Transcrowd-GAP [
4]. The test was performed on an NVIDIA RTX 3060Ti GPU. Despite the longer run time of SR2 compared to the other methods, excellent performance could be achieved with only half the parameters due to the fact that our approach optionally merges tokens to represent the signature of larger objects while corresponding to certain tokens to maintain the fine-grained features.
4.7. Ablation Study
Scale-ranking module: To demonstrate the impact of our proposed ranking branch, we removed the scale-ranking module from our proposed method. Specifically, we only used the MLP encoder, the regression branch, and
loss, which were compared with SR2 on the ShanghaiTechA dataset, as illustrated in
Table 7. From
Table 7, we can find the impact of the scale-ranking module, which could learn more inner information in the images. Meanwhile, there is a ratio
r that determines the size of
in
Figure 1. Thus, we selected different ratios to obtain the best performance of the scale-ranking module. The results are shown in
Table 8. From
Table 8, we found that the ratio of 0.75 had the best performance. Meanwhile, we also tested the capabilities of the amount of
, as illustrated in
Table 9, and we obtained the best performance when the amount of
I was five.
Scale-reasoning module: We further showed the impact of the scale-reasoning module. Therefore, we removed the scale-reasoning module from SR2, as illustrated in
Table 7. Because the scale-reasoning module can reflect the relationship between the heads and backgroundin the images well, we found a
improvement in the MSE.
The amount of the MLP stages: The MLP stage was used to extract the feature maps from the input images. When we set the amount of MLP stages as three, the capabilities of our approach were the best. The details can be seen in
Table 10.
The convolution stage: In order to solve the limitations of the dimension of the input feature map, we only adopted the channel MLP. However, only using the channel MLP may ignore the spatial information. Thus, we added the convolution stage before the MLP stages, which can increase the interaction of the spatial information in the images. The specifics of the convolution stage are shown in
Table 7.
The loss function: We set the loss function as
.
is a weighting factor reflecting the ranking loss proportion. We found that the results were better when we set
as 0.7. The details can be seen in
Table 11.
5. Conclusions
In this paper, we proposed SR2 for weakly supervised crowd counting. SR2 adopts an MLP-based framework. The framework leverages the convolution stage and the MLP stage for deep feature extraction, which can obtain efficient crowd feature representations. Considering that the MLP architectures ignore the spatial information and the information of the inner image, we added the scale-reasoning module to fuse the region-to-region dependency in the images and capture the multiscale information. Then, the fused features were fed into two branches, which were the regression branch for generating estimated counts and the scale-ranking module for improving the accuracy of the estimated counts in the regression branch. SR2 was assessed on four popular datasets for crowd counting, showing superior results with respect to other excellent approaches. The effectiveness of our approach was proven by both the quantitative and qualitative results. However, SR2 has many network parameters and is unsuitable for hardware with restricted computational resources. Besides, we only took into account crowd counting from images and did not explore crowd counting in videos, which would by appropriate for real-world applications. In the next step in this process, we will try to extend weakly supervised crowd counting to video tasks.


