Article

Unified Generative Data Augmentation for Efficient Solar Panel Soiling Localization

by
Seung-Eun Go
1,†,‡,
Jeong-Hun Kim
2,†,
Tserenpurev Chuluunsaikhan
1,
Woo-Seok Choi
3,
Sang-Hyun Choi
3,4,* and
Aziz Nasridinov
1,*
1
Department of Computer Science, Chungbuk National University, Cheongju 28644, Republic of Korea
2
Bigdata Research Institute, Chungbuk National University, Cheongju 28644, Republic of Korea
3
Department of Bigdata, Chungbuk National University, Cheongju 28644, Republic of Korea
4
Department of Management Information Systems, Chungbuk National University, Cheongju 28644, Republic of Korea
*
Authors to whom correspondence should be addressed.
These authors contributed equally to this work.
Current address: CUBIG, Seoul 06620, Republic of Korea.
Electronics 2024, 13(24), 4859; https://doi.org/10.3390/electronics13244859
Submission received: 8 October 2024 / Revised: 11 November 2024 / Accepted: 22 November 2024 / Published: 10 December 2024

Abstract

:
As the usage of solar power generation increases, it has become essential to predict power generation accurately. Among the various factors that affect solar power generation, soiling on the panel surface drastically reduces solar power generation. Therefore, accurately identifying the area of soiling on the panel surface helps predict solar power generation. However, most existing studies classify the presence or absence of soiling on the panel or the type of soiling. Additionally, current datasets used for training these models, such as the Solar Panel Soiling Image (SPSI) dataset, suffer from limitations, including a lack of diversity in panel types and a small number of unique soiling shapes. To address these issues, we propose three novel data augmentation techniques—Naïve, Realistic, and Translucent—that generate diverse solar panel images with various soiling patterns. Using Pix2Pix and Copy-Paste methods, we created three corresponding datasets to address the imbalances in the existing SPSI dataset. We trained the DeepLabV3+ model for soiling localization using both the original SPSI dataset and our augmented datasets. Experimental evaluations on real-world solar panels installed at Chungbuk National University demonstrated that models trained on our proposed datasets significantly outperform those trained on SPSI data, with improvements in the Jaccard Index of 3.3%, 2.4%, and 14.6% for the Naïve, Realistic, and Translucent datasets, respectively. These results highlight the effectiveness of our data augmentation techniques for improving soiling localization in solar panels.

1. Introduction

Predicting solar power generation is essential for making solar energy systems more efficient and reliable. Accurate predictions help in planning and managing energy resources, reducing gaps between energy supply and demand, and supporting a stable power grid. Solar power generation depends on several environmental factors, such as sunlight intensity, temperature, shading, panel angle, and soiling on the panel surfaces. Each of these factors can affect the performance of solar panels. However, soiling has a particularly strong impact because it may directly block sunlight from reaching the solar cells. Unlike other factors that might change slowly, soiling can cause an immediate and sometimes large drop in power output, depending on the type and amount of buildup [1].
Analyzing solar panel images to localize the soiling of the panel surface accurately proves beneficial for predicting solar power generation. Localizing objects in images is often preferred when a detailed understanding of an object is required, such as augmented reality, medical imaging, and other applications [2,3,4]. The existing studies that localize the soiling of the solar panel using solar panel images are broadly categorized into classification-based methods [5,6,7,8] and localization-based methods [1,9,10]. Classification-based approaches identify the presence or absence of defects and, in some cases, classify the defect type. For example, Aghaei et al. [5] and Akram et al. [6] utilized deep learning models to classify defects using infrared (IR) images, which allows for real-time monitoring but lacks spatial precision in localizing specific soiling areas. Dunderdale et al. [8] improved upon these methods by employing the Scale Invariant Feature Transform (SIFT) and deep learning models to classify defect types, though spatial details were still limited. While classification provides useful insights, these methods face the challenge of accurately localizing the soiling area because they distinguish only the presence of soiling or the type.
Localization-based methods accurately identify the soiling area. However, all the training solar panel images consist of only one type of panel, which can lead to model overfitting. For example, Mehta et al. [1] introduced the Solar Panel Soiling Image (SPSI) dataset, which includes 45,754 panel images containing six different types of soiling. However, the SPSI dataset presents two main limitations. First, it includes only one type of solar panel, which could cause the model to misclassify the panel-specific patterns as soiling when models are trained on this dataset. Second, of the 45,754 images, only 84 feature unique soiling shapes, which may result in the model incorrectly segmenting soiling regions. These limitations highlight the need for a more diverse and representative dataset. While conventional image augmentation techniques, such as rotation, inversion, and color alterations [11,12], have been used to mitigate overfitting, they remain ineffective in generating new panel types.
In this study, we address these limitations by proposing three novel data augmentation techniques—Naïve, Realistic, and Translucent—to generate diverse solar panel images with various soiling patterns. Naïve augmentation involves copying soiling regions from existing panels into different panel types using the Copy-Paste method [13], offering a simple yet effective approach to increase the panel variety. Realistic augmentation leverages the Pix2Pix algorithm [14] to generate new soiling patterns and applies them to panels using a Copy-Paste method, ensuring that the soiling appears natural and varied. Translucent augmentation introduces translucent soiling, such as dust or snow, by overlaying semi-transparent masks, which mimics the real-world soiling conditions often seen in solar power plants. These augmentation techniques allow us to generate three corresponding datasets—Naïve, Realistic, and Translucent—which can be used to train deep learning models for accurate soiling localization. Using these datasets, we train the DeepLabV3+ [15] model and evaluate its performance on real-world solar panel images collected at Chungbuk National University, South Korea. The experimental results demonstrate significant improvements in localization accuracy, especially when utilizing the Translucent dataset, which includes soiling types that are typically not presented in existing datasets. The key contributions of this study are as follows:
  • We introduce three novel data augmentation techniques that generate diverse solar panel and soiling types, addressing the limitations of existing datasets.
  • We generate three distinct datasets—Naïve, Realistic, and Translucent—using these techniques, ensuring that the augmented images are free from visual artifacts and reflect real-world soiling conditions.
  • We compare the performance of the segmentation model trained with each dataset, using solar panel image data collected at Chungbuk National University, South Korea, acquired from 22 March 2023 to 1 May 2023. Through this experiment, we can confirm the segmentation model’s usability in actual solar power plants. Specifically, our proposed method improves the Jaccard Index of the public dataset SPSI by 14.59%.
We organized the paper as follows. Section 2 describes the related studies and discusses their differences with our study. Section 3 presents our methodology including data collection, data preprocessing, data generation, and soiling localization. Section 4 demonstrates the results of qualitative and quantitative analysis. Lastly, Section 5 concludes the study and discusses future works.

2. Related Work

This section introduces various existing studies relevant to the current study. There are various types of solar panel images depending on the shooting range (cell level, module level, array level) and shooting method (RGB, infrared (IR), and electroluminescent (EL)) [16]. We describe studies that took various types of solar panel images as the input and analyzed the status of the solar panels. Section 2.1 introduces studies that include a classification-based solar panel analysis, which classifies the presence of defects on a solar panel or defects type. Section 2.2 introduces studies that use localization-based solar panel analysis, which not only classifies the types of solar panel defects but also identifies the location of the defect.

2.1. Classification-Based Solar Panel Analysis

Classification-based solar panel image analysis classifies the presence or absence of defects in a given solar panel image [5,6] or classifies the type of defect [7,8]. Aghaei et al. [5] proposed a method to count the total number of panels, both defective and healthy, in a solar power plant. First, using Image Mosaicing (IM) technology based on the Harris corner detector, several aerial IR images captured using a drone are created into a single solar panel string. Then, we can check the entire panel of a solar power plant in one image. The total number of panels is calculated using the edge-detecting algorithm on the panel string IR image generated in this way. Additionally, to calculate the number of defective and healthy panels, Laplacian and binary models are applied to highlight defects in the panel and calculate the number of panels with defects. Akram et al. [6] used isolated deep learning and transfer deep learning technologies to classify solar panel defects in solar IR images automatically. Isolated deep learning is trained from scratch based on a lightweight CNN structure. Transfer deep learning is a technology that trains the basic model of the CNN structure in advance with the EL image dataset and then fine-tunes it to suit the IR image dataset. Both of these methods require a small amount of calculation and a small amount of time so that they can be implemented with general hardware and have the advantage of being able to analyze solar panel images in real-time.
Li et al. [7] proposed a deep learning-based solution that classifies defects in solar panels using drone-based aerial solar plant images. This method extracts deep features from panel images and performs pattern recognition of panel defects. For this purpose, they adopted CNN, which can extract deep features while maintaining the spatial information of images. After extracting the deep features of the panel image through CNN and smoothing it through a fully connected layer, they are classified into an appropriate defect type class using softmax. This method classifies various types of solar panel defects with high accuracy. Additionally, since panel defect types can be classified in real-time, large-scale solar power plants can be integrated into an unmanned aerial vehicle platform for efficient monitoring. Dunderdale et al. [8] used the Scale Invariant Feature Transform (SIFT) feature descriptor, spatial pyramid matching, and a deep learning-based model to detect and classify defective panels using IR images of solar panels. The SIFT feature descriptor is used as a feature extraction algorithm for the Bag of Visual Words model to express the feature vector of the IR image. Likewise, spatial pyramid matching expresses the feature vector of a given IR image. The feature vectors extracted through the two methods are input to Random Forest and Support Vector Machine (SVM) classification models to detect defective panels and classify defect types. On the other hand, deep learning-based defect classification is performed using VGG-16 and MobileNet architecture. Because deep learning requires a large amount of data, data are augmented vertically and horizontally by flipping a given image and rotating the image by 90°, 180°, and 270°. As a result, with only a small amount of IR image data, the SIFT feature descriptor and spatial pyramid matching classify panel defects with high accuracy, and the deep learning model also classifies the type of defect well.
However, classification-based panel image analysis cannot accurately identify the area of soiling because the spatial characteristics of the image are ignored, and the results are given in terms of whether there is a defect or a defect type class. However, it is essential to accurately determine the location of panel defects to determine the amount of power generation reduction due to soiling.

2.2. Localization-Based Solar Panel Analysis

Research has been conducted to identify the location and area of defects beyond simply classifying whether a panel is defective or the defect type [1,9,10]. Mehta et al. [1] proposed DeepSolarEye, a method for identifying soiling on the surface of solar panels and predicting power generation reduction. DeepSolarEye uses a CNN-based model to identify soiling on panels. However, CNN loses spatial information while training image features. This makes it difficult to determine the location of the soiling on the panel. DeepSolarEye applies a new convolution unit called “bidirectional input-aware fusion block (BiDIAF)” to solve this problem. BiDIAF units can be integrated with any CNN (e.g., VGG, ResNet). In the CNN branch, an existing input image is taken, and a convolution operation is performed to provide two outputs. The output of one of these is shared with the CNN branch that was used as the input. Through BiDIAF, the localization function of CNN was improved, making it possible to identify the exact location of soiling. Additionally, DeepSolarEye created a large dataset of solar panel soiling images to train the proposed model.
Aghaei et al. [9] proposed a digital image processing technology algorithm designed in the Matlab environment to identify the location of defects in the panel from the IR image of the solar panel. First, it is converted to grayscale because resolution improvement and color adoption are necessary to facilitate defect identification. Next, the image converted to grayscale is filtered using general filters, such as low-pass Gaussian, anomaly, and average, to remove specific noise present in the image and reduce the sharpness of the image. In general, panel defects affect the panel temperature. Therefore, a binary transformation is applied to the filtered image to display cool areas of the panel as black and hot areas as white. Finally, a Laplacian model is extracted to implement the defect characteristics of the panel. The Laplacian model provides an overview of all defects and the number of defects detected in the panel. Using the proposed method, the location of the defect in the solar panel can be identified in the IR image, and the resulting reduction in power generation can also be determined.
Wang et al. [10] proposed a method based on YOLO v3 and Mask R-CNN for detecting abnormal shading on the surface of solar panels. First, to improve the accuracy of recognizing defects on the surface of solar panels, the area of the panel is extracted from solar panel images taken in the field. Extracting and processing the input solar panel image with the trained YOLO v3 model, we designate the panel area as the region of interest (RoI). Then, we find the location of the defect in the image of the extracted panel. This method uses seven different anchor boxes to detect defects because defects have various shapes and angles. Mask R-CNN is used to classify the type of detected defect. Mask R-CNN is slower than YOLO v3 but has a high mAP and is used to classify defect types in the detected area. Additionally, to prevent the overfitting of deep learning models, solar panel images are augmented using various methods (e.g., gaussian noise, random sample paths). This augmentation improved the accuracy of detecting solar panel surface defects.
Previous studies have effectively identified defects or soiling areas of solar panels. However, if we look at the solar panel image dataset, all the images consist of only one type of panel. Because this causes overfitting of the soiling segmentation model, a dataset containing various types of panels is needed. Therefore, in this study, we propose a method for generating datasets containing various types of panels.

3. Materials and Methods
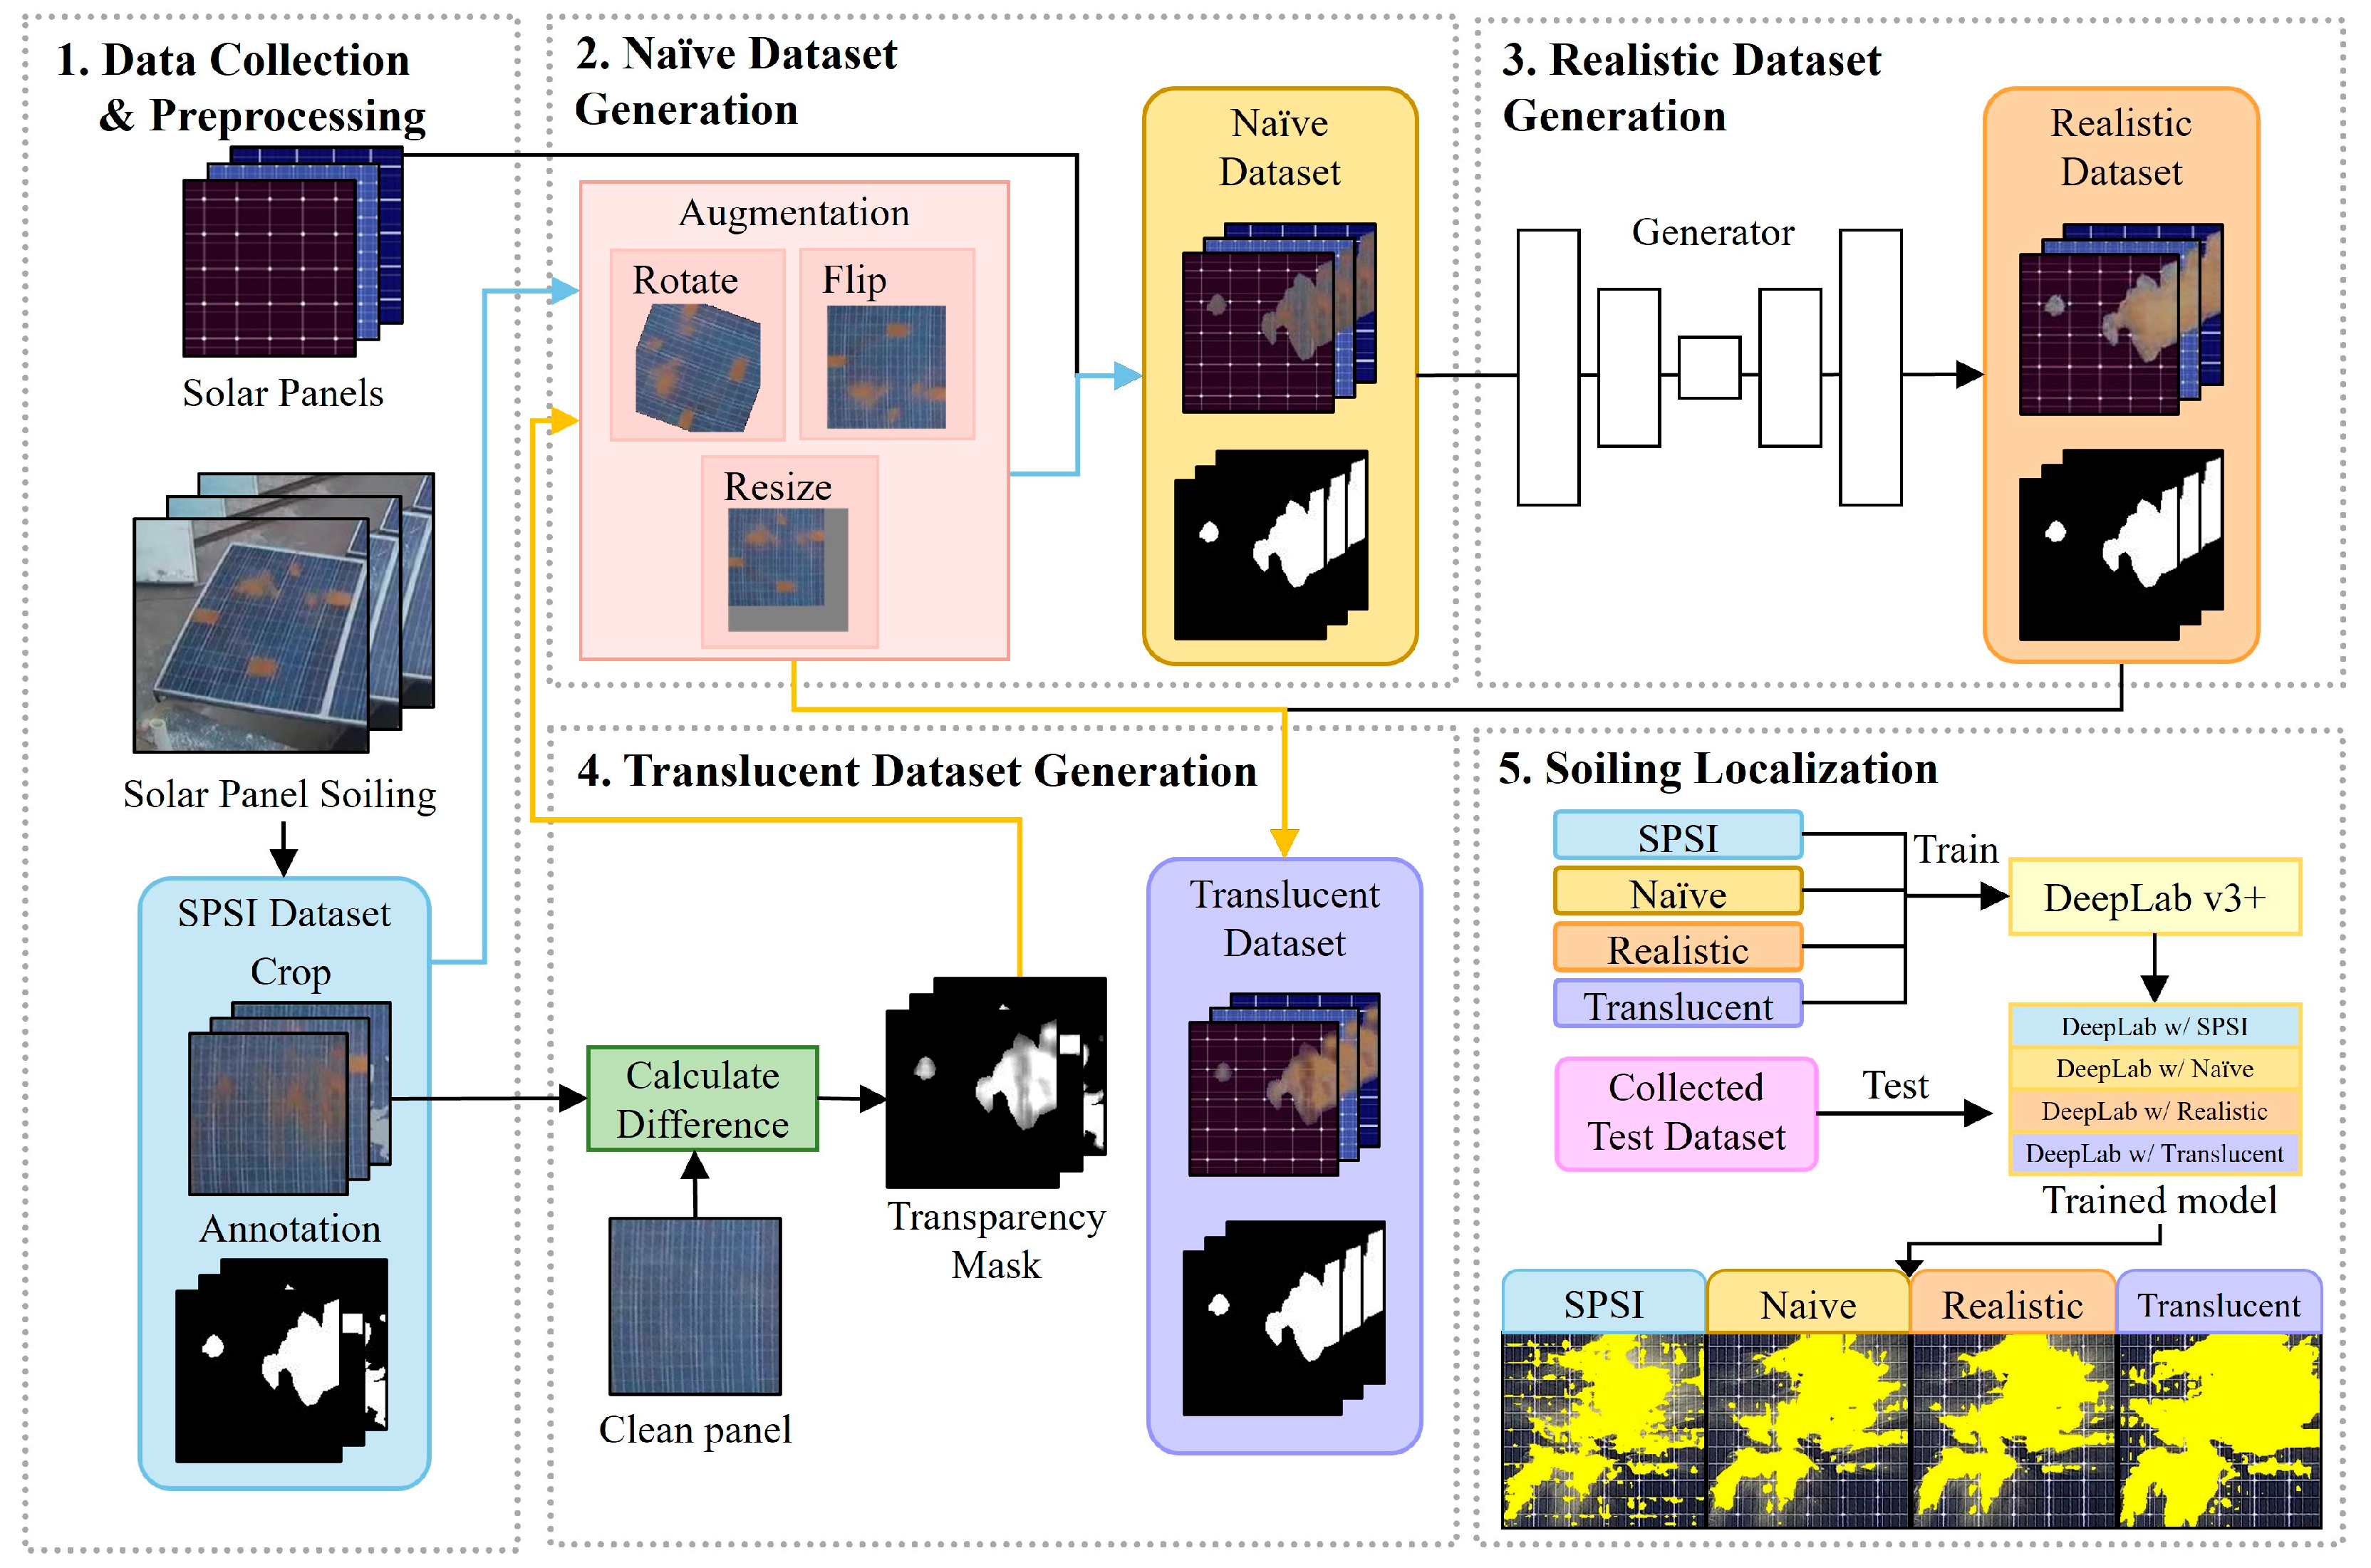
3.1. Overview

Figure 1 shows an overview of the method proposed in this study. The proposed method is divided mainly into data collection and preprocessing, Naïve dataset generation, Realistic dataset generation, Translucent dataset generation, and soiling localization steps. In the data collection and preprocessing stage, we collect and preprocess the image data required to generate the dataset to suit the segmentation and generation models. In the Naïve dataset generation stage, a new solar panel soiling image is generated based on Copy-Paste method. As a result, we obtain a Naïve dataset containing the generated images and the corresponding ground truth. However, in the Naïve dataset, there is a problem in that the patterns of the existing panel are copied together to the new panel, leading to potential inaccuracies. In the Realistic dataset generation stage, we generate new solar panel soiling images that solve the problems of the Naïve dataset based on the Pix2Pix method. However, the Realistic dataset has a problem in that there is no translucent soiling that frequently occurs in actual solar power plants. In the Translucent dataset generation step, we generate a new dataset containing translucent soiling using a transparency mask containing transparency information about the soiling. At this stage, we properly unify the Copy-Paste and Pix2Pix methods. In the final soiling localization step, we use the four previously obtained datasets as training datasets of the DeepLabV3+ method to evaluate the usefulness of the datasets.

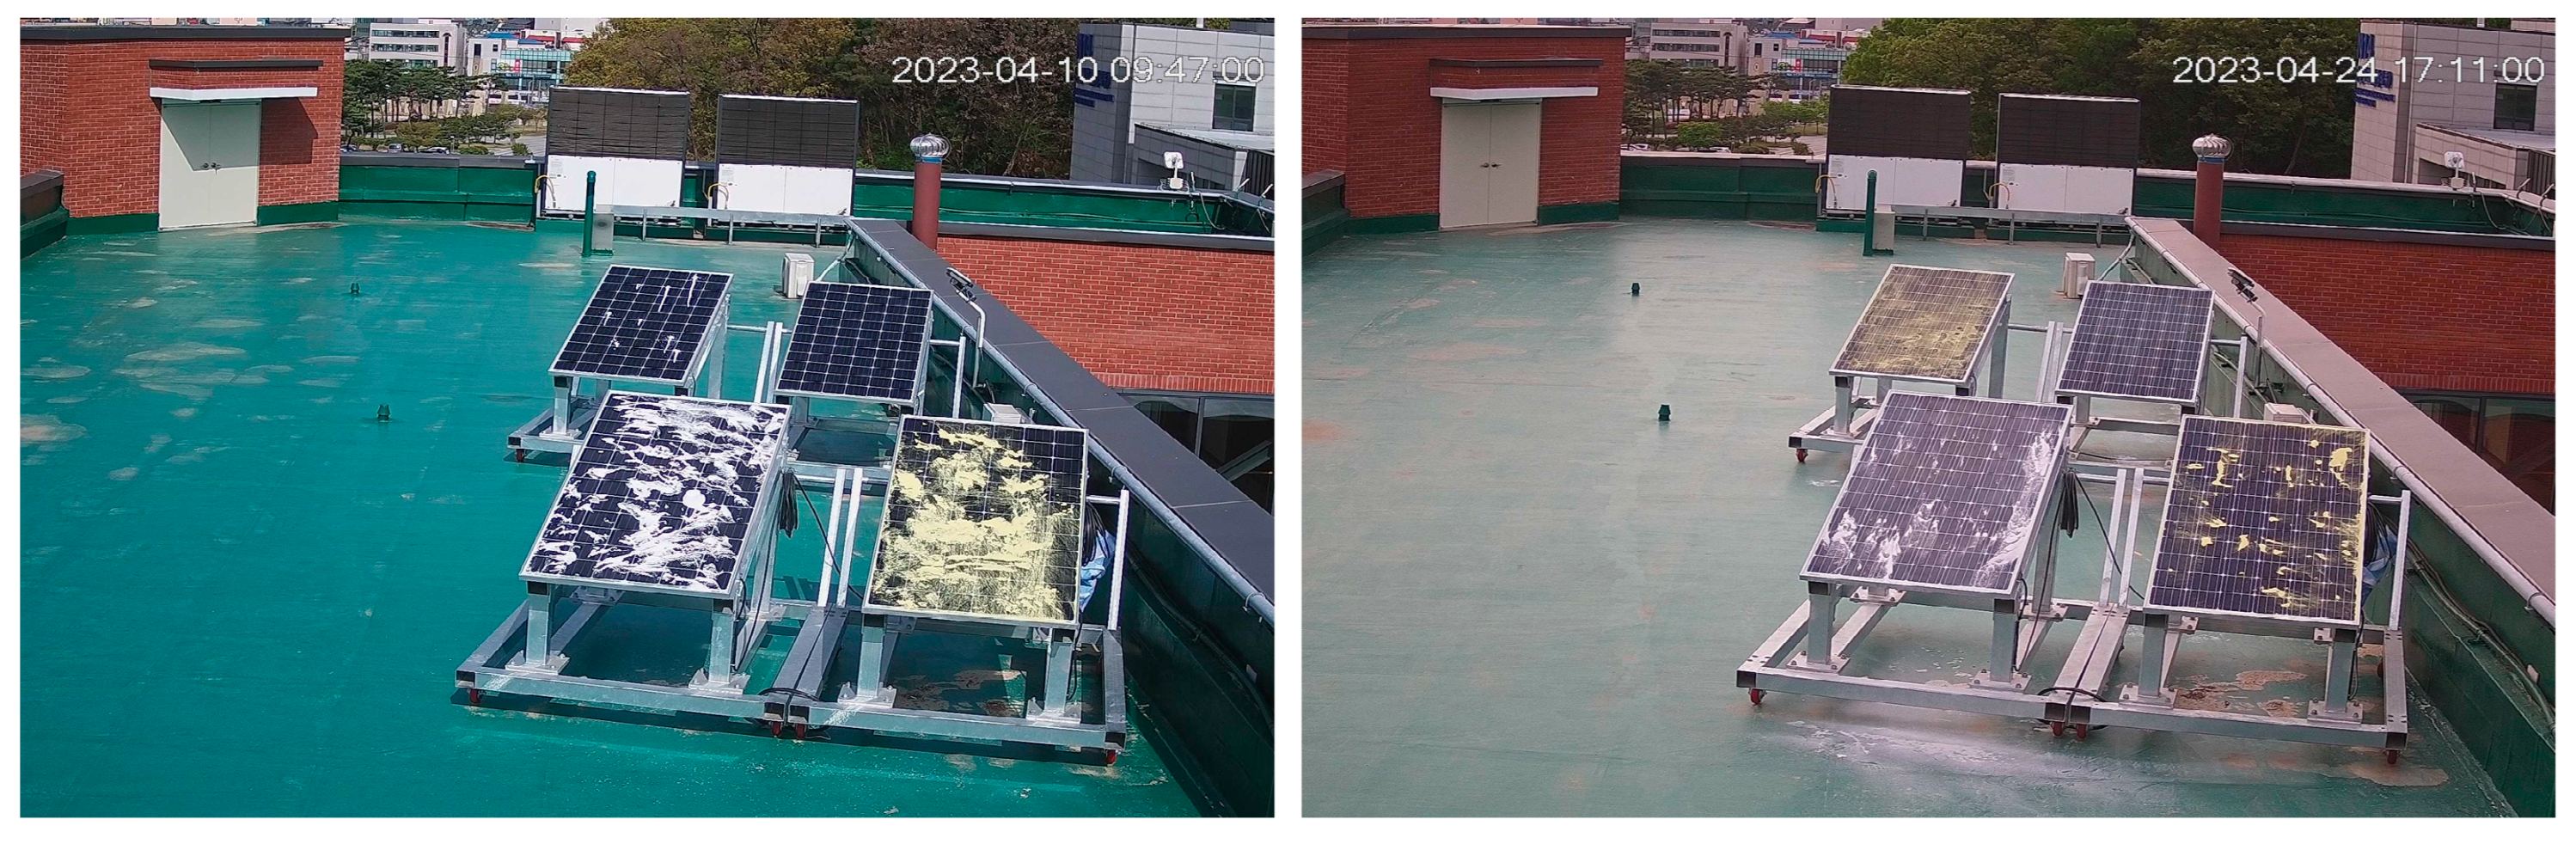
3.2. Data Collection

First, we collected the SPSI dataset, a benchmark dataset assembled by related research [1]. The SPSI dataset is the first publicly available image dataset for solar panel soiling analysis. IBM Research Lab collected the SPSI dataset, a dataset of solar panel images with various types of soiling, to analyze the impact of the type and degree of soiling on solar power generation. Figure 2 is an example of the SPSI dataset. All images in the SPSI dataset were collected at 5 s intervals over one month using an RGB camera. The SPSI dataset consists of 45,754 different solar panel soiling images, and the size of all images is 192 × 192. Soiling types in the SPSI dataset are divided into six types: clean, bird-dropping, dust, dirty, cracked, and snow.
Additionally, we collected new types of solar panel background images to generate a dataset containing diverse types of solar panels. Figure 3 shows the 10 new panel background images collected. Figure 3a–g show panel images downloaded from Adobe Stock [17], Figure 3h,i are panel images installed in an actual solar power plant, and Figure 3j is a clean type from the existing SPSI dataset.
To evaluate the effectiveness of the proposed method in a real-world environment, we collected solar panel soiling images from the solar panel testbed at Chungbuk National University. Detailed descriptions of these real-world solar panel soiling images are provided in Appendix A.

3.3. Preprocessing

We preprocessed the SPSI dataset collected earlier. Figure 4 shows example images of the SPSI dataset after preprocessing. Firstly, this study aimed to localize soiling on the surface of solar panels and generate a dataset of solar panel soiling images. Of the total 45,754 images in the SPSI dataset, 16,564 clean-type panel images were excluded. Ultimately, 29,190 images of solar panel soiling images remained. Next, we cropped only the solar panel area from the image in the SPSI dataset, excluding the background part. The cropped size of the image was 127 × 131. Figure 4a shows an example of preprocessed SPSI dataset images. Lastly, we created the ground truth necessary for training the segmentation model. Since the SPSI dataset does not provide annotated images, we manually annotated the area of soiling in each image. Annotation was performed by manually specifying the area corresponding to soiling using the annotation tool LabelMe [18], then setting the area selected as soiled to white and the non-soiled area to black to generate the ground truth corresponding to the image. Figure 4b shows the generated ground truth corresponding to Figure 4a solar panel soiling images. The preprocessed SPSI dataset consists of 29,190 solar panel soiling images. The size of all images in the SPSI dataset is 127 × 131, with a ground truth corresponding to each image.

3.4. Dataset Augmentation

3.4.1. Naïve Dataset Augmentation

The Naïve dataset augmentation stage involved creating a new solar panel soiling image based on the Copy-Paste method. The Naïve dataset augmentation stage is divided mainly into the data augmentation stage and the combination with the new panel. We augmented the solar panel soiling image to secure images of various types of soiling. First, we selected 84 images with unique soiling shapes from the SPSI dataset. Figure 5 shows representative images among the 84 selected images. The SPSI dataset contains many panel images with similar soiling shapes. Because Mehta et al. [1] collected images at 5 s intervals, the shape of the soiling remains unchanged. Therefore, we checked all panel images in the SPSI dataset, judged when the color of the soiling changed, when the area occupying the panel changed, or when the shape of the soiling changed, and removed all similar soiling, leaving only 84 images.
Next, various data augmentation methods were applied to the selected 84 images to secure various shapes of soiling. We generated a new shape of the soiling image through rotation, flipping, and resizing. In the case of image rotation, we selected a random value between 0° and 360° and rotated the image clockwise by the selected value. The image was flipped up and down or left and right in image flipping. At this time, we randomly determined whether or not there was a reversal. All options were possible: up, down, left and right flipping, only left and right flipping, only up and down flipping, and remaining with no flipping. We resized the image differently depending on the soiling covered on the panel surface. If soiling took up most of the solar panel, we resized the image to a random value between 1.2 and 2.0 times the original image. On the other hand, if the soiling only covered a portion of the solar panel, the image was resized to a random value between 0.5 and 1.5 times the original image. If the size of the adjusted image was smaller than the size of the existing image, we padded the adjusted image with gray pixel values equal to the size of the existing image. On the other hand, if the size of the adjusted image was larger than the size of the existing image, we only cropped the size of the existing image from the upper left corner of the adjusted image. We maintained the existing image size to eventually adjust the image size of the Naïve dataset to 127 × 131. We randomly applied the rotation, flip, and resize described above 50 times to all 84 selected images. We simultaneously applied data augmentation methods to the ground truth image as the corresponding soiling image.
We generated a Naïve dataset containing different types of panels and different shapes of soiling by applying the Copy-Paste method to solar panel images. Figure 6 shows the process of generating a Naïve dataset by applying the Copy-Paste method. We used the augmented soiling images and the ground truth image corresponding to this image. We only cut out the area corresponding to soiling in the ground truth image from the soiling image. At this time, we converted the remaining area of the panel, excluding the soiling area, as transparent. Afterward, we pasted the cropped soiling areas onto the ten new panel background images. In other words, we pasted one augmented soiling image onto ten different panel types, generating ten new solar panel soiling images.
Table 1 shows the statistics of the generated Naïve dataset. The images that comprise the generated Naïve dataset are as follows. The first step comprised 84 images with unique soiling shapes selected from the SPSI dataset. The second was an image generated by pasting the 84 selected images to a different type of panel background without applying data augmentation methods. Among the collected new panel background images, panel 10 is a clean panel image that exists in the SPSI dataset. Hence, we utilized only the remaining nine panels, excluding panel 10, when creating a new panel image without employing the data augmentation method. The number of panel images corresponding to this is 84 9 = 756 . The last step is an image in which we pasted soiling images that apply data augmentation methods onto ten types of panels. We repeated this process 50 times. The number of panel images corresponding to this is 84 50 10 = 42,000 . Finally, the number of all solar panel soiling images in the Naïve dataset was 42,840, and the size of all images was 127 × 131.
Figure 7a shows examples of Naïve dataset images. As shown in Figure 7a, the Naïve dataset contains various solar panel backgrounds and soiling shapes. Figure 7b shows the ground truth corresponding to Figure 7a panel images of the Naïve dataset.
Figure 8 shows the problem with the Naïve dataset. As seen in the highlighted part, the Naïve dataset simply copies and pastes the area of soiling, so the background of the existing panel pattern is copied together, creating visual artifacts. Visual artifacts can adversely affect the training of a segmentation-based model for localizing solar panel surface soiling. Therefore, we must generate a dataset of solar panel soiling images without visual artifacts.

3.4.2. Realistic Dataset Augmentation

We generated the Realistic dataset by applying Pix2Pix, a GAN-based image generative model [19] that can accurately generate soiling in the area corresponding to soiling in ground truth and can be trained even with a small amount of data. Figure 9 shows the process of training Pix2Pix to generate solar panel soiling images. The goal of generating a Realistic dataset was to generate solar panel soiling images without visual artifacts. Therefore, we excluded all images with visual artifact problems from the Naïve dataset. Then, we trained the Pix2Pix model using some of the excluded images. We trained the Pix2Pix model using only about 7000 panel images out of the 42,840 images in the Naïve dataset. Here, we divided the training dataset based on panel type and soiling color to ensure that all conditions are equal for the Naïve dataset generated based on the Copy-Paste method and the Realistic dataset generated based on Pix2Pix. There was a total of ten types of panel, and since soiling in the Naïve dataset was primarily divided into brown and white soiling, it was split into 20 training datasets. Using the prepared 20 training datasets, we individually trained Pix2Pix models to obtain 20 trained generative models. Subsequently, we also categorized all ground truth data of the Naïve dataset into 20 classifications based on the same criteria for dividing the training dataset—panel type and soiling color. The ground truth of all divided Naïve datasets was input into a generation model that matched the classification criteria to generate a new solar panel soiling image.
Figure 10 is a comparison between the Naïve dataset and the Realistic dataset. As shown in Figure 10, the Realistic dataset effectively addresses the visual artifacts from the Naïve dataset by generating soiling for all panel images that the background panel pattern copied together. Additionally, since all conditions of the Naïve and Realistic dataset were set identically, the image size of the Realistic dataset was 127 × 131, with a total of 42,840 images.
The Realistic dataset effectively solved the visual artifacts of the Naïve dataset, but it did not include translucent soiling that frequently occurs in actual solar power plants. Translucent soiling is mainly created when the soiling particles are tiny (e.g., sand, pollen, fine dust). This soiling does not completely cover the solar panels if the amount deposited on the panels is small. Therefore, the panel pattern behind the soiling is visible along with the soiling. It is essential to identify areas of translucent soiling because, like thick soiling, such translucent soiling can reduce solar power generation. The segmentation model training dataset must contain panel images with translucent soiling to achieve this. So, we calculated the transparency of soiling and applied it to the Realistic dataset to generate a dataset containing translucent soiling.

3.4.3. Translucent Dataset Augmentation

The Translucent dataset was generated by unifying the Pix2Pix model and the Copy-Paste method that generated the Realistic dataset and Naïve dataset. To generate a Translucent dataset, a transparency mask containing transparency information about soiling in the panel image was required. We created the transparency mask only for the 84 SPSI panel images selected when applying data augmentation. Equation (1) is the formula for obtaining the transparency mask. In Equation (1), M t represents the transparency mask, x s o i l i n g and x c l e a n denote the soiling and clean images of the same solar panel, respectively, n o r m · is the min-max normalization function, f · is the Gaussian blur filter, and represents the RGB distance calculation operator. The main idea of creating a transparency mask was to calculate the RGB distance between clean and soiled panels. RGB distance measures the color difference between two images by calculating the Euclidean distance of each pixel in the RGB color space. When calculating the RGB distance between existing contaminants and a clean panel image, the border color between panel cells is white, which introduces some noise.
M t = n o r m f x s o i l i n g f x c l e a n 255
In Figure 11, we first used a blur filter on the dirty and clean panel images. We then calculated the RGB distance between the blurry clean panel and the blurry dirty panel. Afterward, to maintain only the RGB distance of the area corresponding to soiling, the RGB distance of the part corresponding to the panel area in the ground truth image was initialized to 0. Next, we normalized the RGB distance calculated for the entire image to a value between 0 and 1 through min–max normalization. The closer the RGB distance is to 0, the more transparent the soiling is; the closer it is to 1, the thicker the soiling. Then, we multiplied this normalized RGB distance by 255 to make all pixel values between 0 and 255. The RGB distance that has gone through all the preceding processes was added as the alpha channel (a channel representing transparency; the closer to 0, the more transparent it is) of the ground truth corresponding to each soiling. The ground truth image with the alpha channel added was the transparency mask.
Figure 12 shows the soiling image and the corresponding ground truth and transparency mask. As can be seen in Figure 12c, the more transparent the soiling, the more transparent the transparency mask appears.
Figure 13 shows the process of generating the Translucent dataset by unifying Copy-Paste, Pix2Pix, and transparency mask. First, data augmentation was performed on the ground truth and transparency mask corresponding to the selected 84 soiling images 50 times for each image. The augmented ground truth was given as input to the Pix2Pix generative model trained. The generative model generated solar panel soiling images corresponding to all incoming augmented ground truth. A transparency mask image was infused into the final solar panel image to make soiling transparent. Finally, we pasted the translucent soiling image into new panel background images. Through this, we could obtain a solar panel soiling image dataset with various panel backgrounds, shapes of soiling, and translucent soiling images. Finally, the generated Translucent dataset matched all conditions with the Naïve and Realistic datasets because we applied data augmentation under the same conditions as when generating the Naïve dataset.
Figure 14 is an example of the generated Translucent dataset. The Translucent dataset solved the problem of visual artifacts in the Naïve dataset and the absence of translucent soiling in the Realistic dataset.

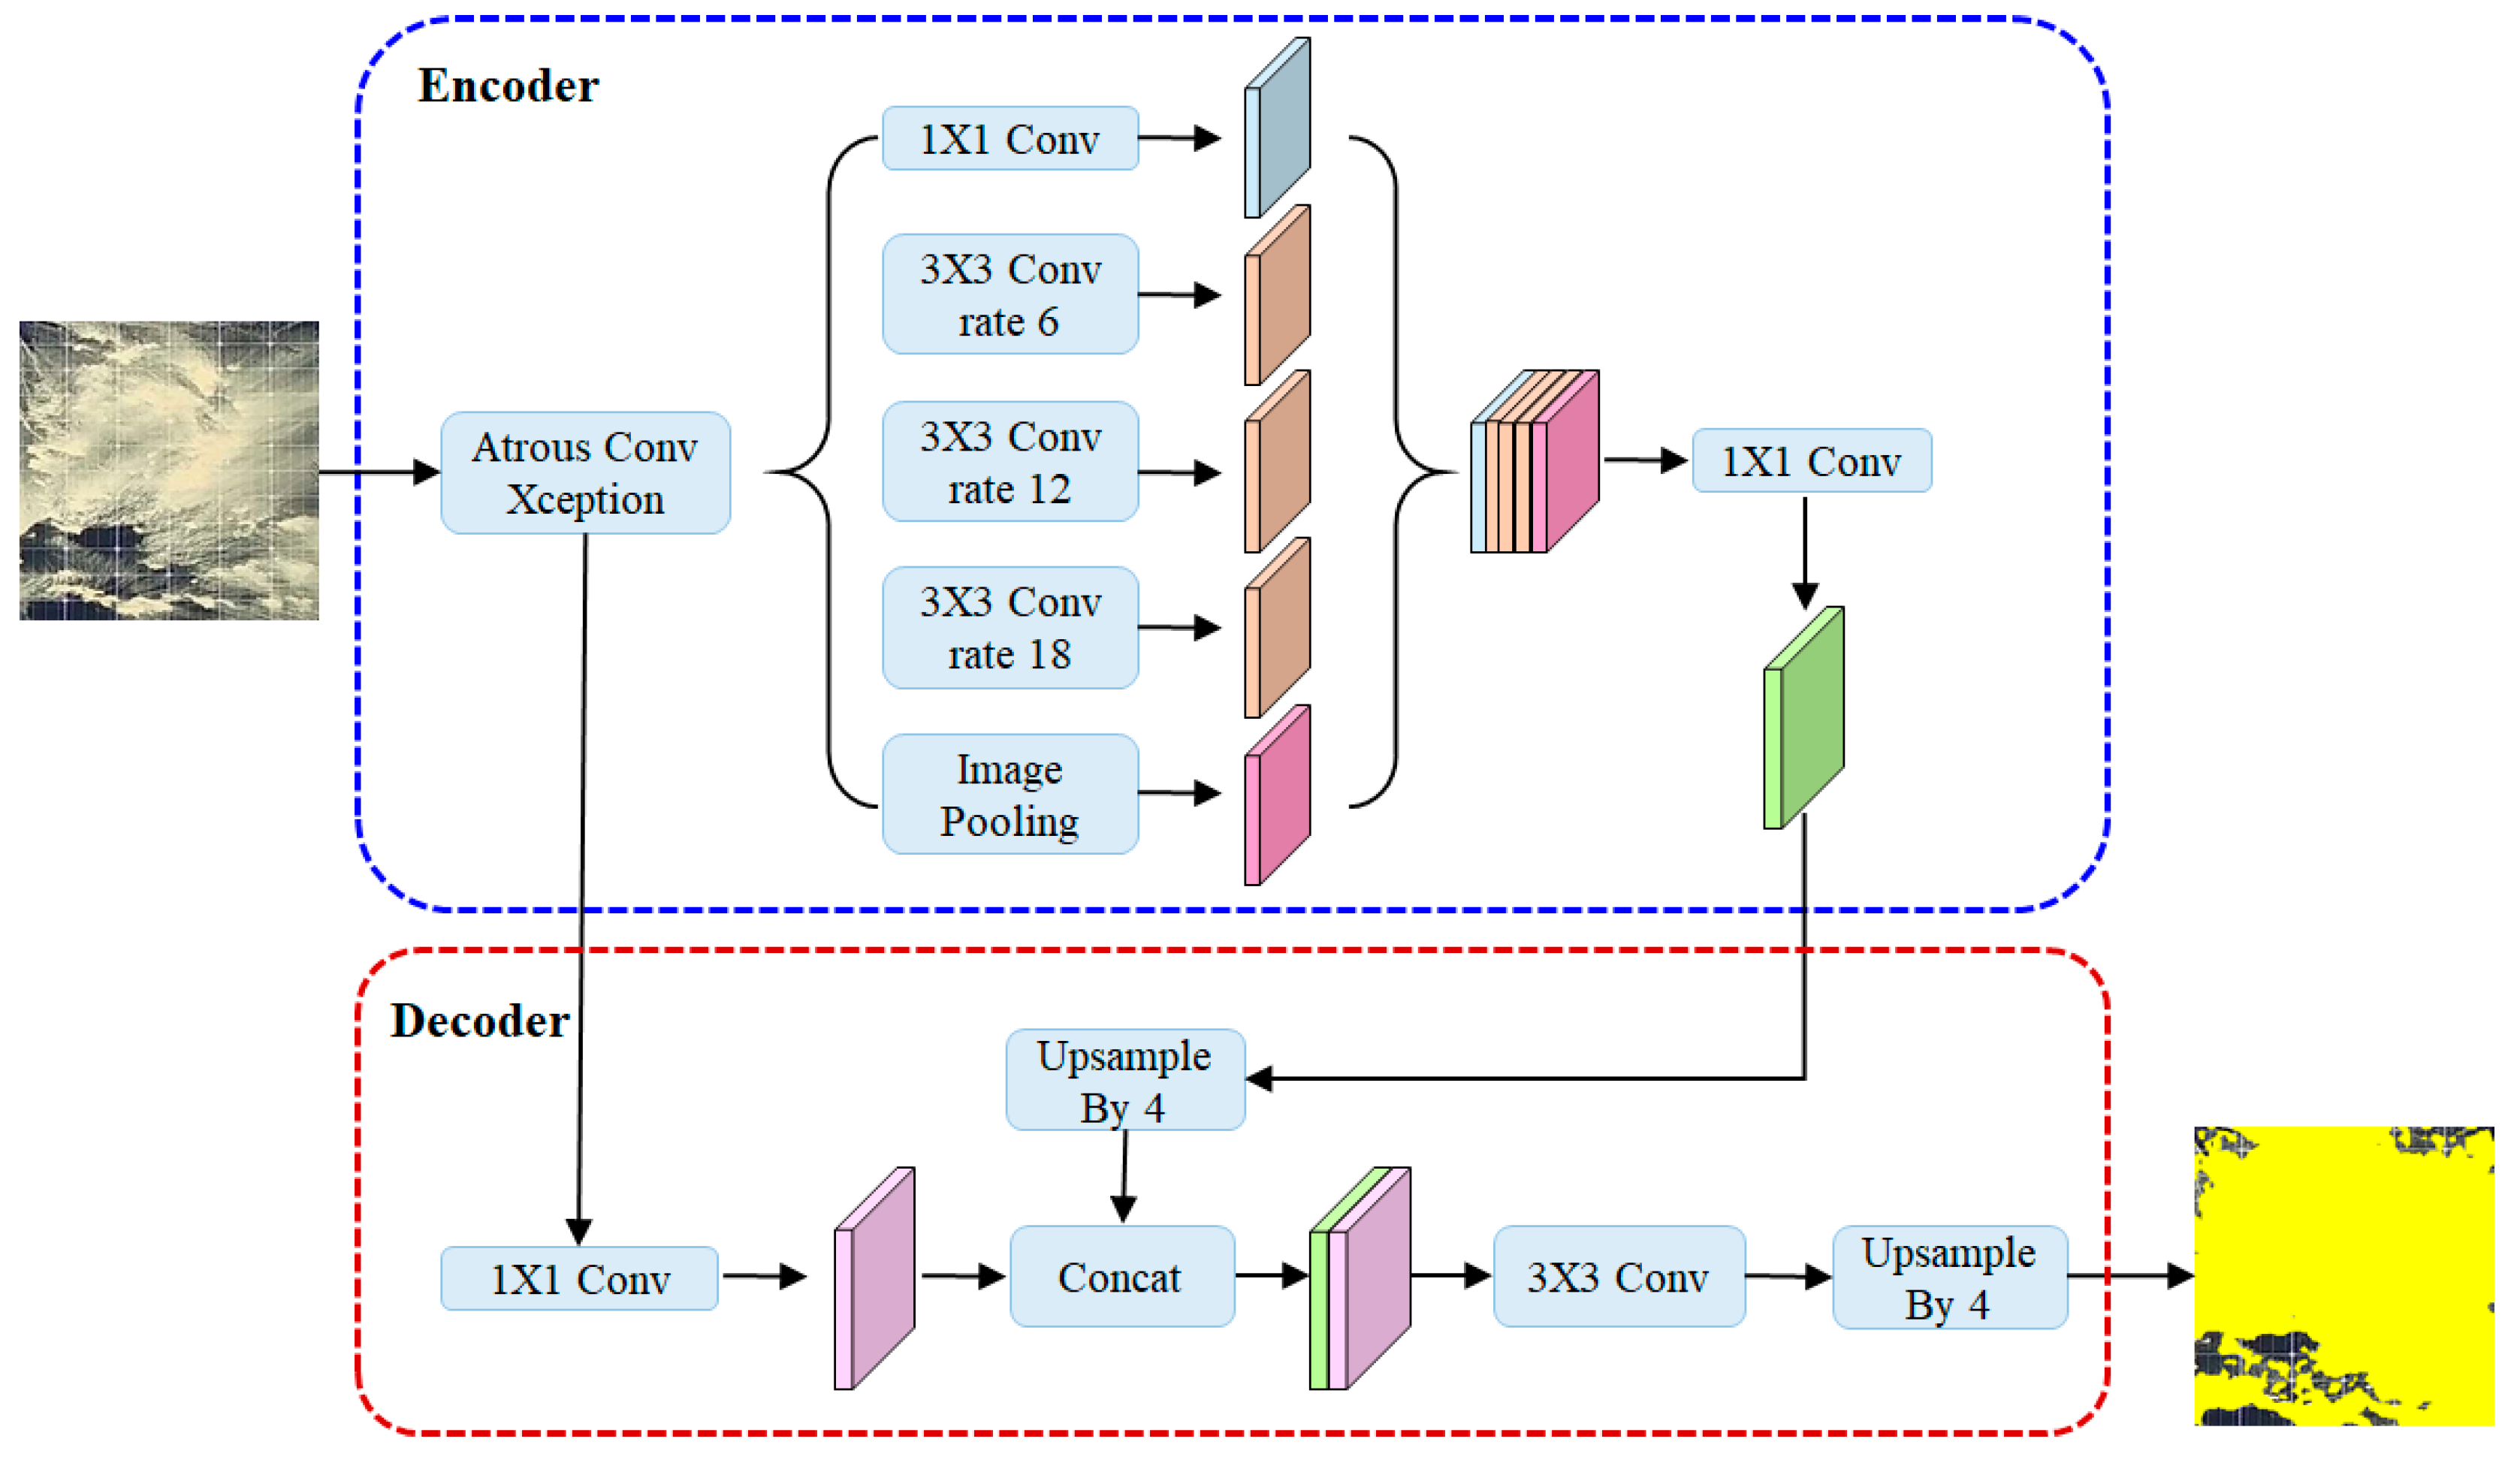
3.5. Soiling Localization

This section uses a segmentation model to compare the usefulness and soiling localization performance of the three previously generated datasets (Naïve, Realistic, and Translucent). We used DeepLabV3+ as a segmentation model to verify its usefulness. Figure 15 shows the structure of DeepLabV3+ used in the experiment. We used DeepLabV3+, which has an Encoder-Decoder structure, and performed Atrous convolution three times, with the space inside the filter set to 6, 12, and 18, respectively [15,20,21]. One feature map is obtained by combining the feature maps derived from the original image through 1X1 convolution, image pooling, and Atrous convolution. Finally, in the decoder part, we upsampled the feature map to localize soiling on the solar panel surface. We excluded flip, resize, and Gaussian blur when loading training data from the existing DeepLabV3+ model to evaluate the usefulness of the newly generated datasets purely. The trained DeepLabV3+ model received solar panel soiling test images for comparison as input and localized soiling on the panel surface. The test images used in the experiment were collected from an actual solar power plant and were not included in any datasets for model training. Based on the experimental results, we compared soiling localization performance and verified the usefulness of each dataset.

4. Results

4.1. Implementation Detail

We used DeepLabV3+, a representative deep learning-based segmentation model, to compare the usefulness of datasets generated through the integrated image generation framework proposed in this study. Table 2 shows the backbone, optimizer, learning rate, epoch, and batch size of DeepLabV3+ used in the experiment. In this experiment, we prepared four trained segmentation models using four datasets (SPSI, Naïve, Realistic, and Translucent). Detailed descriptions of these four datasets are provided in Appendix B. We divided all datasets into 70% training, 20% validation, and 10% test data. Table 3 shows the number of training, validation, and test data images when training the segmentation model using all datasets.

4.2. Performance Evaluation Metric

We quantitatively evaluated the performance of the segmentation model trained for each dataset using the Jaccard Index. The Jaccard Index is an index that measures the similarity between two sets. In this experiment, we measured the similarity between the ground truth and the predicted image obtained through segmentation. Let Y X denote the set of ground truth images for dataset X , and P X denote the set of predicted images for dataset X . Then, the Jaccard Index J Y X ,   P X is defined according to Equation (2) as the intersection of the two sets divided by their union. The Jaccard Index is expressed as a value between 0 and 1, and in this experiment, we multiplied this value by 100 to compare the performance of each segmentation model as a percentage.
J Y X ,   P X = Y X P X Y X P X

4.3. Experimental Results

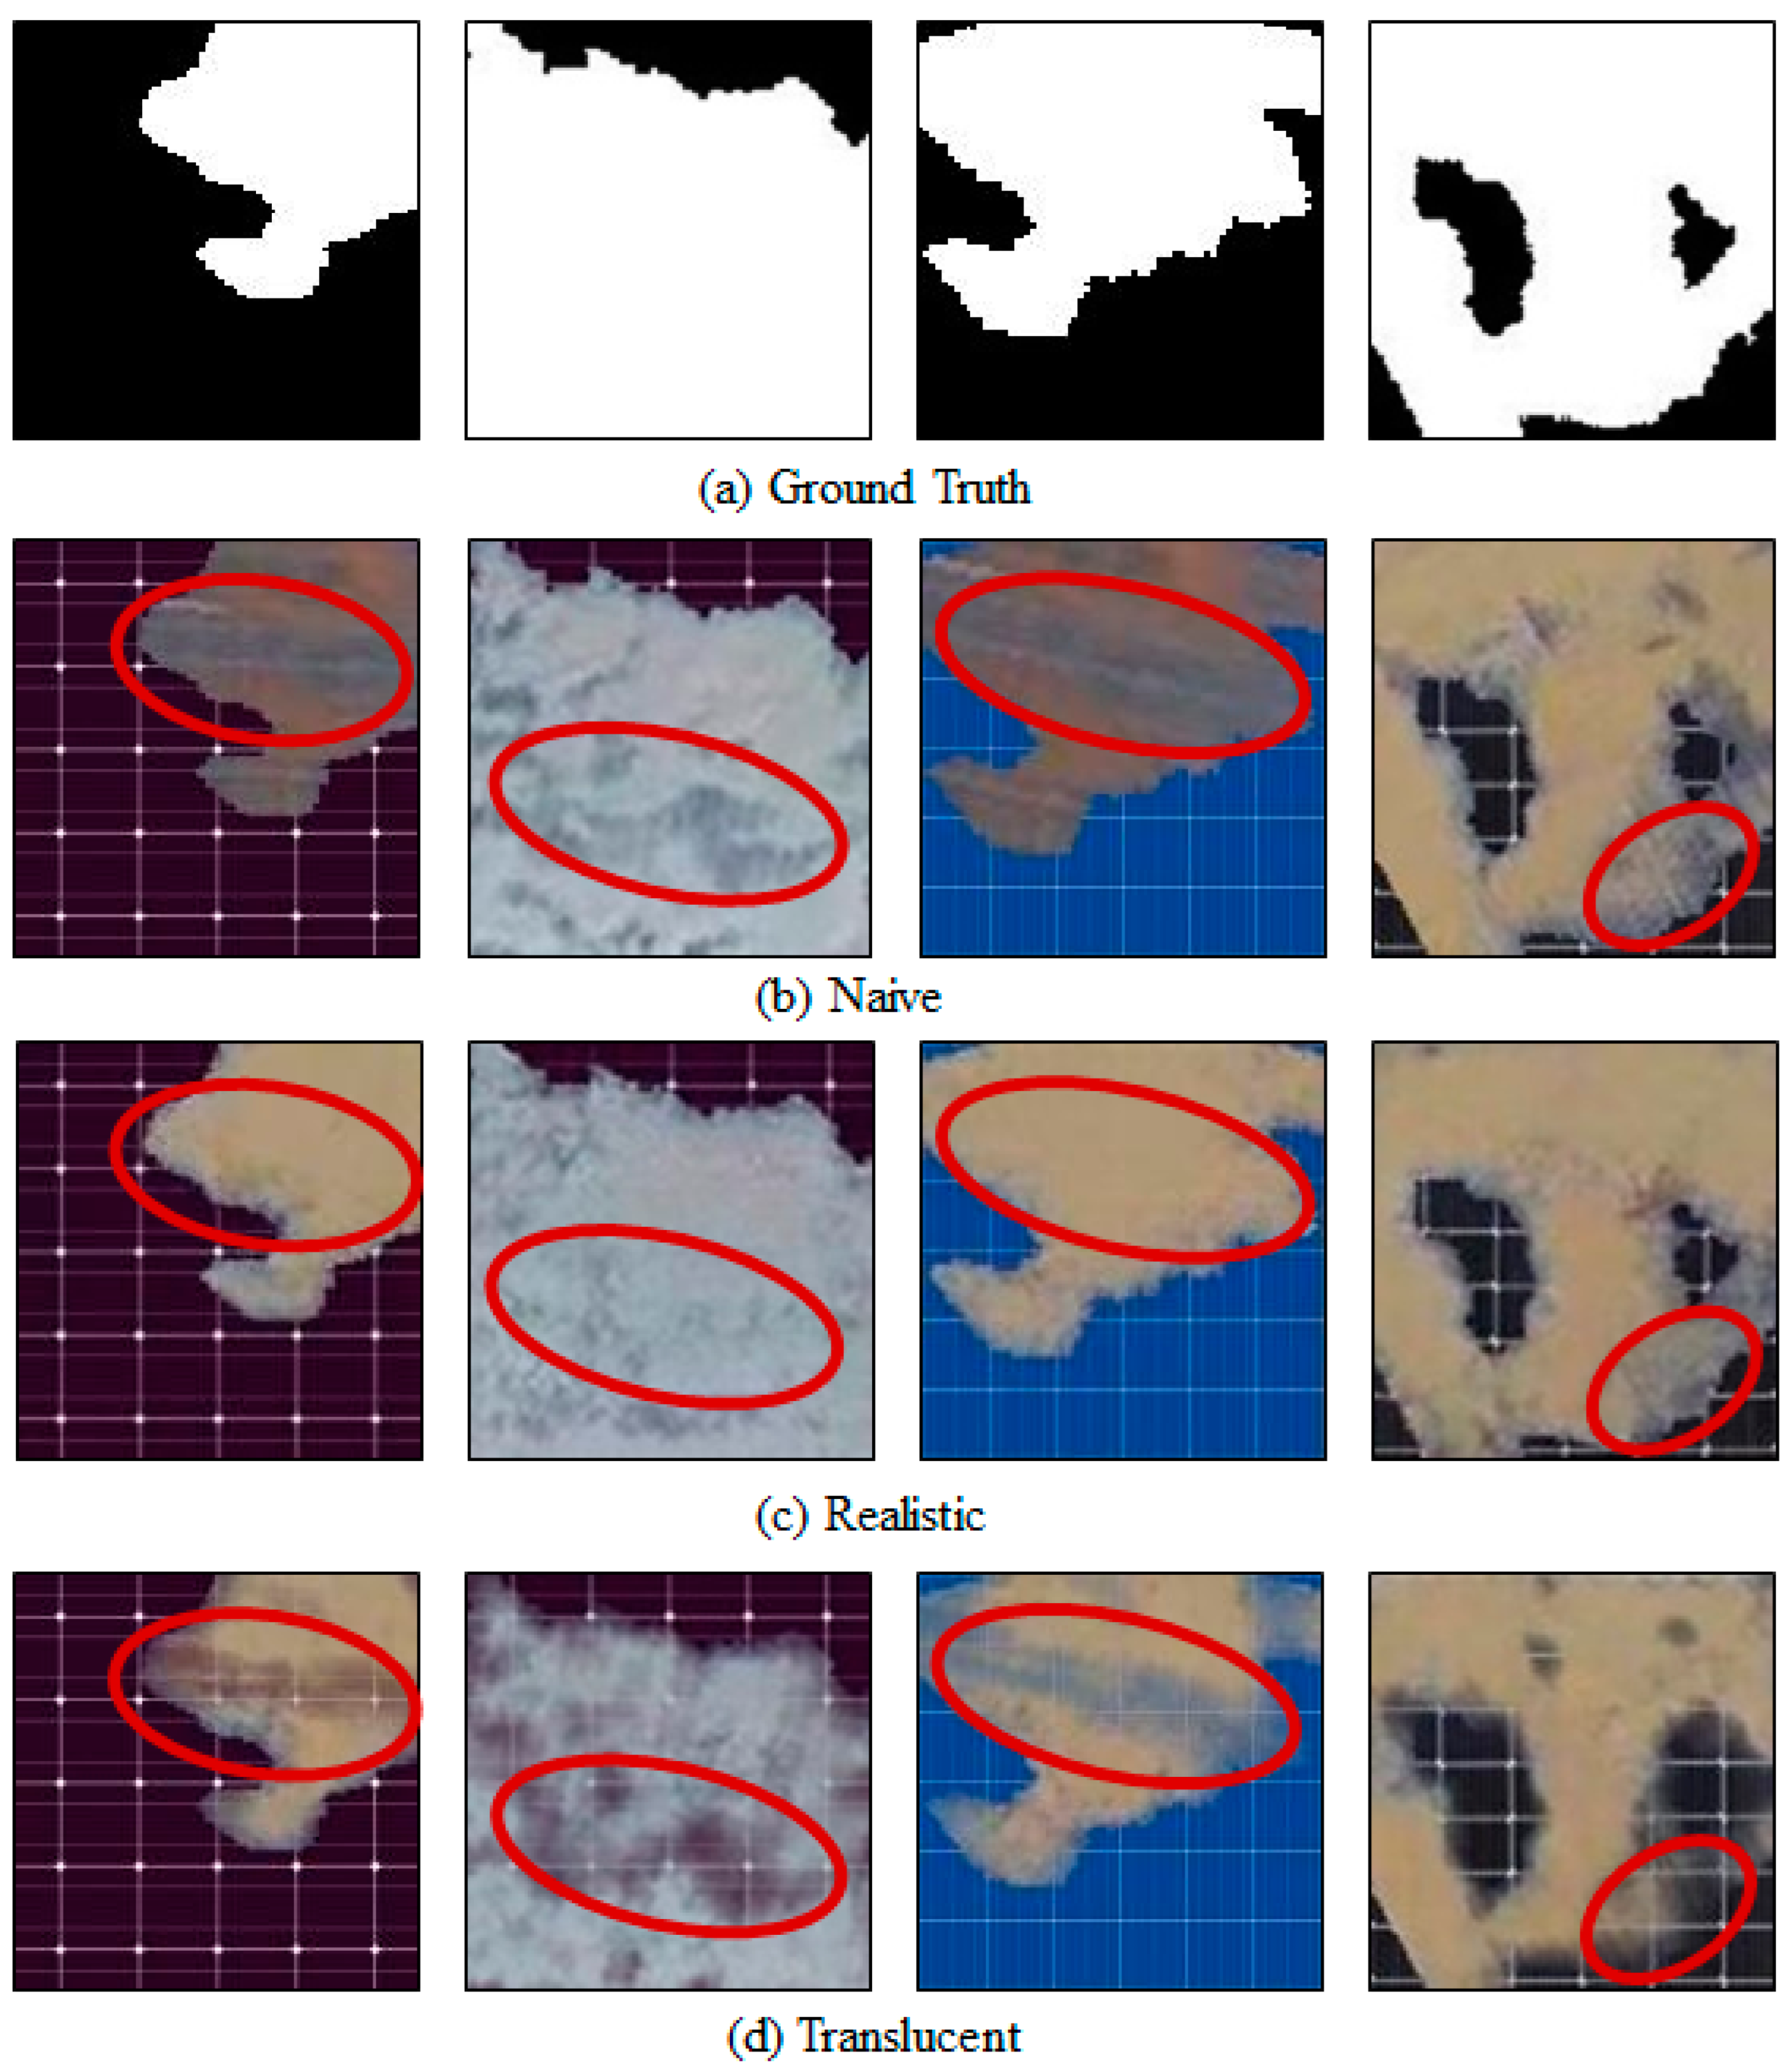
4.3.1. Qualitative Analysis

In this section, we qualitatively analyze the performance of four different segmentation models trained using the previously trained datasets (SPSI, Naïve, Realistic, and Translucent). Figure 16 shows the experimental results on actual solar panels with translucent soiling. Figure 16a is an actual solar panel image with translucent soiling that was input to the model trained with each dataset, and Figure 16b is the ground truth corresponding to the panel image in Figure 16a. Figure 16c–f are the results predicted when the model trained with SPSI, Naïve, Realistic, and Translucent datasets received the images in Figure 16a as the input, respectively. As shown in Figure 16c, the segmentation model trained with SPSI incorrectly recognizes the boundaries between panels as soiling. On the other hand, as shown in Figure 16d–f, the segmentation model trained with the Naïve, Realistic, and Translucent datasets generated through a proposed method only localizes areas of soiling accurately. In Figure 16f, the segmentation model trained using the Translucent dataset localizes the location and extent of soiling more precisely and accurately than when trained with other datasets (Figure 16c–e). Through Figure 16, we confirmed that the accuracy of localizing the location and extent of soiling of the segmentation model learned using the Translucent dataset was greater than that of the models trained using other datasets.

4.3.2. Quantitative Analysis

We evaluated the performance quantitatively using the performance evaluation index, the Jaccard Index. Figure 17 shows the Jaccard Index for each segmentation model. The Jaccard Index was highest at 61.36% when trained using the Translucent dataset. This result is a 14.59% increase compared to training using only the existing SPSI dataset. In the Jaccard Index results, the segmentation model trained using the Realistic dataset, which solved the visual artifacts problem of the Naïve dataset, had an accuracy that was about 0.87% below the model trained using the Naïve dataset. The reason is that translucent soiling does not exist in the Realistic dataset, so the performance on test images containing much translucent soiling was expected to be worse than that of the Naïve dataset.

5. Discussions and Conclusions

This study proposed a unified image generative data augmentation to address the imbalance problem of the SPSI datasets. Three new datasets (Naïve, Realistic, and Translucent) generated through the proposed method solved the existing SPSI dataset’s imbalance problem. In addition, we confirmed that the accuracy of soiling segmentation performance of the segmentation models trained using the newly generated dataset increased compared to the segmentation model trained using only the SPSI dataset. The Translucent dataset solved the imbalance problem of the SPSI dataset, the visual artifacts problem of the Naïve dataset, and the non-existent translucent soiling problem of the Realistic dataset. The Jaccard Index of the segmentation model trained using the Translucent dataset increased by 14.59% compared to the Jaccard Index of the segmentation model trained using the SPSI dataset. The Translucent dataset generated in this study is the first solar panel soiling image dataset that includes translucent soiling, as well as various types of panels and various shapes of soiling.
The main limitation of this study is that it relied on one type of dataset (i.e., SPSI). However, we believe that it also highlights why the proposed study is important. It is important to note that creating this type of dataset takes significant time and cost, which makes it hard to produce varied datasets for comparison. For example, the SPSI dataset includes 45,754 images captured every 5 s over about a month. With the data augmentation techniques proposed in this study, we addressed limitations of the SPSI data, including the dataset’s lack of diversity in panel types and unique soiling shapes, which helped improve model performance in terms of soiling localization. We believe that this enhanced dataset can be a valuable resource for researchers and can lead to better soiling localization and innovations in solar energy efficiency. To promote further research in this area, we have made the Translucent dataset generated by utilizing the proposed data augmentation method publicly available at https://translucentdata.github.io/Tanslucentdata.github.io/ (accessed on 18 July 2024).
The results of this study are important not only for soiling localization but also for broader applications. Generally, soiling on solar panels depends on several factors, including environmental properties like wind patterns, rainfall, and seasonal dust accumulation, as well as the surface properties of the glass panels such as the texture and coatings. Recent studies [22,23] have demonstrated that materials like cerium (Ce)-based halide perovskite compounds and chemically doping graphene with iron (III) chloride can be used to build high-efficiency solar panels. These advancements in material science can further improve solar panel design and installation. For example, by understanding soiling patterns, manufacturers can design surfaces of glass panels that reduce dust buildup or enable natural cleaning. Additionally, insights into soiling patterns can help determine optimal installation angles to reduce soiling accumulation and improve the power output over time. Lastly, the implications of the proposed study can contribute to better soiling management and cleaning methods, allowing maintenance teams to more accurately predict and locate soiling, reducing cleaning costs and enhancing solar energy production.
Building on our success in generating a balanced dataset with the unified image generative data augmentation method, we highlight several directions for future work. First, we plan to select the soiling area identified through the soiling segmentation model as a feature for predicting solar power generation, demonstrating that localizing the soiling area is crucial to predicting solar power generation. Second, we plan to explore methods to quantify soiling thickness or density, potentially incorporating transparency, to better reflect the actual soiling amount on the panel surface. Third, we plan to explore methods to consider the dynamic environmental factors like raindrops and their impact on soiling to improve the model’s performance in varying weather conditions. Lastly, we aim to expand the proposed method to propose data augmentation methods that can be applied not only in the solar panel domain but also in diverse fields, such as autonomous vehicles or medical imaging and diagnostics.

Author Contributions

Conceptualization, S.-E.G. and A.N.; methodology, S.-E.G., J.-H.K., and A.N.; data curation, S.-E.G. and W.-S.C.; writing—original draft preparation, S.-E.G.; writing—review and editing, T.C., J.-H.K., and A.N.; supervision, S.-H.C. and A.N.; funding acquisition, S.-H.C. and A.N. All authors have read and agreed to the published version of the manuscript.

Funding

This research was supported by the Basic Science Research Program through the National Research Foundation of Korea (NRF) funded by the Ministry of Education (Grant No. RS-2023-00243738). This research also was supported by the Institute of Information & Communications Technology Planning & Evaluation (IITP) grant funded by the Korean government (MSIT) (No. 2021010749).

Data Availability Statement

The Translucent dataset is available at https://translucentdata.github.io/Tanslucentdata.github.io (accessed on 18 July 2024).

Acknowledgments

This paper presents findings from Seung-Eun Go’s master’s thesis, completed as part of her graduation requirements at Chungbuk National University.

Conflicts of Interest

Seung-Eun Go was employed by CUBIG company. The remaining authors declare that the research was conducted in the absence of any commercial or financial relationships that could be construed as a potential conflict of interest.

Appendix A

We collected 100 solar panel images in the experiment to check the performance of four segmentation models trained with each dataset. We installed solar panels on the rooftop of Chungbuk National University’s College of Business to collect images of solar panels for experiments. We collected panel images by directly creating soiling on the surface of the solar panels. We collected the test dataset weekly from 22 March 2023 to 1 May 2023 during the morning (9:00–10:00), afternoon (13:30–15:00), and evening (16:30–18:00). The shape of the soiling changed every 3 min. We collected solar panel images at 1 min intervals during the experiment. Figure A1 shows the experimental environment used to collect solar panel images for testing. We preprocessed the images collected through experiments to suit the trained segmentation model. The collected data were processed in the same way as the SPSI dataset preprocessing. First, only the panel area was cropped from the entire collected image.
Figure A1. Solar panel soiling image collection experiment environment.
Electronics 13 04859 g0a1
As shown in Figure A1, there are four panels, so we could obtain four solar panel soiling images from one experimental image. After that, since ground truth was needed to compare performance, we annotated manually using the annotation tool CVAT [24]. Since we aimed to compare the localization performance for translucent soiling, we selected 100 images with translucent soiling among the preprocessed test solar panel soiling images to create a test set for the segmentation model.

Appendix B

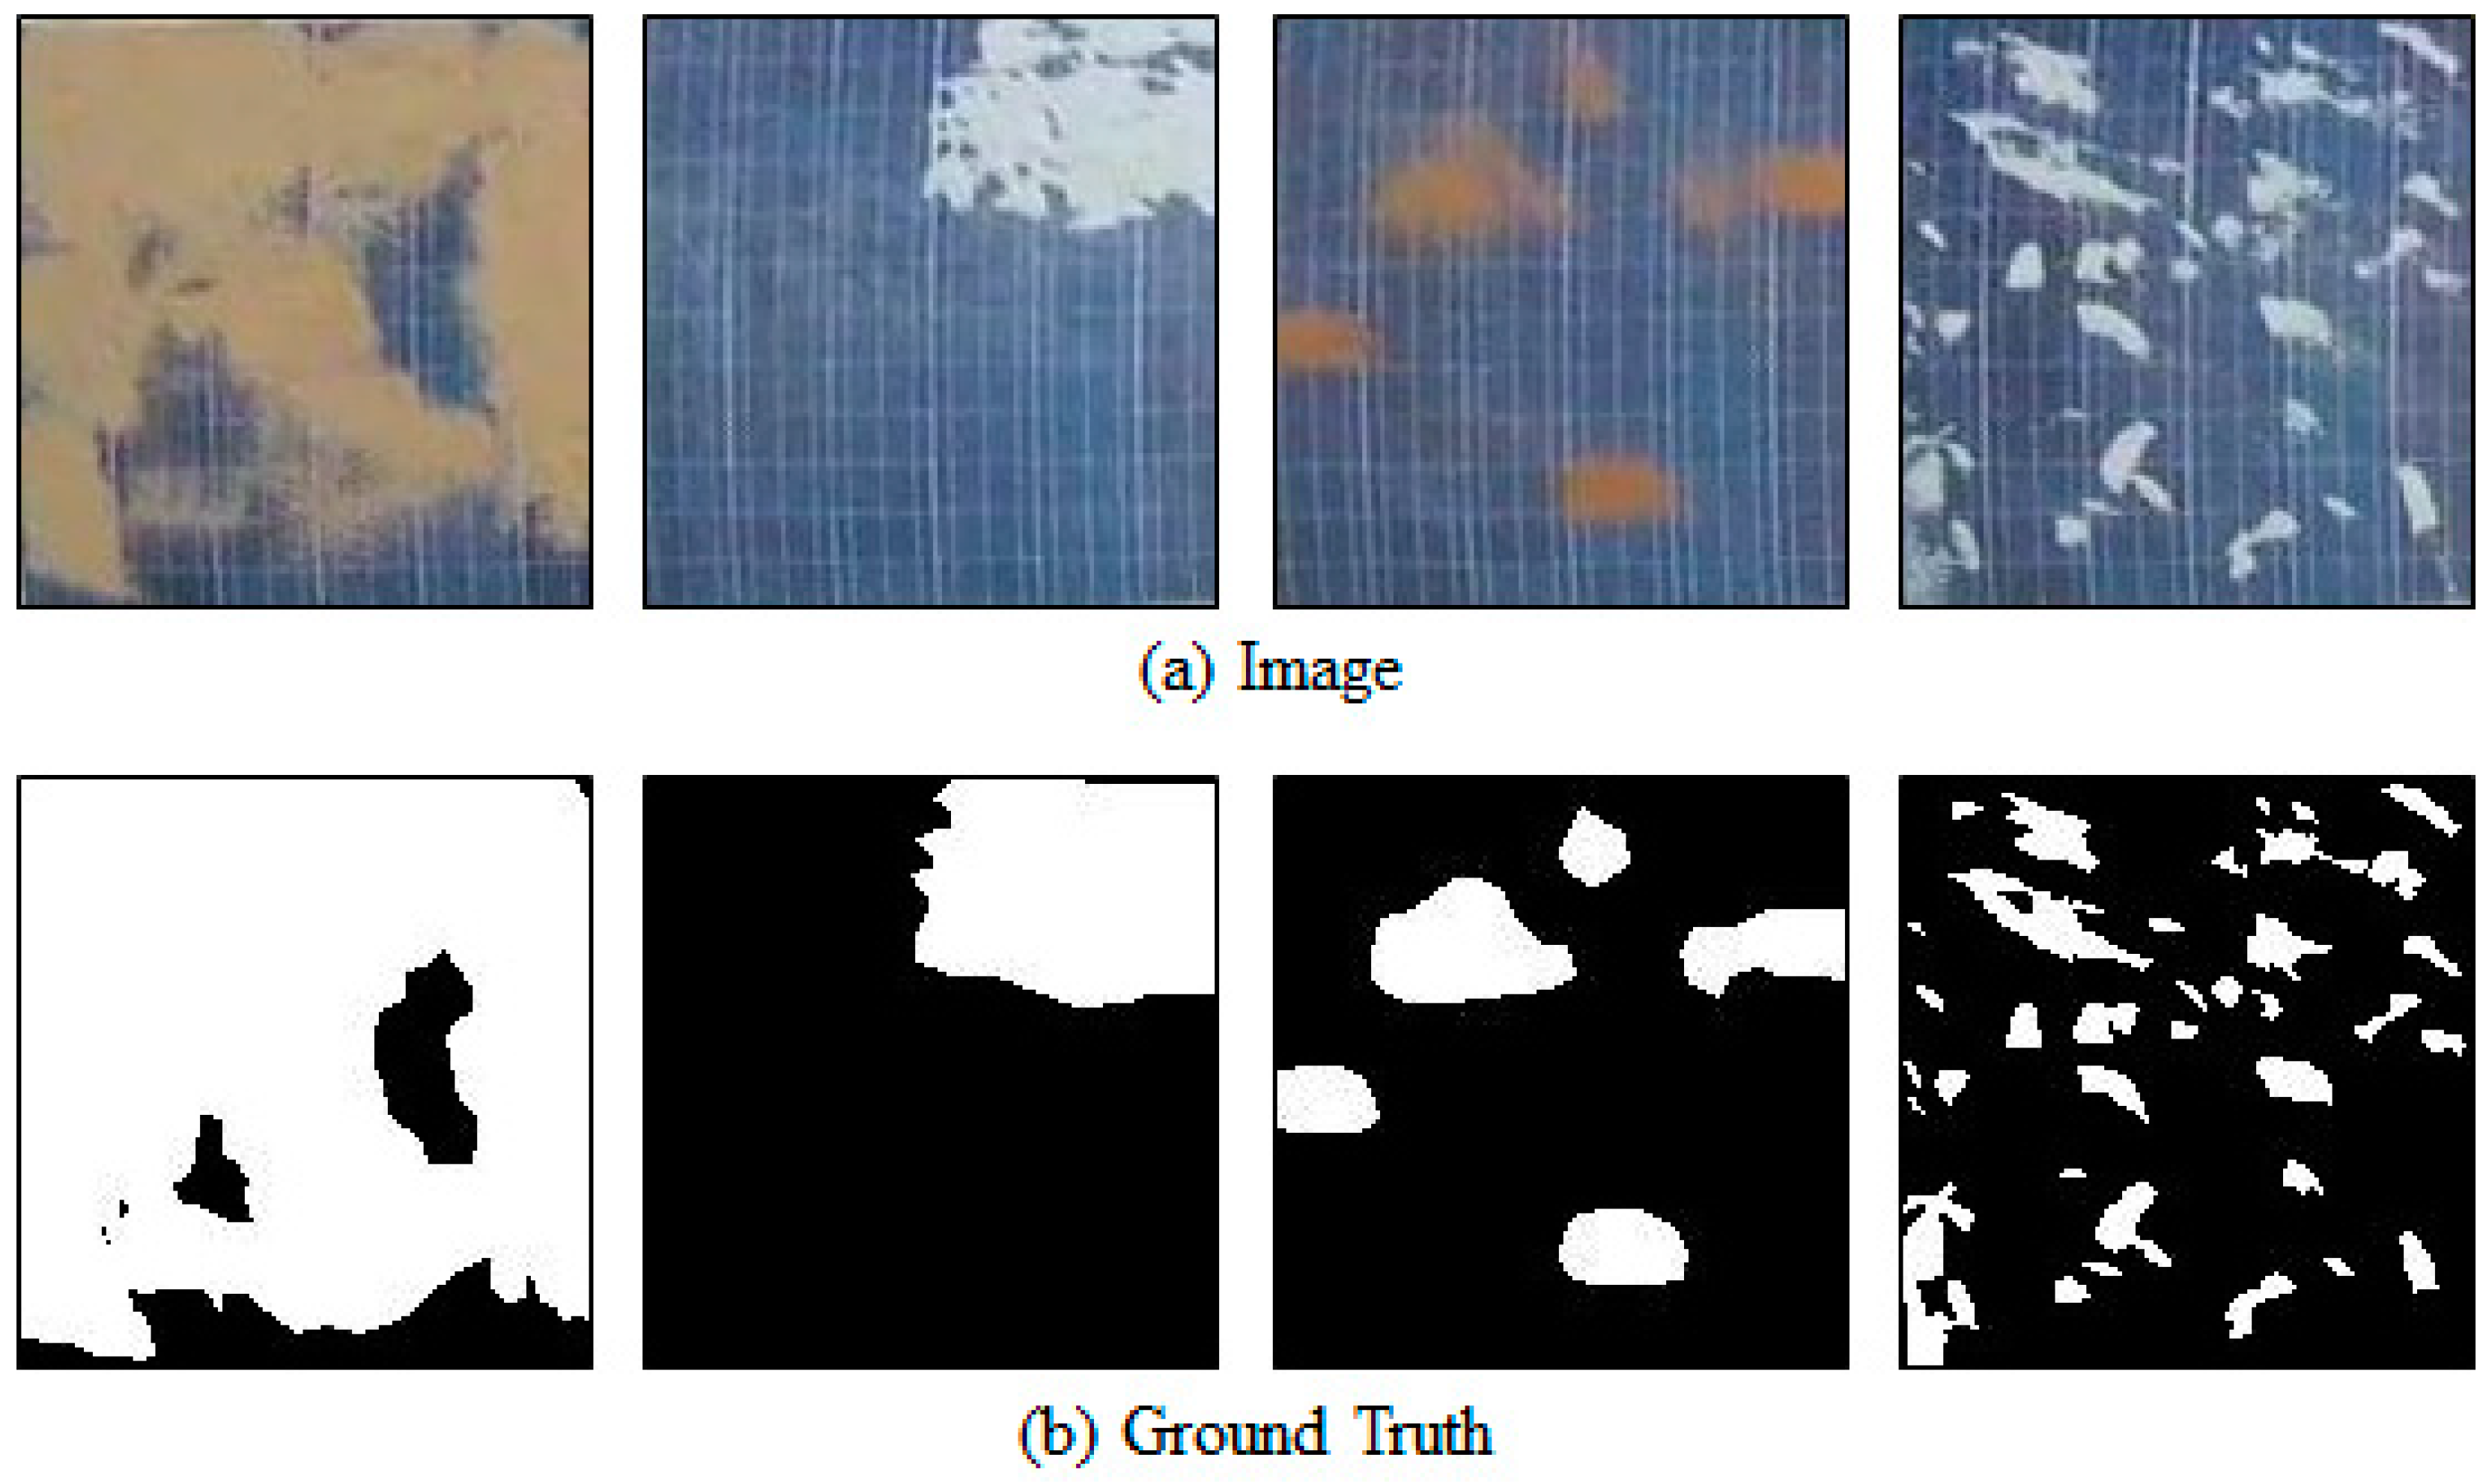
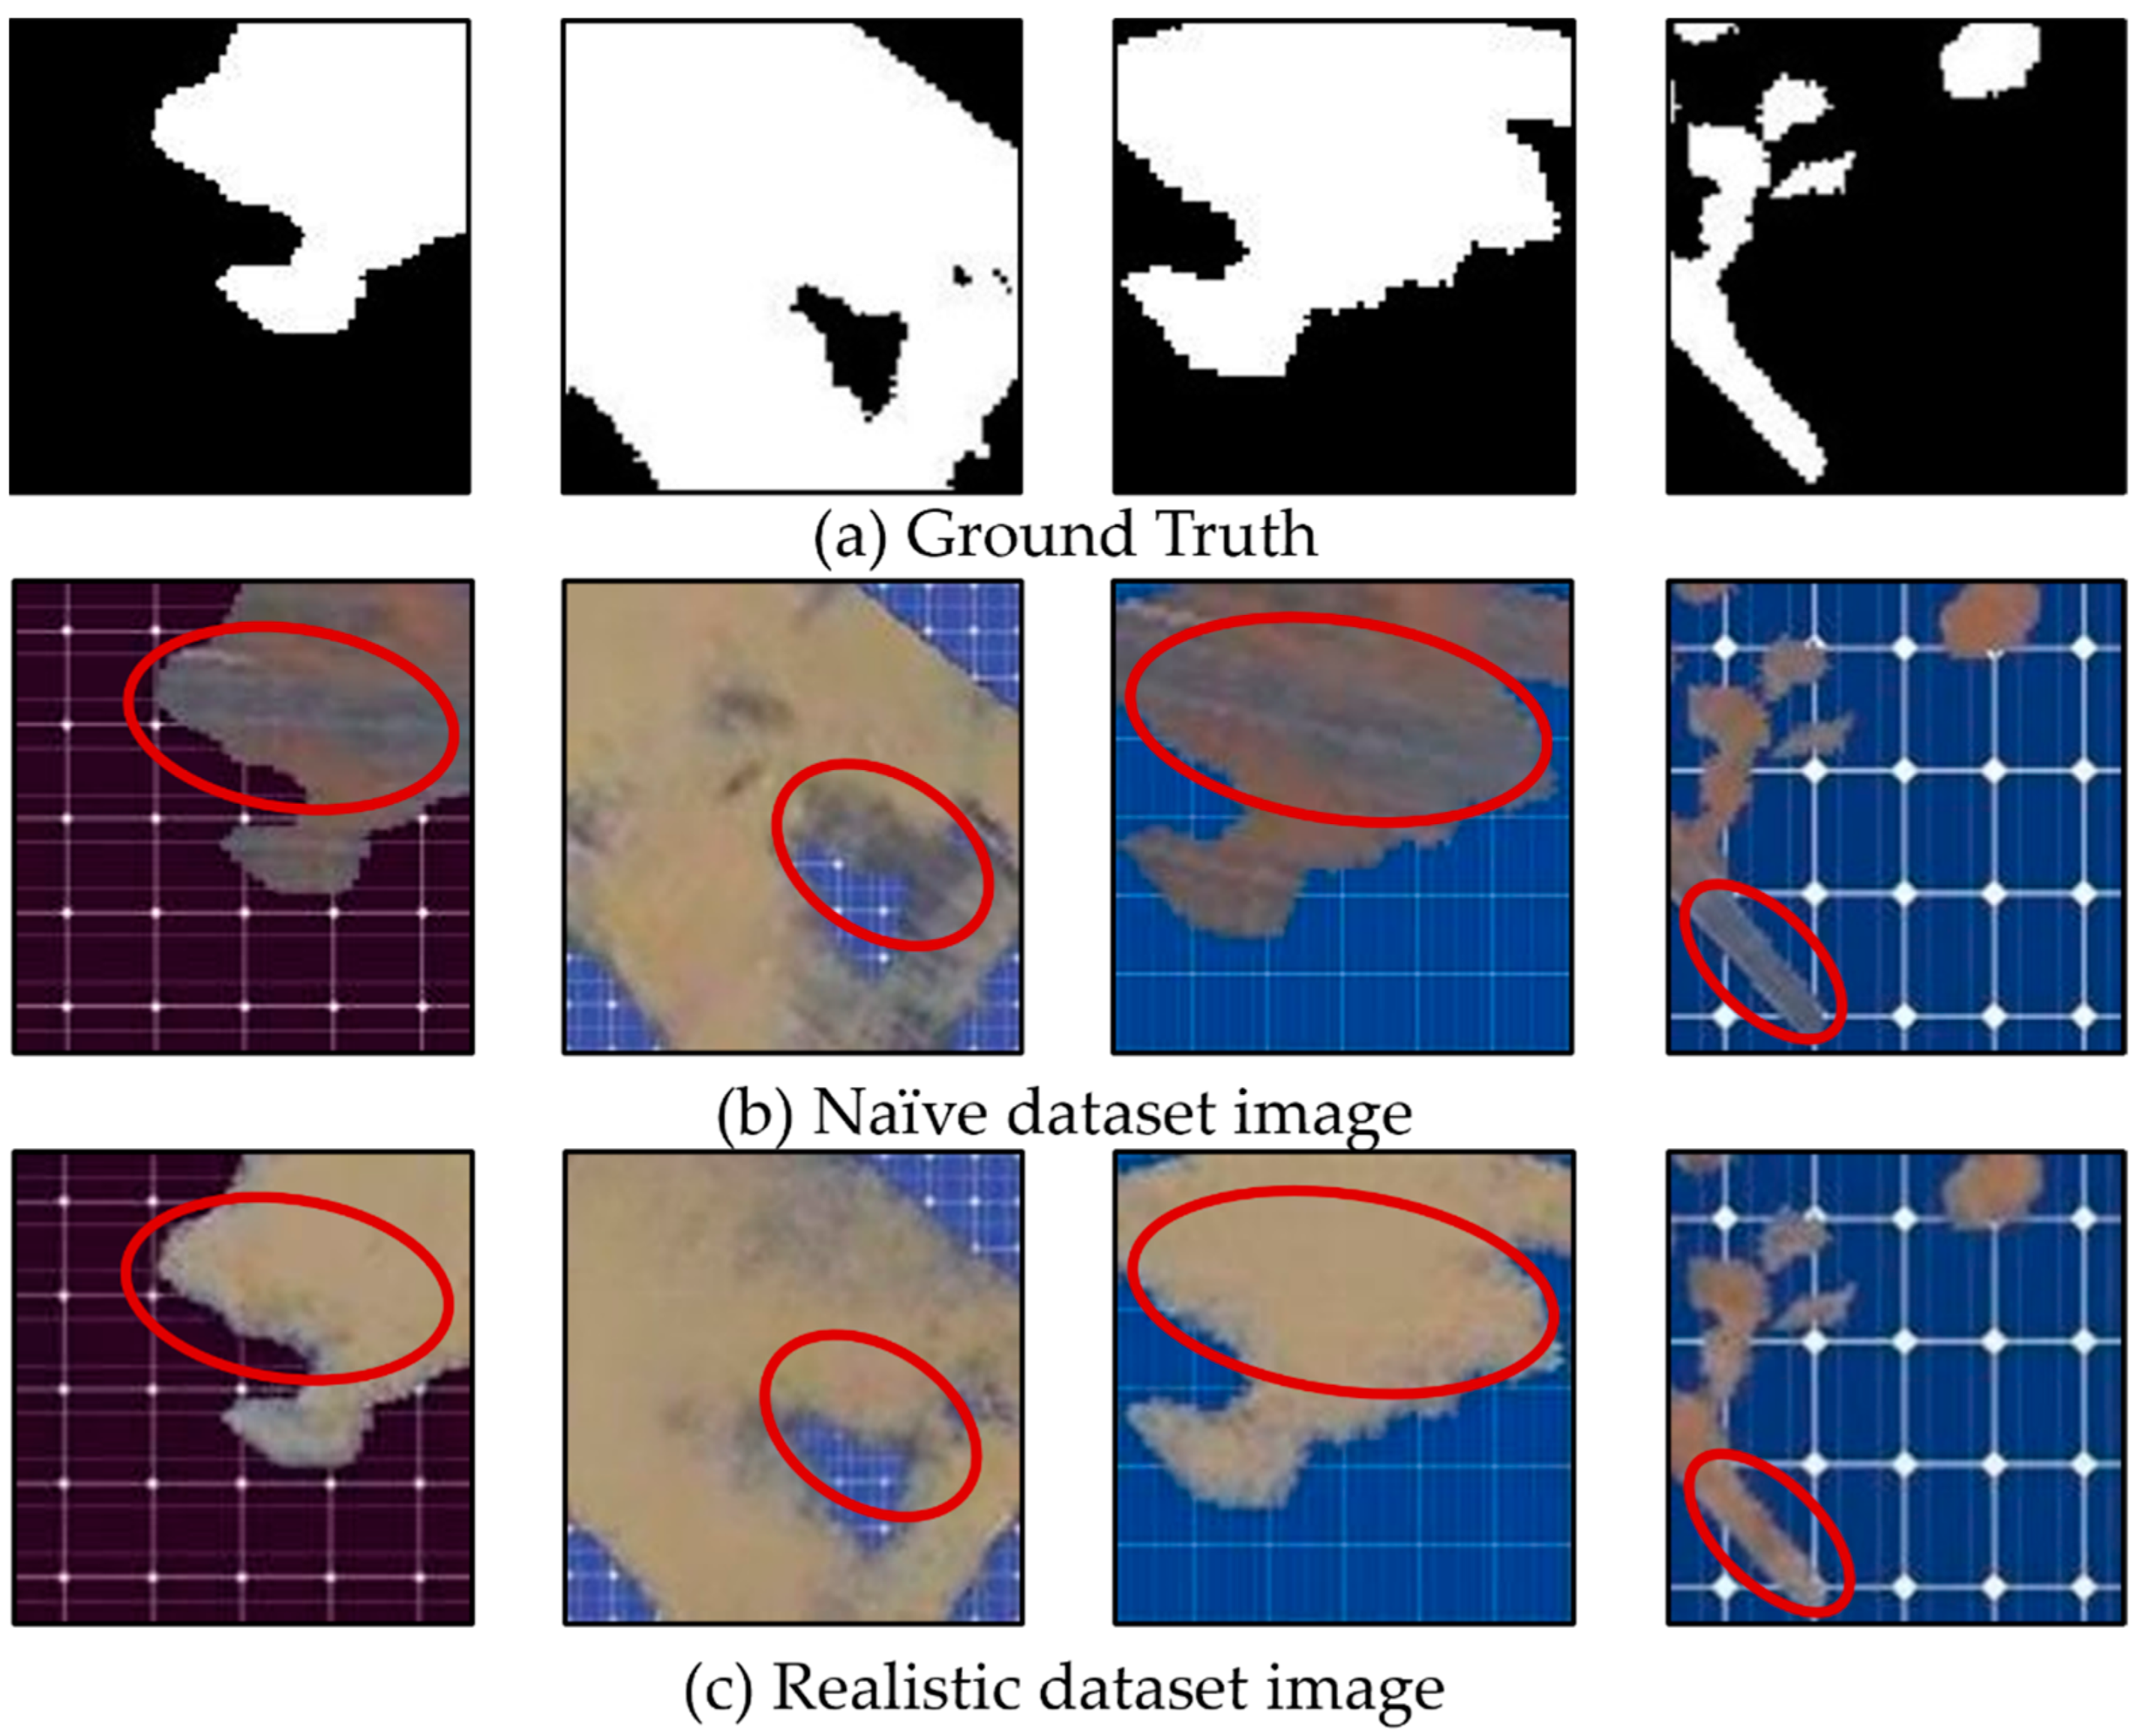
  • SPSI dataset: This dataset suffers from an imbalance issue regarding the shapes of solar panels and soiling. The SPSI dataset exclusively uses only one type of panel. Consequently, when training a segmentation model with the SPSI dataset, the model overfits the specific panel. The overfitted segmentation model incorrectly identifies the panel cell boundaries as soiling when identifying soiling on different types of solar panels. Additionally, the soiling in the SPSI dataset shows limited diversity in shapes. Among a total of 45,754 solar panel soiling images, there are only 84 images with unique soiling shapes.
  • Naïve dataset: We first applied traditional data augmentation methods, such as rotation, resizing, and flipping, to the SPSI dataset. We then copied pixels of the soiling area in each solar panel image and pasted them into the different types of solar panel images. As a result, we obtained an augmented dataset, called the Naïve Dataset, that contains various solar panel types and soiling shapes. However, the Naïve Dataset contains visual artifacts stemming from directly replicating existing solar panel patterns from the SPSI dataset.
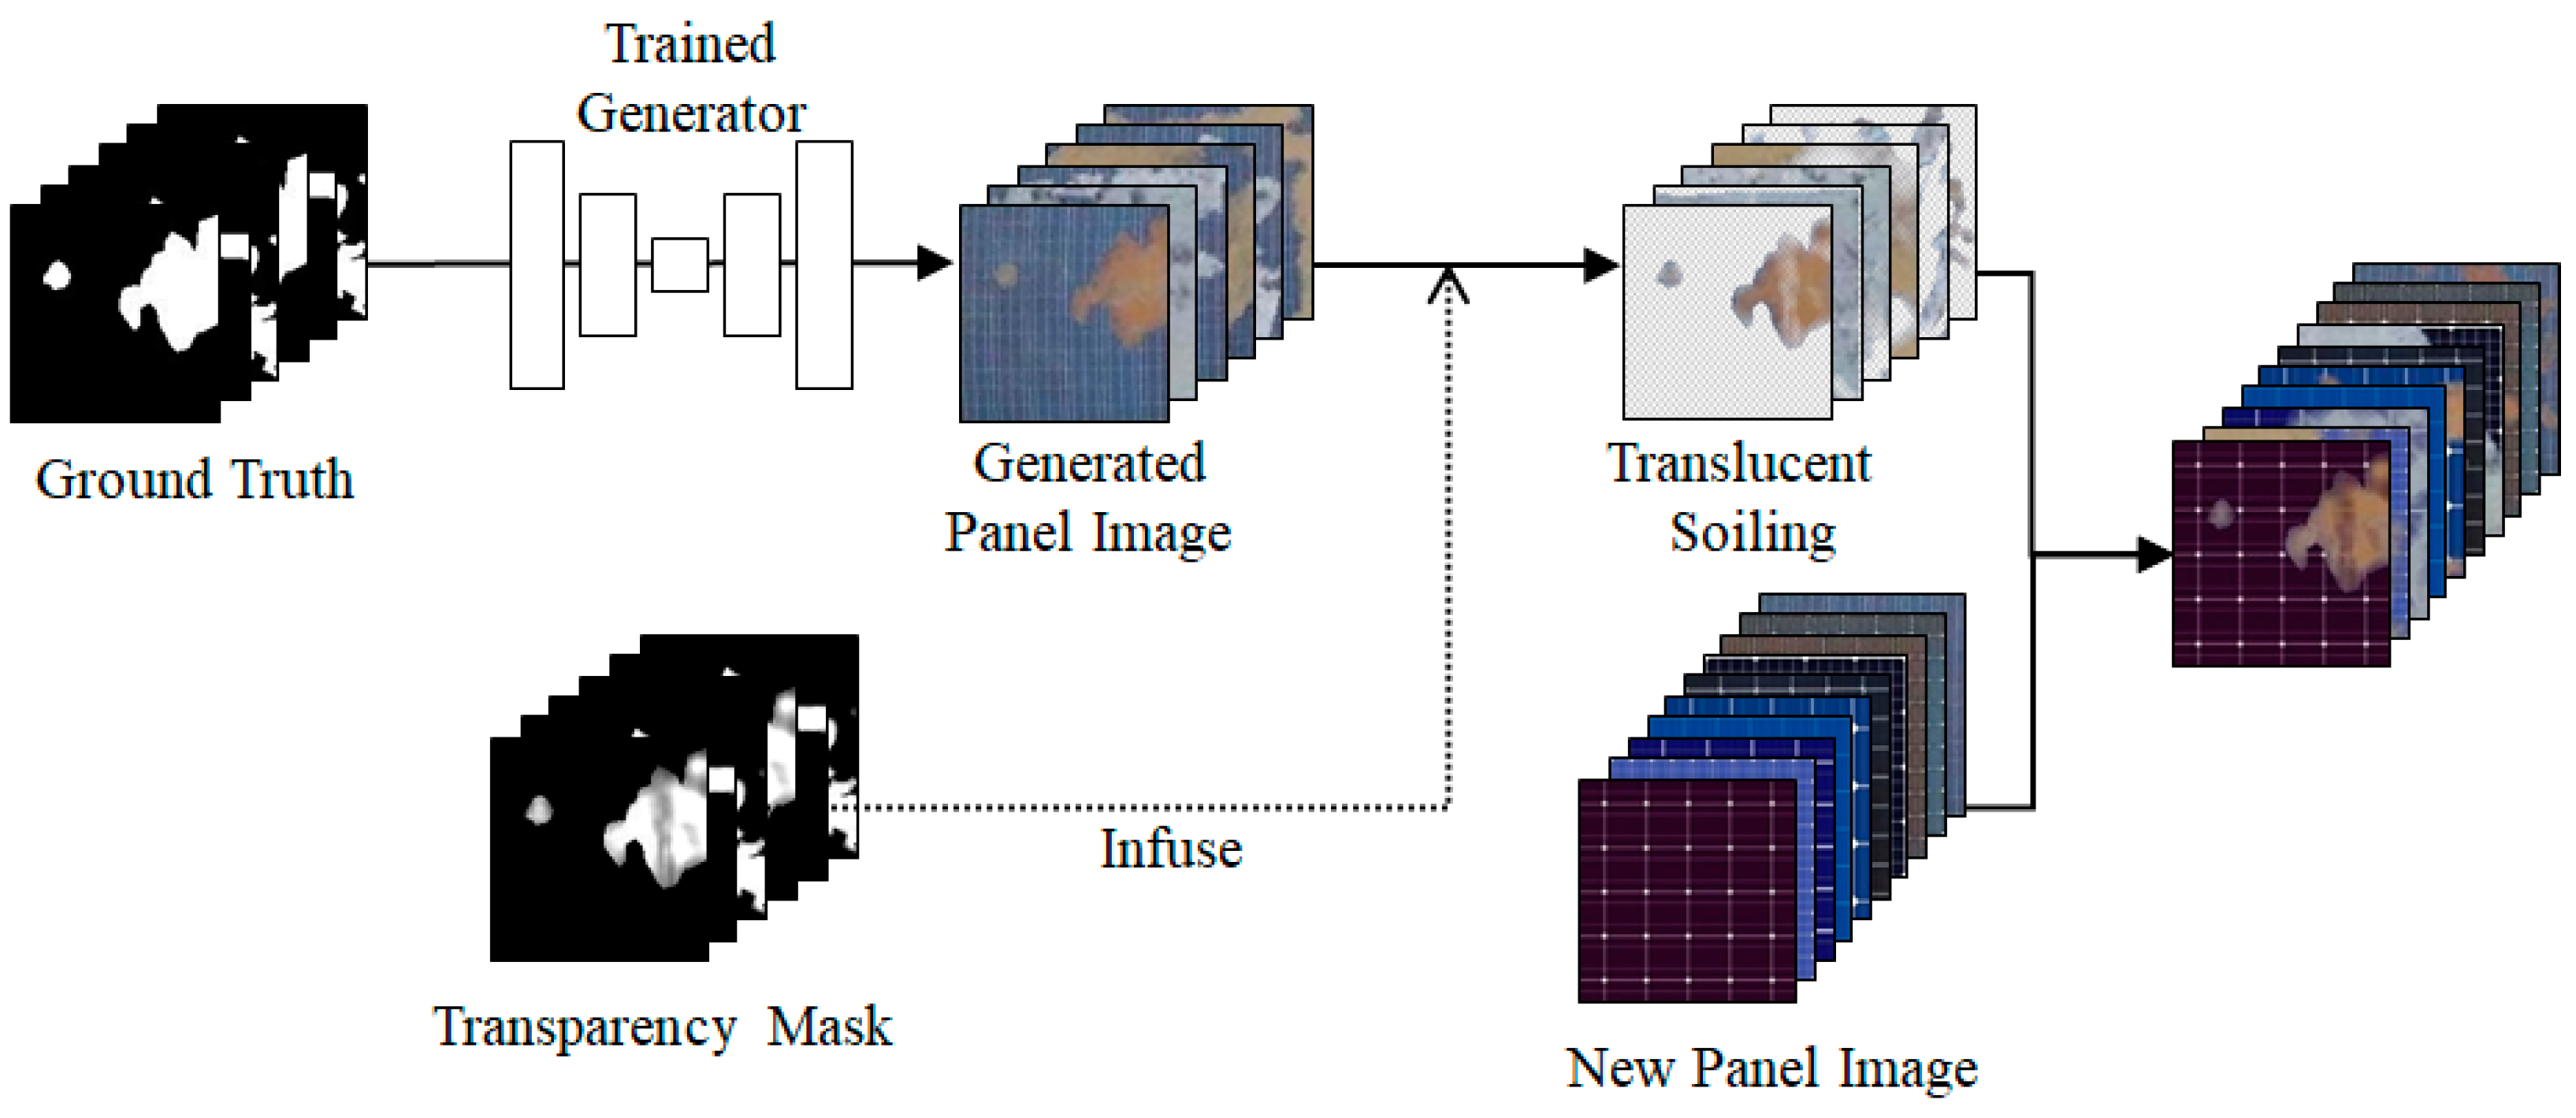
  • Realistic dataset: To address the issue of visual artifacts that arise in the Naïve dataset, we employed Pix2Pix, which provides a powerful image-to-image translation in specific areas, utilizing mask images. Specifically, we utilized mask images, which represent the soiling areas in the solar panel images, to train Pix2Pix. We then generated a Realistic dataset by using the pre-trained Pix2Pix. While the Realistic dataset excludes visual artifacts, it cannot consider translucent soiling. Translucent soiling is common in the wild, and it impacts solar power generation. Therefore, it is essential to augment solar panel images including translucent soiling.
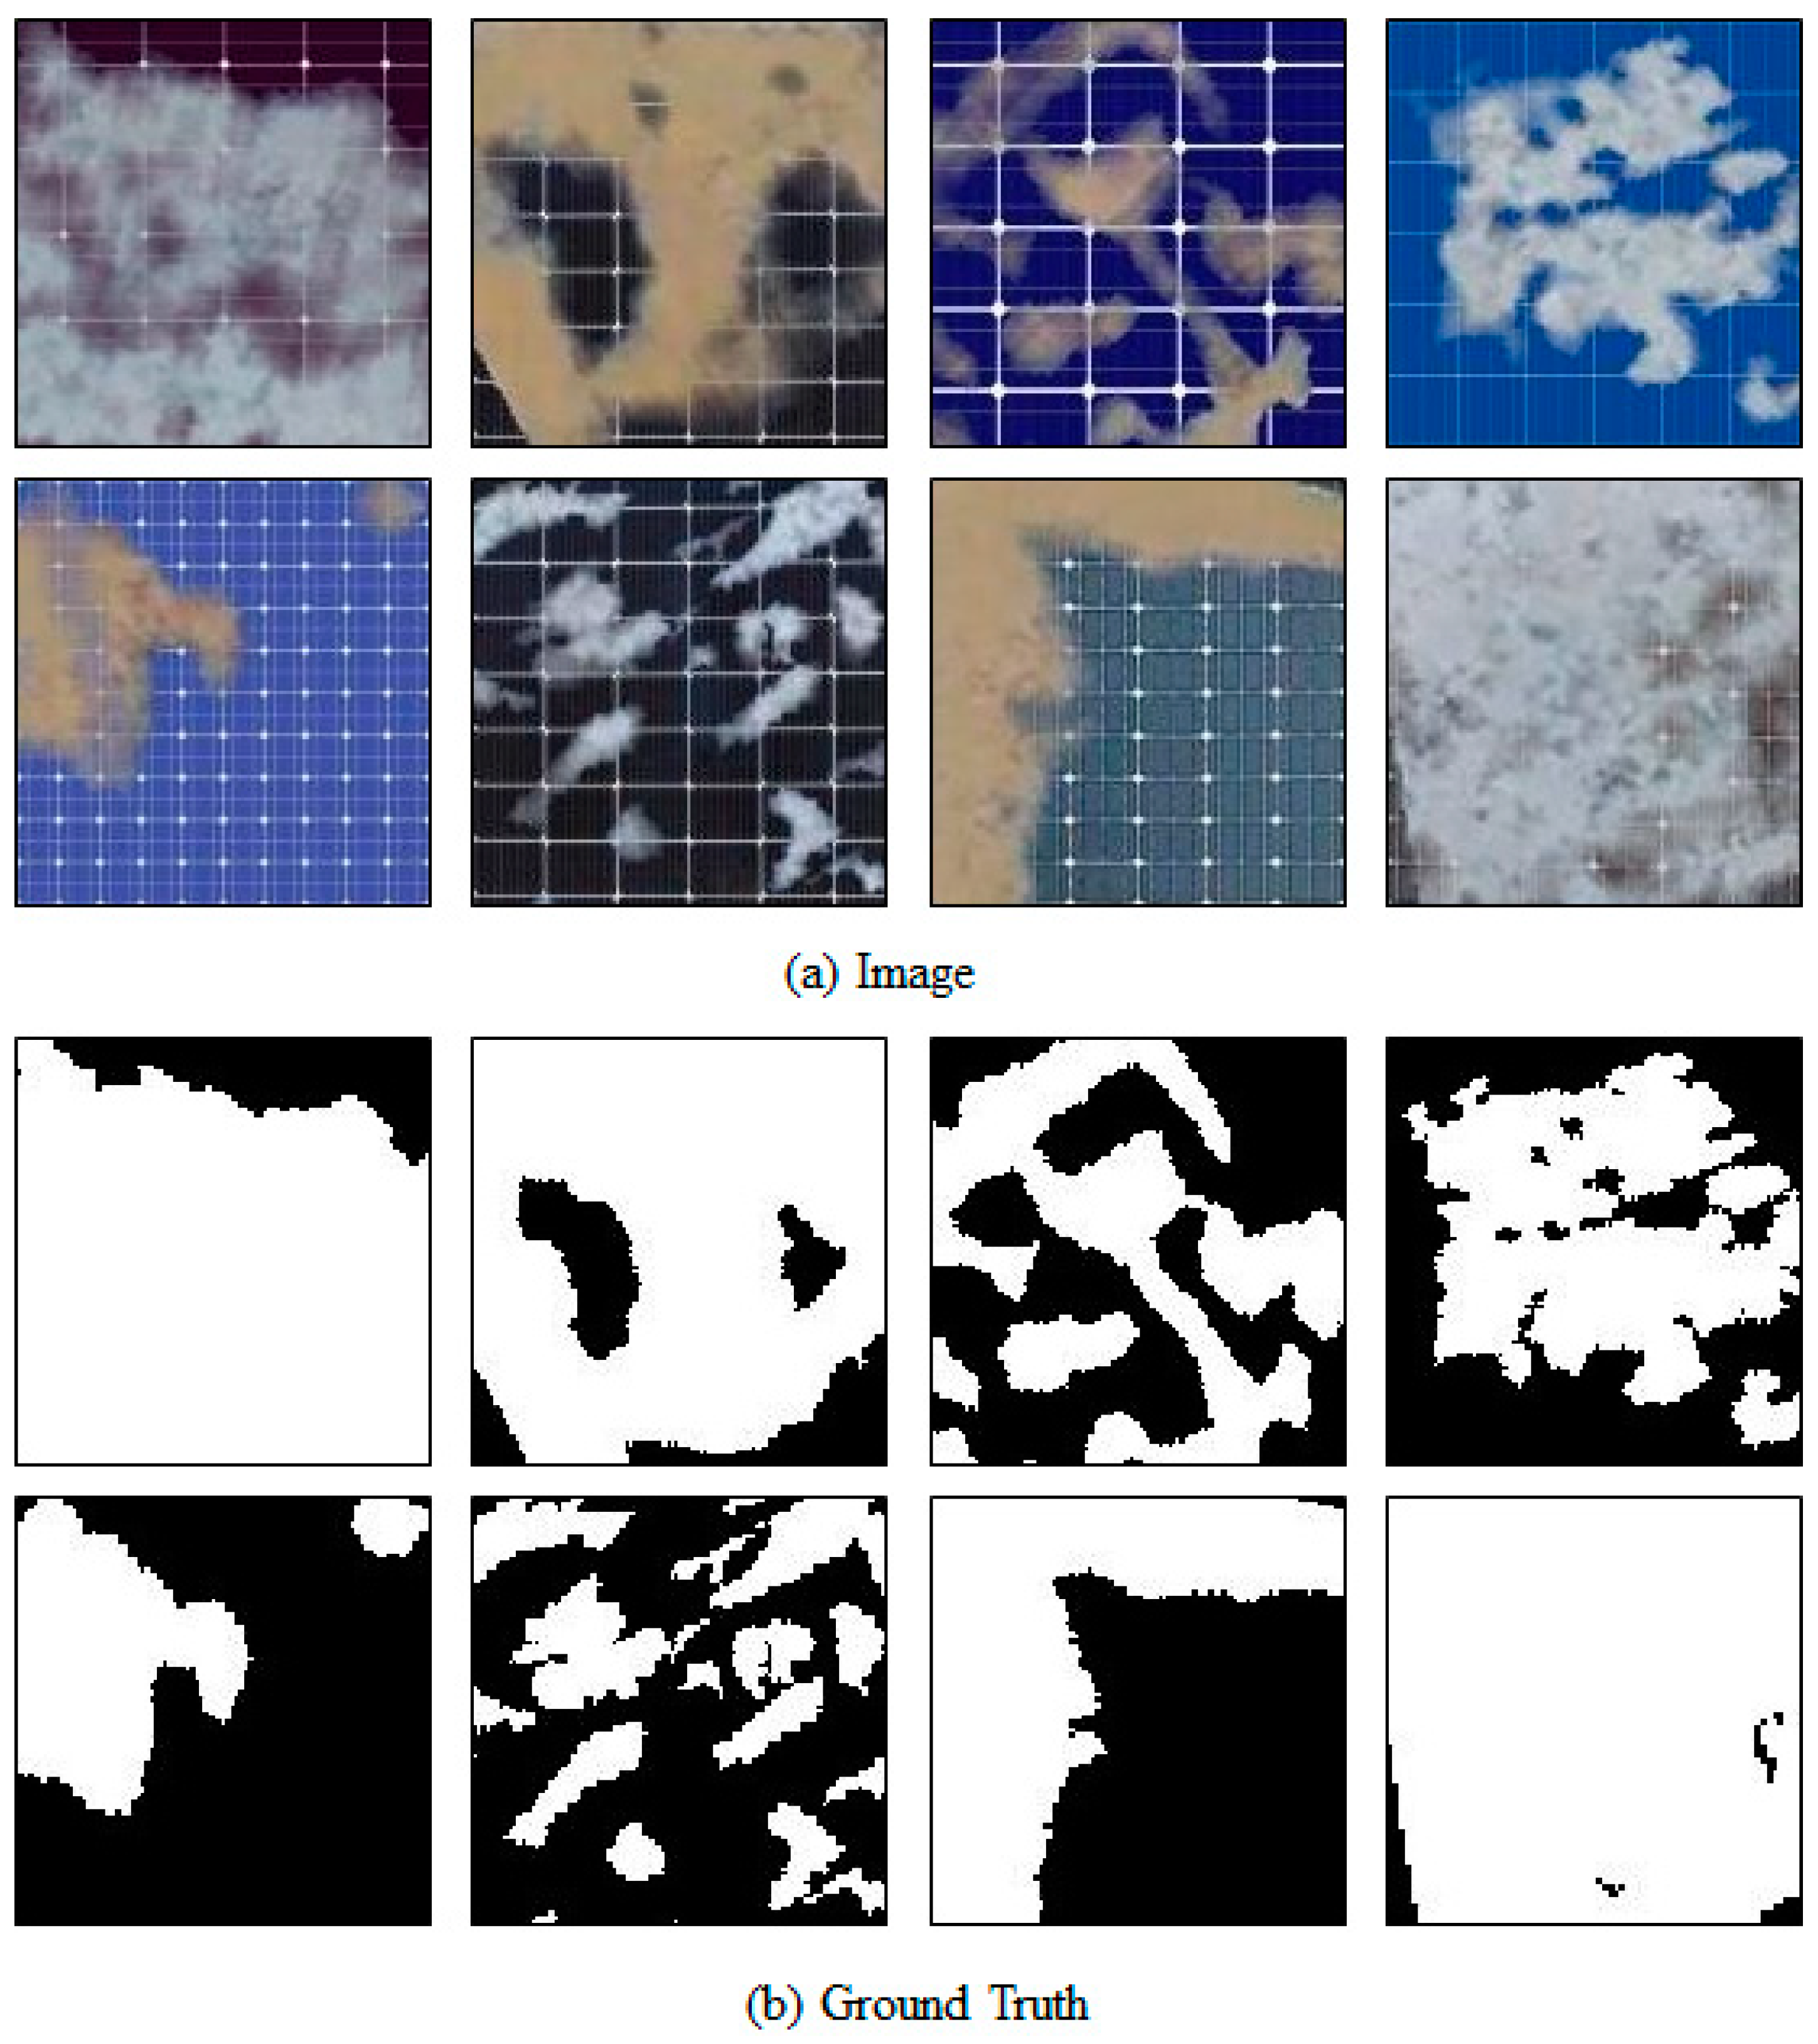
  • Translucent dataset: To generate translucent soiling images, we propose a new method to generate masks that incorporate information about soiling transparency. Specifically, transparency masks were formulated based on the RGB distance between the clean and soiled panels. RGB distance measures color dissimilarity between two images by calculating each pixel’s Euclidean distance in the RGB color space. The calculated RGB distance was then normalized to create a transparency mask. This generated transparency mask was infused into the solar panel image output from the Pix2Pix generator, resulting in the generation of a dataset (simply, Translucent dataset) that contains solar panel images with translucent soiling.
Table A1 compares the SPSI dataset and the newly generated datasets using the proposed method. Because the SPSI dataset excludes all clean-type panels, the total number of images is 29,190, and the three types of datasets generated through the proposed method have a total of 42,840 images as the number of images increases through data augmentation. In terms of panel type, the SPSI dataset has only one type of panel, but the generated Naïve, Realistic, and Translucent datasets contain a total of 10 panel types.
Table A1. Comparison of generated datasets.
DatasetNumberPanelVisual ArtifactsTranslucent
SPSI29,1901--
Naïve42,84010OX
Realistic42,84010XX
Translucent42,84010XO
In the case of the Naïve dataset, there is a visual artifacts problem where the background of an existing panel pattern is copied together. Conversely, no visual artifact problems exist in the Realistic and Translucent datasets generated through the Pix2Pix generative model. Lastly, there was no translucent soiling in the Realistic datasets, but there are solar panel images containing translucent soiling in the Translucent dataset finally generated through the proposed method. Figure A2 visually compares the Naïve, Realistic, and Translucent datasets generated through the same ground truth. As seen in Figure A1, the Translucent dataset solved all the problems of the previously mentioned datasets.
Figure A2. Comparison of each dataset. Red circles indicate the visual artifacts problem in each augmented dataset and the corresponding handled results.
Electronics 13 04859 g0a2

References

  1. Mehta, S.; Azad, A.P.; Chemmengath, S.A.; Raykar, V.; Kalyanaraman, S. DeepSolarEye: Power Loss Prediction and Weakly Supervised Soiling Localization via Fully Convolutional Networks for Solar Panels. In Proceedings of the 2018 IEEE Winter Conference on Applications of Computer Vision (WACV), Lake Tahoe, NV, USA, 12–15 March 2018. [Google Scholar]
  2. Umirzakova, S.; Ahmad, S.; Mardieva, S.; Muksimova, S.; Whangbo, T.K. Deep learning-driven diagnosis: A multi-task approach for segmenting stroke and Bell’s Palsy. Pattern Recognit. 2023, 144, 109866. [Google Scholar] [CrossRef]
  3. Umirzakova, S.; Whangbo, T.K. Detailed feature extraction network-based fine-grained face segmentation. Knowl. Based Syst. 2022, 250, 109036. [Google Scholar] [CrossRef]
  4. Baek, J.-H.; Oh, J. –H. Research on Improving Abandonment Detection Accuracy with Object Detection and Tracking Technology. J. Big Data Serv. 2024, 2, 47–60. [Google Scholar] [CrossRef]
  5. Aghaei, M.; Leva, S.; Grimaccia, F. PV Power Plant Inspection by Image Mosaicing Techniques for IR Real-Time Images. In Proceedings of the 2016 IEEE 43rd Photovoltaic Specialists Conference (PVSC), Portland, OR, USA, 5–10 June 2016; pp. 3100–3105. [Google Scholar]
  6. Akram, M.W.; Li, G.; Jin, Y.; Chen, X.; Zhu, C.; Ahmad, A. Automatic detection of photovoltaic module defects in infrared images with isolated and develop-model transfer deep learning. Sol. Energy 2020, 198, 175–186. [Google Scholar] [CrossRef]
  7. Li, X.; Yang, Q.; Lou, Z.; Yan, W. Deep Learning based module defect analysis for large-scale photovoltaic farms. IEEE Trans. Energy Convers. 2019, 34, 520–529. [Google Scholar] [CrossRef]
  8. Dunderdale, C.; Brettenny, W.; Clohessy, C.; van Dyk, E.E. Photovoltaic defect classification through Thermal Infrared Imaging using a machine learning approach. Prog. Photovolt. Res. Appl. 2019, 28, 177–188. [Google Scholar] [CrossRef]
  9. Aghaei, M.; Gandelli, A.; Grimaccia, F.; Leva, S.; Zich, R.E. IR Real-Time Analyses for PV System Monitoring by Digital Image Processing Techniques. In Proceedings of the 2015 International Conference on Event-Based Control, Communication, and Signal Processing (EBCCSP), Krakow, Poland, 17–19 June 2015; pp. 1–6. [Google Scholar]
  10. Wang, J.; Zhao, B.; Yao, X. PV Abnormal Shading Detection Based on Convolutional Neural Network. In Proceedings of the 2020 Chinese Control and Decision Conference (CCDC), Hefei, China, 22–24 August 2020; pp. 1580–1583. [Google Scholar]
  11. Dev, S.; Nautiyal, A.; Lee, Y.H.; Winkler, S. CloudSegNet: A deep network for nychthemeron cloud image segmentation. IEEE Geosci. Remote Sens. Lett. 2019, 16, 1814–1818. [Google Scholar] [CrossRef]
  12. Ozturk, O.; Hangun, B.; Eyecioglu, O. Detecting Snow Layer on Solar Panels Using Deep Learning. In Proceedings of the 2021 10th International Conference on Renewable Energy Research and Application (ICRERA), Istanbul, Turkey, 26–29 September 2021; pp. 434–438. [Google Scholar] [CrossRef]
  13. Ghiasi, G.; Cui, Y.; Srinivas, A.; Qian, R.; Lin, T.Y.; Cubuk, E.D.; Le, Q.V.; Zoph, B. Simple Copy-Paste Is a Strong Data Augmentation Method for Instance Segmentation. In Proceedings of the IEEE/CVF Conference on Computer Vision and Pattern Recognition (CVPR), Nashville, TN, USA, 19–25 June 2021; pp. 2918–2928. [Google Scholar]
  14. Isola, P.; Zhu, J.Y.; Zhou, T.; Efros, A.A. Image-to-Image Translation with Conditional Adversarial Networks. In Proceedings of the IEEE Conference on Computer Vision and Pattern Recognition, Honolulu, HI, USA, 21–26 July 2017; pp. 1125–1134. [Google Scholar]
  15. Chen, L.C.; Zhu, Y.; Papandreou, G.; Schroff, F.; Adam, H. Encoder-Decoder with Atrous Separable Convolution for Semantic Image Segmentation. In Proceedings of the European Conference on Computer Vision (ECCV), Munich, Germany, 8–14 September 2018; pp. 801–818. [Google Scholar]
  16. Li, B.; Delpha, C.; Diallo, D.; Migan-Dubois, A. Application of artificial neural networks to photovoltaic fault detection and diagnosis: A Review. Renew. Sustain. Energy Rev. 2021, 138, 110512. [Google Scholar] [CrossRef]
  17. Stock Photos, Royalty-Free Images, Graphics, Vectors & Videos. Available online: https://stock.adobe.com/ (accessed on 18 July 2024).
  18. Labelmeai/Labelme: Image Polygonal Annotation with Python (Polygon, Rectangle, Circle, Line, Point and Image-Level Flag Annotation). Available online: https://github.com/wkentaro/labelme#installation (accessed on 18 July 2024).
  19. Goodfellow, I.; Pouget-Abadie, J.; Mirza, M.; Xu, B.; Warde-Farley, D.; Ozair, S.; Bengio, Y. Generative adversarial nets. Adv. Neural Inf. Process. Syst. 2014, 27, 1–9. [Google Scholar]
  20. Simonyan, K.; Zisserman, A. Very deep convolutional networks for large-scale image recognition. arXiv 2014, arXiv:1409.1556. [Google Scholar]
  21. Long, J.; Shelhamer, E.; Darrell, T. Fully convolutional networks for semantic segmentation. In Proceedings of the IEEE Conference on Computer Vision and Pattern Recognition, Boston, MA, USA, 7–12 June 2015; pp. 3431–3440. [Google Scholar]
  22. Panchanan, S.; Dastgeer, G.; Dutta, S.; Hu, M.; Lee, S.-U.; Im, J.; Seok, I.S. Cerium-based halide perovskite derivatives: A promising alternative for lead-free narrowband UV photodetection. Matter 2024, 7, 3949–3969. [Google Scholar] [CrossRef]
  23. Nisar, S.; Ajmal, S.; Dastgeer, G.; Zafar, M.S.; Rabani, I.; Zulfiqar, M.W.; Souwaileh, A.A. Chemically doped-graphene FET photodetector enhancement via controlled carrier modulation with an iron(III)-chloride. Diam. Relat. Mater. 2024, 145, 111089. [Google Scholar] [CrossRef]
  24. CVAT-ai/cvat: Annotate Better with CVAT, the Industry-Leading Data Engine for Machine Learning. Used and Trusted by Teams at Any Scale, for Data of Any Scale. Available online: https://github.com/opencv/cvat (accessed on 18 July 2024).
Figure 1. Overview of unified generative data augmentation.
Electronics 13 04859 g001
Figure 2. Example of the SPSI dataset [1].
Electronics 13 04859 g002
Figure 3. New panel background images: (ag) synthetic panel image samples shared on Adobe Stock; (h,i) panel images installed in actual solar power plants; (j) panel image provided in the SPSI dataset.
Electronics 13 04859 g003
Figure 4. Example of preprocessing SPSI dataset.
Electronics 13 04859 g004
Figure 5. Image with unique soiling [1].
Electronics 13 04859 g005
Figure 6. The process of making the Naïve dataset.
Electronics 13 04859 g006
Figure 7. Example of Naïve dataset.
Electronics 13 04859 g007
Figure 8. Visual artifacts problem of Naïve dataset. Red circles indicate visual artifacts created due to the inclusion of the original panel pattern in the copied soiling areas.
Electronics 13 04859 g008
Figure 9. The process of training Pix2Pix.
Electronics 13 04859 g009
Figure 10. Comparison of Naïve and Realistic datasets. Red circles illustrate the differences in the visual artifacts problem between the Naïve and Realistic datasets.
Electronics 13 04859 g010
Figure 11. Generation process of transparency masks.
Electronics 13 04859 g011
Figure 12. Example of soiling image, ground truth, and transparency mask.
Electronics 13 04859 g012
Figure 13. Process of generating Translucent dataset.
Electronics 13 04859 g013
Figure 14. Example of Translucent dataset.
Electronics 13 04859 g014
Figure 15. Structure for DeepLabV3+.
Electronics 13 04859 g015
Figure 16. Experimental results on actual solar panels with translucent soiling: (a) input solar panel images; (b) ground truth labels; (c) results of the model trained by SPSI dataset; (d) results of the model trained by Naïve dataset; (e) results of the model trained by Realistic dataset; (f) results of the model trained by Translucent dataset.
Electronics 13 04859 g016
Figure 17. Jaccard Index of each dataset.
Electronics 13 04859 g017
Table 1. Statistics of the Naïve dataset.
TypeFormulaNumber
Unique soiling image in SPSI dataset-84
Copy-Paste without augmentation84 types of soiling × 9 panel image756
Copy-Paste with augmentation84 types × 50 times augmentation
× 10 panels
42,000
Total-42,840
Table 2. Hyperparameter of DeepLabV3+.
ParameterValue
BackboneException
OptimizerSGD
Learning rate0.01
Epoch100
Batch size4
Table 3. Number of training, validation, and test images in datasets.
DatasetTrainingValidationTestTotal
SPSI20,4335838291929,190
Naïve29,9878568428542,840
Realistic
Translucent
Disclaimer/Publisher’s Note: The statements, opinions and data contained in all publications are solely those of the individual author(s) and contributor(s) and not of MDPI and/or the editor(s). MDPI and/or the editor(s) disclaim responsibility for any injury to people or property resulting from any ideas, methods, instructions or products referred to in the content.

