1. Introduction
Because of their increasing complexity, modern data centers need robust frameworks to manage a variety of hardware and virtualized environments effectively. To overcome this difficulty, this paper presents a brand-new, cohesive framework that smoothly combines the vSphere and RedFish APIs. In contrast to conventional methods, this framework uses both APIs’ advantages to offer thorough, real-time monitoring and management of physical and virtualized infrastructures. Improved interoperability, scalability, and a cutting-edge, policy-driven alerting system that permits proactive maintenance and minimizes downtime are some of the key features. This framework represents an advancement in data center management. It makes server management more accessible and establishes the foundation for incorporating AI and ML capabilities for fault detection and predictive analytics.
By integrating the capabilities of these two APIs, organizations can establish automated protocols that guarantee ongoing monitoring of server health, identify potential problems promptly, and initiate automated responses or maintenance activities before critical failures. This method facilitates enhanced resource allocation, reduces downtime, and ultimately augments the resilience and efficiency of server management across both physical and virtual infrastructures.
There are four scientific contributions from this paper:
This paper introduces a unified framework that combines the RedFish and vSphere APIs to create a comprehensive policy-driven server monitoring system. This integration provides real-time monitoring of hardware health and system resources across physical, virtual, or container-based environments;
The framework proposed in this paper facilitates interoperability among different server infrastructures and improves scalability for hyper-scale data centers;
This paper introduces a unified policy-based alert system that leverages the integrated monitoring capabilities of both RedFish and vSphere. This system automates alerts and actions based on predefined rules, leading to proactive hardware management and reduced downtime, which would be beneficial if one of the APIs failed while working;
The framework introduced in this paper can serve as a basis for creating additional AI/ML-based frameworks for hardware failure detection and prediction in the future.
This paper is organized as follows: in the next two sections, the state of the research field and the proposed system architecture and all its sub-services will be analyzed in detail. As a result of the proposed architecture, an application available for download from GitHub was developed [
1], which will be described in detail in the next section. A section about analysis and discussion will follow this. The last part of this paper presents sections about future work and a conclusion.
2. Related Works
As the world is transitioning to a software-defined paradigm, hardware management capabilities must evolve to address that shift in the data center. In the context of disaggregated hardware, management software needs to combine the independent pieces of hardware, such as trays, modules, silicon, etc., to create a composed logical system [
2]. Therefore, efficient data center management is crucial in today’s rapidly evolving technological environment to maximize performance and guarantee reliability. Traditional server management methods are based on the operating system and suffer from poor timeliness, difficulty identifying the cause of server crashes, and severe resource occupation by servers [
3]. Conventional monitoring systems frequently need help dealing with the intricate and diverse nature of contemporary server environments. To tackle these difficulties, they suggest an all-encompassing solution for monitoring the arbitrary number of remote servers. Our solution makes use of agents that are connected to the RedFish API and vSphere API. RedFish is an open industry standard specification and schema for system management as defined by the Distributed Management Task Force (DMTF). RedFish aims to simplify and assure the management of scalable (hyper-scale) data center hardware [
4]. It improves interoperability among different server infrastructures. The vSphere agent enables comprehensive monitoring of virtualized environments, providing valuable information on the state of the hardware running the vSphere hypervisor. Combining these two information sources gives us much scope to create advanced alarms and alerts based on either or both sources, which can be hugely beneficial for various environments.
The operations domain functions at this layer include traditional server management functions implemented in microcontrollers, such as IPMI (Intelligent Platform Management Interface), HPE (Houston, TX, US) iLO (Integrated Lights-Out), and Dell (Round Rock, TX, US) iDRAC [
5]. There are established protocols that enable a uniform interface within the server infrastructure. The idea behind remote server management started in 1998 when Intel introduced the IPMI specification, which is compatible with over 200 computer system manufacturers. The RedFish standard, developed by the Distributed Management Working Group, replaced it due to its security vulnerabilities. The RedFish standard offers a straightforward and secure method for handling a combination of different types of infrastructure. This includes guidelines for managing the server, processor, memory, storage, network devices, and peripheral component models. From our perspective, RedFish is a management standard that uses a data model representation with a RESTful (Representational State Transfer) interface [
6]. To provide that “common ground,” a RedFish interoperability profile allows the definition of a set of schemas and property requirements that meet the needs of a particular class of product or service [
7]. As the remote server management platform presented in this paper on HPE servers was being developed, the focus was on iLO4 and iLO5 using RedFish for their remote management interfaces. Using RedFish will help us ensure servers’ availability and reliability [
8].
The goal of this paper is not to discuss energy efficiency. It does not matter which remote management tooling was used; the built-in sensor inaccuracies diminish the overall accuracy used to attribute power consumption to virtual machines (VMs) [
9]. It is oriented to hardware monitoring via RedFish, for example, using the RedFish protocol to monitor the CPU temperature [
10]. These remote monitoring standards use a BMC (Baseboard Management Controller) to collect sensor information [
11].
There are also security issues related to remote management interfaces. Depending on the version of the software in use, an attacker can obtain full access (supervisor, root, admin) to the system after successfully cracking its hash password in IPMI [
12]. There are also performance issues with BMC controllers, as they are usually slow and are slow to reboot after a firmware update or configuration change necessitates a reboot.
Performance monitoring is essential for analyzing resource utilization and detecting anomalies, and it is important to notify the user if any issues arise. Utilizing the gathered data makes it feasible to conduct a more comprehensive examination of the workload on a specific server. Hence, developing a system that facilitates streamlined resource status and availability monitoring is imperative and promptly alerts users when data values change by predefined alert rules. Therefore, the fast booting of the operating system used by BMC is required to quickly identify the point of the problem and recover from failures [
13], should any failures happen. Research shows remote management can be used for wider-scale fault detection, such as IPMI-based environments for HPC (High-Performance Computing) environments [
14]. Also, research shows that this can be used for risk management and workload placement decisions [
15].
There are also scalability issues when dealing with larger data centers. Previous research states that traditional BMC-based out-of-band management methods, such as IPMI, RedFish, etc., will face new challenges today since data centers have already expanded to be large-scale [
16]. This complicates the remote management of HPC-based environments, as they might have very diverse administration domains, with administrators managing each fabric differently through different tools [
17].
Xue et al. [
18] present an intelligent integrated system for operating and maintaining server rooms. This system employs artificial intelligence to enhance resource allocation, facilitate real-time fault detection, and streamline monitoring processes, thereby diminishing operational complexities. This solution enhances scalability and adaptability, allowing server rooms to sustain high efficiency levels while reducing the risks linked to system failures and inefficiencies. It illustrates the increasing significance of AI in the management of server infrastructure.
Ogawa [
19] proposes a monitoring technique for server rack devices utilizing linear modules to improve data collection accuracy and accessibility. This method is especially advantageous for high-density data centers, where real-time data precision is essential for sustaining operational stability. This method enhances server operations and reduces disruptions by facilitating access to monitoring points and increasing fault detection efficiency. It emphasizes the significance of innovative physical monitoring frameworks in contemporary server environments.
Șuvar et al. [
20] examine the application of the Home Assistant platform for server room monitoring, presenting a cost-efficient and modular solution. Their research indicates that this open-source framework facilitates effective environmental monitoring and energy management. Furthermore, its versatility renders it appropriate for smaller server facilities, highlighting the necessity of customized solutions. The research emphasizes the possibility of integrating open-source technologies with comprehensive server monitoring requirements, providing a scalable and cost-effective solution.
Ali et al. [
21] introduce RedFish-Nagios, a system that amalgamates standardized RedFish protocols with Nagios monitoring. This innovation improves interoperability, facilitating seamless data exchange and comprehensive analytics. The system automates notifications and optimizes telemetry, enhancing the efficacy of monitoring operations throughout data centers. This solution enhances monitoring accuracy and operational insights in contemporary server ecosystems by resolving compatibility issues and offering a scalable architecture.
Park et al. [
22] introduced a customizable RedFish Query Proxy module prototype to enhance data extraction and monitoring configurations. The proxy module improves query accuracy and personalization, addressing operational deficiencies in data retrieval. This study highlights how modular tools can meet various operational requirements while maintaining efficiency and adaptability. The proposed solution advances the flexibility of server monitoring in dynamic and heterogeneous environments.
The rest of this paper is organized as follows: First, the technical details of the two APIs used in this paper—the RedFish and vSphere APIs—will be discussed, followed by the proposed system architecture and its subcomponents that are necessary for the application (an implementation of the framework proposed by this paper) to work. Then, the application capabilities regarding agent configuration, checking server status, working with rules and conditions, and notifications will be discussed. In the last sections of the paper, the test results and analytics will be presented before discussing future research directions and conclusions.
3. RedFish and vSphere APIs
The RedFish API, created by the Distributed Control Task Force, is a contemporary, standardized RESTful interface aimed at streamlining and improving the control of hardware components in data centers. RedFish, an advancement of the Intelligent Platform Management Interface, rectifies the shortcomings of its predecessor, which faced security vulnerabilities and scalability issues. IPMI, despite its widespread use, was constrained by its dependence on antiquated protocols and inadequate support for the increasing complexity of hyper-scale and hybrid data centers. RedFish supplants this with a more secure, flexible, and web-based framework that accommodates contemporary data center requirements.
In contrast to IPMI, which predominantly utilizes out-of-band communication via proprietary instructions, RedFish utilizes a JSON-based (JavaScript Object Notation) data model over HTTPS. This RESTful architecture enhances its compatibility with contemporary development tools and cloud-native applications. RedFish provides capabilities like hardware health monitoring, power and thermal control, and firmware updates. Furthermore, it facilitates out-of-band management, enabling administrators to access server controls even when the operating system is down or unresponsive.
RedFish operates on the Baseboard Management Controller, an integrated microcontroller in server hardware. The BMC serves as the conduit for RedFish, enabling communication between the server’s hardware elements and management software. This connection allows RedFish to oversee and manage various components, such as the CPUs, memory, storage, and power supply. It is extensively utilized in hyper-scale data centers, where its compatibility with multiple server infrastructures improves efficiency, scalability, and dependability.
Utilizing RedFish, enterprises acquire a cohesive, vendor-agnostic framework for hardware management, tackling the complexities of contemporary, disaggregated server systems.
For example, the following API call could be used to retrieve system information in RedFish:
GET /redfish/v1/Systems/1 HTTP/1.1
Host: [RedFish_Server_IP]
Authorization: Bearer [Access_Token]
Content-Type: application/json
The following further explains this code:
GET /redfish/v1/Systems/1 retrieves the system-level details for a specific server, including its health, power status, and other operational data. [RedFish_Server_IP] is the IP address of the RedFish interface. The Authorization header uses a Bearer token that was obtained during login.
The response will look similar to this output:
{
  "@odata.id": "/redfish/v1/Systems/1",
  "Name": "Example Server",
  "PowerState": "On",
  "Status": {
    "State": "Enabled",
    "Health": "OK"
  }
}
This output would indicate that the server is on and in a healthy operational state.
The vSphere API, created by VMware, is a proprietary interface intended to manage virtualized infrastructures efficiently. It emerged as a VMware virtualization framework component, fulfilling the requirement for the centralized administration of virtual machines (VMs), hypervisors, and virtualized storage and networking elements. With the evolution of data centers towards software-defined models, the vSphere API emerged as a fundamental tool for automating and enhancing resource allocation in virtual environments.
The vSphere API offers programmatic access to VMware’s vSphere platform, facilitating VM provisioning, resource pool management, virtual network configuration, and performance metric monitoring. It uses a SOAP-based (Simple Object Access Protocol) protocol, with certain functionalities now accessible through RESTful APIs to enhance its usability and interoperability with contemporary technologies. Administrators and developers engage with the vSphere API using tools such as PowerCLI and SDKs (Software Development Kit) or by making direct API queries. These interactions facilitate the automation of repetitive processes, including the deployment of virtual machines and the adjustment of resource allocations in response to workload needs.
The vSphere APIs operate within the VMware hypervisor ecosystem, specifically on vSphere ESXi hosts and vCenter Server. The ESXi hypervisor serves as the fundamental layer for virtualization, whereas the vCenter Server consolidates the management of numerous ESXi hosts and their corresponding virtual machines. API queries are generally sent to vCenter, which orchestrates operations throughout the infrastructure and acquires performance metrics from ESXi hosts.
The vSphere API is an essential instrument for contemporary data centers. It offers comprehensive insights into virtualized resources and facilitates policy-driven management. Its capacity to automate processes and enhance workloads renders it indispensable for administrators overseeing dynamic, large-scale virtual environments.
For example, the following API call could be used to retrieve ESXi host information in vSphere API:
GET https://[vCenter_Server_IP]/api/vcenter/host HTTP/1.1
Authorization: Basic [Base64_Encoded_Credentials]
Content-Type: application/json
The response will look similar to this output (depending on the host ID, name, etc.):
{
  "value": [
    {
      "host": "host-ID",
      "name": "host-NAME",
      "connection_state": "CONNECTED",
      "power_state": "POWERED_ON",
      "cpu_count": 8,
      "memory_size_MiB": 32768
    },
    {
      "host": "HOST-ID2",
      "name": "host-NAME2",
      "connection_state": "DISCONNECTED",
      "power_state": "POWERED_OFF",
      "cpu_count": 16,
      "memory_size_MiB": 65536
    }
  ]
}
Combining the capabilities of RedFish and vSphere APIs into a hybrid alarm system provides a robust, comprehensive framework for detecting and responding to hardware problems in modern data centers. As complementary data sources, we can use them to their strengths, as specifically detailed in the following:
The RedFish API provides detailed information about hardware components, including the power supply, CPUs, memory, and thermal sensors, regardless of the server’s operational status. This out-of-band management guarantees the availability of essential health measures during failures.
The vSphere API concentrates on the virtualized environment, overseeing virtual machines, managing resource allocation, and assessing overall host conditions. It comprehensively analyzes ESXi hosts’ resource use, connection statuses, and operational efficacy.
The hybrid alarms described in
Section 6 combine these sources for endless possible scenarios. A hybrid alarm leverages the hardware-level health information from RedFish (e.g., power supply or memory failures) and the real-time operational data from vSphere (e.g., VM resource issues or host disconnections).
These alarms are particularly useful in large-scale environments where different server hardware and mixed virtualization platforms coexist. This integration supports unified monitoring and reduces the need for multiple disconnected management systems.
By integrating RedFish and vSphere API responses into a unified hybrid alarm, data centers gain a more resilient and intelligent monitoring system capable of detecting, correlating, and addressing hardware issues before they escalate into critical failures.
The primary scope, focus, and use cases for the two technologies (RedFish and vSphere APIs) used to create the platform proposed in this paper are shown in
Table 1.
By combining these sets of capabilities, the proposed platform enhances the visibility of hardware monitoring and failure management. This can be achieved via custom agents that collect metrics information from the RedFish and vSphere APIs, of which there are many, such as the ones shown in
Table 2.
The next topic is the proposed system architecture and how these two APIs can be integrated to create a unified platform.
4. Proposed System Architecture
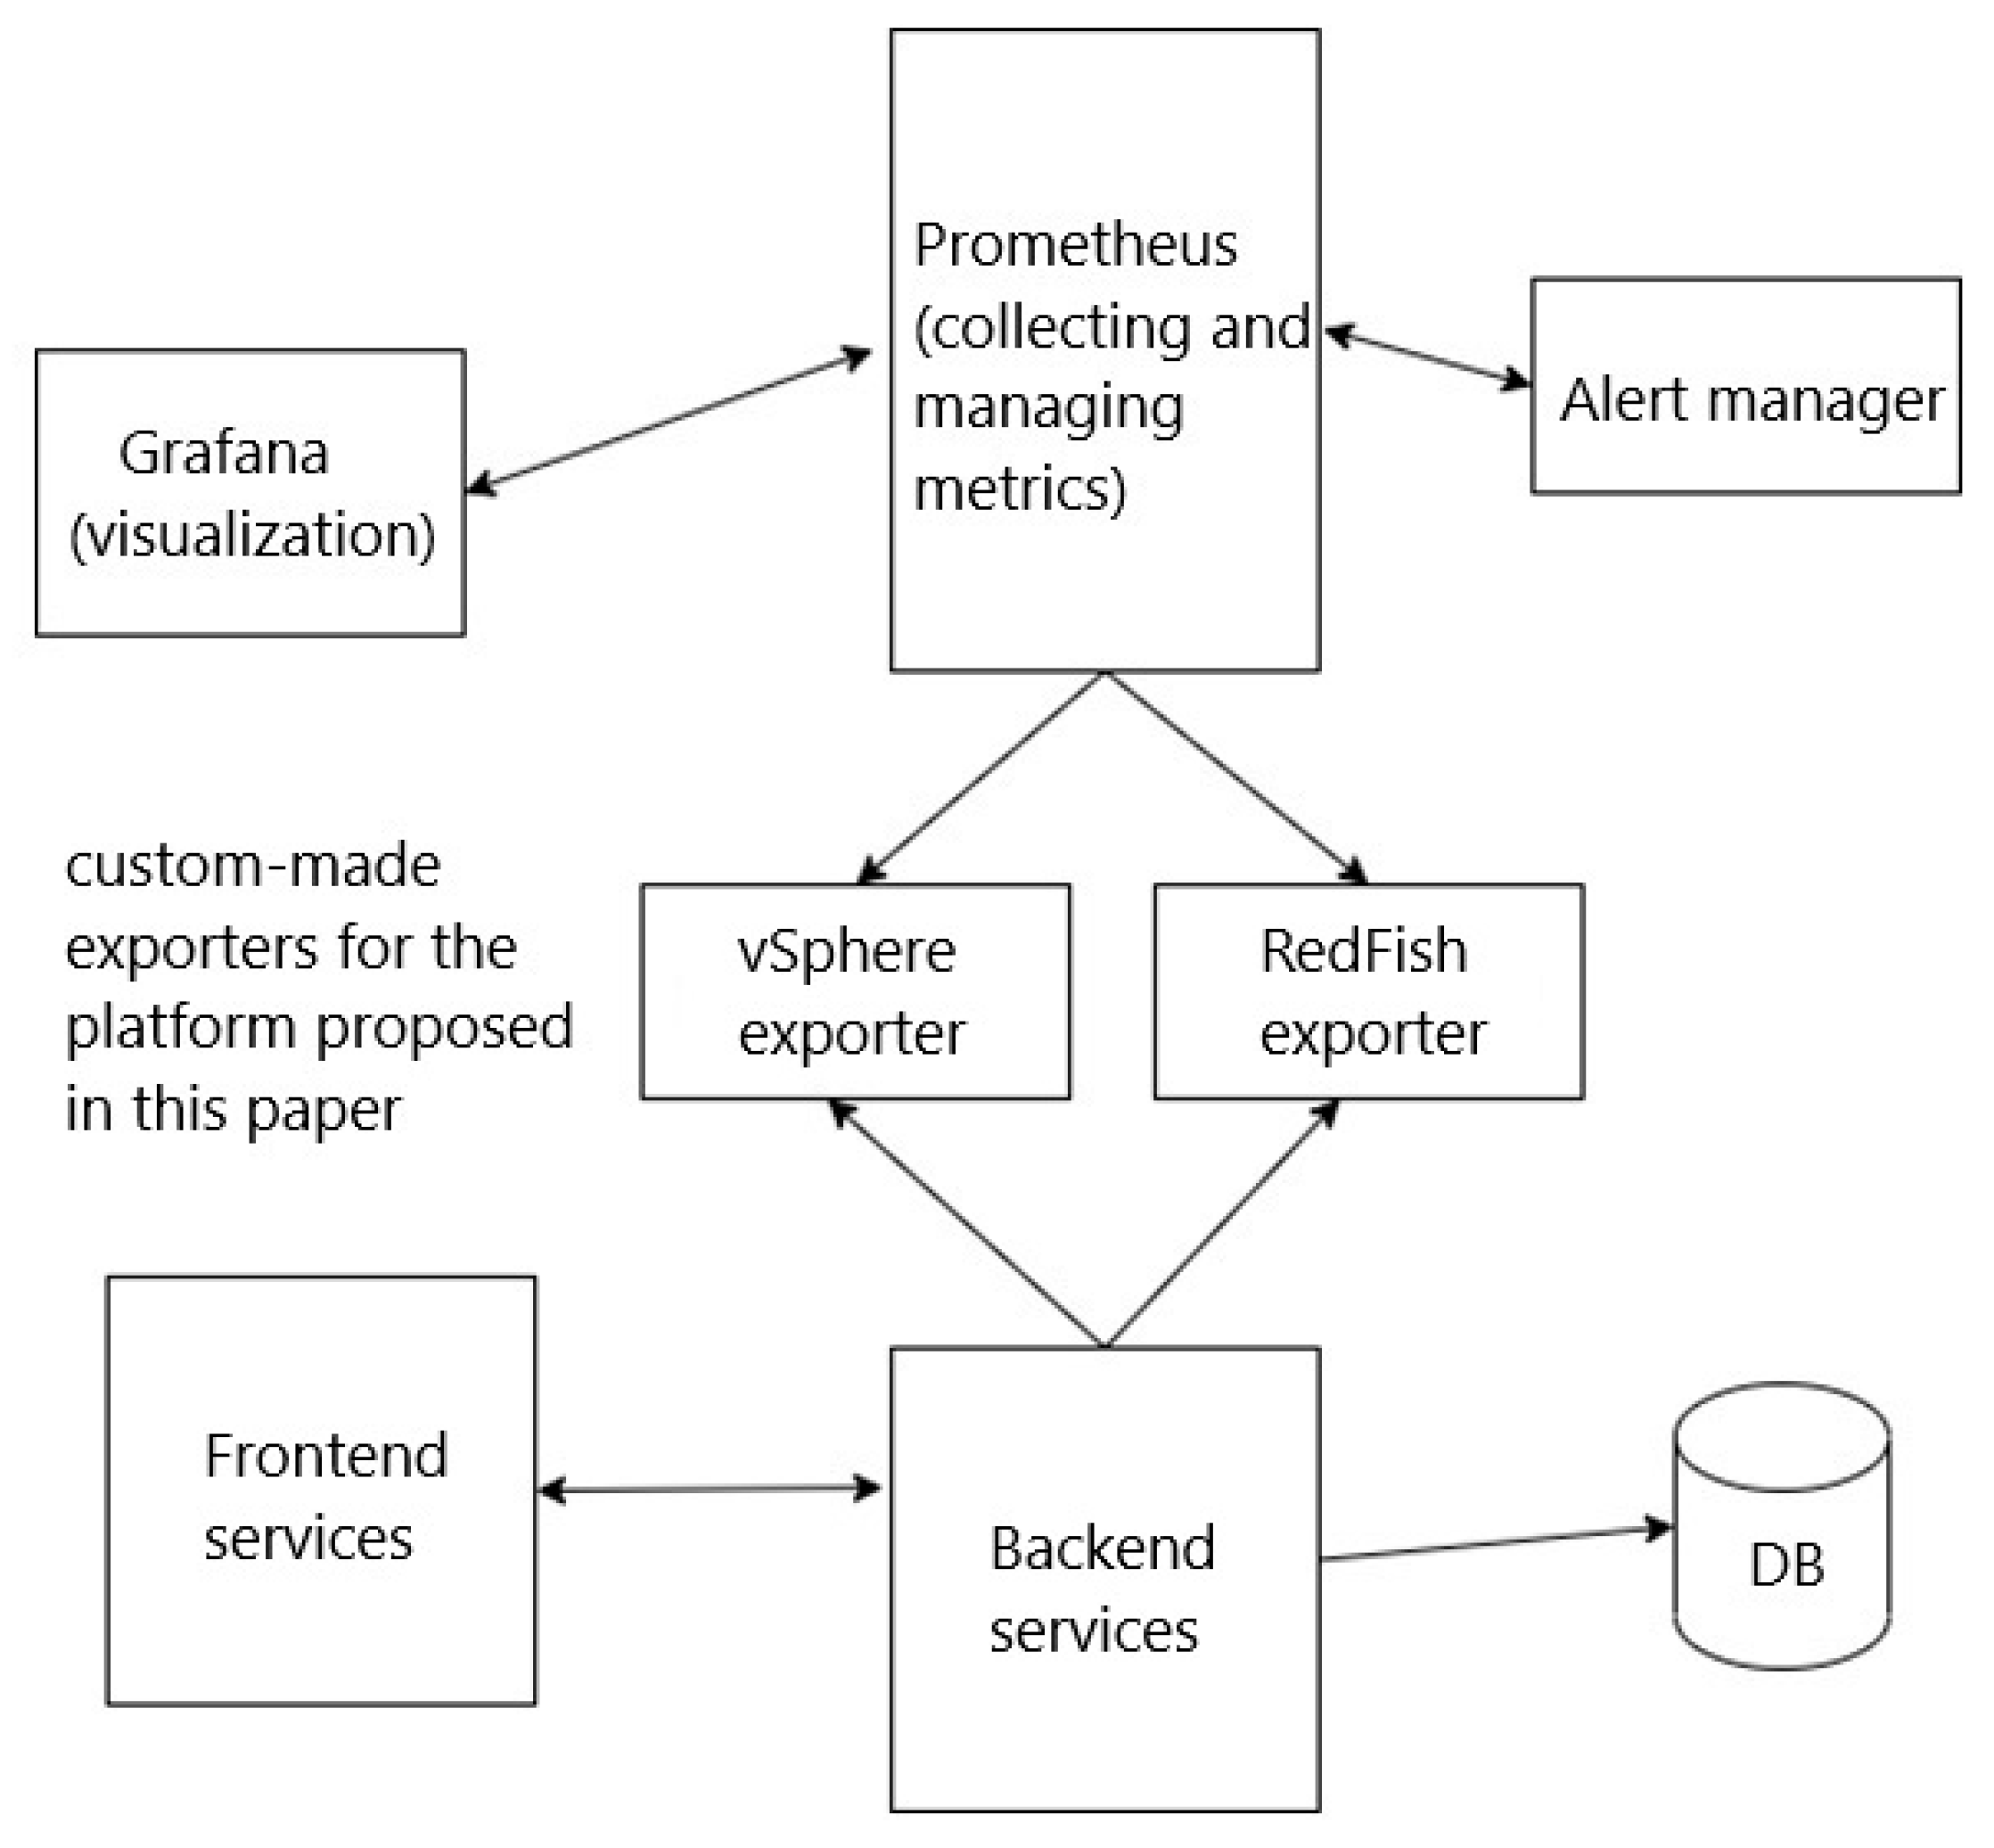
The system comprises a user web application that establishes a connection with the server through the Representative State Transfer Application Programming Interface (REST API). The server is responsible for the creation and management of agents, as well as the storage of data in the Postgres database, as shown in
Figure 1.
The RedFish client establishes a connection with the iLO API, while the vSphere client establishes a connection with the vSphere API. The platform proposed in this paper allows the usage of multiple instances of these two clients. Commonly, an infrastructure using this platform would run one or more (low number) vSphere exporters that connect to vCenter servers and many instances of the RedFish exporter (to connect to every RedFish controller on the network. The Prometheus “pull” method fetches data from the agents and stores it internally.
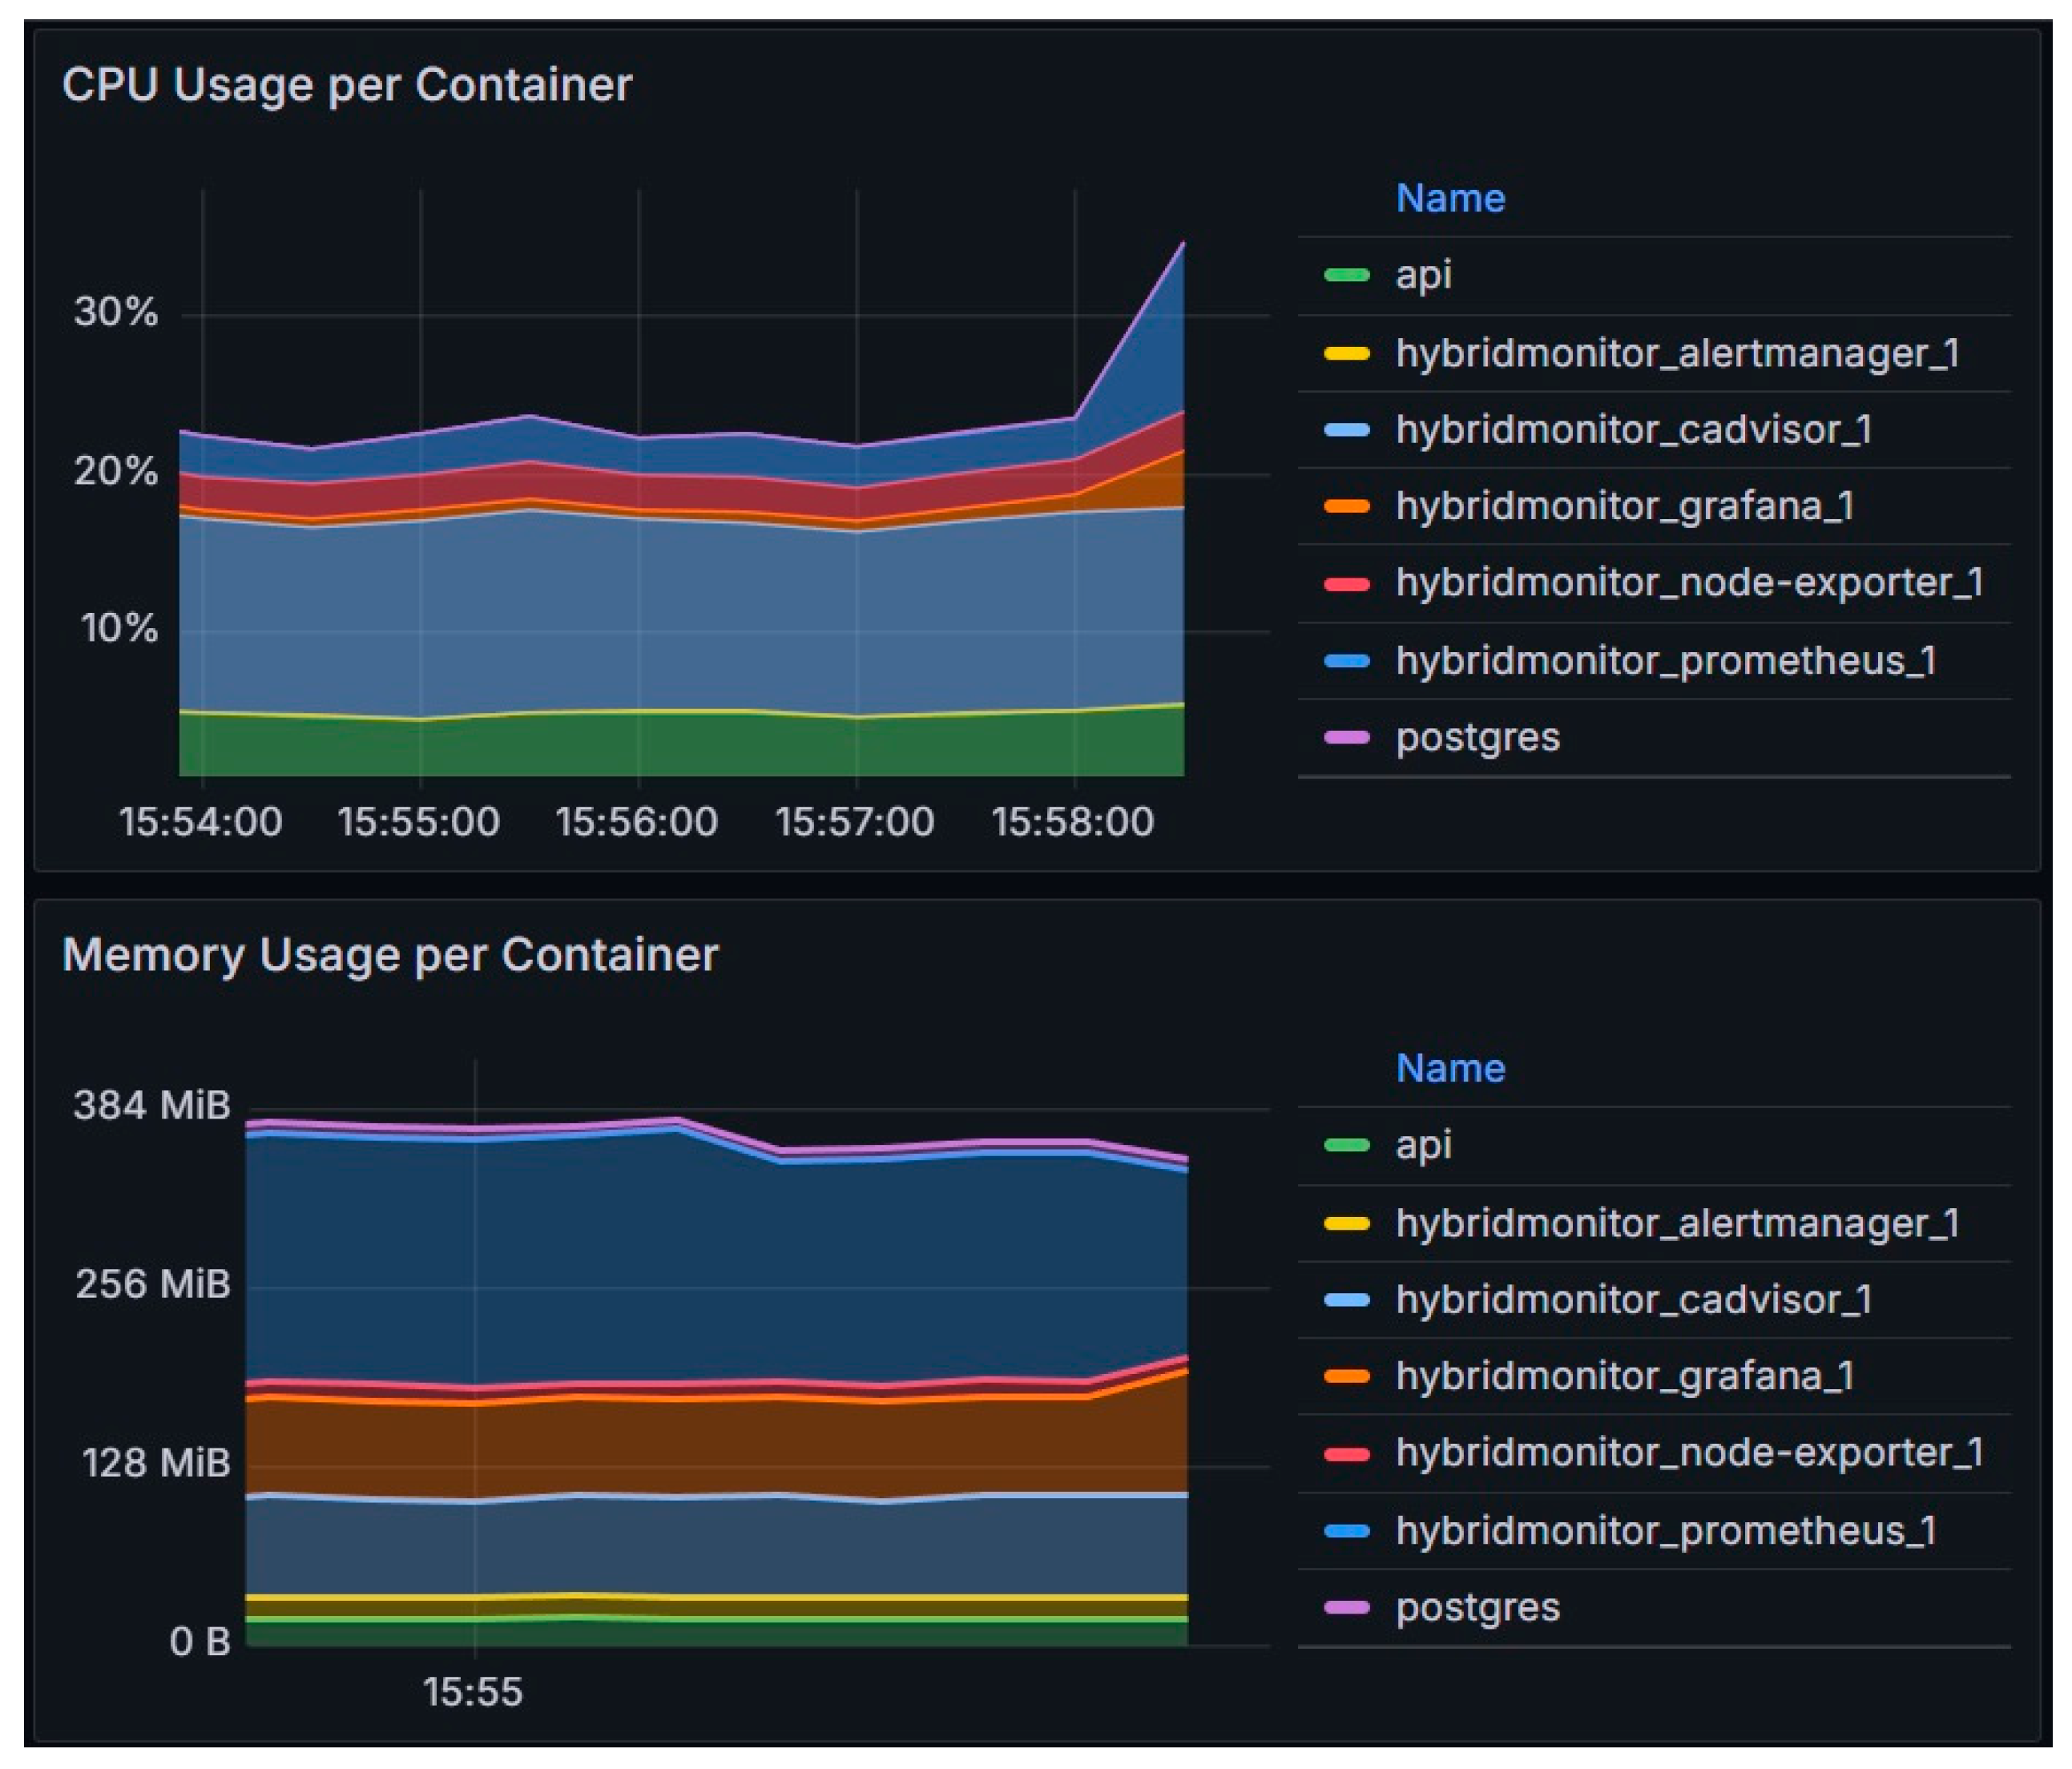
Implementation of the proposed system architecture is very resource-efficient, as can be seen in the
Figure 2.
Aalert rules are configured within Prometheus, which dispatches alerts to the alert manager responsible for handling notifications. Grafana was utilized for data visualization, employing PromQL to generate queries for the Prometheus data source. This architecture was developed using Prometheus 2.40.0, Alertmanager 0.24.0, and Grafana 9.2.4. On the server side, vSphere 7.0u3 was used.
This architecture was developed as a modular part of a more extensive architecture related to the HPC data center, as described in another paper [
23]. It served as a critical research area for determining how multiple remote monitoring sources can be used in a unified matter to gain insight into the state of the server hardware. This is important because the developed HPC architecture relies on servers working and analyzes the risks associated with running a workload on a server. For example, if a server has a failed RAM stick, it would be prudent not to place a new workload on that server until the RAM issue is resolved.
Let us now discuss these services to explain their interactions and interoperability further.
4.1. Backend Service
The backend is implemented in Golang 1.19, utilizing the Echo library 4.9.1. The Echo library is a web application framework designed to enhance performance and improve manageability by scaling multiple devices.
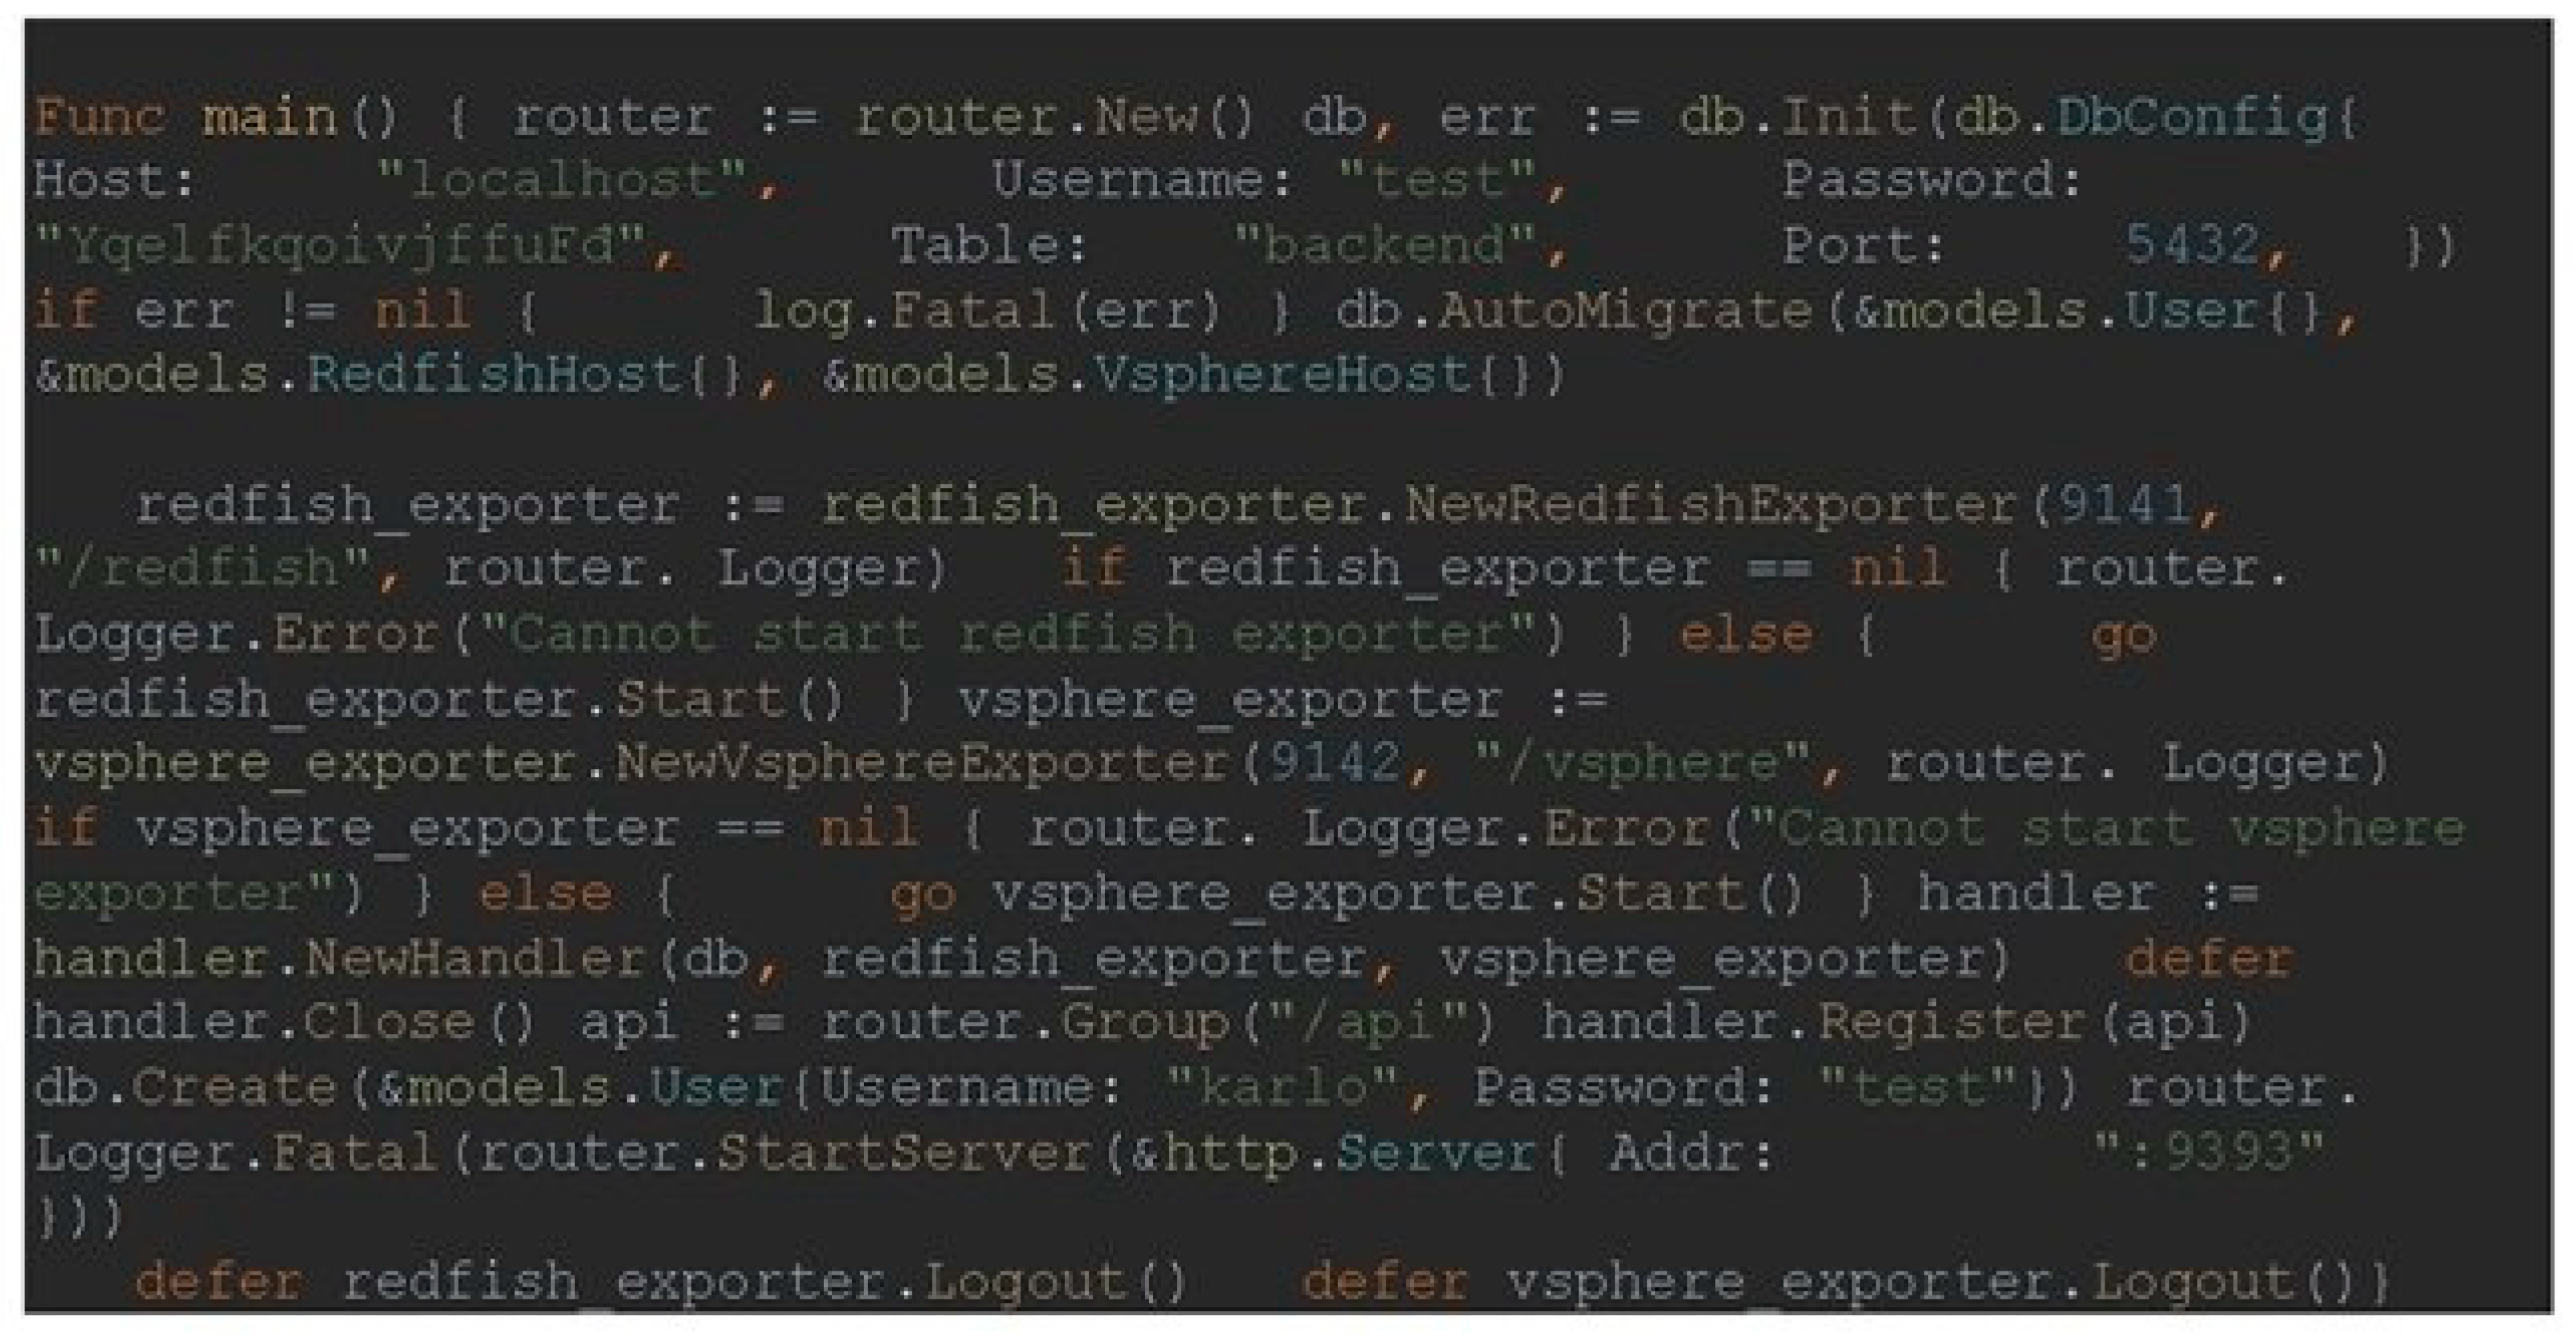
The user’s web application communicates with the web server by transmitting a representative state. The system establishes a connection with the database during the initialization process and generates tables. It then executes the RedFish and vSphere agents, configures routes, and activates a web server.
Upon logging in, a JWT (JSON Web Token) token is utilized to verify the user’s identity. Creating a new agent instantiates a fresh RedFishClient object that establishes a connection with the designated server. The connection is added to the collection, which is then added to the collection during the scraping process. Scraping is employed to extract data from all interconnected servers.
Figure 3 shows part of the code used for the central part of the backend service.
During the request, an authorization token in the request header is verified.
4.2. Custom RedFish Agent
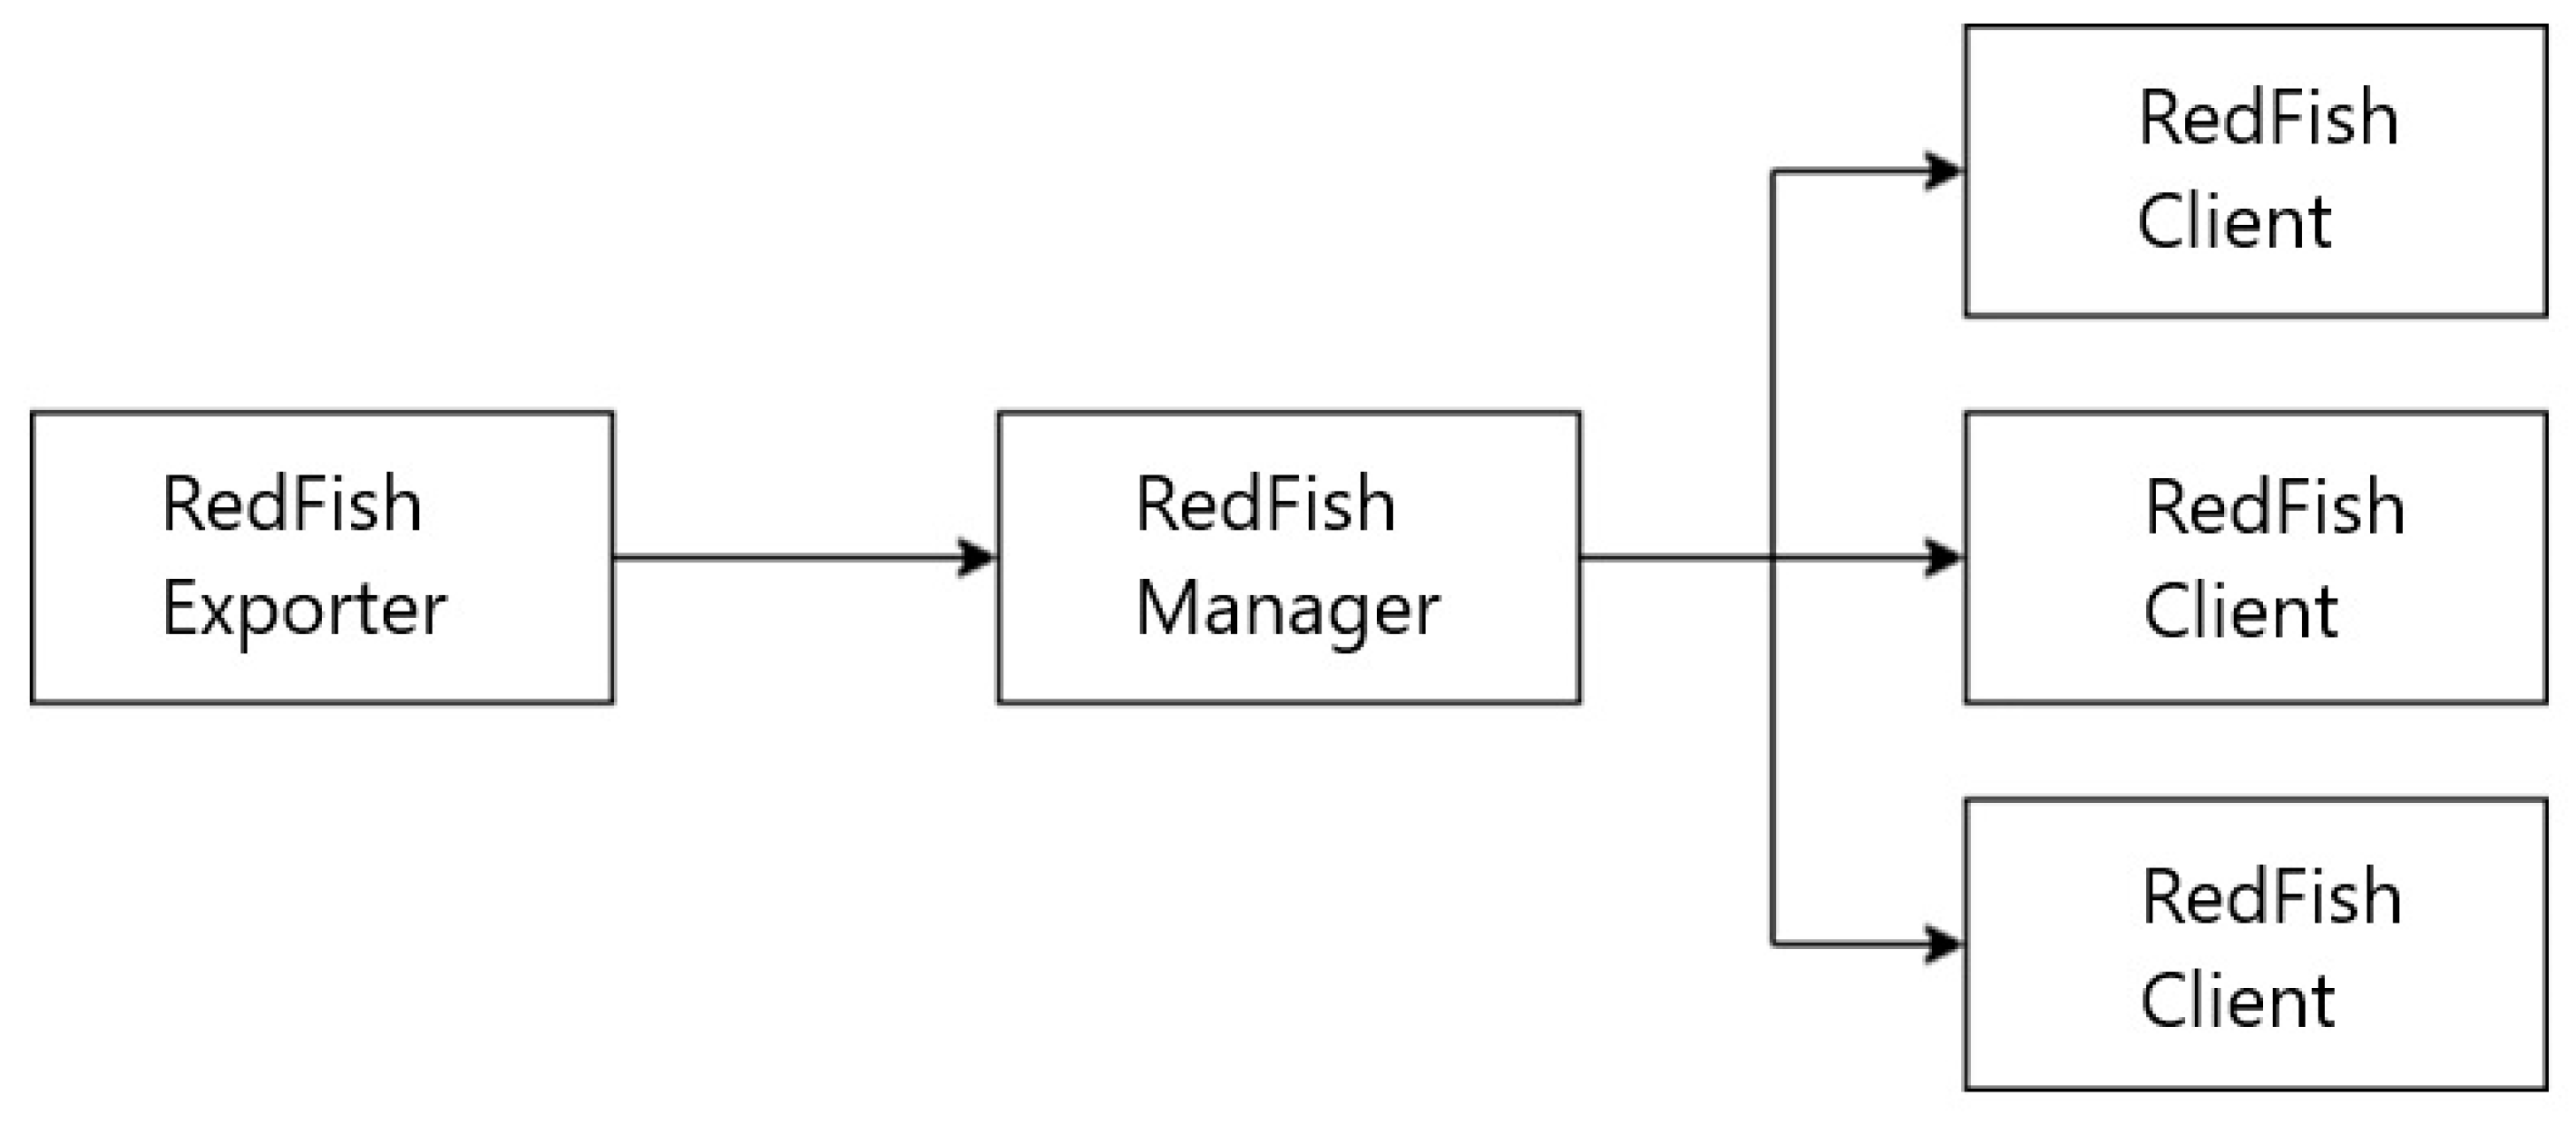
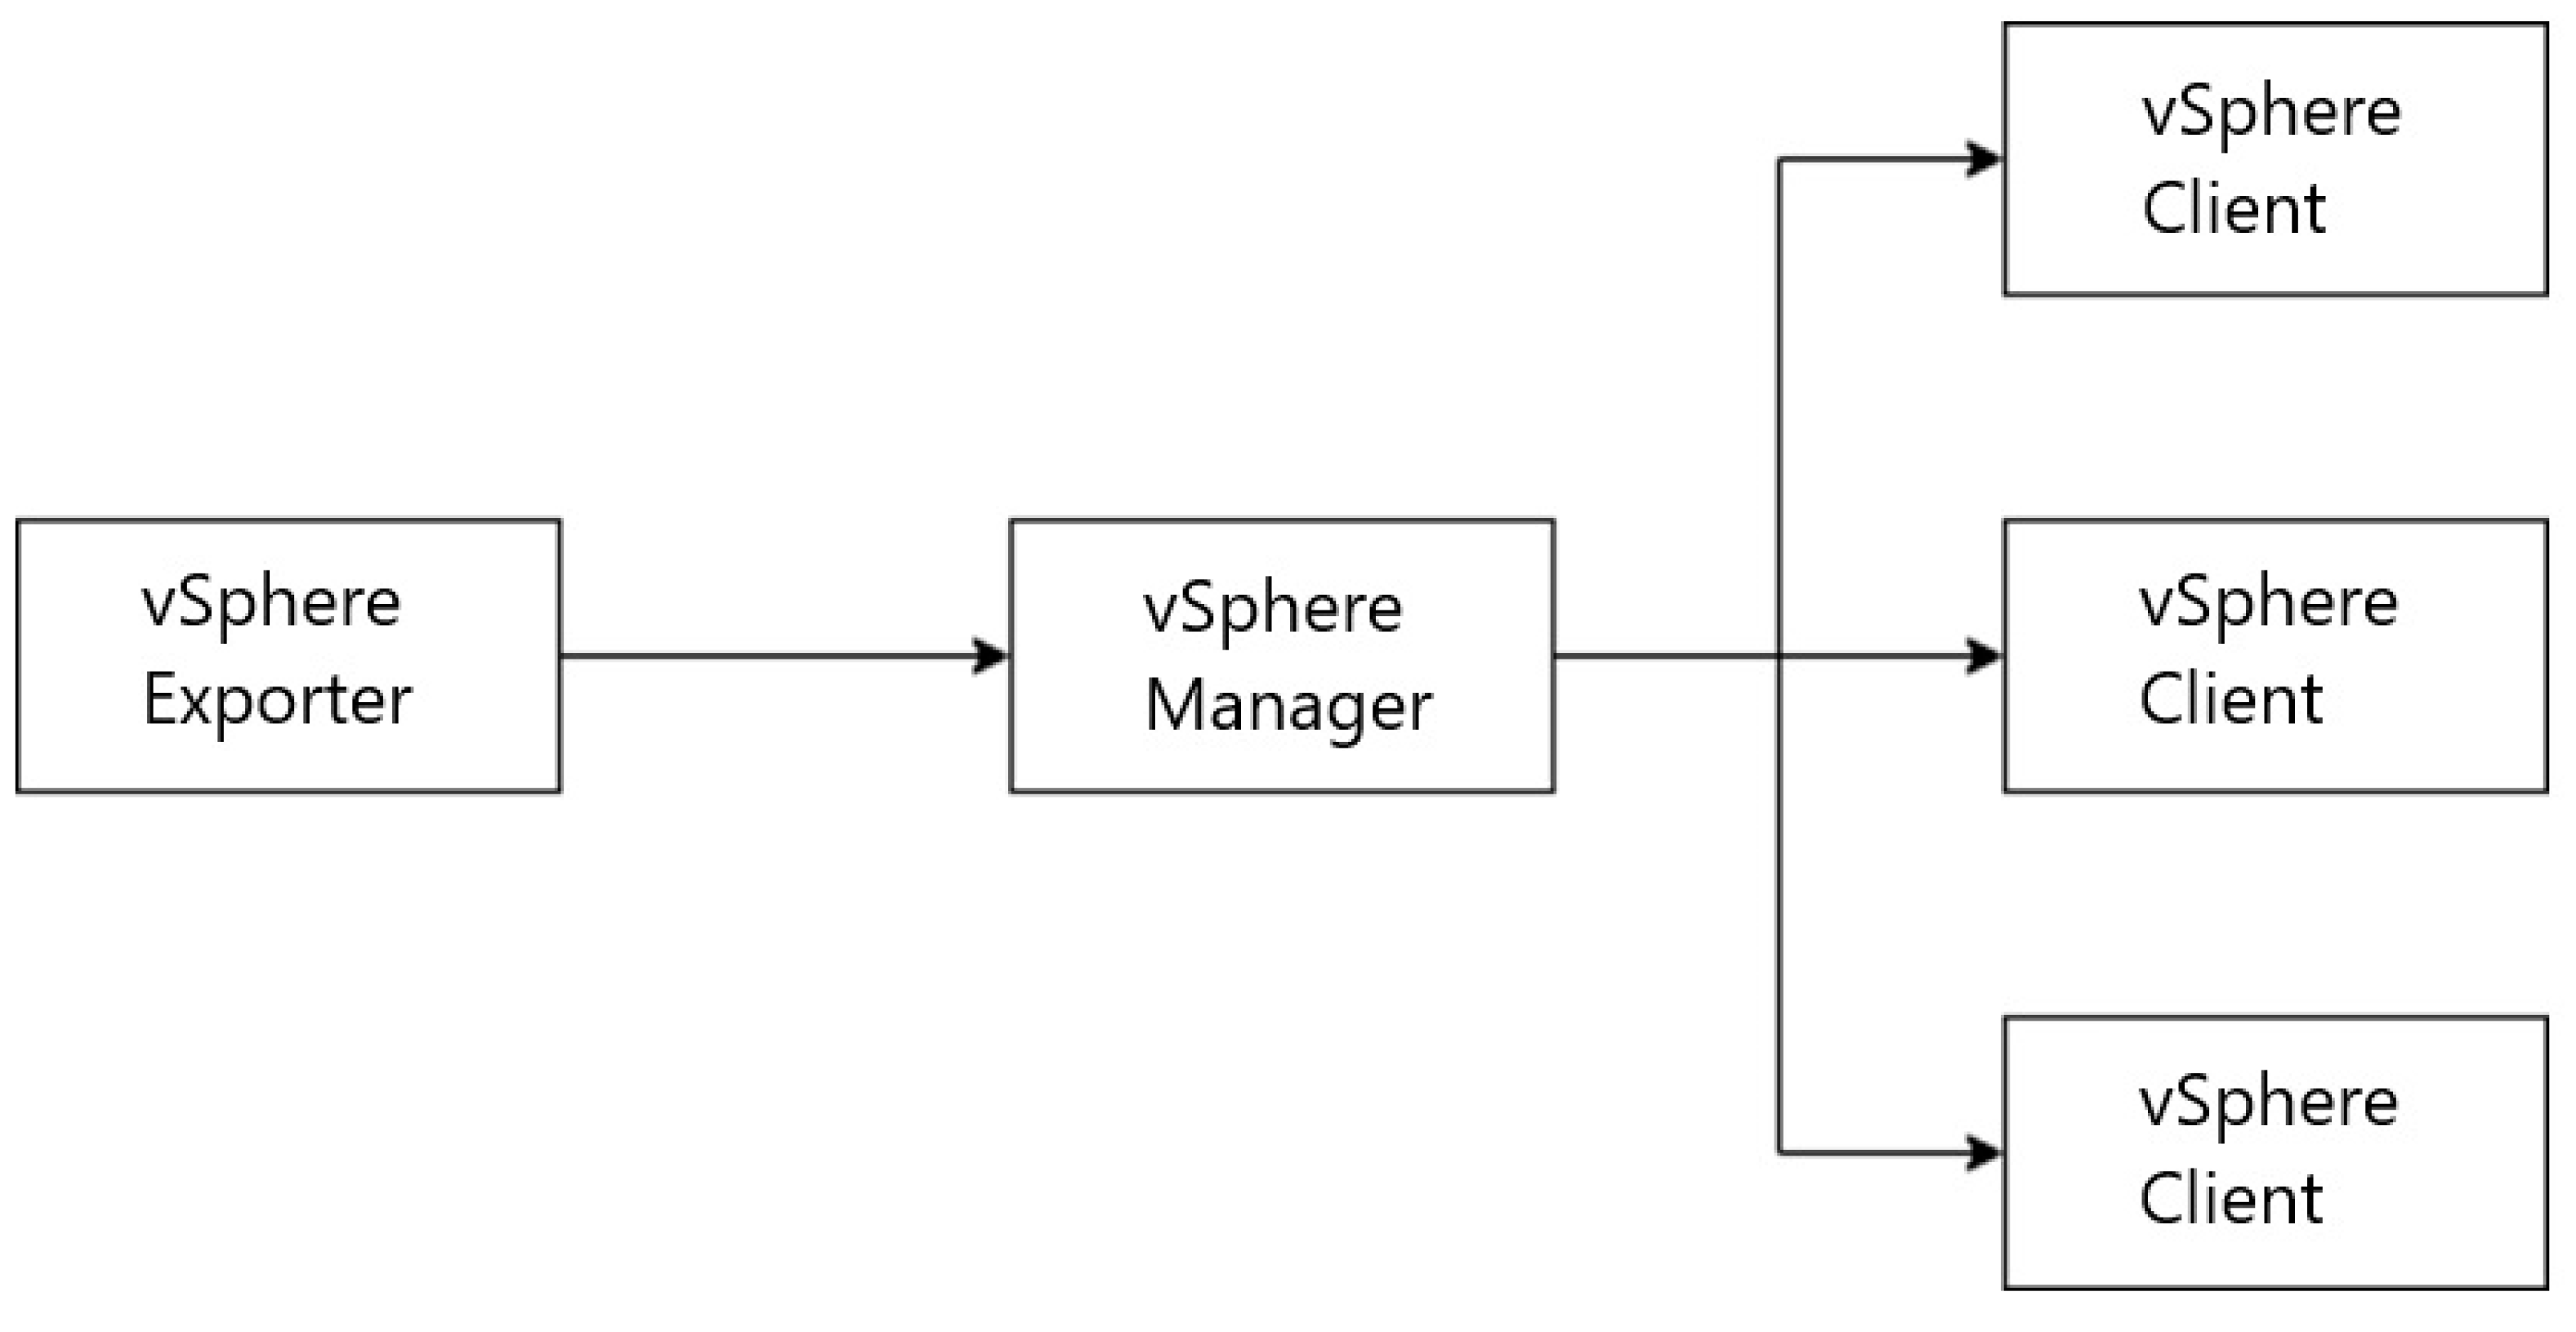
The addition of RedFish server functionality was accomplished by abstracting the RedFish agent, manager, and client, as shown in
Figure 4.
The code contains a RedFish agent named RedFishExporter. This aims to activate the web server, initialize the RedFish manager, and establish the Prometheus registry. The RedFishExporter structure includes several elements. The Port element is a numeric value that specifies the port on which the web server will listen. The MetricsPath element is a text value that determines the route where the collected data will be accessible. The Server field is a pointer to the HTTP instance. The server is configured to enable the configuration and operation of the web server. RedFishManager refers to an example of RedFishManager that oversees the connections and configurations of RedFish clients.
The register variable is a pointer to the memory address of the Prometheus object. The registry records Prometheus collectors and gathers their metrics.
The NewRedFishExporter function initializes the Prometheus registry and the RedFish manager. If the RedFish manager meets the requirements of the Prometheus collector interface, it is added to the registry.
The Prometheus collector interface requires the presence of a Describe method for adding descriptions of metrics, as well as a Collect method for collecting metrics. A new route for /RedFish is created, in which the web server will utilize the MetricsHandler method to present the data gathered from the previously included RedFish hosts. Ultimately, a RedFishExporter object is returned, as shown in
Figure 5.
The RedFishClient class implements several methods. These include GetSession, which retrieves or updates a session; CreateRequest, which creates a custom request containing an X-Auth-Token; GetPower, which retrieves the server’s current electricity consumption; GetThermal, which retrieves the temperature and status data of the components and sensors; and Logout, which logs out of the session.
The sensor metrics are divided into two categories. The Sensor Health metric includes the server address labels, component number, sensor name, and physical location. The value is assigned an enumeration, where 1 represents the correct state, and 0 represents the incorrect state. The sensor temperature metric includes the server address labels, sensor number and name, physical location, unit of measurement, and critical and fatal temperature limits.
4.3. Custom vSphere Agent
The additional functionality for connecting to the vSphere hypervisor is implemented by abstracting the vSphere agent, manager, and client. The agent’s structure mirrors the implementation structure of the RedFish agent. The vSphere agent in the code is called VsphereExporter. The difference between the RedFish and vSphere agents is in the client and manager. The manager differs in the types of metrics it collects, so the Collect and Describe methods vary, as shown in
Figure 6.
The status metric includes labels for the ESXi server addresses and vCenter addresses. The value is assigned an enumeration, with 2 representing the correct condition, 1 representing a warning, and 0 representing a critical condition.
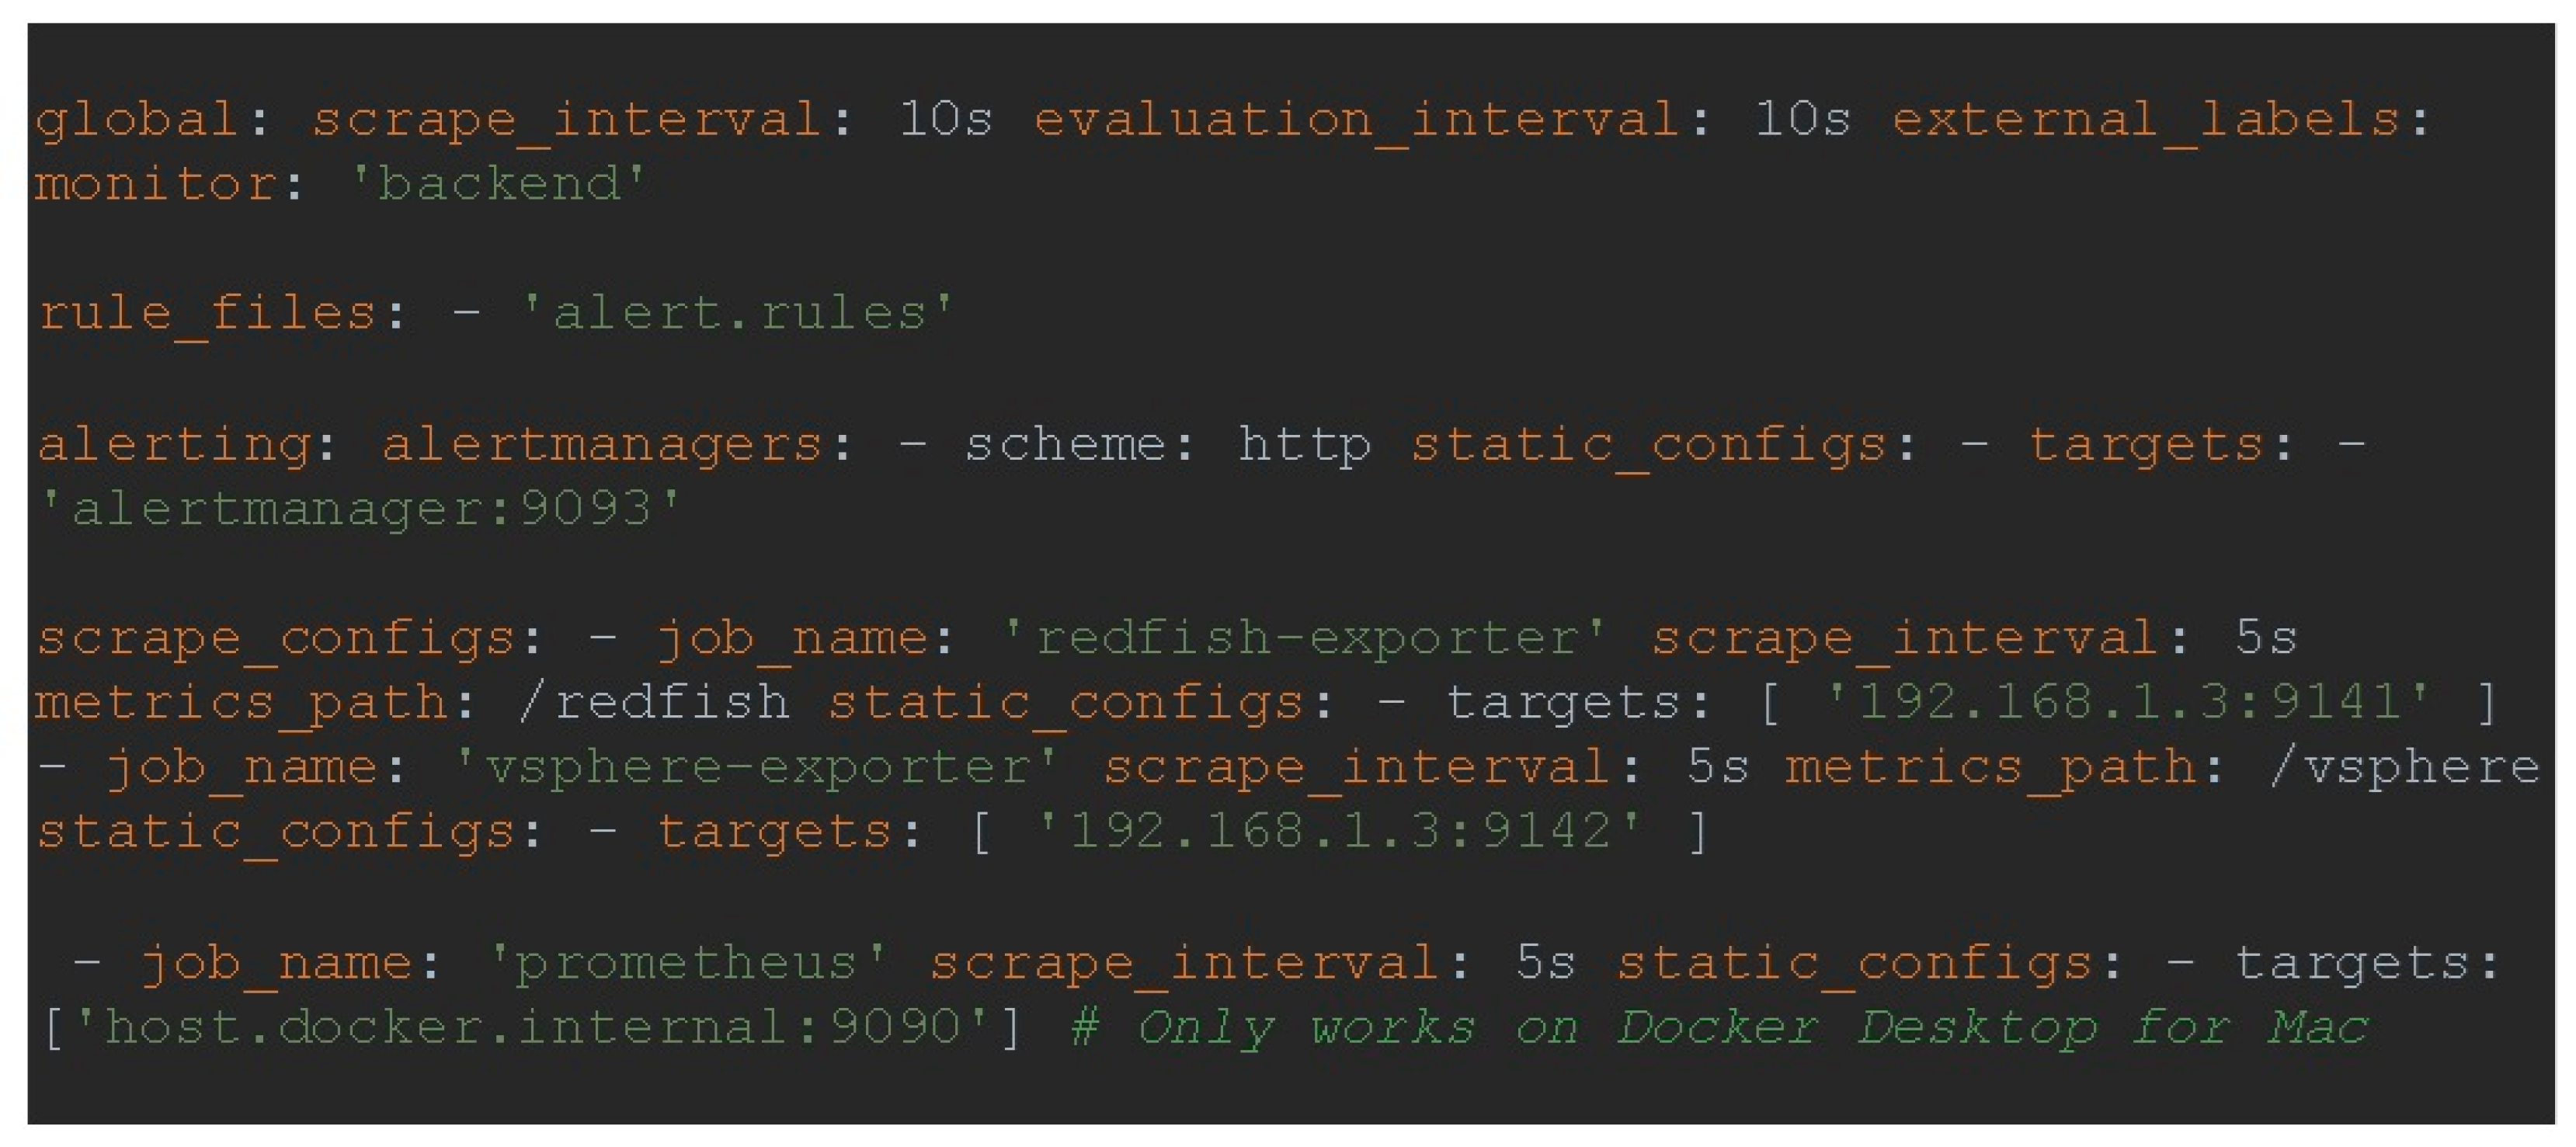
4.4. Prometheus
To ensure proper configuration, it is imperative to edit the prometheus.yml file and define the sections for global, rule_files, alerting, and scraping_configs. The Global configuration dictates the predetermined settings. The scrape_interval parameter determines the spacing between data collections. The rule_files function establishes a connection to the alert.rules file, which houses the specific criteria to activate a particular action. Alerting specifies the location of the Alertmanager service. Scrape_configs is a collection of settings that determine the data Prometheus will collect from the exporter’s parameters, as shown in
Figure 7.
A practical method for incorporating rules for alerts is utilizing the rule_files feature within the prometheus.yml file. Service_rules consists of three specific rules: service_down, sensor_down, and fan_down. The first rule universally applies to all services, including the up metric. An alarm will be activated if the service remains inactive for two minutes. If the component sensor or fan sensor fails to operate for one minute, an alarm will be activated by the other two rules, as shown in
Figure 8.
Grafana provides a more accessible way of creating rules and conditions, using various sources to present the acquired information in real-time.
4.5. Alertmanager
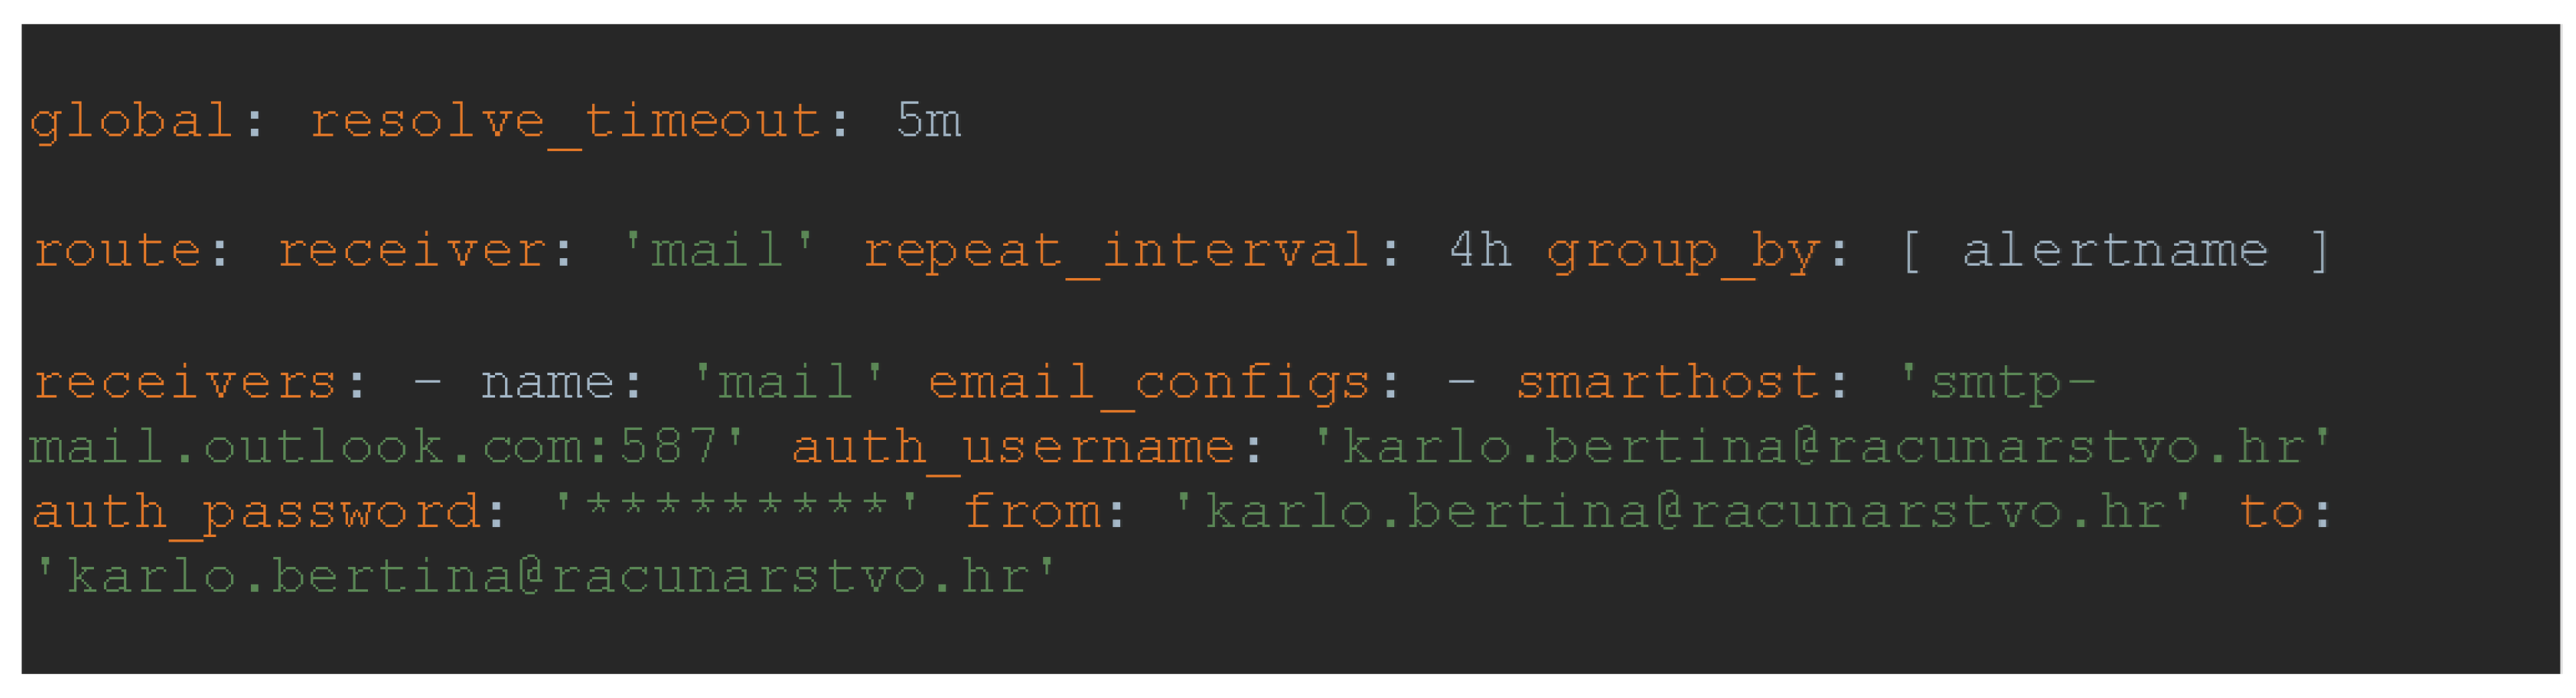
Alertmanager dispatches notifications to the email channel specified in the config.yml configuration file, as shown in
Figure 9.
One of the benefits of this system is that it allows for the grouping of alerts with similar parameters into a single notification. Additionally, it provides the ability to temporarily silence alerts based on specific conditions set on the web interface.
4.6. Grafana
Grafana is a tool for creating graphs using different input sources. In this case, it is used to visualize the data collected in Prometheus. A default user account must be added to the configuration.monitoring file to access the user interface. One way to add a data source is through the datasource.yml configuration file, as shown in
Figure 10.
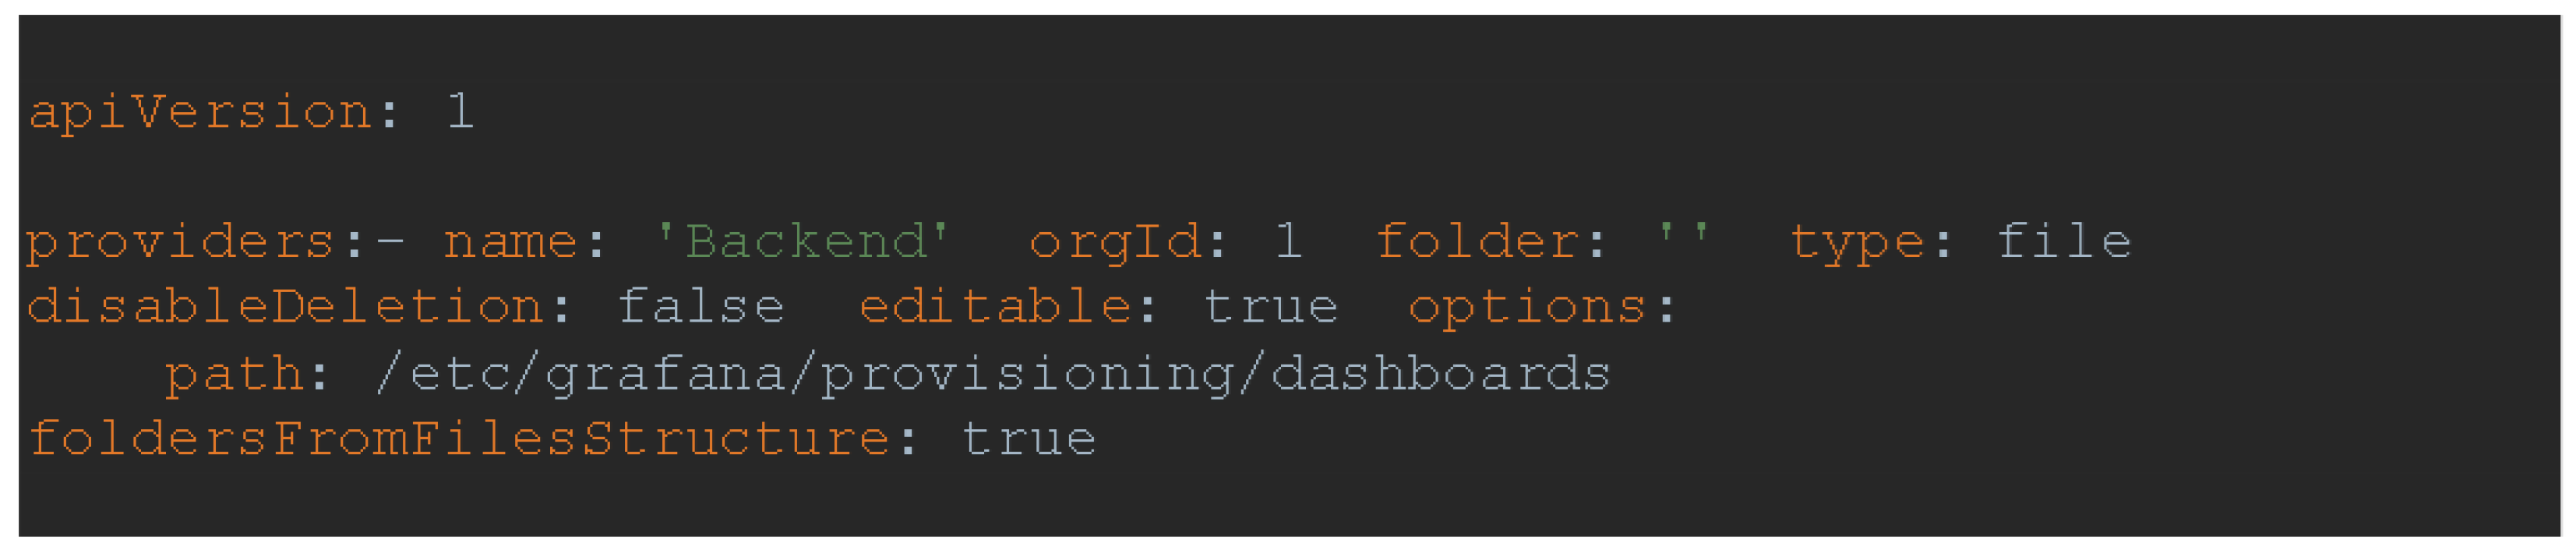
One way to add dashboards is through provisioning, by adding the provisioning/dashboards/dashboard.yml configuration file that will register all the dashboards located in the /etc/grafana/provisioning/dashboards directory of the container. That directory is mapped from local storage to the Grafana container, so it is available to add.
This method is convenient because it automatically adds data sources and dashboards when you start Grafana. The dashboard is created via the Grafana user interface, exported in JSON (JavaScript Object Notation) format, and stored in the provisioning/dashboard directory, as shown in
Figure 11.
The provisioning dashboard configuration mode enables automated access to preconfigured dashboards upon launching the Grafana service.
4.7. Frontend Services
The user web application was created utilizing the Vue.js JavaScript framework and the Quasar library. This combination allows for the efficient development of responsive websites and applications that are compatible with web browsers and easily converted into mobile applications.
The software package includes pre-built elements such as forms, dialogs, and buttons. Quasar handles reducing the size of HTML/CSS/JS files and converting ES6 code while adhering to the most effective techniques in web development. The development process is executed using the “quasar dev” command, which offers real-time updates of any changes made.
The user interface enables you to authenticate into the system and input RedFish and vSphere agent login credentials. You can also access the raw data about the agents. Grafana empowers the utilization of dashboards via an iFrame HTML element.
5. Application Capabilities
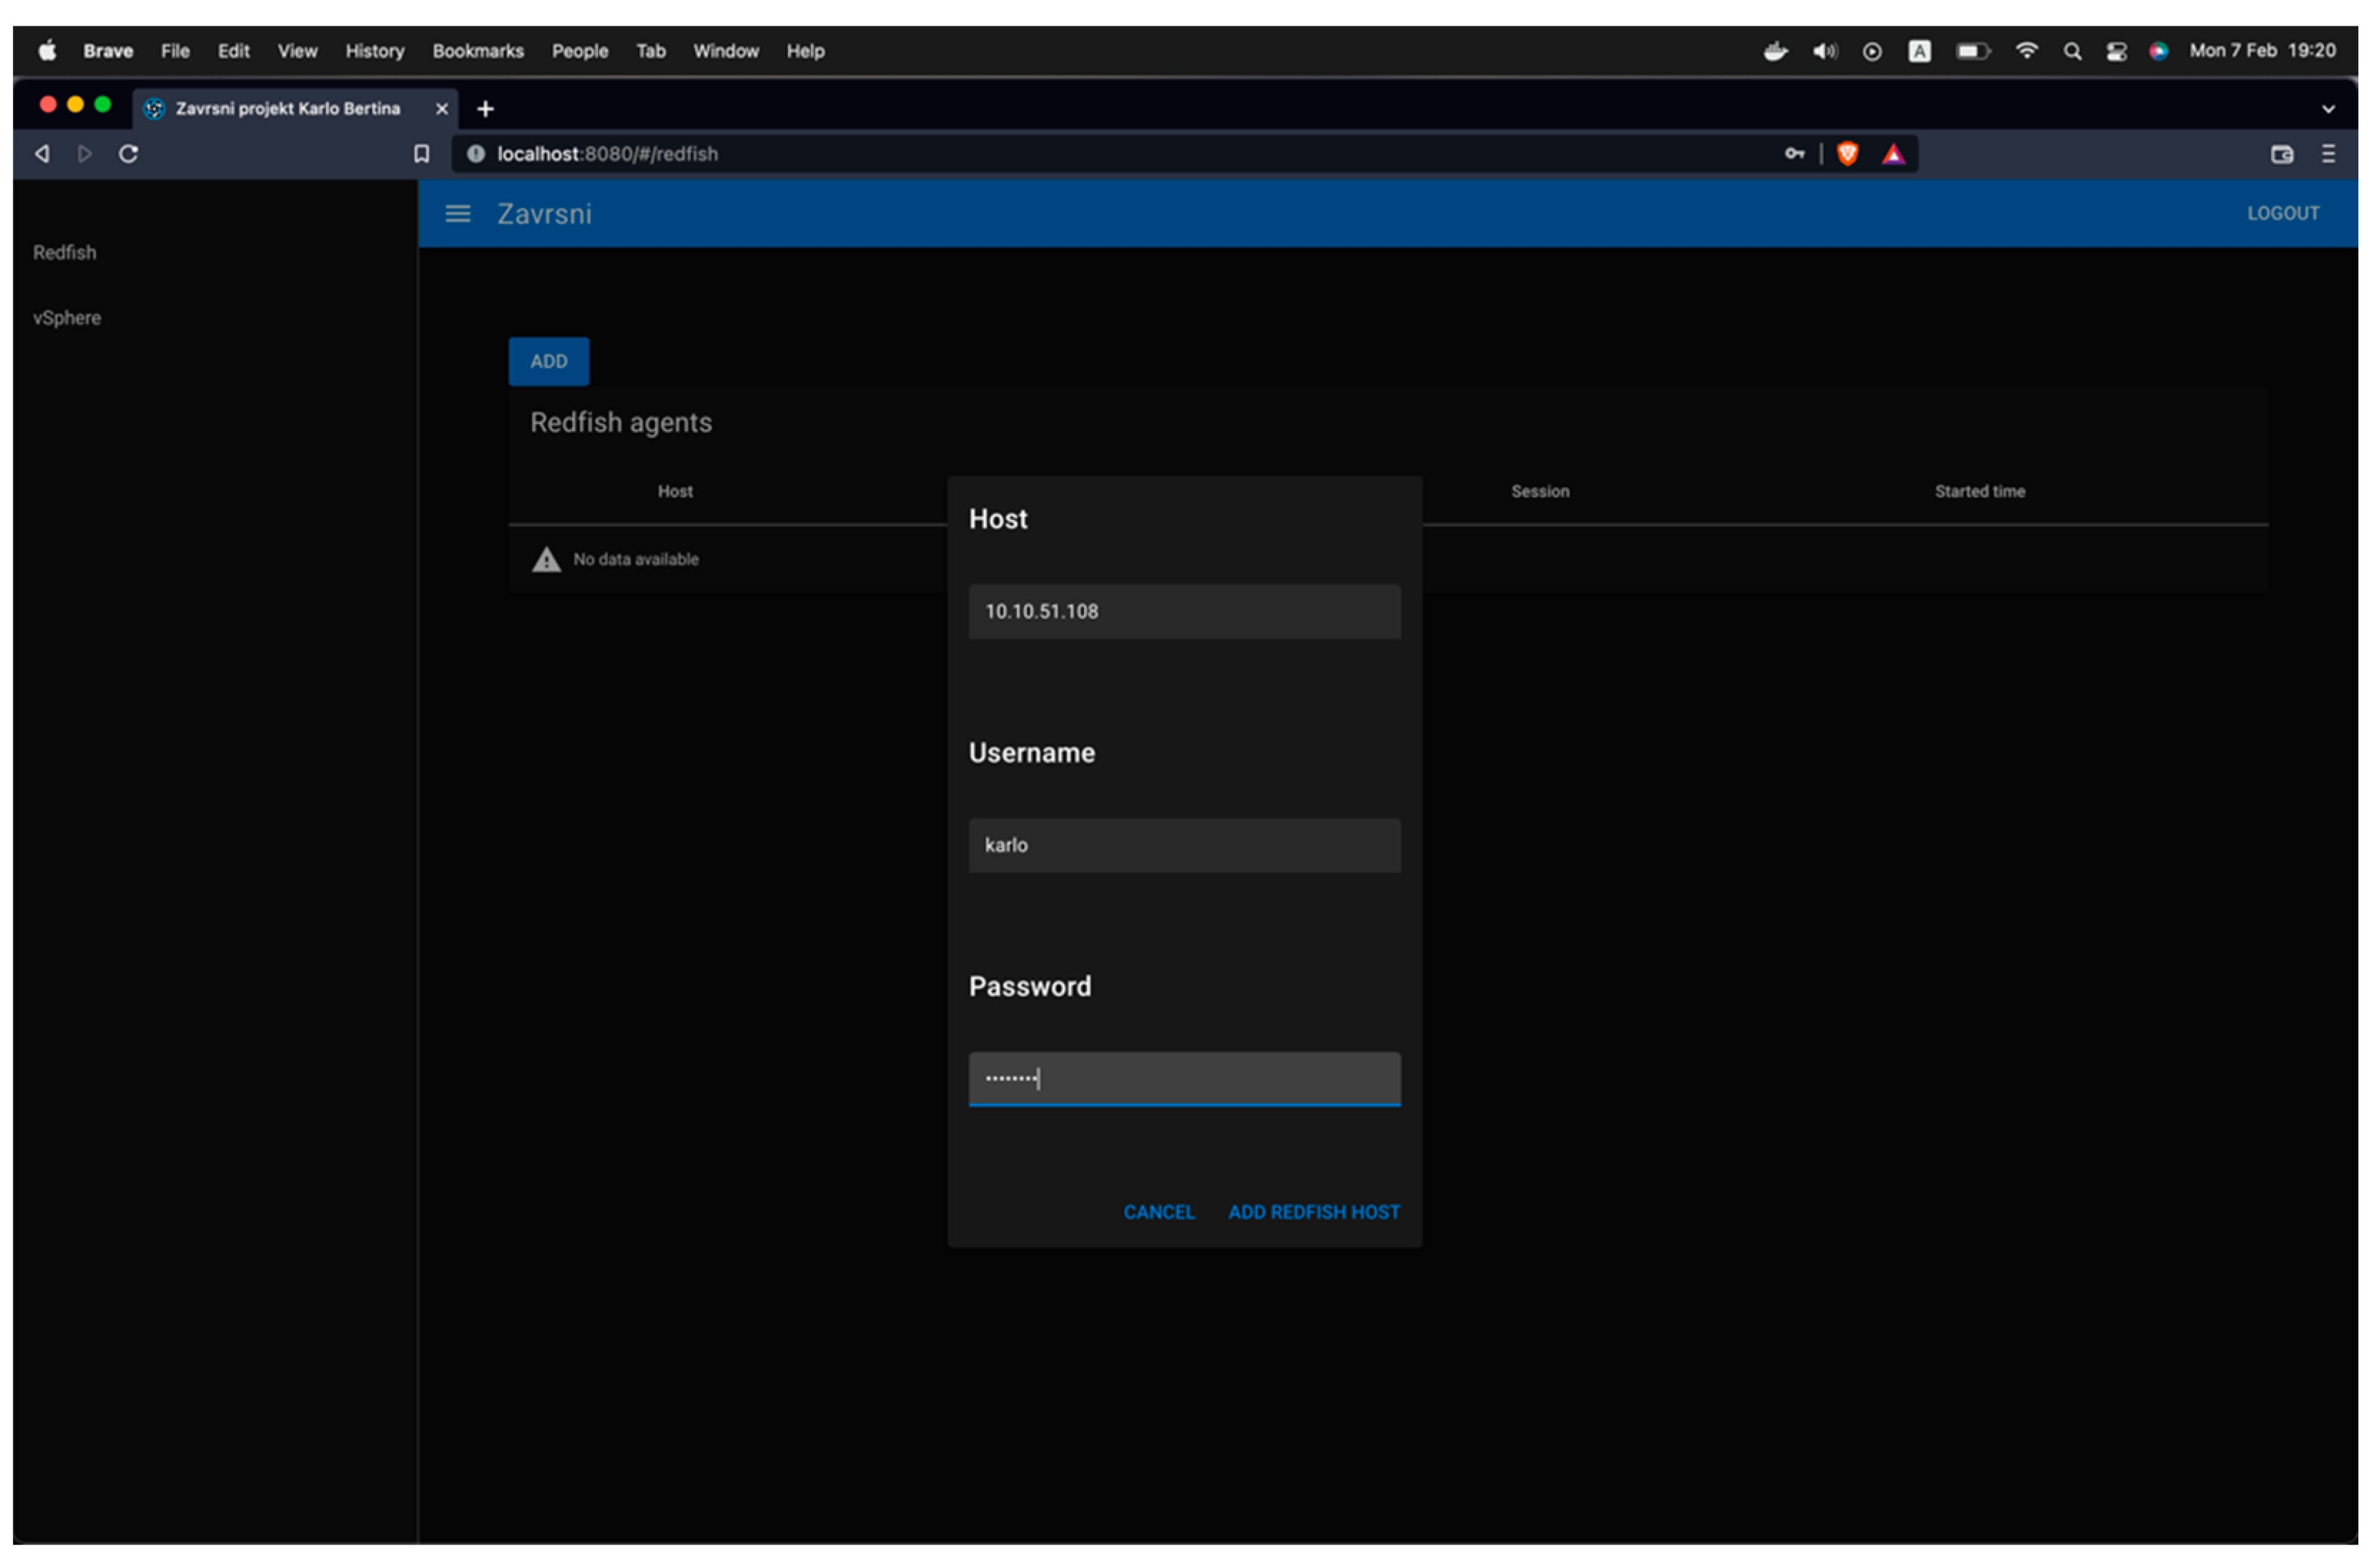
The application that was developed has a set of beneficial capabilities. First and foremost, after logging in, it has a set of wizards to add the RedFish and vSphere agents. For example, the wizard for RedFish is shown in
Figure 12.
After adding the RedFish and vSphere agents, the actual capabilities of our application started to emerge. The first one is the ability to display the server status via the RedFish agent, as shown in
Figure 13.
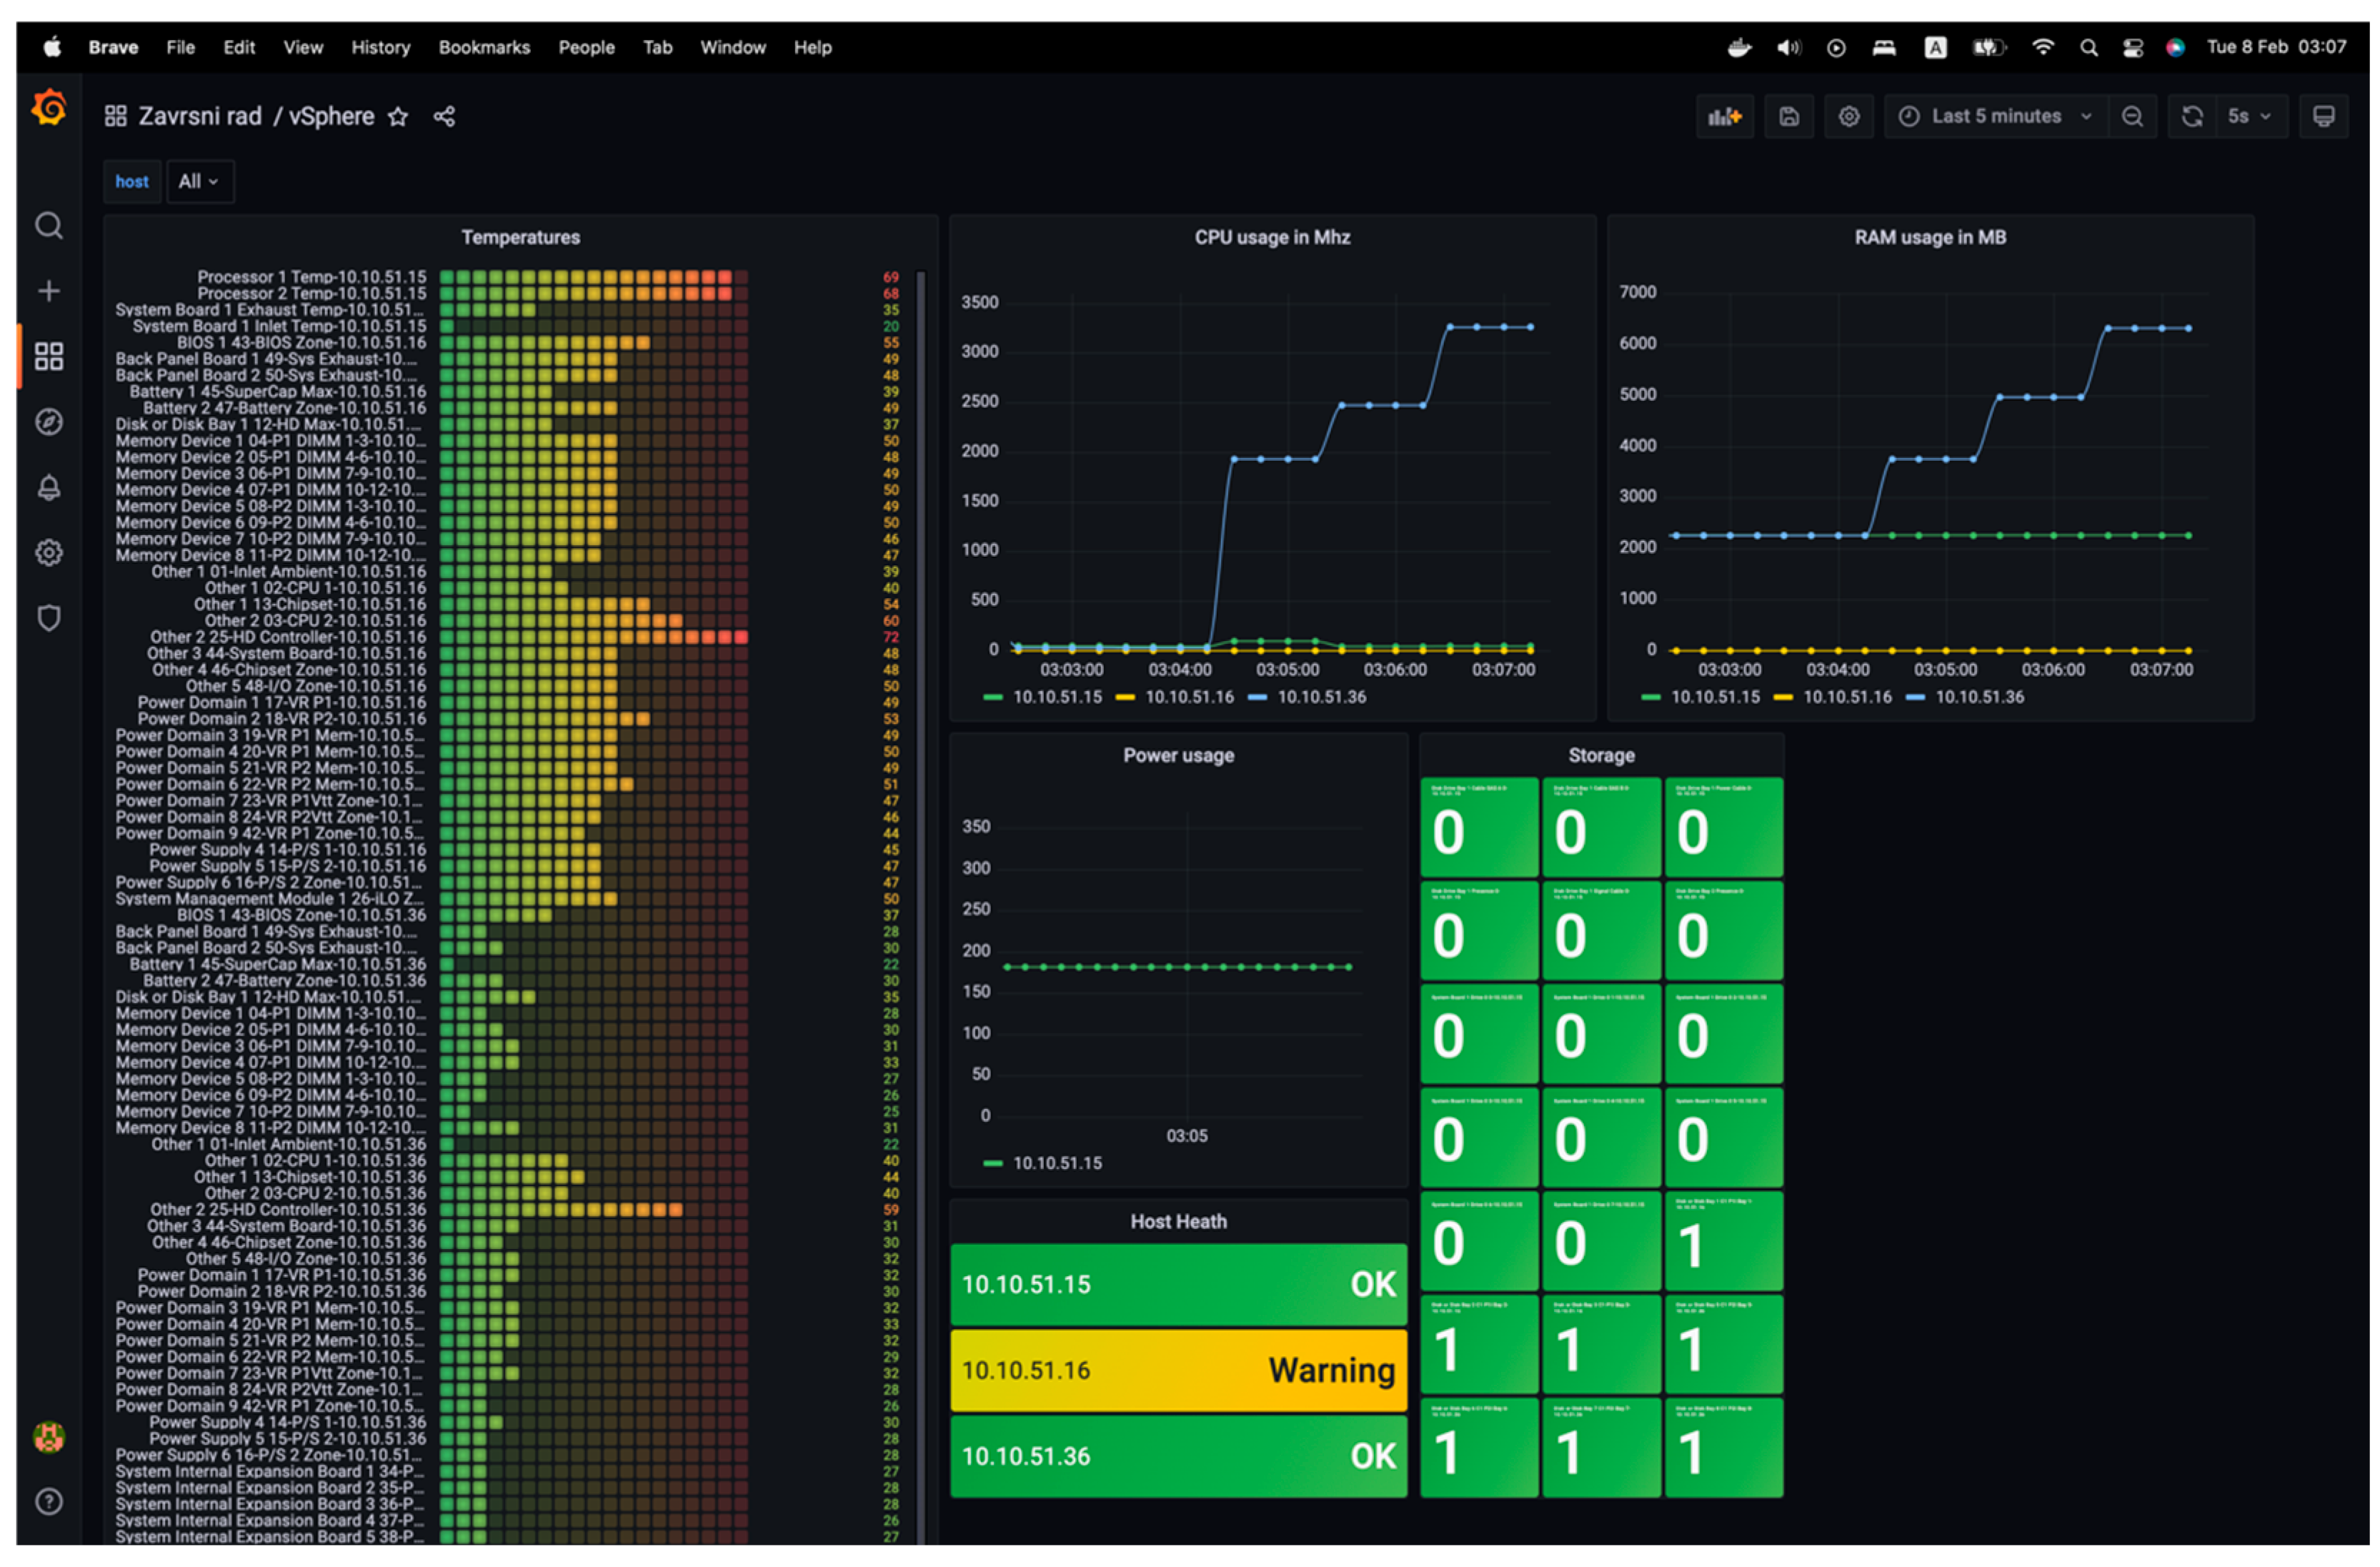
Then, the vSphere agent-based server status dashboard can be used. There is a subtle difference here—a warning is being displayed for one of the servers connected via the vSphere agent, as shown in
Figure 14.
The sensor’s temperature is presented as a bar gauge, with the sensor’s name linked to the corresponding temperature values. The processor utilization is represented by a graph showing the usage amount in the unit of measurement MHz. The RAM utilization is represented by a graph showing the memory amount used, measured in megabytes (MB). The graph also displays the present electricity consumption in Watts. The storage component’s health status is shown as a card containing the disk’s name and corresponding status. The card is green if the disk functions correctly and red if not. The ESXi server’s comprehensive health status is presented as a card, including the server address and current state.
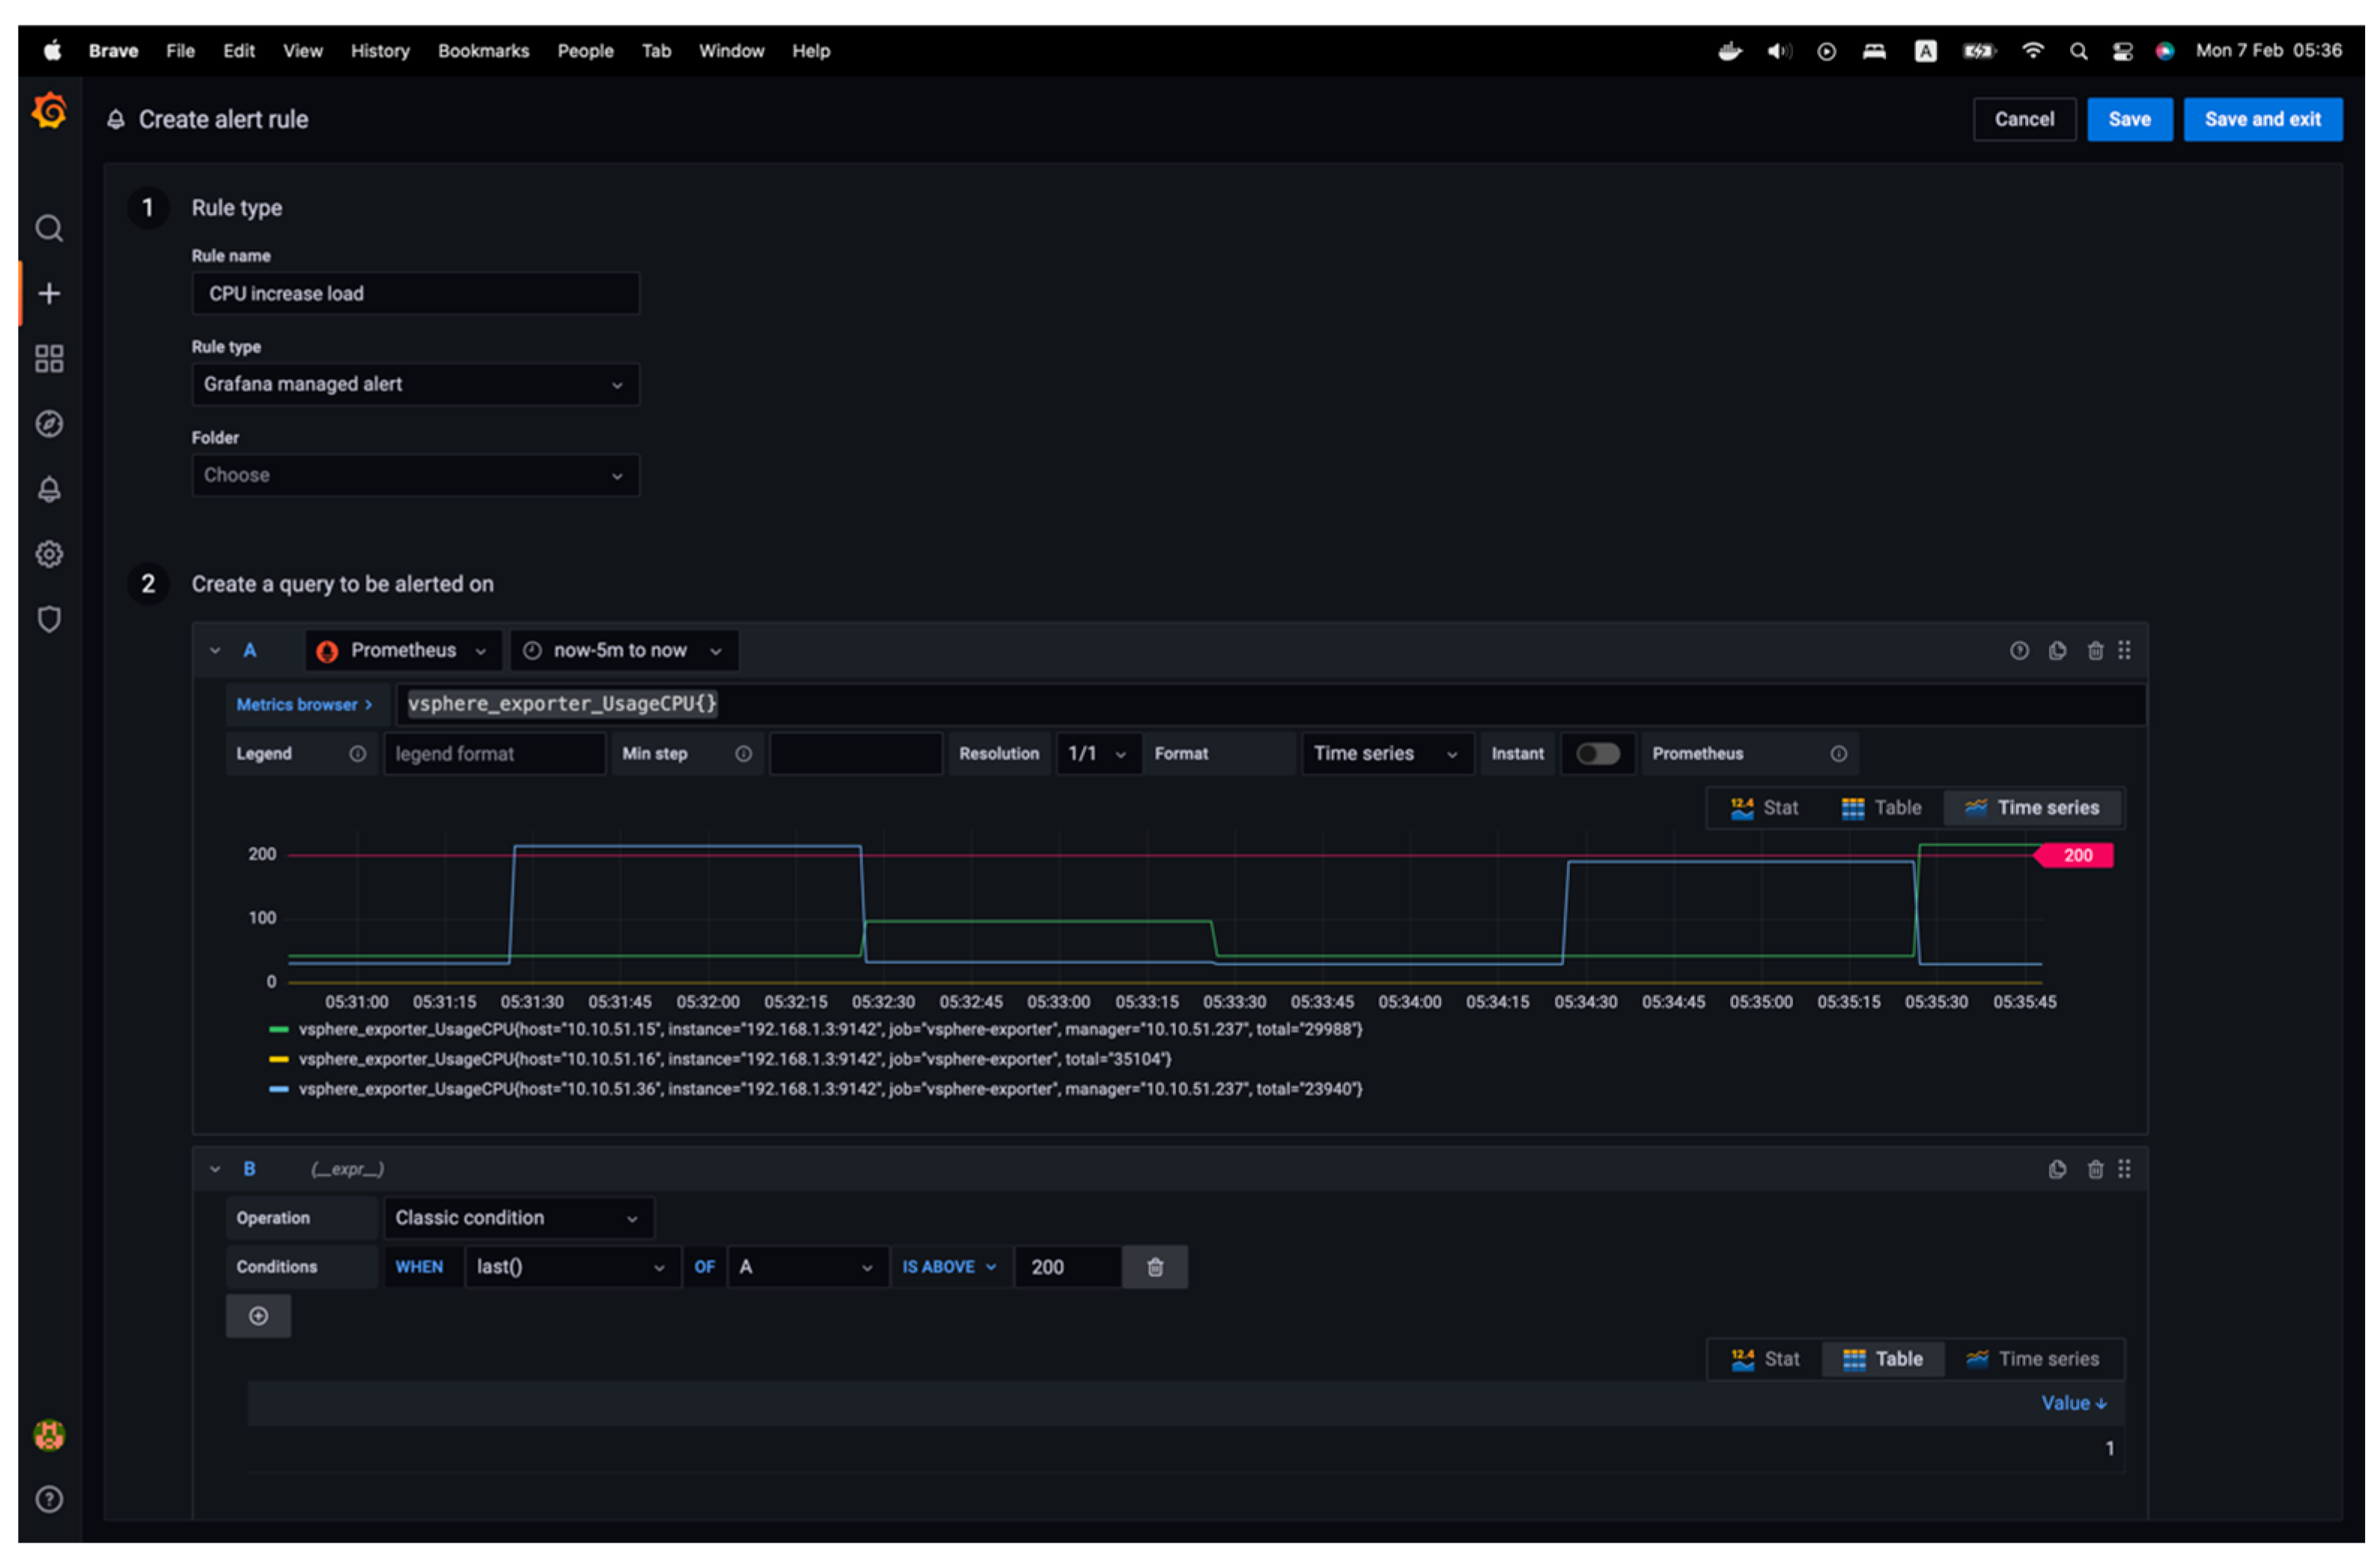
Next, various rules and conditions for alerts can be added. To incorporate a rule, details must be added to the rule’s name, and the “Grafana managed alert” rule must be chosen, the metric query selected with a new condition established, and the alert conditions specified. The notification details are also mandatory, as shown in
Figure 15.
When constructing a query, a visual representation of the query is provided, and the maximum threshold for the defined alert is indicated. Once an alert policy is added, the “Alerting” main interface will present a comprehensive set of rules. Then, in the “Contact points” tab, a new contact point to set up notifications can be created. Specifically, Alertmanager can be used to make a contact point, as shown in
Figure 16.
Once the alert rule is activated, Prometheus recognizes that the notification must be sent to the Alert Manager. It then transmits the notification through specified channels, specifically email.
The following section will compare a test scenario and analysis to see how this process applies to real-world use cases.
6. Test Analysis and Discussion
This section will discuss both a simple and more complex scenario of creating alerts based on the proposed architecture and some complex and arbitrary ideas for complex hybrid alarms. The first example includes a notification rule established with a criterion that triggers an alert when the CPU utilization exceeds 200 MHz. Then, a virtual machine will be started, running the Ubuntu operating system on the vSphere server at the IP address 10.10.51.15. The activation of the CPU load alarm upon system initialization can be noticed, as can be seen in
Figure 17.
There has been an increase in resource utilization, as evidenced by the graph. Consequently, the alert rule has been activated, and the alert status on Prometheus can be observed by accessing the “Alerting” view. Two out of the four alarm types have been activated. These are the principles of maximizing processor utilization and ensuring sensor accuracy, as is shown in
Figure 18.
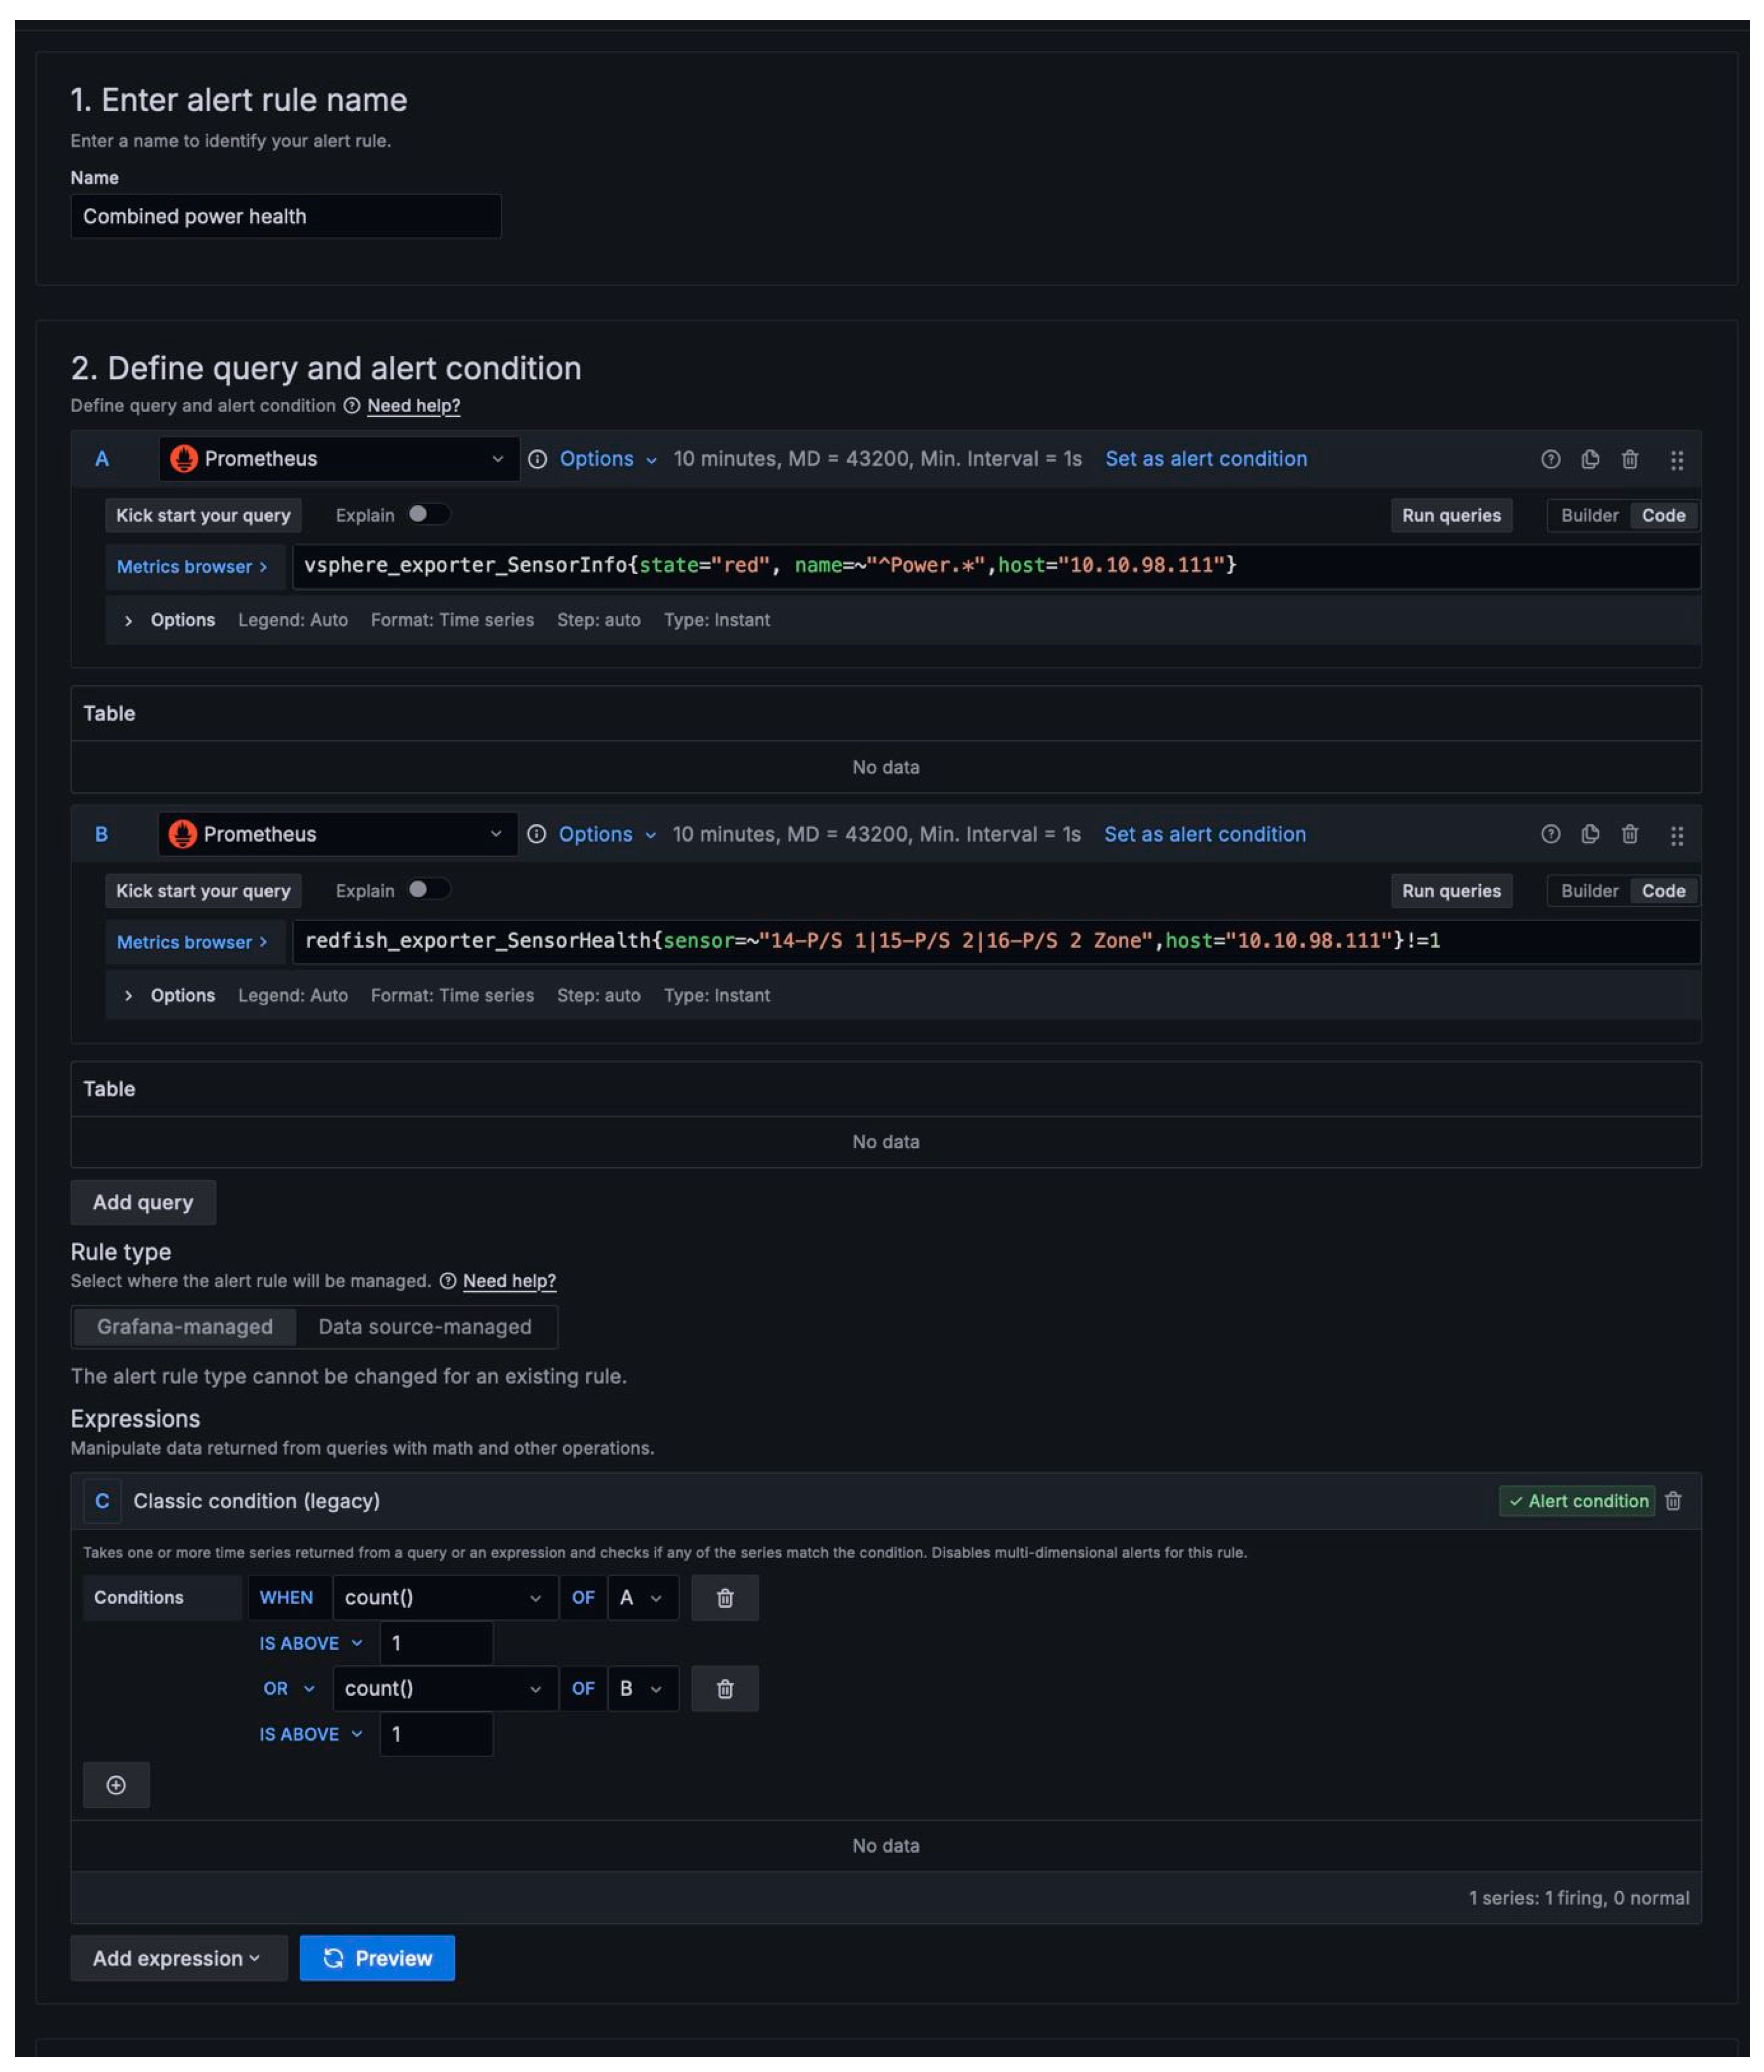
The second example involves a more complex, logic-based example for a hybrid alarm that works by using both the RedFish and vSphere exporters to provide an alarm for a failed PSU on a server, as shown in
Figure 19.
This hybrid alarm takes advantage of both exporters, providing something akin to alarm high availability for a PSU failure. As defined from the logic perspective (using the OR function), the alarm described in
Figure 19 will be raised if a host’s PSU fails if at least one of the exporters (or their API endpoints) works.
An arbitrary number of logic terms can be used as additional queries, which can then be placed in a logical relationship to the previous ones. This enables a platform user to create complex alarms, even for seemingly non-related issues. Suppose a platform user wants to make a hybrid alarm that combines a scenario when the CPU temperature exceeds 80˚C while the vSphere exporter reports low CPU usage and VM load. This could point to the fact that there might be potential cooling issues on the server where this scenario happened. There might even be security scenarios where this hybrid system might be valuable. Suppose there is a disk storage activity despite no reported VM activity or I/O requests in vSphere. That might mean some rogue processes have run on a hypervisor, indicating a potential threat.
Since two agents were developed, combining those two data sources can create a hybrid alarm set. This could be a precious option for environments with VMware’s version of vSphere installed without vendor-based add-ons. That, in turn, means that there are no additional options to check the sensor information from the server motherboard, which means that vSphere cannot provide that information. For example, an alarm that uses a RedFish agent can be created to get information about memory status and combined with a vSphere alarm for situations where the vSphere host starts running out of memory. That would be a scenario in which there could be a correlation between a failed stick of memory and the available memory capacity on the vSphere host. It is unnecessary to buy a separate (and costly) application to do this kind of monitoring, as the application created while working on this paper is hosted on GitHub and entirely free and MIT-licensed.
7. Future Works
Potential areas for the future development and research of the hardware monitoring application discussed in this paper offer multiple promising avenues to enhance its capabilities. Advancements in physical server health could prioritize the utilization of sensors and data analytics to provide comprehensive insights into server conditions. Utilizing historical health data to create predictive algorithms can potentially anticipate hardware failures, reducing downtime and maintenance expenses.
From an operational perspective, the application could be improved to enable simultaneous iLO firmware upgrades for multiple servers. Implementing this would significantly improve the operational efficiency of the firmware upgrade process, alleviating the burden on the individuals responsible for lifecycle management operations. It would also lower the costs as the centralized applications with this ability are high.
The continuous adaptation of Machine Learning (ML) models in anomaly detection is crucial for improving accuracy in distinguishing genuine anomalies from normal fluctuations, thereby enhancing monitoring capabilities. Incorporating contextual awareness into these models would improve their capacity to identify intricate problems across various metrics.
Aggregating logs from different sources within the server infrastructure will be crucial for thorough monitoring. Future endeavors could focus on developing a cohesive logging system that streamlines data gathering and examination, facilitating the identification of patterns and possible problems.
Enhancing event correlation can be achieved by creating advanced algorithms that establish connections between related events occurring in various components. This enables a more profound understanding of the events and facilitates faster problem resolution. This can promote a more streamlined approach to identifying and resolving the underlying factors contributing to system problems.
Resource forecasting is a promising field that can benefit from further advancements. Machine learning models can be used to anticipate future resource requirements by analyzing current and past usage patterns. This can significantly improve capacity planning and resource allocation. Implementing this would allow for proactive resource management, mitigating the potential for resource scarcity or excessive allocation.
Integrating artificial intelligence with resource forecasting and anomaly detection can significantly enhance the application’s effectiveness. Artificial intelligence (AI) can offer immediate and valuable information, automate decision-making, and improve the accuracy of predicting resource requirements and potential irregularities. This ultimately results in a more robust and efficient server management system. These advancements collectively strive to develop a hardware monitoring solution that is more resilient, intelligent, and proactive.
8. Conclusions
The RedFish protocol offers a standardized interface for data collection in infrastructure environments with various server types. Combining a pre-built metrics management system with the integration of customized agents has demonstrated itself as a rapid, effortless, and practical approach to achieving a high-quality product.
Throughout the project’s development, a comprehensive understanding of the Prometheus system’s operational mode and the proper methodology for constructing agents capable of gathering diverse data types was attained.
The solution’s implementation consists of a user web application that offers a user interface for adding and viewing the RedFish and vSphere agents. Additionally, a server application handles multiple RedFish and vSphere agents. These agents collect data and deliver it to the Prometheus monitoring system. A system has been devised to gather and display data from an unlimited number of servers and to send notifications when an alarm is triggered according to predefined rules. Prometheus gathers and retains data from the RedFish and vSphere agents to initiate alerts. The data is displayed using Grafana dashboards.
The application created for this paper demonstrated its efficiency as a comprehensive solution for monitoring the workload of servers in diverse infrastructure without any additional cost. By utilizing the collected data, various analytical methods can be employed to compare consumption at a specific load and optimize infrastructure utilization, which could improve environment efficiency and design. It could also be used to learn about the reliability of any given environment, feed information to an AI engine, and, with some development, predict large-scale failures based on agent data.


