Abstract
In this paper, an inductively coupled capacitively loaded ring resonator (IC-CLRR)-based microwave resonant sensor has been proposed for the accurate identification of any unknown liquid sample and its permittivity estimation. The key element of this work is the sensor’s wide range capability towards the non-invasive testing of liquids covering a wide dielectric range of liquid samples, i.e., εr = 2 to 80. The proposed microwave sensor is etched over the FR-4 substrate and is excited by the microstrip line through inductive coupling. The placement of an unknown liquid sample in close proximity to the sensor alters its natural resonant frequency due to a change in effective inductance and capacitance as per the dielectric property of the liquid sample. Further, a mathematical formulation using curve fitting has also been derived. The measurement results show a good accuracy in estimating the permittivity and, thus, the unknown liquid identification capability of the designed sensor with a very low error (nearly 5%). This sensor design is simple to fabricate, cost-friendly, and small in size.
1. Introduction
Any material’s permittivity depends on frequency and its physical characteristics, which also characterizes the interaction between the electric flux density and an applied electric field. Permittivity measurements can be used to infer physical properties if a connection between a material’s permittivity and physical characteristics can be found. Scientists and engineers have used this approach for successfully finding the numerous features of agricultural products, like the water content of food grain, fruit moisture content and ripening status, or the fat percentage in fish [1,2]. Further, material characterization using RF and microwave measurement approaches is also widely employed [3,4]. Microwave-based approaches can be of various types, such as free-space, near-field, transmission line, and resonance-based methods [5,6]. Resonance-based methods are generally favored because of their high accuracy, great sensitivity, and lower cost [7]. In this method, the liquid under test (LUT) is loaded onto the resonator, and, by recording the change in the resonant frequency and quality factor, information on the material qualities is observed.
Presently, different research groups are exploring the utility and design of RF-based sensors for characterizing unknown materials, such as, for example, the split-ring resonator (SRR) [8,9], the complimentary split-ring resonator (CSRR) [10,11], the substrate-integrated waveguide (SIW) [10], the ring resonator [12], and the inter-digital capacitor (IDC) [13]. T. Islam has shown a capacitive sensor for the measurement of liquid level [14]. Water TDS quality has been reported using a CSRR-based sensor in [11]. An S-shaped resonator has been designed for low-permittivity solid materials (εr = 2.1 to 3) with good sensitivity [15].
Based on a literature review [1,2,3,4,5,6] and to the best of the authors’ knowledge, most of the work in microwave sensor design is solely centered around the testing of solid materials and low-loss materials. Liquid testing is a less explored area in microwave sensing. So, to end this gap, we have designed a resonant sensor for liquid sample identification and its permittivity estimation.
Moreover, another key attribute of this paper is that the designed sensor has been tested for a wide permittivity range of liquids, viz., εr = 2 to 80. In this paper, we have used inductively coupled capacitively loaded ring resonator (IC-CLRR) for designing a notch sensor. The proposed sensor is designed and simulated using EM simulation software. Then, an observational formula is calculated using the curve-fitting tool in MATLAB (version R2017a) for calculating the permittivity of the unknown liquid sample in terms of the resonant frequency. Finally, actual and measured values are compared and tested.
2. Principle of Microwave Sensing
Generally, a simple resonator-equivalent model can be represented by an RLC circuit, for which the resonant frequency is governed by the following relation [5]:
where L and C denote the equivalent inductance and capacitance. The natural resonant frequency of this resonating structure differs when any test sample intermingles with its field distribution. These alterations in the resonant frequency and physical properties of test sample materials are interrelated and governed by Expression (2):
where ∆fr represents a change in resonant frequency, ∆v is the volume of the cavity, ε0 is the free-space permittivity, and ∆ε represent a change in complex permittivity. Here, E0, represents the electric field of an empty cavity. Under loaded conditions, E1 represents the electric field. Hence, the operating principle of the proposed sensor is based on resonance frequency variations due to the changes in equivalent inductor/capacitor and field intensity distribution caused by the LUT.
3. Design of the Liquid Sensor
Figure 1a shows the top view of the proposed capacitively loaded ring resonator (CLRR) sensor along with dimensional details in the zoomed view. Figure 1b depicts the layered perspective view showing the ground plane, the substrate plane, and the sensor plane separately. The inductively coupled capacitively loaded ring resonator (IC-CLRR) sensor was designed and simulated using commercial EM simulation software HFSS. The substrate used was FR 4 (εr = 4.3, tan = 0.025 h = 1.6 mm), with a cross-sectional dimension of length (Ls) = 50 mm and width (Ws) = 32 mm. One side of the sensor was complete copper (thickness = 35 μm), which served as the ground, and on the other side of the substrate, the IC-CLRR sensor design was etched out as shown in Figure 1a. This resonator was excited by the time-varying EM field of the microstrip line. For this, the resonator was inductively coupled to the microstrip transmission line, which built up the EM field through quasi-TEM wave propagation. The microstrip line had a width of (Mw) = 2.9 mm corresponding to a characteristic impedance of 50 ohm, which was used to provide the excitation to the sensor. The final optimized dimensions are given in Table 1. The capacitive loading in the center of the ring enhanced the electric field in the sensor region, as shown in Figure 1c, and thereby increased the sensitivity and accuracy of the sensor in detecting the permittivity of an unknown liquid sample. Here, the range of operating frequency was from 2 GHz to 4.5 GHz.
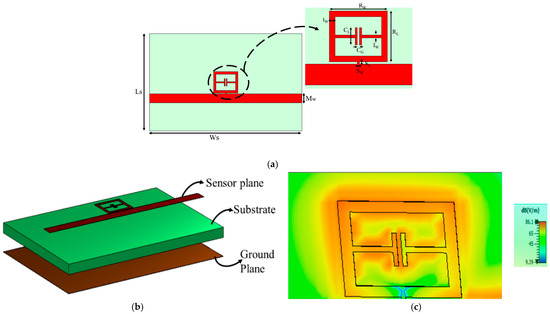
Figure 1.
(a) Top view of the proposed inductively coupled capacitively loaded ring resonator (IC-CLRR) microwave resonant sensor, (b) layered perspective view of each plane, and (c) E-field distribution at the resonant frequency (fr = 3.56 GHz).

Table 1.
Dimensions of the optimized IC-CLRR microwave sensor.
Further, in order to test the liquid-sensing capability of the designed sensor and mimic the actual experimental setup, a hollow cylindrical vessel of borosilicate glass (εr = 4.6) was placed over the sensor in the simulation, as shown in Figure 2a. The height of the glass vessel was around 1 mm and the radius around 1.5 cm, analogous to the glass coverslip. Further, inside this hollow cylindrical vessel, the liquid sample was placed, as shown in Figure 2b. In Figure 2, the blue color shows the sample, which is placed inside the vessel, shown in a gray color, in the simulation.
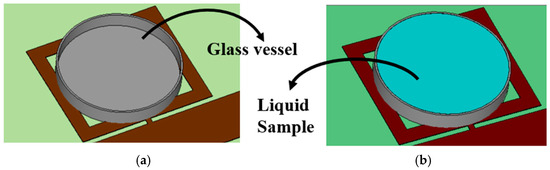
Figure 2.
Demonstration of (a) empty vessel made up of borosilicate glass placed over the IC-CLRR sensor and (b) liquid sample inside the glass vessel placed over the sensor.
The IC-CLRR sensor’s characteristics have been plotted in Figure 3 as the transmission coefficient vs. frequency graph. As can be seen, the bare sensor in the unloaded condition (green curve) has a resonance frequency of = 3.56 GHz with S21 magnitude −31dB and 3dB bandwidth () = 0.07 GHz (3.6 GHz − 3.53 GHz). Therefore, the quality factor of the sensor is . The quality factor links the maximum or peak energy held in the circuit (the reactance) to the energy dissipated (the resistance) during each cycle of oscillation [13]. In Figure 3, the red curve is the plot of S21 vs. frequency with the glass vessel kept over the sensor, which clearly shows a slight shift in the sensor’s resonant frequency to = 3.51 GHz compared to the original frequency = 3.56 GHz. Basically, due to the placement of a glass coverslip in close proximity to the sensor, it alters the surrounding dielectric constant, which, in turn, slightly shifts the sensor’s natural resonant frequency.
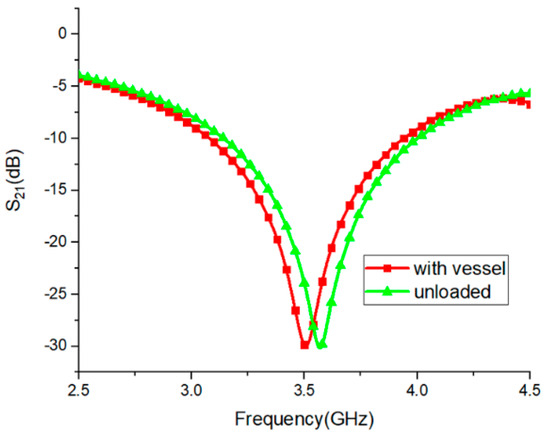
Figure 3.
Scattering parameter (S21) vs. frequency plot: resonant frequency of the sensor under unloaded conditions at 3.56 GHz and under loaded conditions (with the glass vessel) at 3.51 GHz.
4. Analysis of the Proposed Liquid Sensor
An analysis of the proposed IC-CLRR sensor was conducted for the accurate identification of any unknown liquid sample by assigning different permittivity values for the liquid samples inside the glass vessel in the simulation. Here, the permittivity range was kept from 2 to 80 with a total of 50 variations in accordance with the real liquid sample permittivity values, as available in the literature [16,17]. The permittivity values for a few commonly used liquids are listed in Table 2. Figure 4 shows the plot of S21 vs. the frequency for a few of the samples considered in the simulation with various permittivity values of εr = 2, 14, 28, 38, 46, 56, 62, 70, and 80.
Table 2.
Dielectric constant of a few common liquids, as available in References [8,13,16,17].
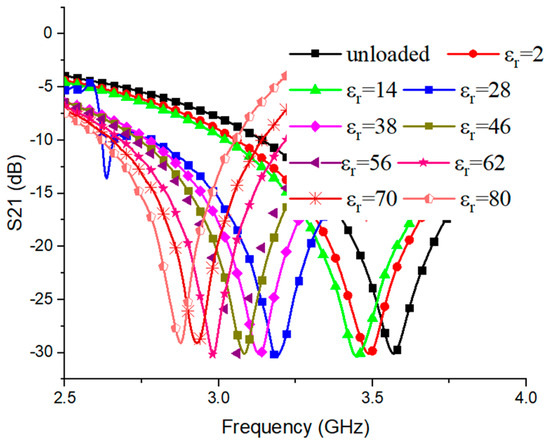
Figure 4.
Scattering parameter (S21) vs. frequency graph for liquid samples with different permittivity.
Figure 4 shows the response of the transmission coefficient vs. the frequency for the sensor loaded with the liquid samples with different permittivity under test. It can be observed that, as the permittivity of the liquid sample changes, a shift in the resonant frequency of the sensor is observed. As plotted in Figure 5, it can be observed that, as the permittivity of the sample is increasing, the resonant frequency decreases. Also evident from the figure is that, as the permittivity of LUT increases, this shift in frequency under the loaded condition ) also increases. By establishing a relationship between the resonant frequency and the permittivity, one can obtain information on the unknown liquid sample.
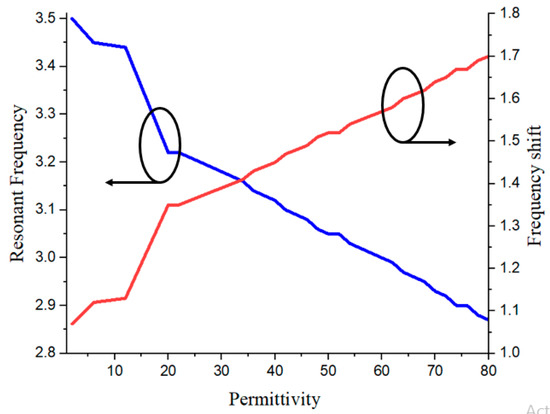
Figure 5.
Graph showing permittivity vs. resonant frequency variation (blue curve) and permittivity vs. frequency shift variation (red curve) for liquid samples of varying permittivity (εr = 2 to 80).
Here, the normalized sensitivity of the designed sensor has also been calculated using the following formula [11]:
where fu represents the highest resonant frequency, fl represents the lowest resonant frequency, εr2 represents the highest permittivity value of the liquid sample, and εr1 represents the lowest permittivity value of liquid sample. Here, fl = 2.87 GHz and fu = 3.5 GHz correspond to εr2 = 80 and εr1 = 2. After putting these values in Equation (3), the normalized sensitivity comes out to be 0.227%, which is very good. Another parameter related to the resolution of the sensor is the frequency detection resolution (FDR), which describes a shift in resonant frequency corresponding to the change in permittivity of the sample, given by the following [18]:
The FDR or resolution of the sensor comes out to be 8 MHz, which ascertains that the proposed sensor has a good resolution capability for the estimation of two different liquids with close permittivity characteristics.
5. Mathematical Modeling
In order to identify any unknown liquid placed over the sensor, a mathematical formulation had to be established. Since resonant frequency is directly dependent upon the permittivity of the LUT, the curve fitting approach was used in order to find the best fitted function. Firstly, a data set with 50 sample data points was generated by taking permittivity variations in the range εr = 2 to 80 and noting down the corresponding resonant frequencies. The MATLAB (R 2017a) curve fitting tool was used for curve fitting. The best fitted function was chosen for having the best R-square value, i.e., almost equal to 1. The fitness of the best fit curve was verified using a goodness-of-fit test having a sum squared error of (SSE) = 10.59, an adjusted R-square = 0.9999, and a root mean square error (RMSE) value = 0.6938. The numerical expression obtained using curve fitting with 95% confidence bounds was the ‘sine expression of degree four’ given by the following:
where = 58.69, = 2.24, = 7.43, = 33.71, = 5.133, = 12.82, = 2.32, = 23.49, = −8.986, = 1.699, = 32.15, and = 24.63.
6. Measurement Results and Validation
As a proof of concept, the designed IC-CLRR liquid sensor was fabricated using a conventional photolithography technique, and the prototype sensor is shown in Figure 6. The measurement of the scattering parameters was carried out using the Agilent vector network analyzer, as shown in Figure 6. The measured resonant frequency under unloaded conditions was fr = 3.54 GHz with S21 magnitude = −29.6 dB, in close approximation to the simulated frequency of fr = 3.56 GHz.
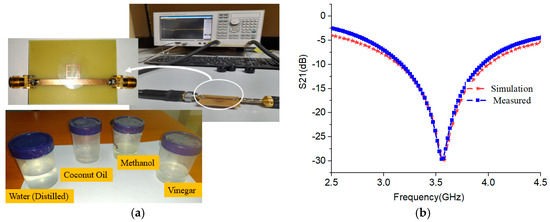
Figure 6.
(a) Measurement setup for the proposed IC-CLRR resonant microwave sensor (b) S21 vs. frequency plot (measurement vs. simulated).
Now, in order to check the accuracy of the developed prototype sensor, it was tested for a few known and commercially available liquid samples, viz., distilled water, coconut oil, methanol, vinegar, glucose, chloroform, and acetone. The standard permittivity values of these liquid samples were derived from References [8,13,16]. In the experiment, a glass coverslip was placed over the sensing region of the sensor, and a few liquid drops of the test liquid were put over it. The resonant frequency was then measured using a network analyzer. The same process was repeated for each of the considered liquid samples. Further, an observation of the resonant frequency was carried out with precision and up to three decimal points, i.e., x.xxx GHz. Figure 7 shows the measurement results for a few of the different liquid samples under test. A clear and measurable frequency shift can be observed corresponding to different liquid samples, attributed to their different permittivity values. The observed resonant frequencies are fr (water) = 2.880 GHz, fr (coconut oil) = 3.533 GHz, fr (methanol) = 3.153 GHz, and fr (vinegar) = 3.210 GHz.
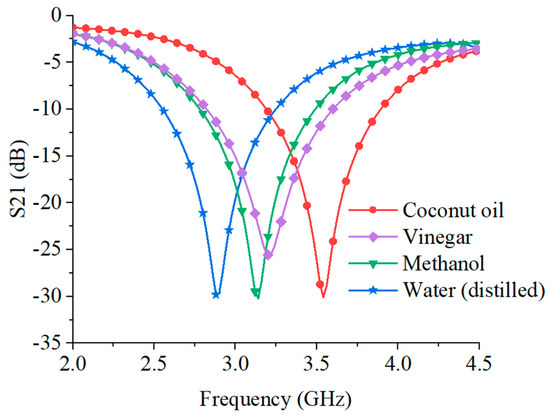
Figure 7.
Measured S21 vs. frequency plot for sample liquids under test, viz., coconut oil, vinegar, methanol, and water.
The sensor should be capable to predict any unknown liquid sample from its resonant frequency information and the derived mathematical formulation. So, in the next step, the measured resonant frequencies corresponding to each of the liquid samples were put in the mathematical formula obtained from curve fitting, as given in Equation (3), and the analog values of the permittivity of the samples were calculated. In Table 3, column V shows the calculated permittivity values, and column IV lists the standard permittivity values as derived from the literature for the considered liquid samples [8,13,16]. As can be seen, the calculated permittivity values are in close agreement to the practical ones and with a permissible error close to 5%, as listed in the last column. The results suggest a very good estimation capability of the designed sensor and mathematical formulation. Hence, the proposed sensor will be of great use in the non-invasive identification of any unknown liquid sample.
Table 3.
Comparison of estimated and actual permittivity values of different liquid samples.
7. Equivalent Circuit Modeling of the Designed Sensor
The designed sensor’s equivalent circuit model was derived using EM simulation software ADS in terms of lumped circuit parameters, as shown in Figure 8. Here, L1 and L2 represent the 50 ohm microstrip line segments connected to port 1 and port 2, respectively. L3 represents the inductively coupled microstrip stub. The capacitively loaded square ring is represented by the parallel LC network, viz., L4, L5, and C2. Capacitance C1 corresponds to the capacitive coupling between the microstrip line and the square ring. Further, the S-parameter response (S21) obtained from equivalent circuit modeling is shown in Figure 8, which comes in close agreement with the simulation’s resonant frequency, viz., 3.56 GHz.
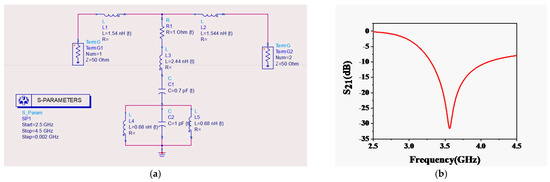
Figure 8.
Equivalent circuit modeling of the proposed sensor: (a) lumped circuit schematic and (b) S21 vs. frequency response of the ECM model.
A comparison of the designed IC-CLRR liquid sensor’s performance was carried out with the existing relevant literature, as shown in Table 4. This showed that the proposed sensor had been validated for a wide range of liquid samples in contrast to other reported works. Further, numerical modeling for permittivity estimation was an added feature of this work. Hence, the proposed liquid sensor will be of vital importance in unknown liquid sampling with good accuracy.
Table 4.
Comparison of the proposed sensor’s performance with others reported in the literature.
8. Conclusions
In this paper, an inductively coupled capacitance-loaded ring resonator based microwave sensor was designed, fabricated, and tested for unknown liquid sample testing and identification. A curve fitting-based numerical formulation was also derived for liquid sample permittivity estimation via the observed resonant frequency as the input. A very good accuracy was achieved towards the correct characterization of unknown liquids. In various applications requiring non-destructive liquid testing, the designed sensor will be of great use due to its competing features of small sample quantity, easy measurement, and fabrication simplicity.
Author Contributions
Conceptualization, S.A.; methodology, M.C.G.; software, S.A.; validation, M.C.G.; formal analysis, S.A.; investigation, S.A.; resources, M.C.G.; data curation, M.C.G.; writing—original draft preparation, S.A.; writing—review and editing, M.C.G.; visualization, S.A.; supervision, S.A. All authors have read and agreed to the published version of the manuscript.
Funding
This research has received no external funding.
Data Availability Statement
All the data produced in this research is included in the paper. No new data is created.
Acknowledgments
The authors would like to acknowledge the Dept. of ECE, Indian Institute of Information Technology, Allahabad, Prayagraj, UP, for providing the testing and measurement facility.
Conflicts of Interest
The authors declare no conflicts of interest.
References
- Abdolrazzaghi, M.; Zarifi, M.H.; Pedrycz, W.; Daneshmand, M. Robust ultra-high resolution microwave planar sensor using fuzzy neural network approach. IEEE Sens. J. 2016, 17, 323–332. [Google Scholar] [CrossRef]
- Ansari, M.A.H.; Jha, A.K.; Akhtar, M.J. Design and application of the CSRR-based planar sensor for noninvasive measurement of complex permittivity. IEEE Sens. J. 2015, 15, 7181–7189. [Google Scholar] [CrossRef]
- Boybay, M.S.; Ramahi, O.M. Material characterization using complementary split-ring resonators. IEEE Trans. Instrum. Meas. 2012, 61, 3039–3046. [Google Scholar] [CrossRef]
- Abdolrazzaghi, M.; Daneshmand, M.; Iyer, A.K. Strongly enhanced sensitivity in planar microwave sensors based on metamaterial coupling. IEEE Trans. Microw. Theory Tech. 2018, 66, 1843–1855. [Google Scholar] [CrossRef]
- Shafi, K.M.; Jha, A.K.; Akhtar, M.J. Improved planar resonant RF sensor for retrieval of permittivity and permeability of materials. IEEE Sens. J. 2017, 17, 5479–5486. [Google Scholar] [CrossRef]
- Navaei, M.; Rezaei, P.; Kiani, S. A symmetric bar chart-shape microwave sensor with high Q-factor for permittivity determination of fluidics. Int. J. Microw. Wirel. Technol. 2023, 15, 1334–1342. [Google Scholar] [CrossRef]
- Xu, K.; Liu, Y.; Chen, S.; Zhao, P.; Peng, L.; Dong, L.; Wang, G. Novel Microwave Sensors Based on Split Ring Resonators for Measuring Permittivity. IEEE Access 2018, 6, 26111–26120. [Google Scholar] [CrossRef]
- Kiani, S.; Rezaei, P.; Navaei, M.J.M. Dual-sensing and dual-frequency microwave SRR sensor for liquid samples permittivity detection. Measurement 2020, 160, 107805. [Google Scholar] [CrossRef]
- Sharma, A.K.; Agarwal, S. Design of an Accurate, Non- Invasive Planar Resonant Microwave Sensor for Unknown Material Characterization. In Proceedings of the International Conference on VLSI & Microwave and Wireless Technologies (ICVMWT-2021), MMUT, Gorakhpur, India, 20–21 March 2021; Springer: Berlin/Heidelberg, Germany, 2021. [Google Scholar]
- Agarwal, S.; Singh, D. Non-destructive quality estimation of packaged ceramic tiles using millimetre wave imaging radar. In Proceedings of the Third International Conference on VLSI, Communication and Signal Processing (VCAS 2020), 2020, MNNIT Allahabad, Prayagraj, India, 9–11 October 2020. [Google Scholar]
- Agarwal, S. Non-Contact Multiple Ring CSRR Based Planar Microwave Sensor for Accurate Quality Estimation of Water Samples with Varying TDS. Def. Sci. J. 2021, 71, 378–382. [Google Scholar] [CrossRef]
- Butt, M.A.; Khonina, S.N.; Kazanskiy, N.L. Metal-insulator-metal nano square ring resonator for gas sensing applications. Waves Random Complex Media 2021, 31, 146–156. [Google Scholar] [CrossRef]
- Šegatin, N.; Pajk Žontar, T.; Poklar Ulrih, N. Dielectric Properties and Dipole Moment of Edible Oils Subjected to ‘Frying’ Thermal Treatment. Foods 2020, 9, 900. [Google Scholar] [CrossRef] [PubMed]
- Islam, T.; Maurya, O.P.; Khan, A.U. Design and Fabrication of Fringing Field Capacitive Sensor for Non-Contact Liquid Level Measurement. IEEE Sens. J. 2021, 21, 24812–24819. [Google Scholar] [CrossRef]
- Haq, T.; Ruan, C.; Zhang, X.; Ullah, S.; Fahad, A.K.; He, W. Extremely sensitive microwave sensor for evaluation of dielectric characteristics of low-permittivity materials. Sensors 2020, 20, 1916. [Google Scholar] [CrossRef] [PubMed]
- Liquid-Dielectric-Constants. 2022. Available online: https://www.engineeringtoolbox.com/liquid-dielectric-constants-d_1263.html (accessed on 1 January 2024).
- Kumar, A.V.P.; Goel, A.; Kumar, R.; Ojha, A.K.; John, J.K.; Joy, J. Dielectric characterization of common edible oils in the higher microwave frequencies using cavity perturbation. J. Microw. Power Electromagn. Energy 2019, 53, 48–56. [Google Scholar]
- Zhao, X.B.; Wei, F.; Zhang, P.F.; Shi, X.W. Mixed-Mode Magic-Ts and Their Applications on the Designs of Dual-Band Balanced Out-of-Phase Filtering Power Dividers. IEEE Trans. Microw. Theory Tech. 2023, 71, 3896–3905. [Google Scholar] [CrossRef]
- Lan, X.; Fu, S.; Song, J.; Leu, S.; Shen, J.; Kong, Y.; Kang, S.; Yuan, X.; Liu, H. Structural changes of hemicellulose during pulping process and its interaction with nanocellulose. Int. J. Biol. Macromol. 2024, 255, 127772. [Google Scholar] [CrossRef] [PubMed]
Disclaimer/Publisher’s Note: The statements, opinions and data contained in all publications are solely those of the individual author(s) and contributor(s) and not of MDPI and/or the editor(s). MDPI and/or the editor(s) disclaim responsibility for any injury to people or property resulting from any ideas, methods, instructions or products referred to in the content. |
© 2024 by the authors. Licensee MDPI, Basel, Switzerland. This article is an open access article distributed under the terms and conditions of the Creative Commons Attribution (CC BY) license (https://creativecommons.org/licenses/by/4.0/).