You are currently viewing a new version of our website. To view the old version click .
Electronics
  • Article
  • Open Access

30 May 2024

Exploring Neighbor Spatial Relationships for Enhanced Lumbar Vertebrae Detection in X-ray Images

,
,
,
,
,
,
,
,
and
1
School of Biomedical Engineering, Anhui Medical University, Hefei 230032, China
2
Institute of Intelligent Machines, Hefei Institutes of Physical Science, Chinese Academy of Sciences, Hefei 230031, China
3
Department of Life Sciences and Medicine, University of Science and Technology of China, Hefei 230026, China
4
School of Artificial Intelligence and Big Data, Hefei University, Hefei 230601, China
This article belongs to the Special Issue Neural Networks for Feature Extraction

Abstract

Accurately detecting spine vertebrae plays a crucial role in successful orthopedic surgery. However, identifying and classifying lumbar vertebrae from arbitrary spine X-ray images remains challenging due to their similar appearance and varying sizes among individuals. In this paper, we propose a novel approach to enhance vertebrae detection accuracy by leveraging both global and local spatial relationships between neighboring vertebrae. Our method incorporates a two-stage detector architecture that captures global contextual information using an intermediate heatmap from the first stage. Additionally, we introduce a detection head in the second stage to capture local spatial information, enabling each vertebra to learn neighboring spatial details, visibility, and relative offset. During inference, we employ a fusion strategy that combines spatial offsets of neighboring vertebrae and heatmap from a conventional detection head. This enables the model to better understand relationships and dependencies between neighboring vertebrae. Furthermore, we introduce a new representation of object centers that emphasizes critical regions and strengthens the spatial priors of human spine vertebrae, resulting in an improved detection accuracy. We evaluate our method using two lumbar spine image datasets and achieve promising detection performance. Compared to the baseline, our algorithm achieves a significant improvement of 13.6% AP in the CM dataset and surpasses 6.5% and 4.8% AP in the anterior and lateral views of the BUU dataset, respectively.

1. Introduction

The lumbar spine is an essential support and protective system in the human body. In recent years, with the aging population and changes in modern lifestyles, the incidence of spinal diseases is gradually increasing [1]. X-ray is a simple, fast, and economical modality for disease diagnosis, making it one of the basic methods for examining the spine. Traditionally, the diagnosis and treatment of spinal diseases heavily depend on the subjective experience of doctors. Even when following the same diagnostic criteria for lumbar X-ray images, experienced doctors may provide different assessment conclusions [2]. Recently, with the development of deep learning in medical image analysis [3,4,5,6,7,8], automated vertebrae detection can offer a promising solution to assist doctors in spinal treatment. The automatic vertebrae detection task aims to automatically localize and recognize vertebrae by extracting features from X-ray images. By providing precise information about the position and class of each vertebra, this task assists surgeons in conducting spinal diagnosis and treatment with greater accuracy and efficiency.
However, the task of automatic vertebrae detection in X-ray images encounters significant challenges, as shown in Figure 1. (1) Variations in the field of view. Only a partial subset of the spine can be captured in each image, and the number of visible vertebrae within the region exhibits variability. Since the presence of certain specific vertebrae (such as the sacrum or thoracic vertebra) cannot be guaranteed in the input image, it is impossible to utilize these vertebrae for classifying other vertebrae. (2) Similar visual characteristics. Vertebrae exhibit similar visual characteristics, and individual shapes and sizes differ. This further increases the difficulty of category recognition. (3) Excessive interference information. These images suffer from reduced contrast, blurred vertebral edges, and frequent confusion with surgical markers such as Kirschner wires, PVP catheters, forceps, and screws, as illustrated in Figure 1a–d. These objects have the potential to occlude vertebrae or introduce artifacts, exacerbating the intricacies of the detection task. In summary, the similarity and diversity of data pose challenges for vertebrae detection. Therefore, there is an urgent need for a deep learning model that can extract robust spatial features of vertebrae from complex images, thereby optimizing the classification and localization of vertebrae.
Figure 1. The challenge of automatically identifying vertebrae in the lumbar spinal image. (af) are lumbar spine X-ray images from two different datasets, demonstrating challenges including variations in fields of view, abundant interference information, variability in numbers of vertebrae, similar visual features of vertebrae, and variations in vertebral shape and size due to individual differences. The center points of different categories of vertebrae are distinguished by different colors.
Recently, deep learning-based detection techniques have demonstrated significant potential in accurately identifying and localizing spinal structures [9,10,11,12]. The complexity and limitations of traditional handcrafted feature extraction methods [13,14] have driven the adoption of convolutional neural networks (CNNs) as a direct and simple approach for localizing vertebrae in images. Compared to traditional methods, CNN can extract more robust features [9,10], resulting in better detection performance. However, these methods still face challenges such as blurred vertebral edges and occlusion of landmarks. To address these issues, CNN-based heatmap methods reformulate the vertebrae detection problem as a keypoint prediction problem, directly predicting the centers of the vertebrae. For instance, Yi et al. [11] applied these maps generated by a 2D Gaussian function to locate the central points of the thoracic and lumbar vertebrae. Similarly, the Gaussian function is used to generate a heatmap for regressing the expected centroids of vertebrae and fitting the spinal curve [12]. These approaches not only simplify the network but also handle higher-resolution images. Although these methods using the Gaussian function achieve success, they do not effectively represent the distance of each pixel inside the bounding box to the target center. To address this, FCOS [15] introduced the concept of centerness, which leverages the normalized distances between points within the object region and the center, suppressing inaccurate predictions during inference. Furthermore, performing spinal detection solely based on the center points of each vertebra fails to fully consider the distinctive linear structure of the spine.
Utilization of spatial prior information is also particularly crucial in various medical imaging applications, especially in the field of spinal imaging that involves structures with linear features. While the similarity of vertebrae challenges their classification, exploiting the spatial relationships among these structures enables us to improve the accuracy of category recognition in detection tasks by leveraging knowledge about expected positions, sequential order, and other pertinent aspects within the spine. Deep learning-based methods also extensively investigate the exploration of spatial relationships between target objects [16,17] in the computer vision domain. For example, MonoPair [16] enhances the accuracy of occluded object detection by effectively capturing the spatial relationships between paired objects. GANet [17] devises a local information aggregation module that adaptively captures the localized correlations between neighboring keypoints, thereby augmenting the interconnectivity between neighboring keypoints. However, despite the significance of spatial prior information and recent progress in computer vision detection tasks, it has not been extensively explored for spine vertebrae detection by recent deep learning-based approaches.
To address the aforementioned challenges, in this paper, based on X-rays of the lumbar spine, we propose a novel method to enhance spine vertebrae detection accuracy by leveraging the spatial relationships between vertebrae. Our method leverages both global and local spatial priors to improve the accuracy of detection. Specifically, to capture the global spatial prior, we employ a two-stage detector. In the first stage, an intermediate heatmap is generated to encode global spatial information of vertebrae, providing valuable clues for subsequent stages. The second stage takes the intermediate heatmap and the original image as input to output the final results. This two-stage architecture enables the model to benefit from the contextual information provided by vertebrae, leading to enhanced detection performance. Furthermore, we introduce a novel detection head to capture the local spatial information. This detection head is specifically designed to predict neighboring vertebrae information, enabling each vertebra to learn the neighboring spatial information, visibility, and relative offsets of its neighboring vertebrae. In the inference step, we design a fusion strategy to incorporate the spatial information of neighboring vertebrae, where each vertebra combines the spatial offsets of its neighboring vertebrae with its central heatmap. Therefore, by incorporating this local spatial information, our method achieves improved accuracy in spine vertebrae detection by enabling the model to better understand the relationships and dependencies between neighboring vertebrae. In summary, combining the global and local spatial priors, our method effectively captures the inherent spatial characteristics of the spine vertebrae, which in turn can boost the spine detection results.
Furthermore, we introduce a novel representation of object centers that offers advantages in the detection process, specifically by emphasizing critical regions. In this way, we further improve the model’s ability to concentrate on the spine center, mitigating the impact of limited data samples and excessive interference from intraoperative images.
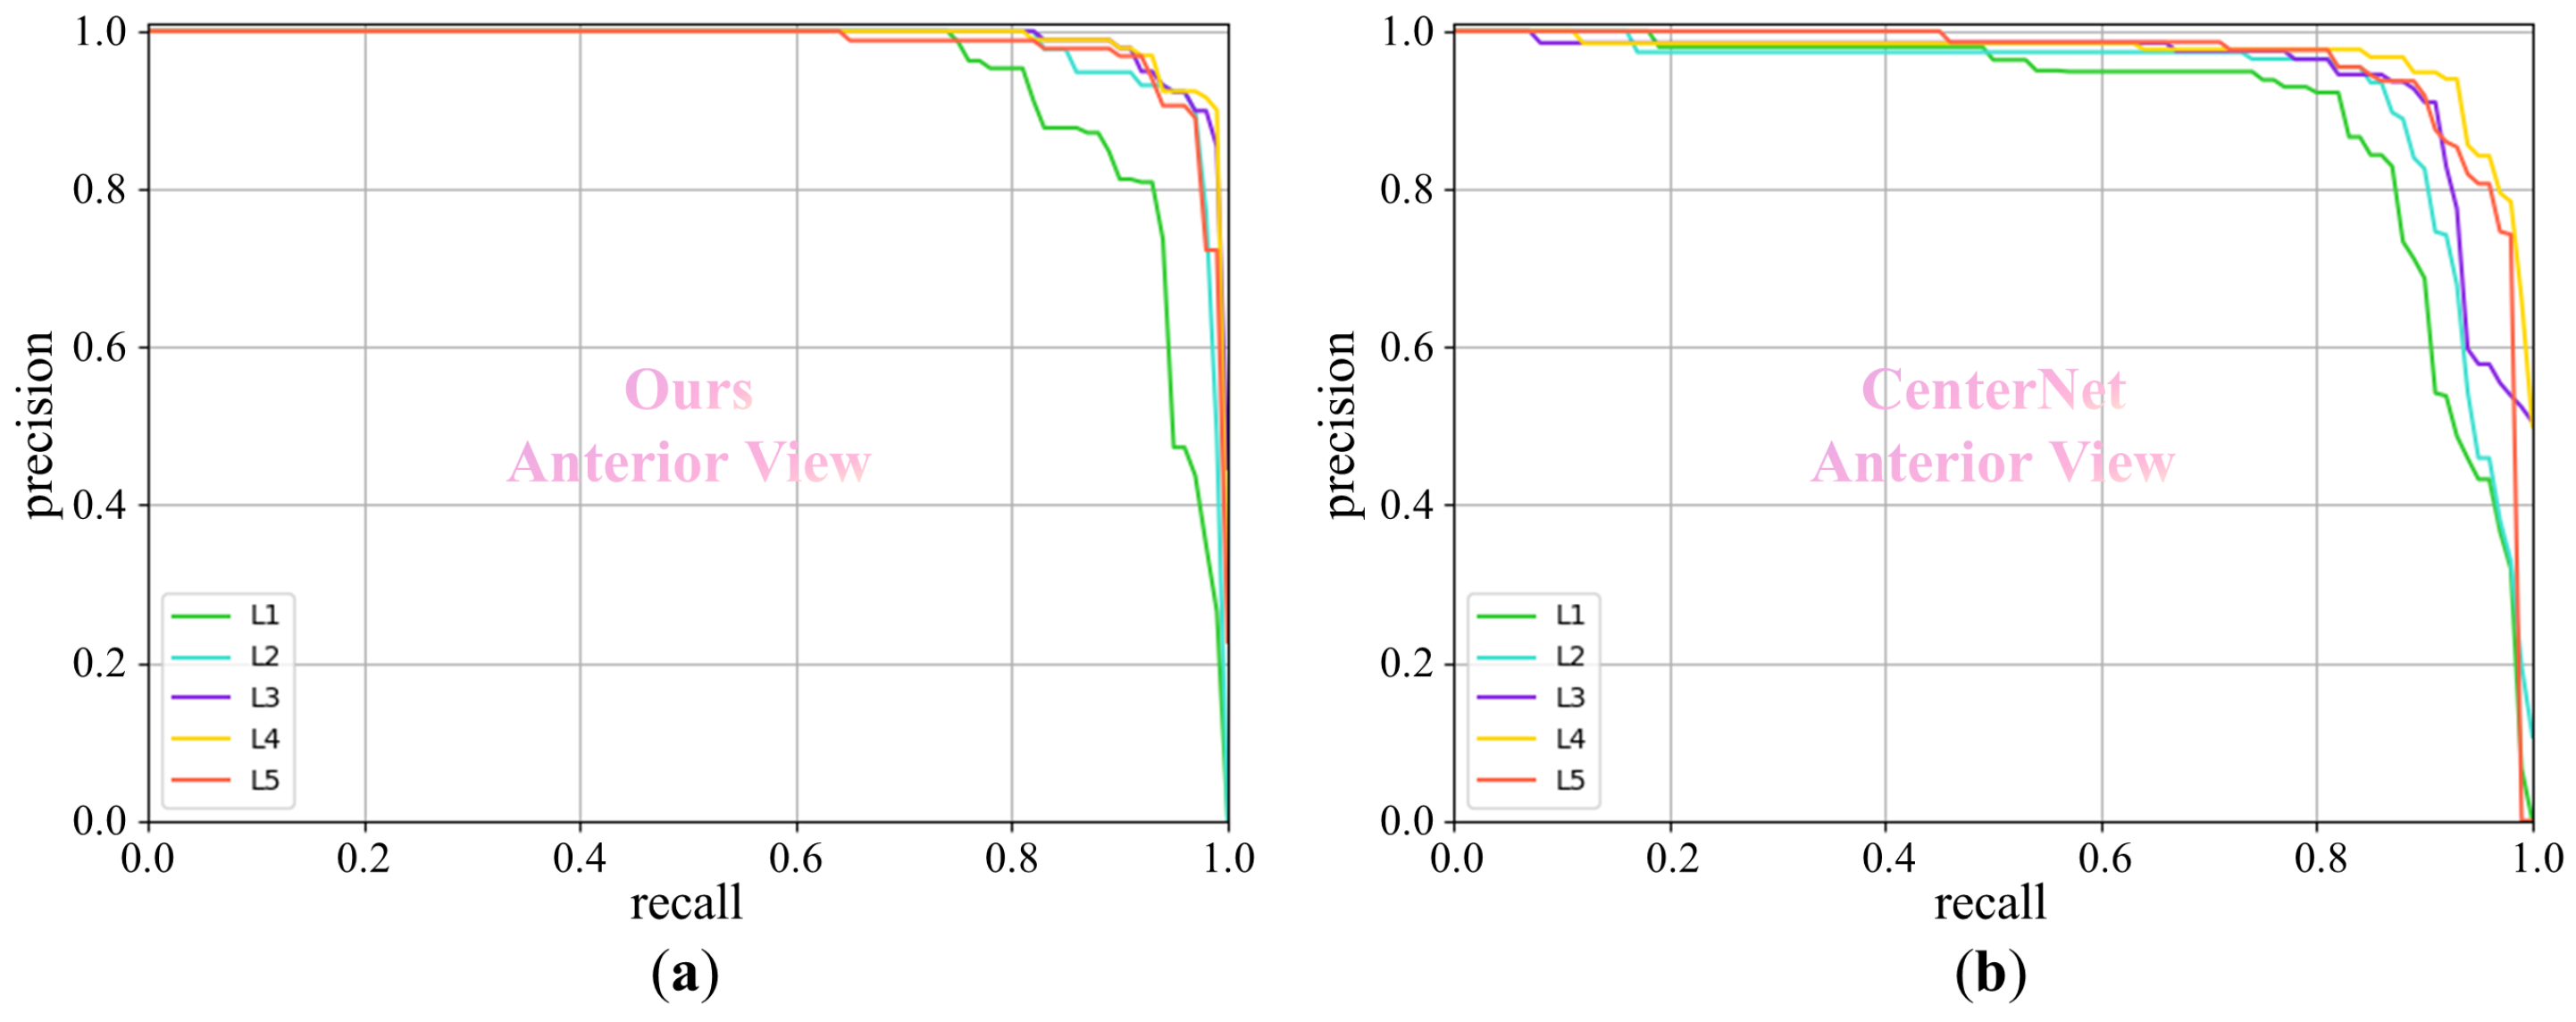
To evaluate the effectiveness of our approach, we conduct a comprehensive evaluation using two lumbar spine datasets. The experimental results show that our method achieves a promising performance when compared with standard detection models. The effectiveness of each component is validated via ablation studies as well. In the validation of the CM spine dataset, our model achieves an average performance improvement of 13.6% AP over the standard object detection model CenterNet [18]. In the anterior view and lateral view of the BUU spine dataset [19], our model achieves average performance improvements of 6.5% AP and 4.8% AP respectively, compared to CenterNet. When compared to YOLOv5 [20], our model demonstrated average performance improvements of 1.9% AP and 0.8% AP in BUU. Furthermore, our model surpasses Faster R-CNN [21] by 10.0% and 12.3% AP. Our code and data are available at: https://github.com/zengyuyuyu/Neighbor (accessed on 19 March 2024).
Our main contributions are summarized as follows:
  • We propose a novel two-stage method for accurate spine vertebrae detection to capture global spatial priors by encoding spine information in the intermediate heatmap and feeding them into a second detection sub-network along with the original image.
  • We introduce a detection head that focuses on capturing the local spatial information, which is specifically designed to predict neighboring vertebrae information, allowing each vertebra to learn the spatial relationships and dependencies with its neighboring vertebrae.
  • A modified center map function is built upon the standard Gaussian function of the heatmap-based detection method to represent centers of spine vertebrae, which enhances the accuracy and reliability of spine detection.

3. Method

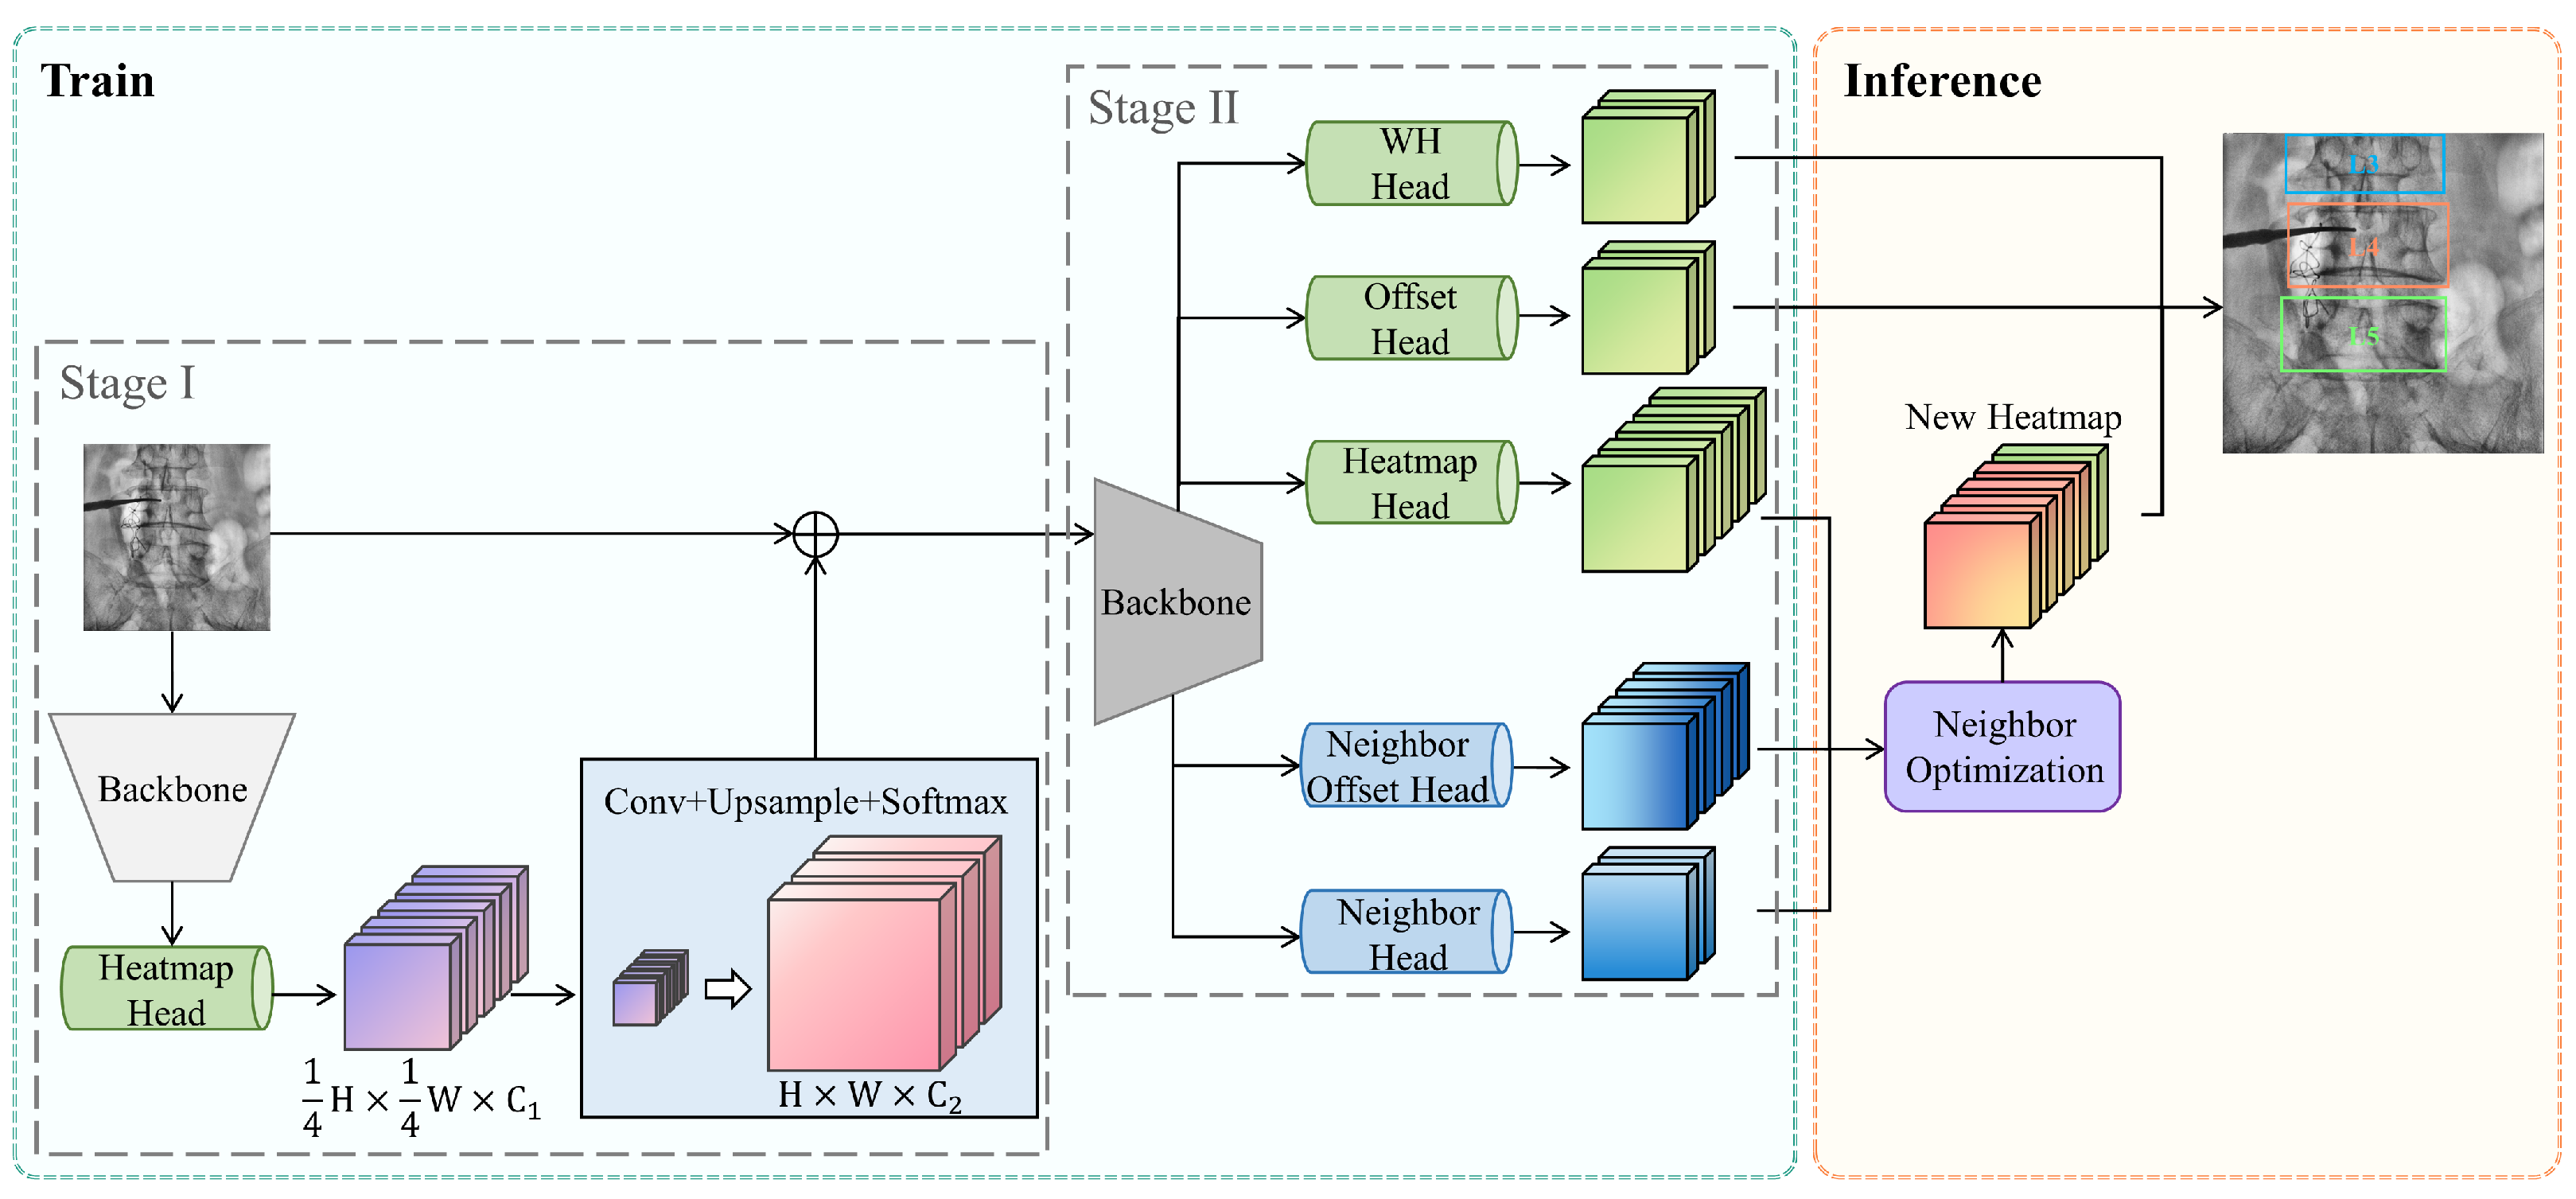
We propose a novel approach to improve the accuracy of vertebrae detection by leveraging the spatial relationships between neighboring vertebrae. The overview of our proposed method is illustrated in Figure 2. We choose CenterNet [18] as the baseline for improvement. However, these improved components are not limited to a specific framework but can also be extended to other object detection algorithms.
Figure 2. Overview of our proposed method. The training of the entire network is divided into two stages. In the first stage, the backbone network (light gray) extracts the intermediate heatmap from the input image. In the second stage, the backbone network (dark gray) is followed by five prediction branches. The first three branches (green) are used to predict the size, offset, and heatmap of each vertebra, while the last two branches (blue) are used to predict the visibility and relative offsets of neighboring vertebrae. During the inference step, the information of neighboring vertebrae is utilized to optimize the heatmap of each vertebra.
Our method utilizes a two-stage approach to capture global spatial information of spine vertebrae. In the first stage, the backbone network extracts features from the input image, generating a heatmap specifically for vertebrae. The second stage takes the intermediate heatmap from the first stage, along with the original image, to produce enhanced vertebrae detection results. To leverage local spatial information of vertebrae, the second stage also predicts the results for neighboring vertebrae. During the inference step, a neighboring optimization strategy is employed to generate a fused heatmap, which subsequently produces enhanced vertebrae detection results.

3.1. Global Spatial Relationship

We propose a new two-stage precise spine detection method to capture global spatial priors. The global spatial priors represent the spatial contextual information of the entire image, which refers to the analysis of the distribution, shape, and size relationships among vertebrae in the entire image for detection. Given an input image I 1 with the size of H × W , in the first stage, the backbone network extracts features from I 1 and generates an intermediate heatmap M specifically for spine, with the size of 1 4 H × 1 4 W × C 1 . Then, we reshape M to H × W × C 2 , the same size as the input image I 1 . In the second stage, the resized heatmap M is added to the original input image I 1 through element-wise summation, resulting in a new feature map I 2 . This map is fed into the second detection sub-network for prediction, yielding enhanced vertebrae detection results. The transformation from the output M of the first-stage backbone network to the input I 2 of the second-stage backbone network can be written as:
I 2 = S ( U ( F ( M ) ) ) + I 1 ,
where F represents the convolution function, U is an upsampling function, and S represents the softmax operator. In this way, the output of the first stage M encodes the global spatial information of vertebrae by providing the heatmap of the entire vertebrae present in the input image. By fusing M with the original input I 1 to generate the input I 2 for the second stage, our method incorporates the global spatial relationships of vertebrae in a neural network, which in turn can produce more accurate lumbar vertebrae detection results. C 1 = 5 and C 2 = 3 are used in the experiments.

3.2. Local Spatial Relationship

In addition to capturing global spatial relationships, we introduce a novel scheme to explore the local spatial relationships of vertebrae. The local spatial priors represent the information between the target vertebrae and their neighbor vertebrae in the image. Unlike global spatial priors, the local spatial priors focus more on analyzing and utilizing the features of local regions in the image to optimize vertebrae detection. For a vertebra, there are strong spatial priors between its neighbors. For example, for a certain vertebra, the relative distance to its neighboring vertebra is within a limited distance and it is easy to estimate the rough location of the neighboring vertebra. To make use of such local spatial information, different from the standard detection model that predicts the individual vertebrae, our method additionally predicts the neighbor of each vertebrae.
We first revisit the conventional heatmap-based detection network [18]. CenterNet [18] consists of three prediction heads, the output of object size S R 1 s H × 1 s W × 2 , the offset of object center to its downsampled center O R 1 s H × 1 s W × 2 , and the heatmap of objects H R 1 s H × 1 s W × C . In addition to CenterNet, our network also predicts information about its upward and downward vertebra. Typically, we add two output heads to compute the visibility of neighbors V R 1 s H × 1 s W × 2 and relative offsets to its neighbors D R 1 s H × 1 s W × 4 . For example, V ( : , : , 1 ) indicates the probability map of its upward vertebra, and V ( : , : , 2 ) indicates the existence of its downward vertebra. D ( : , : , 1 : 2 ) computes the relative offset of its upward vertebra and D ( : , : , 3 : 4 ) records the relative distance between its downward vertebra.
During the training, we follow CenterNet to compute the standard vertebra loss L center . For the additional spatial relationship output, we compute classification loss L v n for V and L d n loss for the relative distance prediction D. In summary, the training loss can be denoted as:
L o s s = L center + L neighbor = { λ c L c + λ size L size + λ off L off } + { λ v L v n + λ d L d n } ,
where λ c = 1 , λ size = 0.1 , λ off = 1 , λ v = 10 , and λ d = 0.01 .
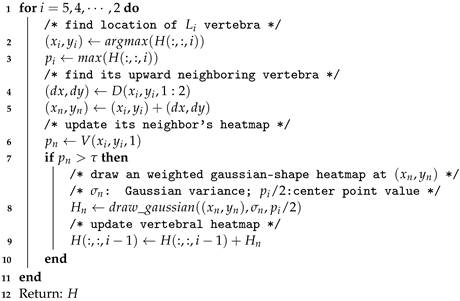
In the inference step, a neighboring vertebrae optimization strategy has been designed to adjust the central heatmap of each vertebra by utilizing neighboring vertebra information. For example, utilizing upward neighborhood information to update the vertebra heatmap is shown in Figure 3. The spinal structure is ordered from L5, L4, L3, L2, to L1, with the L5 vertebra serving as the initial point. In Algorithm 1, using the i-th vertebra, we show the steps of the proposed neighboring vertebrae optimization method using upward local spatial prior.
Figure 3. Neighboring vertebrae optimization strategy. In the inference step, the heatmap (green) is optimized by using the prediction information (blue) of the neighboring vertebrae so as to obtain a new heatmap (orange).
Finding the i-th vertebra:The location of the i-th vertebra can be directly inferred from the heatmap prediction H of the CenterNet-like head by taking the maximum value. Its probability value p i is then used to update its neighbor’s existence value.
Finding the neighbor of the i-th vertebra: By having neighbor location prediction D, for example, D ( x i , y i , 1 : 2 ) outputs the relative offset ( d x , d y ) to its upward neighbor at location ( x i , y i ) . Therefore, for the i-th vertebra at a location ( x i , y i ) , its upward neighbor is at location ( x i , y i ) + ( d x , d y ) .
Updating heatmap with neighbor vertebra: After inferencing the upward neighbor vertebra, we have additional information to update the original heatmap from CenterNet output when the visibility value p n > τ . Typically, we use a weighted 2D Gaussian function as the heatmap inferred by local spatial prior:
H n = w · exp ( x x n ) 2 + ( y y n ) 2 σ n 2 ,
where ( x n , y n ) is the coordinates of its upward neighbor vertebra, σ n is a Gaussian variance, and w = p i / 2 is applied to weight the Gaussian function by using the probability value of i-th vertebra. Then, the heatmap of its upward neighbor vertebra (the ( i 1 ) -th vertebra) can be updated by H ( : , : , i 1 ) H ( : , : , i 1 ) + H n .
Analogously, one can update the vertebrae heatmap by considering the downward local spatial prior. Finally, we can obtain the updated vertebrae heatmap by using local spatial relationship information. A simple post-processing algorithm [18] can be applied to generate vertebrae from the updated heatmap.
Algorithm 1: Pseudo-code of neighboring vertebrae optimization strategy.
Input: Vertebrae heatmap H; visibility of neighbors V; relative offsets of neighbors D; threshold τ ; Gaussian parameter σ n
Output: Optimized heatmap of objects H
Electronics 13 02137 i001

3.3. CenterMap

Our proposed heatmap method is adapted from CenterNet [18] and FCOS [15]. CenterNet employs the center points of bounding boxes to represent objects. By leveraging a Gaussian kernel, it maps the center points of ground-truth bounding boxes onto a heatmap, thereby mitigating the penalty imposed on negative positions within the positive position radius. The 2D-Gaussian disk H g is defined as follows:
H g = exp ( x x c ) 2 + ( y y c ) 2 2 σ 2 ,
where ( x c , y c ) is the coordinates of the center point of the object on the feature map, and σ is an object size-adaptive standard deviation.
However, the heatmap in CenterNet does not take into account the proximity of other positions within the bounding box to the target center. In order to suppress low-quality detection bounding boxes, FCOS introduces the concept of centerness, which effectively describes the normalized distance from a position to the object center. The centerness H c is defined as follows:
H c = min ( l , r ) · min ( t , b ) max ( l , r ) · max ( t , b ) ,
where ( l , r , t , b ) represents the distances from a certain position inside the bounding box to the four sides of the bounding box. The value of H c ranges from 0 to 1. When the value of H c is 1, it means that the pixel is precisely located at the center of the target. When the value is 0, it indicates that the pixel is not inside the bounding box.
As shown in Figure 4, in this paper, we propose a centermap representation method that combines the 2D Gaussian heatmap H g from CenterNet and the heatmap H c representing centerness. By fusing these two heatmaps, we can simultaneously consider both the center and positional distribution of objects. This fusion technique effectively mitigates the penalty imposed on negative positions near the center while also enhancing the representation of information from other locations within the bounding box. As a result, our approach offers a more comprehensive depiction of object centrality. Mathematically, the centermap is defined as follows:
C e n t e r M a p = H g · H c ,
where H g utilizes a Gaussian kernel for center encoding, and H c quantifies the proximity of each position to the center. Both sets of heatmaps have a size of 1 4 H × 1 4 W × C 1 .
Figure 4. Comparison of different methods for heatmap representation; our approach offers a more comprehensive depiction of object centrality. (a) 2D Gaussian function in CenterNet [18], (b) centerness in FCOS [15], and (c) ours.

4. Experiment

4.1. Dataset

We conduct extensive experiments on two lumbar spine datasets.
CM Spine Dataset. We use a mobile dual-mode G-arm X-ray machine (Geelin500-A) to collect 208 1024 × 1024 lumbar spine X-ray anterior view images during surgical procedures. The X-ray focal spot size is set to 0.6 mm, and the X-ray target angle is set to 10°. These images are from patients suffering from lumbar disc herniation or vertebral compression fractures. Among them, 148 images were used for training and 60 images were used for testing. For each collected image, we annotate the L1 to L5 vertebrae, and the entire dataset contains 537 vertebrae in total. To account for the varying number of vertebrae in each image, we compute the statistical occurrence of vertebrae in the dataset. Table 2 illustrates the results, showing relatively fewer occurrences of the L1 and L2 vertebrae, while the L3, L4, and L5 vertebrae exhibit a higher frequency. The combination of the L3, L4, and L5 vertebrae appears most frequently, followed by the combination of the L4 and L5 vertebrae. In contrast, images containing all five types of vertebrae are the least common.
Table 2. In the CM spine dataset, the statistical occurrence of vertebral combinations in the training and testing sets. The combination of L3, L4, and L5 vertebrae appears most frequently.
BUU Spine Dataset [19]. The Burapha Spine Dataset is a publicly available dataset of lumbar spine X-ray images. Although the entire dataset contains 3600 anterior view images and 3600 lateral view images, currently only 400 samples are publicly available. Therefore, we use 400 anterior view images and 400 lateral view images for the experiment. To account for these two distinct perspectives, we conduct separate experiments for each view. For each experiment, 300 images were selected for training and 100 images were selected for testing. The data are collected from 400 unique patients, with a gender distribution of 127 males and 273 females. The age range of the patients spans from 6 to 89 years, with an average age of approximately 50 years. Furthermore, the dataset contains lumbosacral transitional vertebrae cases, including seven sacralization images.

4.2. Evaluation

We use AP for detection evaluation metrics as in CenterNet [18]. AP is the mean of the average precision for the intersection over union (IOU) thresholds from 0.5 to 0.95 with a step size of 0.05. AP ( 50 ) is the average precision with an IOU threshold of 0.5. AP ( 75 ) is the average precision with an IOU threshold of 0.75.
AP is a metric closely associated with precision and recall in object detection tasks. Precision represents the proportion of correctly predicted targets among all predicted targets, while recall represents the proportion of correctly predicted targets among all true targets. AP provides a comprehensive evaluation that combines both precision and recall. One commonly used variant is AP ( 50 ) , which is calculated based on precision and recall. By setting the IOU threshold to 0.5 and plotting precision on the vertical axis and recall on the horizontal axis, we can generate a “precision-recall” curve. AP ( 50 ) corresponds to the area under this curve, representing the model’s performance. A larger area under the “precision-recall” curve indicates better performance.

4.3. Implementation Details

All experiments are conducted using PyTorch 1.1.0 on an NVIDIA RTX 2080Ti GPU (Santa Clara, CA, USA). The network is randomly initialized under the default settings without any pre-training on external datasets. During the training process, we employ an Hourglasss network [28] as the backbone, and both of the two backbone networks in the network have the same structure but do not share parameters. The input size of the network is set to 512 × 512 , and the output size is 128 × 128 . For the neighboring vertebrae optimization strategy in Section 3.2, we set τ = 0.75 and σ n = 2.5 . An Adam optimizer [39] is used, with a base learning rate of 1.25 × 10 4 . All models are trained from scratch with 100 epochs and the per-GPU batch size is set to 1. Other hyperparameters such as data augmentation strategies and training are set mainly to the same ones used in CenterNet [18].

4.4. Main Results

4.4.1. Results on CM Spine Dataset

In Table 3, on the CM spine dataset, we compare our method with the standard detection model based on CNN. Compared to CenterNet [18], the experimental results show that our method achieves better detection performance. In the detection of vertebral L1 to L5, our method surpasses CenterNet by 6.0%, 7.7%, 20.1%, 25.1%, and 9.3% AP, respectively.
Table 3. Results of vertebrae detection on the CM spine dataset. The best AP is in bold.

4.4.2. Results on BUU Spine Dataset

For the BUU spine dataset [19], we evaluate our method on both the anterior view and the lateral view, and the experimental results are listed in Table 4 and Table 5, respectively. In Table 4, our method outperforms CenterNet, YOLOv5 [20], and Faster R-CNN [21] in the anterior view, achieving 6.5%, 1.9%, and 10.0% AP improvements in the detection of the five vertebrae, respectively. Similarly, in Table 5, we present a detailed comparison of the detection performance for the lateral view. Our method also surpasses CenterNet, YOLOv5, and Faster R-CNN with 4.8%, 0.8%, and 12.3% AP improvements in the average detection performance of the five vertebrae, respectively. In addition, when the IOU threshold is set to 0.5, we plot the “precision-recall” curves, as shown in Figure 5 and Figure 6. These curves provide a more detailed representation of each precision and its corresponding recall.
Table 4. Results of vertebrae detection on the anterior view of BUU spine dataset. * indicates results from method [19] which used 3600 images for training.
Table 5. Results of vertebrae detection on the lateral view of BUU spine dataset. * indicates results from method [19] which used 3600 images for training.
Figure 5. The “precision-recall” curve for different methods at an IOU threshold of 0.5 on the anterior view of the BUU spine dataset. Our method demonstrates superior performance compared to CenterNet. (a) Ours and (b) CenterNet.
Figure 6. The “precision-recall” curve for different methods at an IOU threshold of 0.5 on the lateral view of the BUU spine dataset. Our method outperforms CenterNet. (a) Ours and (b) CenterNet.

4.5. Ablation Studies

We conduct ablations on the CM spine dataset.

4.5.1. Effect of the Two-Stage Detector

In order to verify the effect of global spatial prior information on detection models, we compare two different detectors: a one-stage detector and a two-stage detector. Table 6 lists a performance comparison between the two detectors. The results indicate that, compared to the one-stage detector, the two-stage detector is better at capturing the global spatial prior information of the spine vertebrae. Therefore, the two-stage detector largely outperforms the use of the one-stage detector.
Table 6. Comparison of different detectors. Train denotes the training category and Evaluate denotes that only L5 vertebrae are evaluated.

4.5.2. Impact of Different Heatmap Representation

To investigate the impact of object center representation methods on the proposed model, we also study different center graph functions. Compared to the standard Gaussian function, using an improved centermap function to represent the ground truth of the object can enhance the accuracy of detection, as shown in Table 7. Experimental results demonstrate that centermap provides more precise and comprehensive ground truth information, which is of significant importance for network training.
Table 7. Comparison of different methods for heatmap representation.

4.5.3. Training Category

To study the importance of the inherent spatial characteristics of the spine in vertebrae detection tasks, we compare the impact of training on five categories (L1 to L5) versus training on a single category (L5) regarding the detection results of the L5 vertebra. According to the results in Table 6, Table 7 and Table 8, compared to training on a single category alone (L5), training on all five categories (L1 to L5) yields a higher average precision (AP) result. In addition, according to Table 8, it can be observed that when training is performed on five categories (L1 to L5) with both the two-stage detector and the centermap method simultaneously, the detection performance of L5 is improved.
Table 8. Impact of training category and effect of the simultaneous introduction of the two-stage and centermap methods.

4.5.4. Effect of the Local Spatial Relationship

Table 9 and Table 10 illustrate the impact of local spatial relationships on model performance. During the training phase, the local spatial information detection head leads to significant improvements in the detection, as shown in Table 9. Experimental results demonstrate that this detection head enables the model to better comprehend the relationships between neighboring vertebrae, resulting in enhanced performance. Specifically, with stable L5 recognition, there is an obvious boost in AP for other vertebrae. The performance of L4 is boosted by 10.3% AP (Row 4 and Row 9). Additionally, L3, L2, and L1 are also boosted by 4.8% AP (Row 3 and Row 8), 1.5% AP (Row 2 and Row 7), and 9.8% AP (Row 1 and Row 6), respectively.
Table 9. Ablation study of the local spatial relationship during the training phase. Neighbor-train denotes the local spatial information detection head during the training phase, while Neighbor-infer denotes the neighboring vertebrae optimization strategy during the inference phase.
Table 10. Ablation study of local spatial relationship during the inference phase.
Furthermore, on the basis of introducing local spatial information detection heads, a strategy for optimizing neighboring vertebrae is further incorporated during the inference stage. This method not only improves the classification accuracy of the algorithm but also obtains more precise object positional information, as demonstrated in Figure 7. Consequently, the proposed approach achieves the best performance, as shown in Table 10. Specifically, the performance of L4 is boosted by 6.0% AP (Row 4 and Row 9). Additionally, L3, L2, and L1 are also boosted by 21.9% AP (Row 3 and Row 8), 2.0% AP (Row 2 and Row 7), and 0.6% AP (Row 1 and Row 6), respectively.
Figure 7. Qualitative results: (a) represents the ground truth for object detection, while (c) compared to (b), incorporates the learning and utilization of neighboring vertebra local spatial information during both training and inference stages. The bounding boxes of different categories of vertebrae are distinguished by different colors.

5. Discussion

This study is dedicated to lumbar vertebrae detection, aiming to automatically detect the category, center point position, length, and width of each vertebra. This method can be effectively integrated into X-ray devices as a tool to assist doctors in diagnosis and treatment. On the visualization interface of X-ray devices, surgeons can observe in real-time the algorithm-assisted predicted bounding boxes of vertebrae and their information. Furthermore, surgeons can refine or correct the predicted position by interactively moving the box to more desirable locations using a keyboard and mouse. To this end, the adjusted bounding box information can be automatically calculated by the algorithm. Additionally, our current model and data focus on the L1 to L5 vertebrae detection but do not include the abnormal vertebrae, such as L6 vertebrae caused by lumbarization. In the future, we will expand the research scope to achieve precise vertebrae detection under various abnormalities.

6. Conclusions

In this paper, we introduce a vertebrae detection method based on inherent spatial characteristics of the spine. This method utilizes the spatial relationships between vertebrae to improve the accuracy of lumbar vertebrae detection. CenterNet is an anchor-free CNN-based object detection method. Its simple design and high computational efficiency make it an ideal choice as our baseline. Even though we choose CenterNet as the baseline framework and make improvements upon it, we emphasize that the components of these improvements are not limited to the CenterNet framework but can be extended to other object detection algorithms as well. Specifically, to better capture global and local priors, we design a two-stage detector and introduce a local spatial detection head. Additionally, a neighboring vertebrae optimization strategy is designed to optimize the detection results. We conducted experiments on different datasets. In the CM spine dataset, compared with CenterNet, our algorithm achieved an average performance improvement of 13.6% AP. In the BUU spine dataset of the anterior and lateral views, compared to CenterNet, the average performances improved by 6.5% and 4.8% AP, respectively. Compared to YOLOv5, our model demonstrated average performance improvements of 1.9% and 0.8% AP in BUU. Furthermore, compared to Faster R-CNN, our model surpassed 10.0% and 12.3% AP. These experimental results demonstrate that the proposed method achieves better performance in vertebrae detection when compared to the standard method.

Author Contributions

Conceptualization, Y.Z. and E.C.; methodology, Y.Z.; software, Y.Z.; validation, Y.Z. and C.W.; formal analysis, C.W., Q.Z. and Z.S.; investigation, K.W., P.X. and B.C.; resources, B.S.; data curation, K.W., L.D. and C.X.; writing—original draft preparation, Y.Z.; writing—review and editing, E.C.; visualization, Y.Z.; supervision, E.C. and B.S.; project administration, E.C. and B.S.; funding acquisition, B.S. All authors have read and agreed to the published version of the manuscript.

Funding

This work was supported in part by the National Natural Science Foundation of China under Grant 61973294, in part by the Anhui Provincial Key R&D Program under Grant (2023s07020017, 2022i01020020), in part by the University Synergy Innovation Program of Anhui Province, China, under Grant GXXT-2021-030, and in part by the Anhui Provincial Key Laboratory of Bionic Sensing and Advanced Robot Technology.

Data Availability Statement

Our code and data are available at https://github.com/zengyuyuyu/Neighbor (accessed on 19 March 2024).

Conflicts of Interest

The authors declare no conflicts of interest.

References

  1. Hoy, D.; Bain, C.; Williams, G.; March, L.; Brooks, P.; Blyth, F.; Woolf, A.; Vos, T.; Buchbinder, R. A systematic review of the global prevalence of low back pain. Arthritis Rheum. 2012, 64, 2028–2037. [Google Scholar] [CrossRef] [PubMed]
  2. Brady, A.P. Error and discrepancy in radiology: Inevitable or avoidable? Insights Imaging 2017, 8, 171–182. [Google Scholar] [CrossRef] [PubMed]
  3. Chen, X.; Wang, X.; Zhang, K.; Fung, K.M.; Thai, T.C.; Moore, K.; Mannel, R.S.; Liu, H.; Zheng, B.; Qiu, Y. Recent advances and clinical applications of deep learning in medical image analysis. Med. Image Anal. 2022, 79, 102444. [Google Scholar] [CrossRef]
  4. Qu, B.; Cao, J.; Qian, C.; Wu, J.; Lin, J.; Wang, L.; Ou-Yang, L.; Chen, Y.; Yan, L.; Hong, Q.; et al. Current development and prospects of deep learning in spine image analysis: A literature review. Quant. Imaging Med. Surg. 2022, 12, 3454–3479. [Google Scholar] [CrossRef] [PubMed]
  5. Galbusera, F.; Casaroli, G.; Bassani, T. Artificial intelligence and machine learning in spine research. JOR Spine 2019, 2, e1044. [Google Scholar] [CrossRef] [PubMed]
  6. Tang, X. The role of artificial intelligence in medical imaging research. BJR Open 2019, 2, 20190031. [Google Scholar] [CrossRef] [PubMed]
  7. Nakata, N. Recent technical development of artificial intelligence for diagnostic medical imaging. Jpn. J. Radiol. 2019, 37, 103–108. [Google Scholar] [CrossRef] [PubMed]
  8. D’Antoni, F.; Russo, F.; Ambrosio, L.; Vollero, L.; Vadalà, G.; Merone, M.; Papalia, R.; Denaro, V. Artificial intelligence and computer vision in low back pain: A systematic review. Int. J. Environ. Res. Public Health 2021, 18, 10909. [Google Scholar] [CrossRef] [PubMed]
  9. Chen, H.; Shen, C.; Qin, J.; Ni, D.; Shi, L.; Cheng, J.C.; Heng, P.A. Automatic localization and identification of vertebrae in spine CT via a joint learning model with deep neural networks. In Proceedings of the Medical Image Computing and Computer-Assisted Intervention—MICCAI, Munich, Germany, 5–9 October 2015; pp. 515–522. [Google Scholar]
  10. Cai, Y.; Landis, M.; Laidley, D.T.; Kornecki, A.; Lum, A.; Li, S. Multi-modal vertebrae recognition using transformed deep convolution network. Comput. Med. Imaging Graph. 2016, 51, 11–19. [Google Scholar] [CrossRef]
  11. Yi, J.; Wu, P.; Huang, Q.; Qu, H.; Metaxas, D.N. Vertebra-focused landmark detection for scoliosis assessment. In Proceedings of the IEEE International Symposium on Biomedical Imaging (ISBI), Iowa City, IA, USA, 3–7 April 2020; pp. 736–740. [Google Scholar]
  12. Zhou, Z.; Zhu, J.; Yao, C. Vertebral center points locating and cobb angle measurement based on deep learning. Appl. Sci. 2023, 13, 3817. [Google Scholar] [CrossRef]
  13. Glocker, B.; Feulner, J.; Criminisi, A.; Haynor, D.R.; Konukoglu, E. Automatic localization and identification of vertebrae in arbitrary field-of-view CT scans. In Proceedings of the Medical Image Computing and Computer-Assisted Intervention—MICCAI, Nice, France, 1–5 October 2012; pp. 590–598. [Google Scholar]
  14. Lootus, M.; Kadir, T.; Zisserman, A. Vertebrae detection and labelling in lumbar MR images. In Proceedings of the Computational Methods and Clinical Applications for Spine Imaging, Nagoya, Japan, 22–26 September 2013; pp. 219–230. [Google Scholar]
  15. Tian, Z.; Shen, C.; Chen, H.; He, T. Fcos: Fully convolutional one-stage object detection. In Proceedings of the IEEE/CVF International Conference on Computer Vision (ICCV), Seoul, Republic of Korea, 27 October–2 November 2019; pp. 9627–9636. [Google Scholar]
  16. Chen, Y.; Tai, L.; Sun, K.; Li, M. Monopair: Monocular 3d object detection using pairwise spatial relationships. In Proceedings of the IEEE/CVF Conference on Computer Vision and Pattern Recognition (CVPR), Seattle, WA, USA, 14–19 June 2020; pp. 12093–12102. [Google Scholar]
  17. Wang, J.; Ma, Y.; Huang, S.; Hui, T.; Wang, F.; Qian, C.; Zhang, T. A keypoint-based global association network for lane detection. In Proceedings of the IEEE/CVF Conference on Computer Vision and Pattern Recognition (CVPR), New Orleans, LO, USA, 18–24 June 2022; pp. 1392–1401. [Google Scholar]
  18. Zhou, X.; Wang, D.; Krähenbühl, P. Objects as points. arXiv 2019, arXiv:1904.07850. [Google Scholar]
  19. Klinwichit, P.; Yookwan, W.; Limchareon, S.; Chinnasarn, K.; Jang, J.S.; Onuean, A. BUU-LSPINE: A thai open lumbar spine dataset for spondylolisthesis detection. Appl. Sci. 2023, 13, 8646. [Google Scholar] [CrossRef]
  20. Jocher, G. Yolov5. Available online: https://github.com/ultralytics/yolov5 (accessed on 16 March 2024).
  21. Ren, S.; He, K.; Girshick, R.; Sun, J. Faster r-cnn: Towards real-time object detection with region proposal networks. IEEE Trans. Pattern Anal. Mach. Intell. 2017, 39, 1137–1149. [Google Scholar] [CrossRef] [PubMed]
  22. Girshick, R.; Donahue, J.; Darrell, T.; Malik, J. Rich feature hierarchies for accurate object detection and semantic segmentation. In Proceedings of the IEEE/CVF Conference on Computer Vision and Pattern Recognition (CVPR), Columbus, OH, USA, 23–28 June 2014; pp. 580–587. [Google Scholar]
  23. Girshick, R. Fast r-cnn. In Proceedings of the IEEE International Conference on Computer Vision (ICCV), Santiago, Chile, 7–13 December 2015; pp. 1440–1448. [Google Scholar]
  24. Redmon, J.; Farhadi, A. Yolo9000: Better, faster, stronger. In Proceedings of the IEEE Conference on Computer Vision and Pattern Recognition (CVPR), Honolulu, HI, USA, 21–26 July 2017; pp. 6517–6525. [Google Scholar]
  25. Redmon, J.; Farhadi, A. Yolov3: An incremental improvement. arXiv 2018, arXiv:1804.02767. [Google Scholar]
  26. Bochkovskiy, A.; Wang, C.Y.; Liao, H.Y.M. Yolov4: Optimal speed and accuracy of object detection. arXiv 2020, arXiv:2004.10934. [Google Scholar]
  27. Wang, C.Y.; Bochkovskiy, A.; Liao, H.Y.M. Yolov7: Trainable bag-of-freebies sets new state-of-the-art for real-time object detectors. In Proceedings of the IEEE Conference on Computer Vision and Pattern Recognition (CVPR), Vancouver, Canada, 17–24 June 2023; pp. 7464–7475. [Google Scholar]
  28. Law, H.; Deng, J. Cornernet: Detecting objects as paired keypoints. In Proceedings of the European Conference on Computer Vision (ECCV), Munich, Germany, 8–14 September 2018; pp. 734–750. [Google Scholar]
  29. Zhou, X.; Zhuo, J.; Krahenbuhl, P. Bottom-up object detection by grouping extreme and center points. In Proceedings of the IEEE/CVF Conference on Computer Vision and Pattern Recognition (CVPR), Long Beach, CA, USA, 16–20 June 2019; pp. 850–859. [Google Scholar]
  30. Levine, M.; De Silva, T.; Ketcha, M.D.; Vijayan, R.; Doerr, S.; Uneri, A.; Vedula, S.; Theodore, N.; Siewerdsen, J.H. Automatic vertebrae localization in spine CT: A deep-learning approach for image guidance and surgical data science. In Proceedings of the SPIE Medical Imaging, San Diego, CA, USA, 16–21 February 2019; pp. 196–203. [Google Scholar]
  31. Yang, D.; Xiong, T.; Xu, D.; Huang, Q.; Liu, D.; Zhou, S.K.; Xu, Z.; Park, J.; Chen, M.; Tran, T.D.; et al. Automatic vertebra labeling in large-scale 3D CT using deep image-to-image network with message passing and sparsity regularization. In Proceedings of the International Conference on Information Processing in Medical Imaging, Boone, CA, USA, 25–30 June 2017; pp. 633–644. [Google Scholar]
  32. Zhang, C.; Wang, J.; He, J.; Gao, P.; Xie, G. Automated vertebral landmarks and spinal curvature estimation using non-directional part affinity fields. Neurocomputing 2021, 438, 280–289. [Google Scholar] [CrossRef]
  33. Forsberg, D.; Sjöblom, E.; Sunshine, J.L. Detection and labeling of vertebrae in MR images using deep learning with clinical annotations as training data. J. Digit. Imaging 2017, 30, 406–412. [Google Scholar] [CrossRef] [PubMed]
  34. Lu, J.T.; Pedemonte, S.; Bizzo, B.; Doyle, S.; Andriole, K.P.; Michalski, M.H.; Gonzalez, R.G.; Pomerantz, S.R. Deep Spine: Automated lumbar vertebral segmentation, disc-level designation, and spinal stenosis grading using deep learning. In Proceedings of the Machine Learning for Healthcare Conference PMLR, Palo Alto, CA, USA, 17–18 August 2018; pp. 403–419. [Google Scholar]
  35. Windsor, R.; Jamaludin, A.; Kadir, T.; Zisserman, A. A convolutional approach to vertebrae detection and labelling in whole spine MRI. In Proceedings of the Medical Image Computing and Computer-Assisted Intervention—MICCAI, Lima, Peru, 4–8 October 2020; pp. 712–722. [Google Scholar]
  36. Liao, H.; Mesfin, A.; Luo, J. Joint vertebrae identification and localization in spinal CT images by combining short-and long-range contextual information. IEEE Trans. Med. Imaging 2018, 37, 1266–1275. [Google Scholar] [CrossRef] [PubMed]
  37. Zhang, D.; Chen, B.; Li, S. Sequential conditional reinforcement learning for simultaneous vertebral body detection and segmentation with modeling the spine anatomy. Med. Image Anal. 2021, 67, 101861. [Google Scholar] [CrossRef] [PubMed]
  38. Zhao, S.; Wu, X.; Chen, B.; Li, S. Automatic vertebrae recognition from arbitrary spine MRI images by a category-Consistent self-calibration detection framework. Med. Image Anal. 2021, 67, 101826. [Google Scholar] [CrossRef]
  39. Kingma, D.P.; Ba, J. Adam: A method for stochastic optimization. arXiv 2014, arXiv:1412.6980. [Google Scholar]
Disclaimer/Publisher’s Note: The statements, opinions and data contained in all publications are solely those of the individual author(s) and contributor(s) and not of MDPI and/or the editor(s). MDPI and/or the editor(s) disclaim responsibility for any injury to people or property resulting from any ideas, methods, instructions or products referred to in the content.

Article Metrics

Citations

Article Access Statistics

Multiple requests from the same IP address are counted as one view.