You are currently viewing a new version of our website. To view the old version click .
Electronics
  • Article
  • Open Access

30 January 2023

Physical Activity Recognition Based on Deep Learning Using Photoplethysmography and Wearable Inertial Sensors

,
and
1
Image Information and Intelligence Laboratory, Department of Computer Engineering, Faculty of Engineering, Mahidol University, Nakhon Pathom 73170, Thailand
2
Department of Computer Engineering, School of Information and Communication Technology, University of Phayao, Phayao 56000, Thailand
3
Intelligent and Nonlinear Dynamic Innovations Research Center, Science and Technology Research Institute, King Mongkut’s University of Technology North Bangkok, Bangkok 10800, Thailand
4
Department of Mathematics, Faculty of Applied Science, King Mongkut’s University of Technology North Bangkok, Bangkok 10800, Thailand
This article belongs to the Special Issue Artificial Intelligence Technologies and Applications

Abstract

Human activity recognition (HAR) extensively uses wearable inertial sensors since this data source provides the most information for non-visual datasets’ time series. HAR research has advanced significantly in recent years due to the proliferation of wearable devices with sensors. To improve recognition performance, HAR researchers have extensively investigated other sources of biosignals, such as a photoplethysmograph (PPG), for this task. PPG sensors measure the rate at which blood flows through the body, and this rate is regulated by the heart’s pumping action, which constantly occurs throughout the body. Even though detecting body movement and gestures was not initially the primary purpose of PPG signals, we propose an innovative method for extracting relevant features from the PPG signal and use deep learning (DL) to predict physical activities. To accomplish the purpose of our study, we developed a deep residual network referred to as PPG-NeXt, designed based on convolutional operation, shortcut connections, and aggregated multi-branch transformation to efficiently identify different types of daily life activities from the raw PPG signal. The proposed model achieved more than 90% prediction F1-score from experimental results using only PPG data on the three benchmark datasets. Moreover, our results indicate that combining PPG and acceleration signals can enhance activity recognition. Although, both biosignals—electrocardiography (ECG) and PPG—can differentiate between stationary activities (such as sitting) and non-stationary activities (such as cycling and walking) with a level of success that is considered sufficient. Overall, our results propose that combining features from the ECG signal can be helpful in situations where pure tri-axial acceleration (3D-ACC) models have trouble differentiating between activities with relative motion (e.g., walking, stair climbing) but significant differences in their heart rate signatures.

1. Introduction

Using sensors built into intelligent wearable devices (e.g., mobile smartphones and smart home appliances) to track and identify human activities has been used in a variety of fields, such as security and surveillance [1], smart homes [2], healthcare [3], and human–computer interaction [4]. Human Activity Recognition (HAR) collects raw signals characterizing the surrounding environment through various sensors on individuals, either independent or embedded. Based on the features retrieved from raw sensor traces, HAR traditionally uses machine learning (ML) models to recognize the fundamental activity. The most commonly used sensors include wearable inertial sensors (typically sense to tri-axial acceleration (3D-ACC) and tri-axial angular velocity) [5], GPS [6], cameras, or image-based sensors [1]. Each of these sensor modalities has its particular strengths and weaknesses. For example, a 3D-ACC attached to the user’s body consumes little power and reliably captures motion data despite its sensitivity to position and orientation. Location trajectories captured by GPS can show location-based activities (e.g., shopping in a mall), but if buildings in crowded metropolitan locations obscure them, there is a possibility that GPS will not function appropriately. On the other side, the vision-based sensor can immediately record the types of behaviors being performed, posing significant privacy concerns. Researchers have proposed combining different types of sensors and using new sensors, such as Bluetooth and Wi-Fi [7], to increase predictive performance because no one sensor excels in all possible application cases.
A photoplethysmography (PPG) sensor is rapidly becoming one of the most popular sensors in modern smartwatches and wristbands. PPG signals, optically obtained plethysmographs, can be applied to monitor variations in the amount of blood flowing through the microvascular system [8]. In other words, it estimates the amount of blood flow by transmitting light into the body and determining how much of that light is reflected. In this way, heart rate is measured. Unlike electrocardiography (ECG), which requires sticky metal electrodes to be placed on the skin of the body to monitor the electrical activity of the heart and muscles [9], monitoring using PPG can be conducted on the outside of the body at the periphery, which requires less intrusive physical contact. Consequently, PPG sensors are being utilized more frequently in personal fitness gadgets such as smartwatches and wristbands to monitor the user’s heart rate.
Among smartphones and smartwatches, built-in 3D-ACCs are the most common sensors that can be used for activity monitoring. As smartphones and smartwatches continue to grow in popularity, the methods of data fusion utilized by PPG and acceleration data can directly provide accurate and reliable human activity information on these devices [10,11]. In contrast to inertial measurement units (IMU), which commonly include accelerometers and gyroscopes, PPG sensors are not typically employed for HAR classification because they are not intended to collect motion data. However, using a PPG sensor for HAR presents several advantages [12]: (i) wearables technology is becoming increasingly commonplace, and these devices nearly invariably incorporate a PPG sensor. Since there is no additional expense incurred by the user of a PPG-enabled smartwatch or wristwatch, it makes perfect sense to make use of the information that they can supply; (ii) in situations where other HAR sensors are not accessible, the PPG sensor can be used alone—alternatively, it can be combined with the other sensors to improve recognition performance; and (iii) this sensor can be used to monitor various physiological parameters (such as blood volume and rate of the heart) in one solution. For these reasons, we also employed the PPG signal to predict human activities.
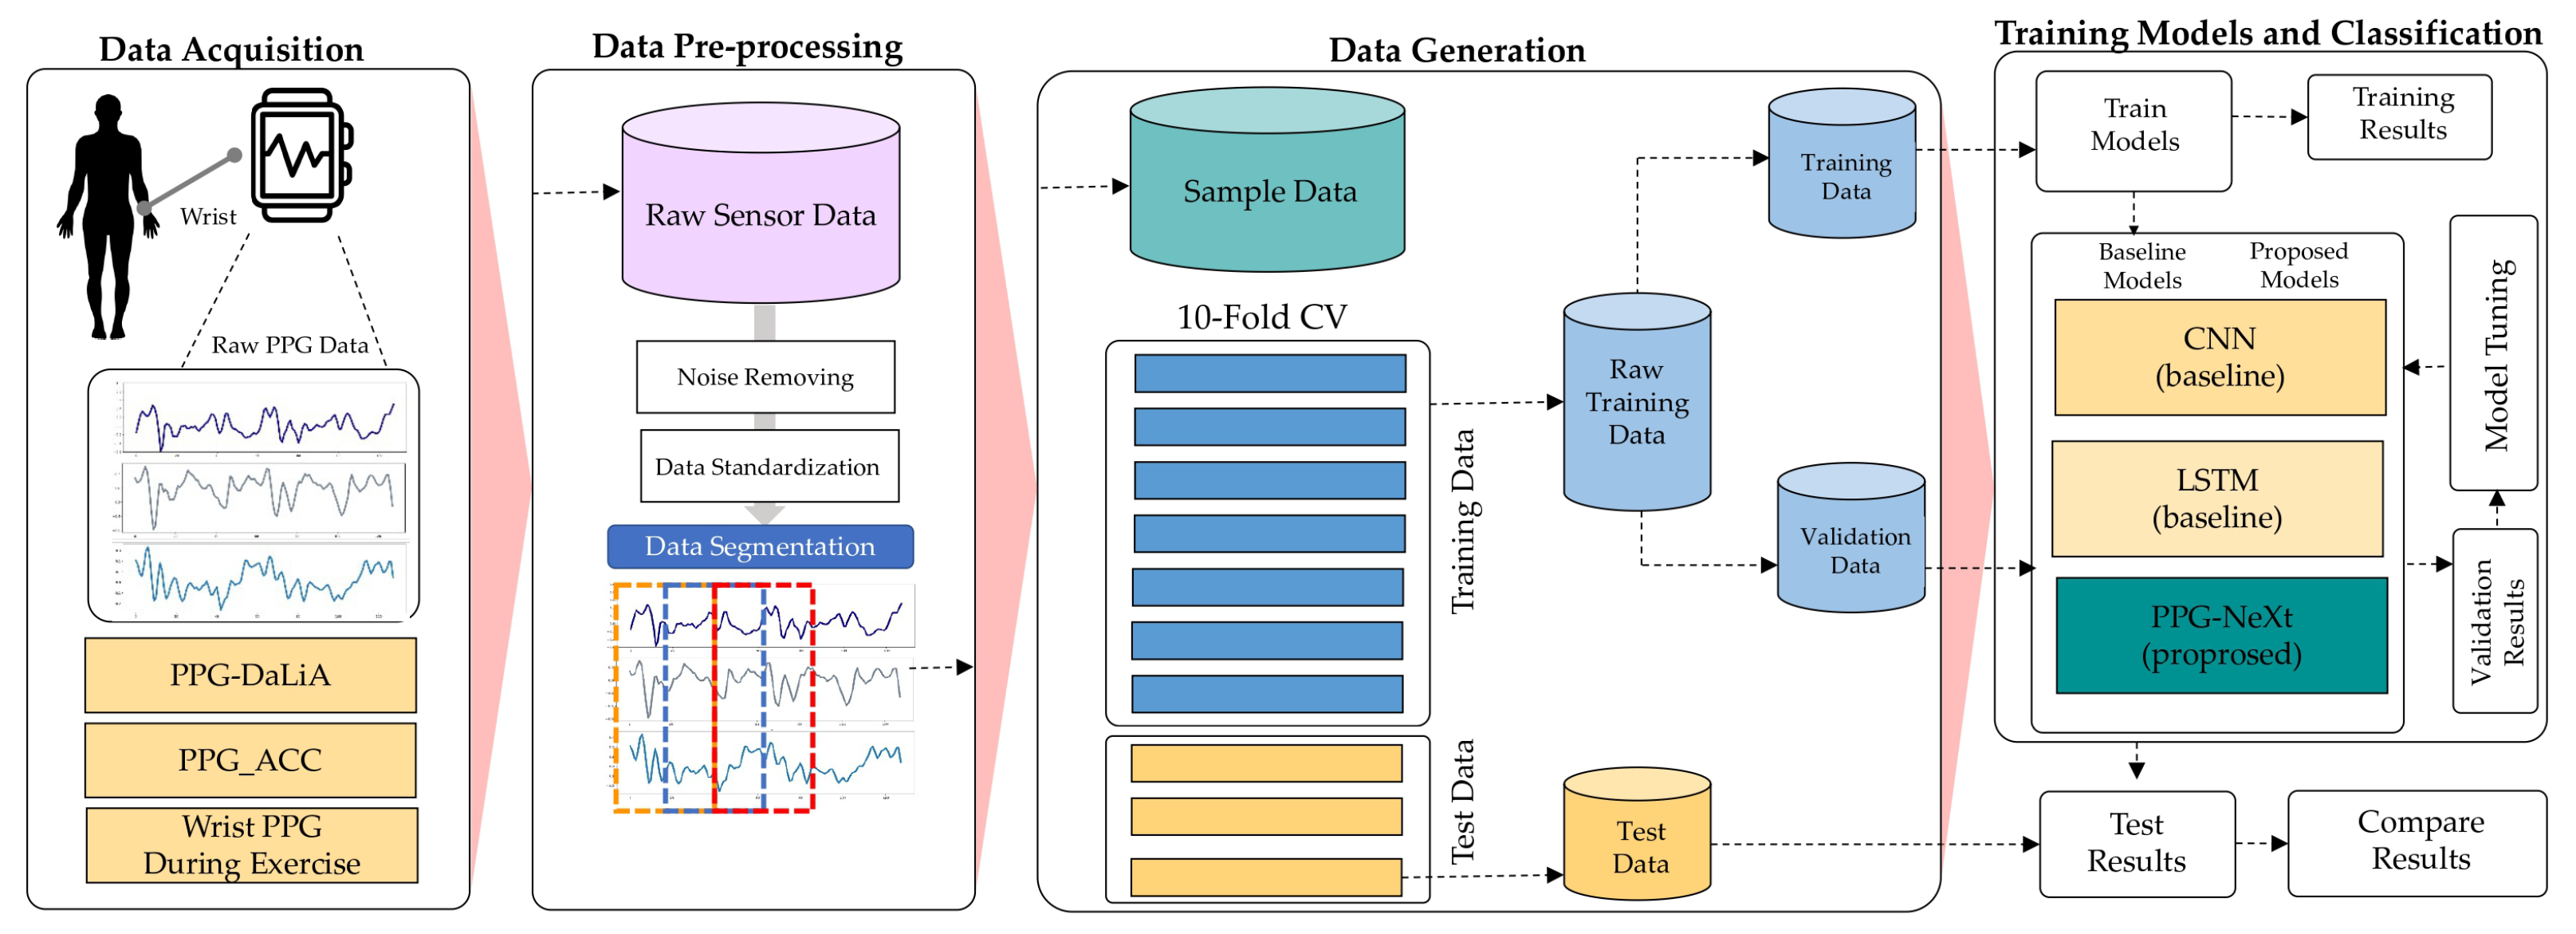
This work studies physical activity recognition using biosignals such as PPG captured from smart wearable devices. To achieve this goal, we first introduce a deep residual neural network for PPG-based HAR called PPG-NeXt. For performance evaluation, we used three public PPG benchmark datasets (PPG-DaLiA, PPG-ACC, and Wrist PPG During Exercise). The following is a condensed summary of the most important contributions that can be drawn from this research:
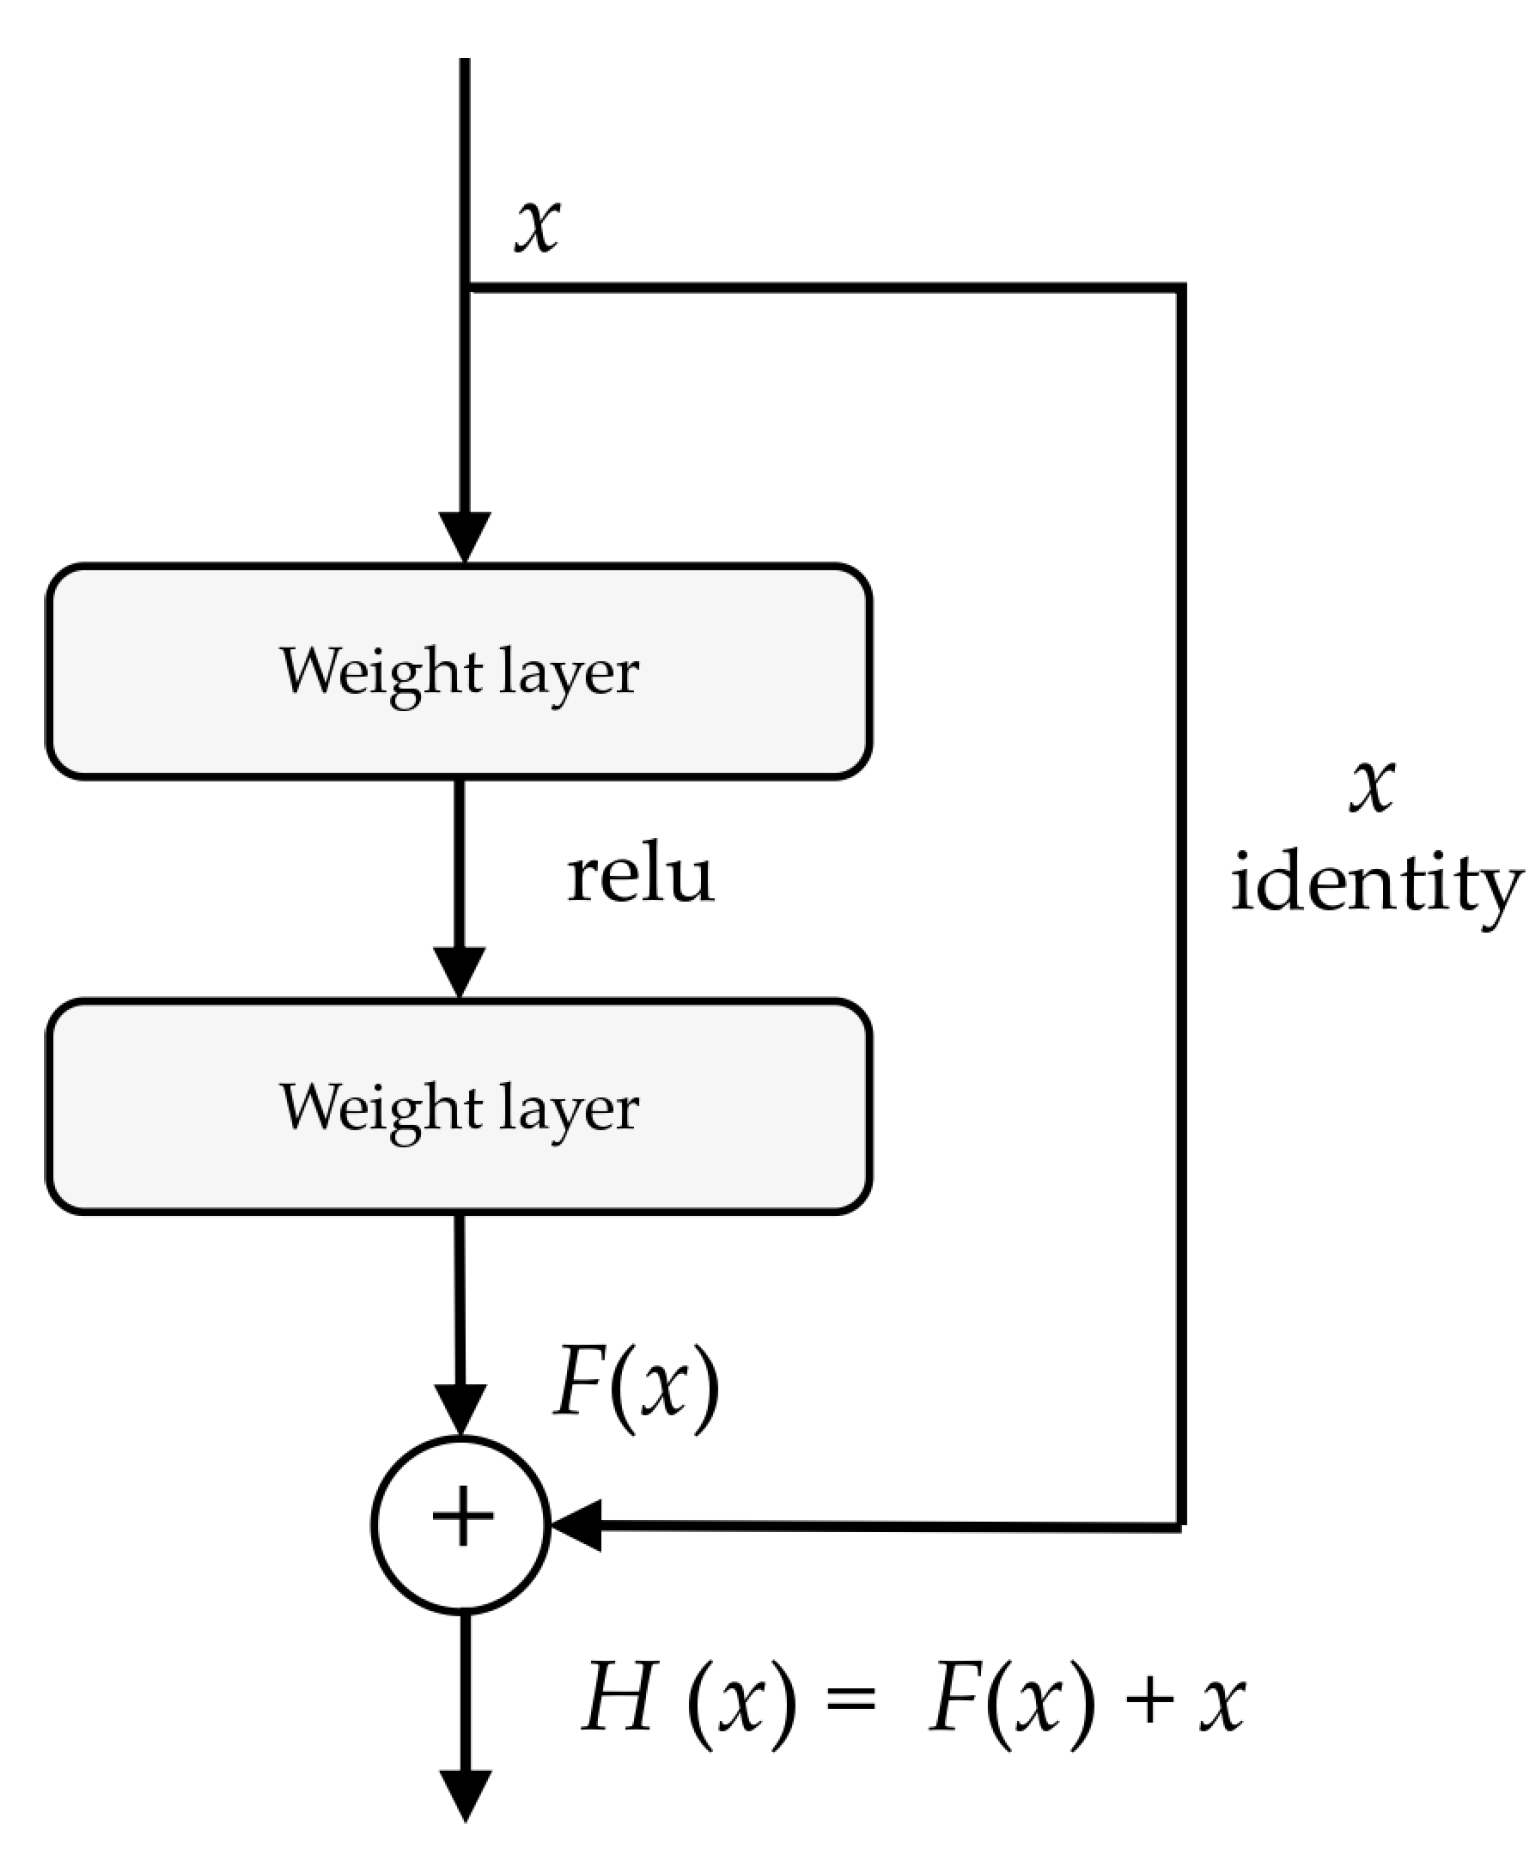
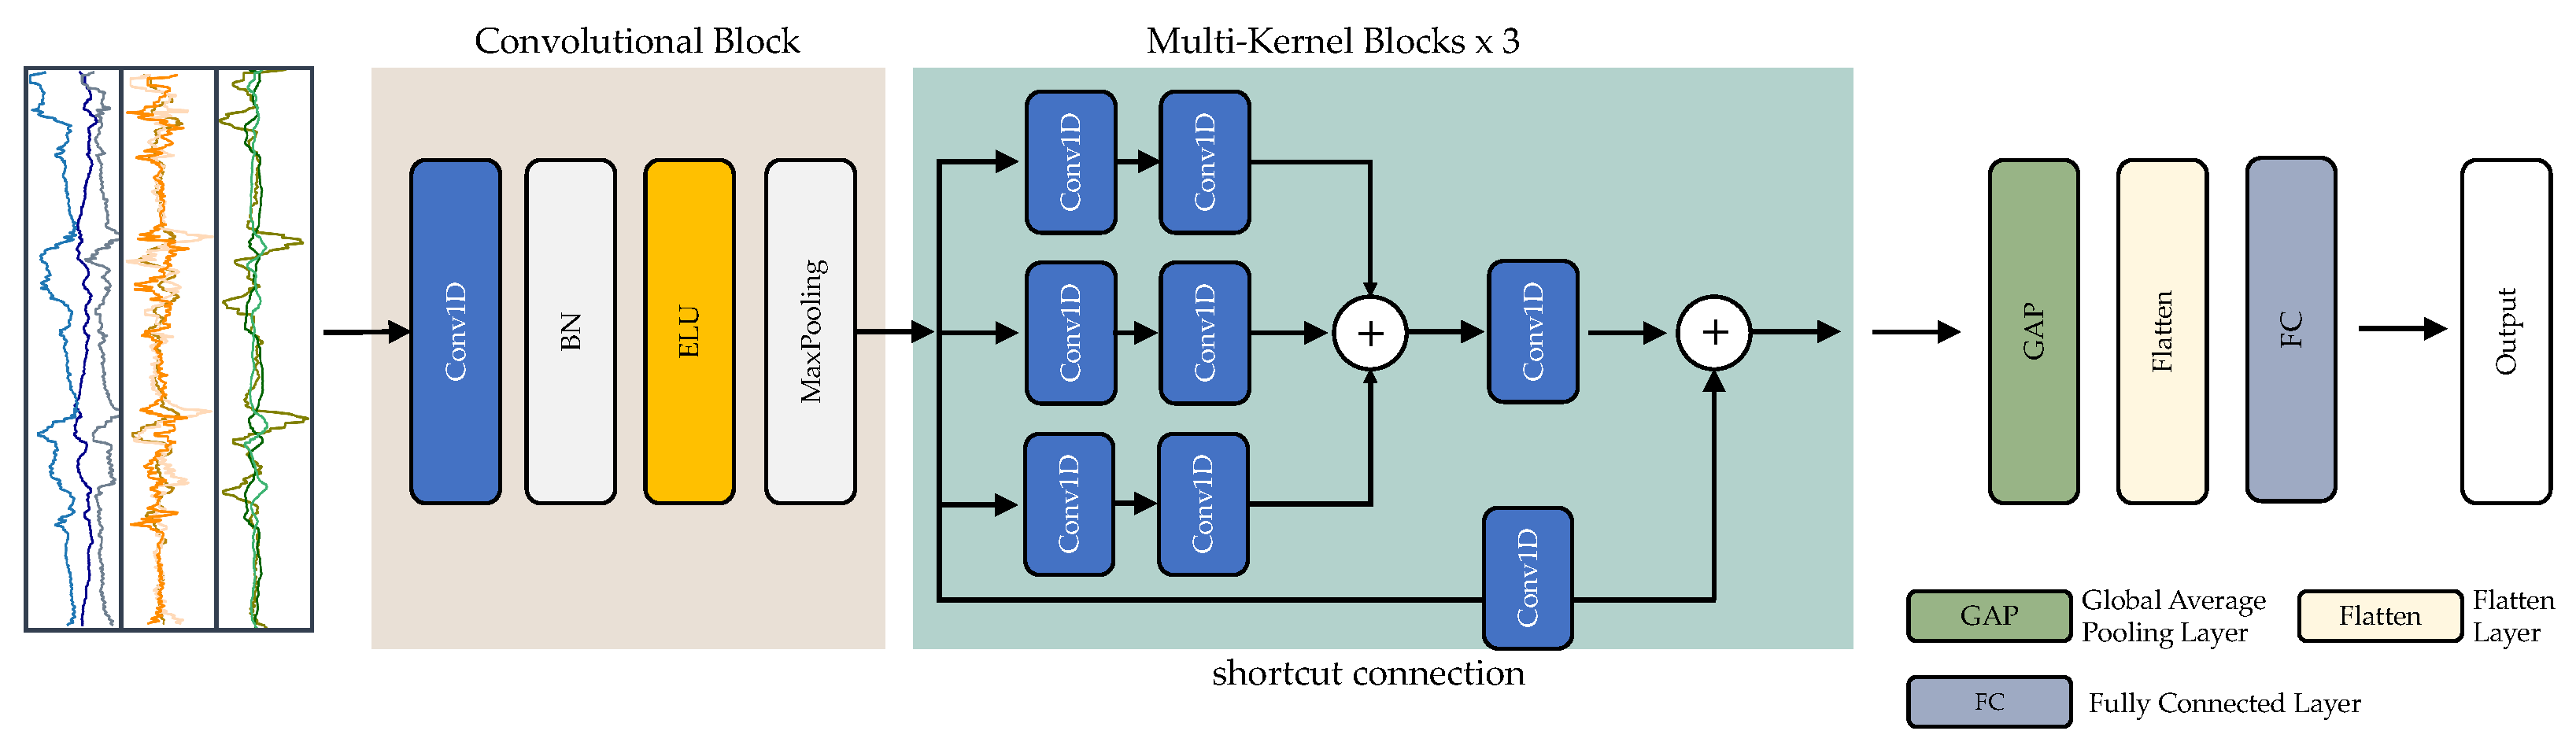
  • Using biosignals from wearable sensors, a deep residual network known as PPG-NeXt was developed for HAR. Multiple filter sizes applied to the input at the same level were used in developing the PPG-NeXt multi-kernel block. As a result, it can capture information on various scales within the current data segment. The CNN block uses the power of the 1 × 1 convolution operation in addition to the multi-slide filters to cluster information across the channel.
  • Validation of the PPG-NeXt model is performed on three publicly available benchmark datasets. PPG-DaLiA, PPG-ACC, and Wrist PPG During Exercise achieved overall accuracies of 99.16%, 99.23%, and 99.17%, respectively. According to the results, the proposed model outperformed other innovative HAR approaches using PPG data from wearable sensors.
  • The Deep Convolutional Neural Network (CNN), Stacked Long Short-Term Memory (LSTM), CNN-LSTM, CNN-Gated recurrent units (GRU), and inception-based iSPLInception benchmark deep learning (DL) models from the literature were considered and used with the standard public datasets to validate the proposed approach. The proposed PGG-NeXt model performed better than all the benchmark models when the performance of the models was evaluated using conventional evaluation criteria (accuracy, recall, precision, and F1-score).
The remaining components of the study are broken down into the following sections: Section 2 examines related literature on biosignal-based HAR, DL approaches for HAR, and existing problems. Section 3 presents this paper’s hybrid deep residual learning framework for physical activity recognition. Section 4 outlines the experimental result and describes the context in which the experiments were conducted. Section 5 provides a discussion of the study results reported in this section. Section 6 contains the summary and suggestions for challenging future research.

3. Methodology

3.1. Overview of HAR Framework Used in This Study

This work studied DL-based HAR, which applies deep residual networks to extract abstract features from raw PPG data automatically. The studied HAR workflow consists of four main processes: data acquisition, pre-processing, data generation, and model training with classification, as shown in Figure 2.
Figure 2. HAR workflow used in this work.
We collected HAR datasets that contained PPG data on human activities. We selected three public datasets from the literature—namely, PPG-DaLiA, PPG-ACC, and Wrist PPG During Exercise—to study in this work. The summary table of the three public datasets is shown in Table 2. The sensor data include PPG and IMU data. Then, a sliding window approach was used to denoise, normalize, and segment sensor data to train DL models and evaluate results. These samples were generated by the protocol of 10-fold cross-validation (CV). Finally, four different HAR standard metrics were utilized to assess and compare the trained models. The subsequent subsections explained the specifics of each step in the procedure.
Table 2. A summary table of the three public datasets used in this work.

3.2. Data Acquisition

3.2.1. PPG-DaLiA Dataset

The PPG-DaLiA dataset collected PPG signals for human activity recognition and was presented by Reiss et al. [31]. The information for this dataset was collected using 15 participants between the ages of 21 and 55. To manage the desired signals, they utilized two different instruments. Each participant wore a device called RespiBAN on their chest to record ECG signals, respiration, and 3D-ACC at a sampling rate of 700 Hz. In addition, participants wore a device called Empatica-E4 on their non-dominant wrists. This device recorded 3D-ACC at a sampling rate of 32 Hz, blood volume pulse (BVP) signal containing the PPG signal at 64 Hz, Electrodermal activity (EDA), and body temperature at 4 Hz each. After attaching the above devices to the participants’ chests and wrists, Reiss et al. had participants perform daily activities. These included sitting, climbing, descending stairs, playing table soccer, cycling outside, driving a car, taking a lunch break, walking, and working. In addition to the listed activities, the authors also documented the temporary activities between each activity.

3.2.2. PPG-ACC Dataset

The Electronics Research Group of the Department of Information Technology, Polytechnic University of the Marche, in Ancona, Italy, collected the second dataset. In this work, a dataset called PPG-ACC [32] was utilized, providing insights into the PPG signal acquired by the wrist in the presence of motion artifacts and into the acceleration signal received simultaneously by the same wrist. This dataset describes data collected from 7 participants (three males and four females aged 20 to 52) throughout three different activities. It contains 105 PPG signals (15 for each individual) and the corresponding 105 3D-ACC signals measured at a sampling frequency of 400 Hz.

3.2.3. Wrist PPG during Exercise Dataset

The Wrist PPG During Exercise dataset introduced by Jarchi et al. [33] is accessible online at PhysioNet and was utilized for the experiments in this study. During exercise, data were collected from 8 healthy subjects (five males and three females) using a sampling frequency of 256 Hz. Data were collected using a wrist-worn PPG sensor on-board the Shimmer 3 GSR+ for an average recording duration of 5 min and a maximum duration of 10 min. Four exercises were selected and performed: two on a stationary exercise bike and two on a treadmill. The exercises were as follows: treadmill walking, treadmill running, high-resistance exercise bike, and low-resistance exercise bike.

3.3. Data Pre-Processing

3.3.1. Data Denoising

The valuable information contained in a signal is distorted by noise. Generally, sensor-based HAR is achieved by collecting data from wearable sensors and analyzing them using classification techniques. Nonetheless, throughout the data collection process, the source data of sensors often include noise (missing value, incorrect value, or aberrant value) caused by environmental influence [34]. The combined effects of a long-term dependent sequence could result in incorrect categorization. The quality of training data has a significant impact on the accuracy of models. Numerous gathering situations in the real world bring various noises that decrease data quality [35]. Therefore, it is essential to minimize the impacts of noise to obtain helpful information from the signal for subsequent processing. The most popular filtering techniques are the mean, low-pass, wavelet, and Gaussian filters. In our research, we employed a mean smoothing filter for signal denoising. For this purpose, the filters were applied to the PPG signal and all three dimensions of the accelerometer and gyroscope signals.

3.3.2. Data Normalization

The raw sensor data were then normalized to the range between 0 and 1, as shown in Equation (1). By bringing all data values into a close range, this approach helps solve the model learning problem. This allows the gradient drops to converge more quickly.
X i n o r m = X i X i m i n x i m a n x i m i n , i = 1 , 2 ,
where X i n o r m denotes the normalized data; n indicates the number of channels; and x i m a x and x i m i n are the maximum and minimum values of the i-th channel, respectively.

3.4. Data Segmentation

It is not practical to input all the data into the HAR model simultaneously because wearable sensors capture a significant amount of signal data. Therefore, segmentation into sliding windows should be performed before inputting the data into the model. The sliding window technique is one of HAR’s most widely used data segmentation methods for recognizing routine activities (e.g., walking and running) and static activities (e.g., standing, sitting, and lying down). The raw sensor signals are divided into fixed-length windows. There is a percentage of overlap between subsequent windows so that more training data can be collected, and the user does not miss the transition from one activity to the next. Figure 3 shows a detailed explanation of the windowing process.
Figure 3. The sliding window technique with a fixed length employed in this work.
The sample data, which are divided into segments by a sliding window of size N, have a size of K × N. The sample W t is represented as
W t = [ a t 1   a t 2   a t 3     a t K ] R K × N
where column vector a t k = ( a t 1 k , a t 2 k , , a t N k ) T are the signal data of sensor k at window time t, T represents the transpose operator, and K represents the number of sensors. In order to exploit the correlations between windows and apply the training process, the window data are divided into sequences of windows.
S = { ( P 1 , y 1 ) , ( P 2 , y 2 ) , , ( P Q , y Q ) }
where Q represents the size of the window sequence and y Q represents the label of the corresponding activity in window P. For windows containing multiple activity classes, the most common sample activity is chosen as the label of the window.

3.5. The Proposed Model

3.5.1. The Proposed PPG-NeXt Network Architecture

The proposed PPG-NeXt network is an end-to-end DL network based on a deep-residual architecture. This architecture is composed of convolutional blocks and multi-kernel residual blocks. The overall design of the presented model can be seen in Figure 4.
Figure 4. The PPG-NeXt network architecture proposed in this work.
The Convolutional Blocks (ConvB) technique extracts low-level features from raw sensor data. As shown in Figure 4, ConvB includes four layers: 1D-convolutional (Conv1D), batch normalization (BN), exponential linear unit (ELU), and max-pooling (MP). Multiple adaptive convolution kernels capture different features in Conv1D, and each kernel generates a feature map. The BN layer was chosen to accelerate and stabilize the training phase, and the ELU layer was used to increase the expressiveness of the model. The MP layer was utilized to achieve compression of the feature map while maintaining the integrity of the most critical components.
The Multi-Kernel Blocks (MK) comprise three modules containing feature convolutional kernels of different sizes—specifically, 1 × 3, 1 × 5, and 1 × 7. To reduce the overall complexity and quantity of parameters in the proposed network, each module employs 1 × 1 convolutions before applying these kernels.
For each multicore block, convolutional units with varying kernel sizes are executed simultaneously, and their outputs are combined. Each of these units has three kernel sizes: 1 × 3, 1 × 5, and 1 × 7. The maximum kernel size of the hyperparameter determines the kernel sizes of Conv1D layers with dimensions of 1 × 3, 1 × 5, and 1 × 7. Furthermore, 1 × 1 convolutions are achieved before employing these kernels to reduce the model’s complexity and the number of parameters needed. This 1 × 1 convolution is a low-cost procedure that functions as a dimensionality reduction layer for the input features. It is significantly more affordable to implement when the additional channel is removed, as seen in [28,36]. Details can be seen in Figure 4; the feature set produced by each kind of kernel is included. Utilizing the padding technique, the spatial dimensions of all of these feature sets were maintained. In the proposed PPG-Next, we used the same padding technique [37] that results in padding with zeros evenly to the left/right of the input such that the output has the same dimension as the input. After including these feature maps, the resulting feature map is combined with the input feature map, and the module’s outcome is transferred to the subsequent unit.

3.5.2. Hyperparameters

The hyperparameter settings control the learning process in DL. The following hyperparameters are used in the proposed PPG-NeXt model: (1) learning rate ( α ), (2) epochs, (3) batch size, (4) optimization, and (5) loss function. Initially, we set α for the learning rate to 0.001. The number of epochs was set to 200, and the size of each batch was set to 128. If the validation loss had not improved after 30 epochs, we programmed a call to stop early to terminate the training process. After six more epochs, we adapted it to 75% of its initial value when the validation of the proposed PPG-NeXt model did not improve accuracy. For error reduction, we used the Adam optimizer [38] with settings β 1 = 0.9, β 2 = 0.999, ε = 1 × 10 8 . The optimizer uses the categorical cross-entropy function to identify the error. The cross-entropy [39] performs better than the classification and mean square errors.

3.6. Model Training and Performance Evaluation

The hybrid deep residual network was trained using the three PPG datasets after setting the model’s hyperparameters as described in the previous section. Instead of a fixed split of training and testing, we used 10-fold CV to measure the performance of the proposed PPG-NeXt model. The 10-fold CV separates the entire dataset into ten equal-sized folds that do not overlap. The models are fitted using a nine-fold iterative procedure, omitting the new fold to measure performance.

Evaluation Metrics

The proposed PPG-NeXt model classifies a sample as a true positive (TP) result when the activity classification is correctly recognized, a false positive (FP) result when the activity classification is incorrectly recognized, a true negative (TN) result when the activity classification is correctly rejected, and a false negative (FN) results when the activity classification is incorrectly rejected. Within this study’s scope, the proposed method’s effectiveness was appraised concerning four standard measures (accuracy, precision, recall, and F1-score) using Equations (4)–(7) shown below to determine the following:
Precision ( % ) = TP TP   +   FP × 100 %
Recall ( % ) = TP TP   +   FN × 100 %
F 1 - score ( % ) = 2 × Precision × Recall Precision   +   Recall × 100 %
Accuracy ( % ) = TP   +   TN TP   +   TN   +   FP   +   FN × 100 %

4. Experimental Results

4.1. Experimental Setup

All experiments were performed on the Google Colab Pro+ platform in this work. Training of the DL models was accelerated using the Tesla V100-SXM2-16GB GPU module. The CUDA [40] and TensorFlow backend [41] were used in the Python library to implement the proposed PPG-NeXt and other DL-based models. The DL models’ training and testing were accelerated using the GPU. The following Python libraries were used for the experiments:
  • Reading, processing, and analyzing the sensor data were performed using Pandas and Numpy.
  • Seaborn and Matplotlib plot were used to visualize the data analysis and model evaluation results.
  • During the execution of the experiments, the library Scikit-learn served as a resource for creating samples and data.
  • Training and implementing DL models for the proposed PPG-NeXt model was performed using TensorFlow and Keras.

4.2. Experimental Results

This study investigated the use of sensor-based HAR using DL models to recognize human activities. We used three public benchmarks PPG datasets (PPG-DaLiA, PPG-ACC, Wrist PPG During Exercise) that collected PPG and other wearable sensor data. The raw PPG data were preprocessed, trained, and used to evaluate the trained DL models through the 10-fold CV technique. The experimental results are presented below:
After completing the last part, in which the model hyperparameters were defined, the next step was to train the hybrid deep residual network using the three public benchmark datasets. The results of the experiments are presented in Table 3, Table 4, and Table 5, respectively.
Table 3. Recognition performance of DL models on the PPG-DaLiA dataset by PPG, ECG, and 3D-ACC data.
Table 4. Recognition performance of DL models on the PPG-ACC dataset by PPG and 3D-ACC.
Table 5. Recognition performance of DL models on the Wrist PPG During Exercise dataset by PPG, ECG, and 3D-ACC data.
The confusion matrix in Figure 5 shows that the proposed PPG-NeXt models using PPG and acceleration data achieved acceptable F1-score rates of at least 95% for the three datasets to classify human activities.
Figure 5. The confusion matrix of the proposed PPG-NeXt models using PPG and acceleration data: (ac) for PPG-DaLiA; (df) for PPG-ACC; (gi) for Wrist PPG During Exercise datasets.
To assess the proposed PPG-NeXt model’s interpretation, the proposed model is compared against state-of-the-art DL approaches in the scope of biosignal-based HAR. Table 6 reports a list of the state-of-the-art works related to HAR using PPG and IMU sensors. The comparative results reveal that the PPG-NeXt surpasses other related models’ overall accuracy. The proposed PPG-NeXt model obtained the highest performance on all three datasets, with 99.33%, 99.23%, and 99.68% on the PPG-DaLiA, PPG-ACC, and Wrist PPG During Exercise datasets, respectively.
Table 6. Comparative results of the propose PPG-NeXt model and DL models.

5. Discussion

5.1. Impact of Sampling Frequencies on Different Dataset

Based on the experimental findings in Table 4, Table 5 and Table 6, the averaged accuracies of PPG-NeXt employing acceleration data with higher frequencies are superior to those of our suggested model using acceleration data with lower frequencies. When the sampling frequency was increased, sensor data comprised more data points per sensor, and this large number of data points offered more insight into the motion [44]. The findings also show that the sampling rate of the PPG signal remained the same as the PPG-NeXt model’s average accuracy. The point permits the sampling rate of the PPG signal to be reduced to low-frequency levels without making significant HAR effects.

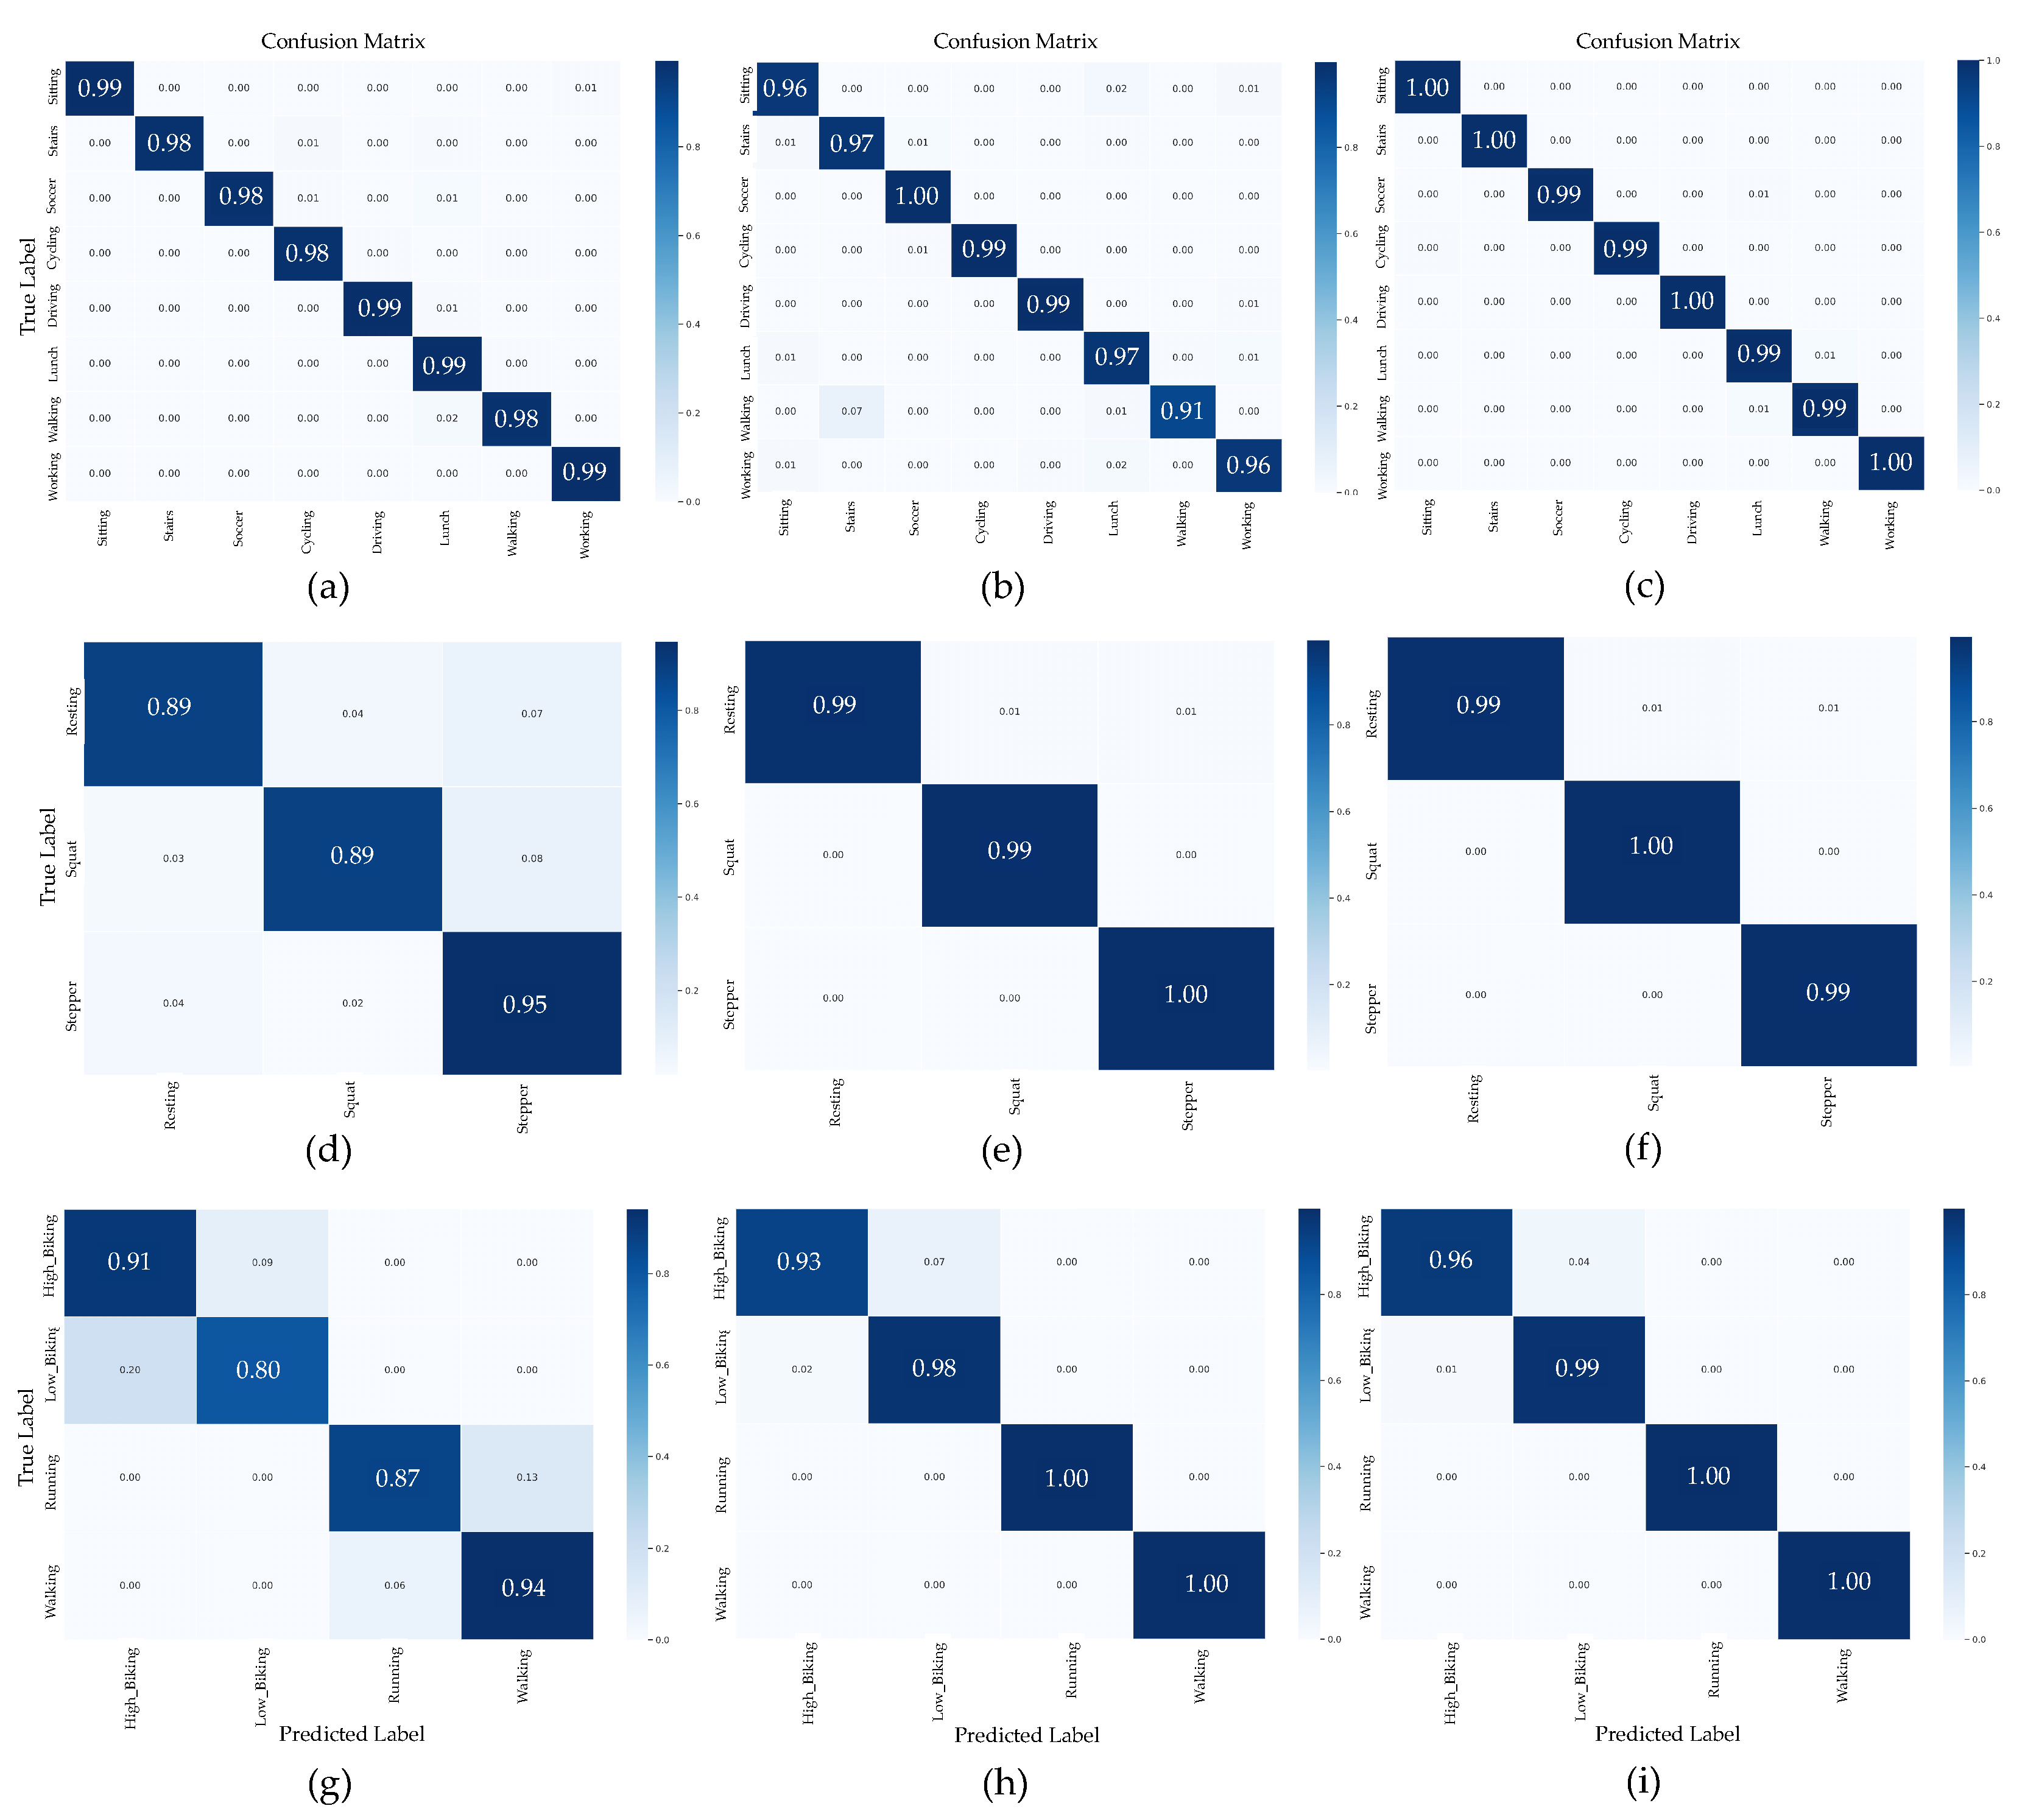
5.2. Impact of Activity Complexity

Table 7 provides the F1-score of the PPG-NeXt trained on several datasets (PPG-DaLiA, PPG ACC, and Wrist PPG During Exercise). Each dataset includes various human behaviors. The majority of the PPG-DaLiA dataset’s eight daily living tasks are straightforward. The PPG ACC consists of three exercise-related tasks: resting, squatting, and walking. During the exercise dataset, the four activity-related activities included in the Wrist PPG are walking, running, and cycling with high and low resistance.
Table 7. F1-score classification effectiveness of the proposed PPG-NeXt on different activities.

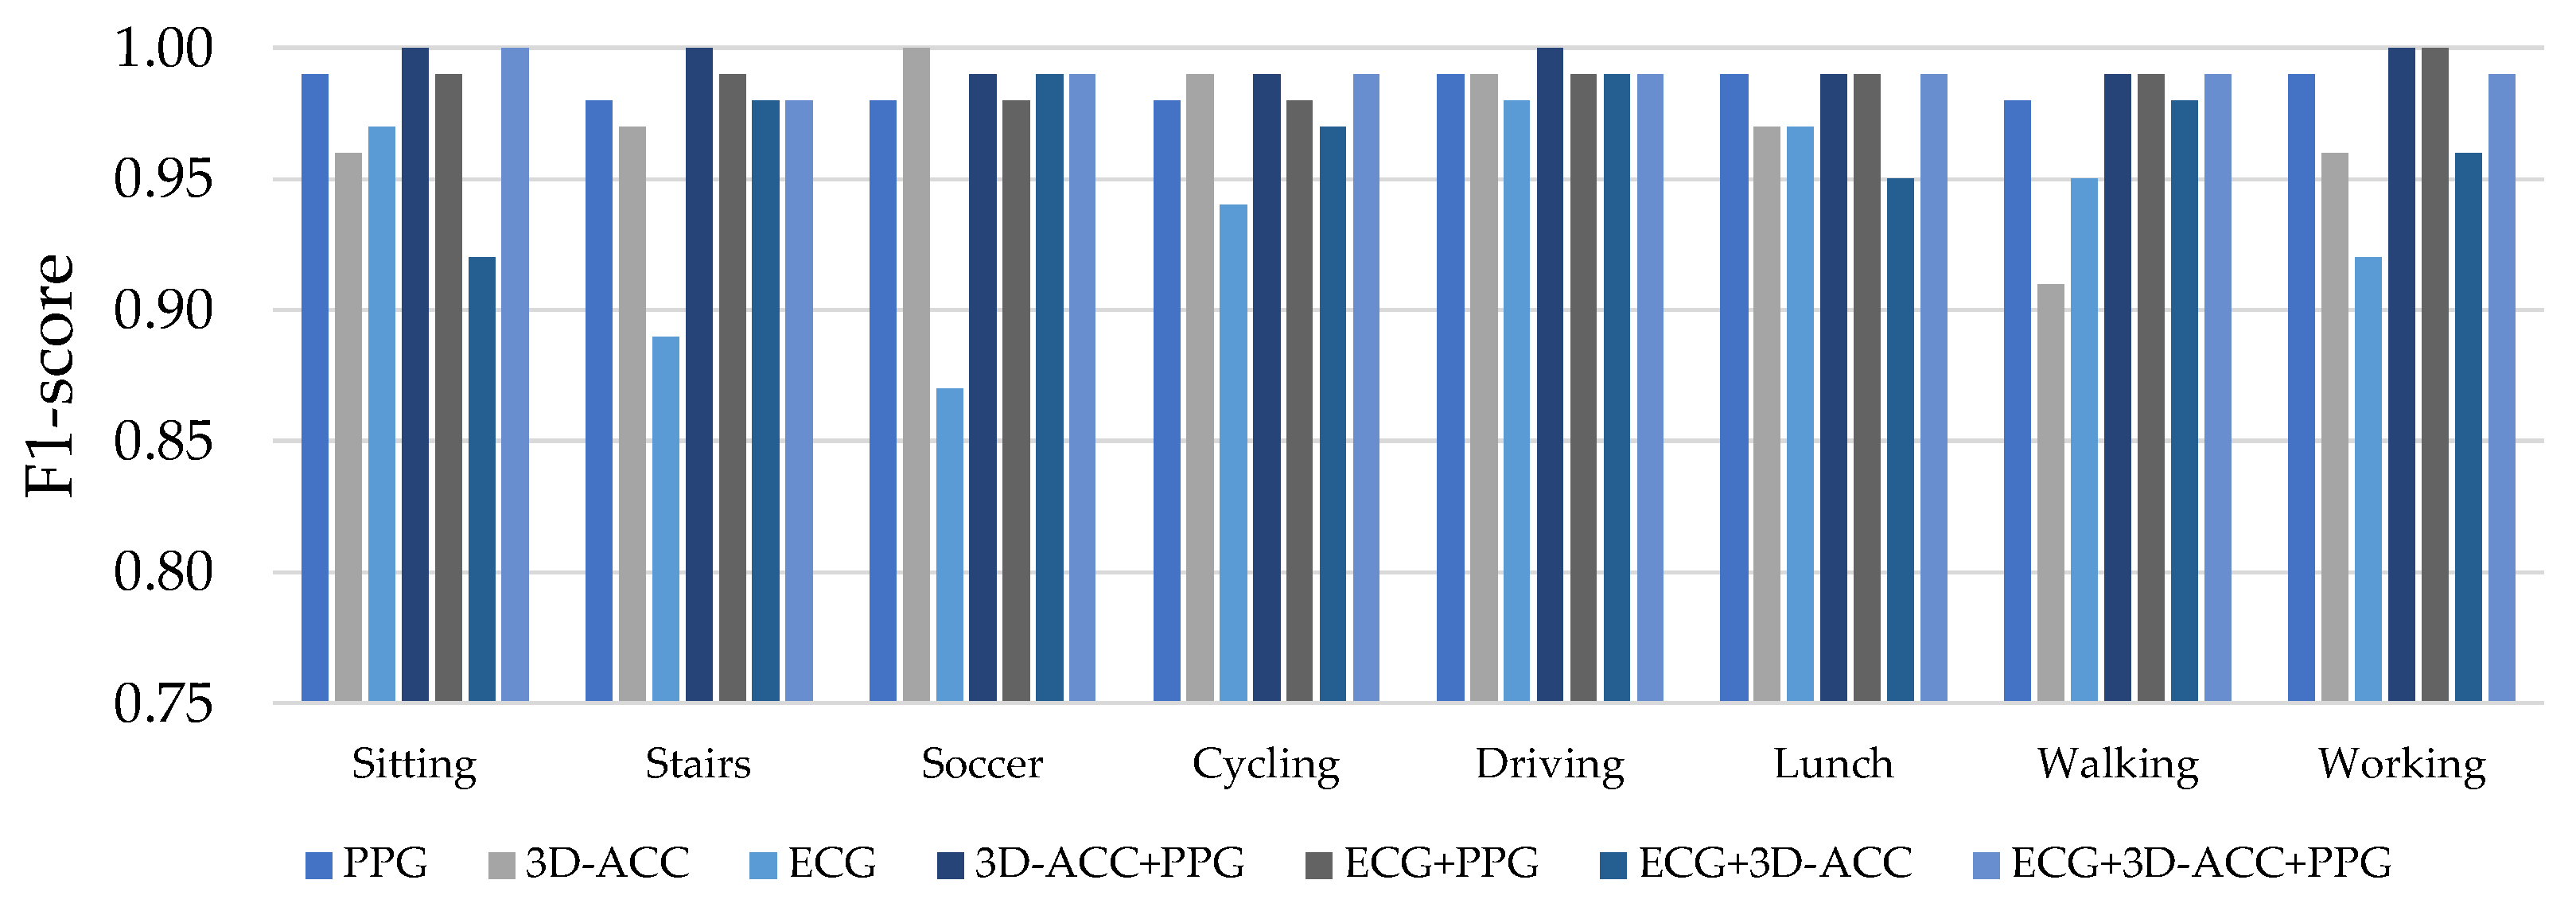
5.3. Impact of Sensor Types

We arrange the results of PPG-DaLiA based on seven possibilities of sensor combinations, i.e., employing just one input of signal (scenarios 1, 2, and 3) and a variety of two inputs (scenarios 4, 5, and 6), including scenario 7, which involves the fusion of PPG, 3D-ACC, and ECG data. As illustrated in Figure 6, we clarify our findings about the activity interpretation of the HAR models.
Figure 6. Subject-specific model results.
For identifying human behavior, the PPG signal surpasses the other two biosignals when just one signal source is considered. When the PPG and 3D-ACC signals are combined, the model’s performance exceeds that of the model employing just one signal source. Our findings imply that including the PPG signal in HAR solutions based primarily on the 3D-ACC might enhance the model’s effectiveness. Moreover, when considering all three signal sources, we discover that HAR efficacy is identical to when we included PPG and 3D-ACC signals. However, fusing ECG signals did not enhance the performance of the classifiers in our investigation.

5.4. Limitations and Further Directions

This study has several limitations. First, the experiment was performed with a limited sample size in a semi-controlled setting using three publicly accessible datasets, which might restrict our results’ generalizability. Second, the drawback of the PPG-NeXt model provided is the interpretability of the retrieved features. The feature matrix signifies binary numbers representing the percentage of positive values, which makes it challenging to comprehend the network’s concentration on the essential areas of signals. Despite these limitations, this study provides new insights into how to assess human behavior employing different sensing modalities than motion sensors.
So, further research will require the collection of an additional PPG dataset to acquire excellent and more generalized findings from the classification model. The dataset will include PPG data with data from other low-energy sensors on a variety of immediate and complicated actions, sample frequencies, and sensor localization.

6. Conclusions

This work introduced a deep residual network, PPG-NeXt, for physical activity recognition using PPG and wearable inertial sensor data. The proposed model was evaluated using three publicly available benchmark PPG datasets (PPG-DaLiA, PPG-ACC, and Wrist PPG During Exercise) and compared with other DL models. The results show that more than 90% of the F1-score in classification is achieved using only PPG data.
We performed a comparative analysis to evaluate the significance of the various contributions of signal sources in HAR systems. The experimental results show that the 3D-ACC is the most informative signal when the goal of the HAR system is to acquire and use a single signal source. Moreover, our results indicate that combining PPG and 3D-ACC signals increases activity recognition without significantly increasing hardware and processing costs. However, biosignals, ECGs, and PPGs can separate static and non-static activity and have a sufficiently successful level. Overall, our findings signify that combining PPG and 3D-ACC signal features could reinforce enhancing the F1-score of all activity situations. Nonetheless, the ECG signal feature has difficulty distinguishing between activities with similar motions but significantly different heart rate signatures.

Author Contributions

Conceptualization, N.H. and A.J.; methodology, N.H.; software, S.M.; validation, N.H., S.M., and A.J.; formal analysis, A.J.; investigation, S.M.; resources, S.M.; data curation, N.H.; writing—original draft preparation, N.H.; writing—review and editing, N.H. and A.J.; visualization, A.J.; supervision, S.M. and A.J.; project administration, A.J.; funding acquisition, N.H., S.M., and A.J. All authors have read and agreed to the published version of the manuscript.

Funding

The authors gratefully acknowledge the financial support provided by Thammasat University Research fund under the TSRI, Contract No. TUFF19/2564 and TUFF24/2565, for the project of “AI Ready City Networking in RUN”, based on the RUN Digital Cluster collaboration scheme. This research project was also supported by Thailand Science Research and Innovation Fund; University of Phayao (Grant No. FF66-UoE001); National Science, Research and Innovation Fund (NSRF); and King Mongkut’s University of Technology North Bangkok with Contract no. KMUTNB-FF-66-07.

Institutional Review Board Statement

Not applicable.

Data Availability Statement

Not applicable.

Conflicts of Interest

The authors declare no conflict of interest.

References

  1. Chen, L.; Wei, H.; Ferryman, J. A survey of human motion analysis using depth imagery. Pattern Recognit. Lett. 2013, 34, 1995–2006. [Google Scholar] [CrossRef]
  2. Cicirelli, F.; Fortino, G.; Giordano, A.; Guerrieri, A.; Spezzano, G.; Vinci, A. On the Design of Smart Homes: A Framework for Activity Recognition in Home Environment. J. Med. Syst. 2016, 40, 200. [Google Scholar] [CrossRef] [PubMed]
  3. Boukhechba, M.; Chow, P.; Fua, K.; Teachman, B.; Barnes, L. Predicting Social Anxiety From Global Positioning System Traces of College Students: Feasibility Study. JMIR Mental Health 2018, 5, e10101. [Google Scholar] [CrossRef] [PubMed]
  4. Han, J.; Shao, L.; Xu, D.; Shotton, J. Enhanced Computer Vision With Microsoft Kinect Sensor: A Review. IEEE Trans. Cybern. 2013, 43, 1318–1334. [Google Scholar] [CrossRef]
  5. Attal, F.; Mohammed, S.; Dedabrishvili, M.; Chamroukhi, F.; Oukhellou, L.; Amirat, Y. Physical Human Activity Recognition Using Wearable Sensors. Sensors 2015, 15, 31314–31338. [Google Scholar] [CrossRef]
  6. Boukhechba, M.; Bouzouane, A.; Bouchard, B.; Gouin-Vallerand, C.; Giroux, S. Online Recognition of People’s Activities from Raw GPS Data: Semantic Trajectory Data Analysis. In Proceedings of the 8th ACM International Conference on PErvasive Technologies Related to Assistive Environments, Corfu, Greece, 1–3 July 2015; Association for Computing Machinery: New York, NY, USA, 2015. [Google Scholar] [CrossRef]
  7. Wang, W.; Liu, A.X.; Shahzad, M.; Ling, K.; Lu, S. Device-Free Human Activity Recognition Using Commercial WiFi Devices. IEEE J. Sel. Areas Commun. 2017, 35, 1118–1131. [Google Scholar] [CrossRef]
  8. Joseph, G.; Joseph, A.; Titus, G.; Thomas, R.M.; Jose, D. Photoplethysmogram (PPG) signal analysis and wavelet de-noising. In Proceedings of the 2014 Annual International Conference on Emerging Research Areas: Magnetics, Machines and Drives (AICERA/iCMMD), Kottayam, India, 24–26 July 2014; pp. 1–5. [Google Scholar] [CrossRef]
  9. Biagetti, G.; Crippa, P.; Falaschetti, L.; Orcioni, S.; Turchetti, C. Human Activity Recognition Using Accelerometer and Photoplethysmographic Signals. In Proceedings of the Intelligent Decision Technologies 2017, Algarve, Portugal, 21–23 June 2017; Czarnowski, I., Howlett, R.J., Jain, L.C., Eds.; Springer International Publishing: Cham, Switzerland, 2018; pp. 53–62. [Google Scholar]
  10. Khan, A.M.; Lee, Y.K.; Lee, S.Y.; Kim, T.S. Human Activity Recognition via an Accelerometer-Enabled-Smartphone Using Kernel Discriminant Analysis. In Proceedings of the 2010 5th International Conference on Future Information Technology, Busan, Korea, 21–23 May 2010; pp. 1–6. [Google Scholar] [CrossRef]
  11. Dernbach, S.; Das, B.; Krishnan, N.C.; Thomas, B.L.; Cook, D.J. Simple and Complex Activity Recognition through Smart Phones. In Proceedings of the 2012 Eighth International Conference on Intelligent Environments, Guanajuato, Mexico, 26–29 June 2012; pp. 214–221. [Google Scholar] [CrossRef]
  12. Boukhechba, M.; Cai, L.; Wu, C.; Barnes, L.E. ActiPPG: Using deep neural networks for activity recognition from wrist-worn photoplethysmography (PPG) sensors. Smart Health 2019, 14, 100082. [Google Scholar] [CrossRef]
  13. Yoon, D.; Jang, J.H.; Choi, B.; Kim, T.; Han, C. Discovering hidden information in biosignals from patients by artificial intelligence. Korean J. Anesthesiol. 2020, 73, 275–284. [Google Scholar] [CrossRef]
  14. Schwaibold, M.; Schöller, B.; Penzel, T.; Bolz, A. Artificial Intelligence in Sleep Analysis (ARTISANA)—Modellierung des visuellen Vorgehens bei der Schlafklassifikation—Artificial Intelligence in Sleep Analysis (ARTISANA)—Modelling of the Visual Sleep Stage Identification Process. Biomed. Tech. 2001, 46, 129–132. [Google Scholar] [CrossRef]
  15. Lee, S.; Chu, Y.; Ryu, J.; Park, Y.J.; Yang, S.; Koh, S.B. Artificial Intelligence for Detection of Cardiovascular-Related Diseases from Wearable Devices: A Systematic Review and Meta-Analysis. Yonsei Med. J. 2022, 63, S93–S107. [Google Scholar] [CrossRef]
  16. Cafolla, D.; Chen, I.M.; Ceccarelli, M. An experimental characterization of human torso motion. Front. Mech. Eng. 2015, 10, 311–325. [Google Scholar] [CrossRef]
  17. Incel, O.; Kose, M.; Ersoy, C. A Review and Taxonomy of Activity Recognition on Mobile Phones. BioNanoScience 2013, 3, 145–171. [Google Scholar] [CrossRef]
  18. Shweta; Khandnor, P.; Kumar, N. A survey of activity recognition process using inertial sensors and smartphone sensors. In Proceedings of the 2017 International Conference on Computing, Communication and Automation (ICCCA), Greater Noida, India, 5–6 May 2017; pp. 607–612. [Google Scholar] [CrossRef]
  19. Ha, S.; Choi, S. Convolutional neural networks for human activity recognition using multiple accelerometer and gyroscope sensors. In Proceedings of the 2016 International Joint Conference on Neural Networks (IJCNN), Vancouver, BC, Canada, 24–29 July 2016; pp. 381–388. [Google Scholar] [CrossRef]
  20. Mekruksavanich, S.; Jitpattanakul, A. LSTM Networks Using Smartphone Data for Sensor-Based Human Activity Recognition in Smart Homes. Sensors 2021, 21, 1636. [Google Scholar] [CrossRef] [PubMed]
  21. Lu, Y.; Wei, Y.; Liu, L.; Zhong, J.; Sun, L.; Liu, Y. Towards unsupervised physical activity recognition using smartphone accelerometers. Multimed. Tools Appl. 2017, 76, 1–19. [Google Scholar] [CrossRef]
  22. Ronao, C.A.; Cho, S.B. Human activity recognition with smartphone sensors using deep learning neural networks. Expert Syst. Appl. 2016, 59, 235–244. [Google Scholar] [CrossRef]
  23. Mekruksavanich, S.; Jitpattanakul, A. Biometric User Identification Based on Human Activity Recognition Using Wearable Sensors: An Experiment Using Deep Learning Models. Electronics 2021, 10, 308. [Google Scholar] [CrossRef]
  24. Casale, P.; Pujol, O.; Radeva, P. Human Activity Recognition from Accelerometer Data Using a Wearable Device. In Proceedings of the Pattern Recognition and Image Analysis; Vitrià, J., Sanches, J.M., Hernández, M., Eds.; Springer: Berlin/Heidelberg, Germany, 2011; pp. 289–296. [Google Scholar]
  25. Jordão, A.; de Nazaré, A.C.; Sena, J. Human Activity Recognition Based on Wearable Sensor Data: A Standardization of the State-of-the-Art. arXiv 2018, arXiv:1806.05226. [Google Scholar] [CrossRef]
  26. He, K.; Zhang, X.; Ren, S.; Sun, J. Deep Residual Learning for Image Recognition. In Proceedings of the 2016 IEEE Conference on Computer Vision and Pattern Recognition (CVPR), Las Vegas, NV, USA, 27–30 June 2016; pp. 770–778. [Google Scholar] [CrossRef]
  27. Simonyan, K.; Zisserman, A. Very Deep Convolutional Networks for Large-Scale Image Recognition. arXiv 2014, arXiv:1409.1556. [Google Scholar] [CrossRef]
  28. Szegedy, C.; Vanhoucke, V.; Ioffe, S.; Shlens, J.; Wojna, Z. Rethinking the Inception Architecture for Computer Vision. In Proceedings of the 2016 IEEE Conference on Computer Vision and Pattern Recognition (CVPR), Las Vegas, NV, USA, 27–30 June 2016; pp. 2818–2826. [Google Scholar] [CrossRef]
  29. Xie, S.; Girshick, R.; Dollár, P.; Tu, Z.; He, K. Aggregated Residual Transformations for Deep Neural Networks. In Proceedings of the IEEE Conference on Computer Vision and Pattern Recognition 2016, Honolulu, HI, USA, 21–26 July 2016. [Google Scholar] [CrossRef]
  30. Alessandrini, M.; Biagetti, G.; Crippa, P.; Falaschetti, L.; Turchetti, C. Recurrent Neural Network for Human Activity Recognition in Embedded Systems Using PPG and Accelerometer Data. Electronics 2021, 10, 1715. [Google Scholar] [CrossRef]
  31. Reiss, A.; Indlekofer, I.; Schmidt, P.; Van Laerhoven, K. Deep PPG: Large-Scale Heart Rate Estimation with Convolutional Neural Networks. Sensors 2019, 19, 3079. [Google Scholar] [CrossRef]
  32. Biagetti, G.; Crippa, P.; Falaschetti, L.; Saraceni, L.; Tiranti, A.; Turchetti, C. Dataset from PPG wireless sensor for activity monitoring. Data Brief 2020, 29, 105044. [Google Scholar] [CrossRef]
  33. Casson, A.J.; Vazquez Galvez, A.; Jarchi, D. Gyroscope vs. accelerometer measurements of motion from wrist PPG during physical exercise. ICT Express 2016, 2, 175–179. [Google Scholar] [CrossRef]
  34. Zheng, Z.; Pan, T.; Song, Y. Development of Human Action Feature Recognition Using Sensors. Inf. Technol. J. 2022, 21, 8–13. [Google Scholar] [CrossRef]
  35. Rahman, M.; Ali, N.; Bari, R.; Saleheen, N.; al’Absi, M.; Ertin, E.; Kennedy, A.; Preston, K.L.; Kumar, S. mDebugger: Assessing and Diagnosing the Fidelity and Yield of Mobile Sensor Data. In Mobile Health: Sensors, Analytic Methods, and Applications; Rehg, J.M., Murphy, S.A., Kumar, S., Eds.; Springer International Publishing: Cham, Switzerland, 2017; pp. 121–143. [Google Scholar] [CrossRef]
  36. Szegedy, C.; Ioffe, S.; Vanhoucke, V.; Alemi, A.A. Inception-v4, Inception-ResNet and the Impact of Residual Connections on Learning. In Proceedings of the Proceedings of the Thirty-First AAAI Conference on Artificial Intelligence, San Francisco, CA, USA, 4–9 February 2017; AAAI Press: Palo Alto, CA, USA, 2017; pp. 4278–4284. [Google Scholar]
  37. K, M.; Ramesh, A.; G, R.; Prem, S.; A A, R.; Gopinath, D.M. 1D Convolution approach to human activity recognition using sensor data and comparison with machine learning algorithms. Int. J. Cogn. Comput. Eng. 2021, 2, 130–143. [Google Scholar] [CrossRef]
  38. Kingma, D.P.; Ba, J. Adam: A Method for Stochastic Optimization. In Proceedings of the 3rd International Conference on Learning Representations, ICLR 2015, San Diego, CA, USA, 7–9 May 2015. [Google Scholar]
  39. Janocha, K.; Czarnecki, W.M. On Loss Functions for Deep Neural Networks in Classification. arXiv 2017, arXiv:1702.05659. [Google Scholar] [CrossRef]
  40. NVIDIA; Vingelmann, P.; Fitzek, F.H. CUDA, Release: 8.0.6, 2020. Available online: https://developer.nvidia.com/cuda-toolkit (accessed on 10 September 2022).
  41. Abadi, M.; Agarwal, A.; Barham, P.; Brevdo, E.; Chen, Z.; Citro, C.; Corrado, G.S.; Davis, A.; Dean, J.; Devin, M.; et al. TensorFlow: Large-Scale Machine Learning on Heterogeneous Systems (Version 3.9.1). 2015. arXiv 2016, arXiv:1603.04467. [Google Scholar]
  42. Biagetti, G.; Crippa, P.; Falaschetti, L.; Focante, E.; Madrid, N.M.; Seepold, R.; Turchetti, C. Machine Learning and Data Fusion Techniques Applied to Physical Activity Classification Using Photoplethysmographic and Accelerometric Signals. Procedia Comput. Sci. 2020, 176, 3103–3111. [Google Scholar] [CrossRef]
  43. Afzali Arani, M.S.; Costa, D.E.; Shihab, E. Human Activity Recognition: A Comparative Study to Assess the Contribution Level of Accelerometer, ECG, and PPG Signals. Sensors 2021, 21, 6997. [Google Scholar] [CrossRef]
  44. Bennasar, M.; Price, B.A.; Gooch, D.; Bandara, A.K.; Nuseibeh, B. Significant Features for Human Activity Recognition Using Tri-Axial Accelerometers. Sensors 2022, 22, 7482. [Google Scholar] [CrossRef]
Disclaimer/Publisher’s Note: The statements, opinions and data contained in all publications are solely those of the individual author(s) and contributor(s) and not of MDPI and/or the editor(s). MDPI and/or the editor(s) disclaim responsibility for any injury to people or property resulting from any ideas, methods, instructions or products referred to in the content.

Article Metrics

Citations

Article Access Statistics

Multiple requests from the same IP address are counted as one view.