Abstract
This article aims to establish an overview of sustainable development practices within organizations in Romania, to analyze how these practices are connected to GRI (Global Reporting Initiative) indexes, and to identify the connection between the efforts made to ensure sustainable processes and the economic performance of the enterprise. Given the ever more prevalent digitalization of the company processes, implementing a sustainability management system and a sustainability monitoring system becomes more accessible, and there is increasing transparency of the information on the activities supporting sustainability. Using the methodology, the authors carried out a quantitative and qualitative analysis of the content of the sustainability reports published by Romanian companies in the top 500 by the number of employees. The economic and financial data on these companies were taken from the topfirme.ro platform. Based on the sustainability reports published by the companies, the sustainability score was calculated using the reported data, according to the GRI (Global Reporting Initiative) standard and analyzed considering the industry in which the organizations operate, specific industries being more sensitive to environmental issues due to certain specificities of their economic activity that is based on processes prone to hurt the environment. During the research, hypotheses were formulated and tested regarding the factors that could influence the reporting of activities in support of sustainability (the sustainability report score and the page count of the sustainability report) and the economic performance of organizations (profit, income). One of the study’s conclusions was related to the financial performance of companies expressed by the net profit. It is positively influenced, although to a small degree, but promising in terms of the future of company policies on freedom of association and collective bargaining, expressed in the sustainability report through the GRI index. Regarding the company belonging to a particular industry sector, the research proved that the companies’ sustainability policies are not influenced by it, which could point to the idea that sustainability issues are equally crucial for all industries. Furthermore, an essential conclusion of the research is that the performance and the reliability of sustainability policies must be monitored and implemented within an integrated sustainability management system, which would ensure a high level of coherence and transparency of the guidelines, the provided data, but also of the monitoring within companies or by the stakeholders. Finally, the research offers results regarding the interest of Romanian organizations in the measures and actions taken to ensure the sustainable development of the economic environment.
1. Introduction
Environmental protection is a significant concern in the global economy with implications at the macroeconomic and microeconomic levels. Some authors even state [1] that the economy and society are modeled by sustainability and digitalization, which are significant trends in the current framework.
In 2015 the United Nations (UN) proposed 17 sustainable development goals through “Transforming our world: the 2030 agenda for sustainable development”, which was a general guide on approaching the issues of sustainable development [1,2].
Well-being and sustainable development are current challenges that should be approached at all economic and social levels through adequate macroeconomic policies, first by standardization and regulation as well as actions at the local community level and by community awareness and support.
The activity of organizations as an integral part of the economy sometimes negatively impacts society from a social, economic, or environmental point of view. As a result, the organization’s objectives must align with environmental protection and sustainable development.
Specific sustainable development objectives [2] impact the activity of organizations. These are particularly important as the organizations are part of local communities and are directly influenced by social, economic, or environmental issues:
- Climate action, reducing emissions to reduce global warming
- Decent work and economic growth, ensuring sustainable development through innovation and infrastructure investments, eliminating inequality in the workplace, ensuring a child exploitation prevention policy
- Clean energy at affordable prices, encouraging the use of alternative energy sources with reduced environmental impact
- Responsible consumption and production, optimization of technological processes, analysis of suppliers and supply chains
- Health and well-being, policies regarding labor protection, and ensuring a clean environment are essential to ensure a healthy life
- Aquatic life, the actions that companies take, such as the discharge of residual substances, should not endanger marine resources
- Terrestrial life, organizations should not affect existing ecosystems with their actions.
- Gender equality, company policies shall consider ensuring gender equality at all hierarchical levels
- Quality education, by promoting continuous learning, organizations obtain qualified personnel and contribute thus to educating the community
- Peace, justice, and efficient institutions entail transparency in the policies on anti-corruption and tax evasion.
Implementing sustainable development objectives has led to the need for information transparency about organizations’ activities for sustainability and environmental protection.
The accelerated growth of information technology causes the digitalization of more and more organizational activities. Combined with the need for transparency regarding the activities that organizations undertake for sustainability and environmental protection, this entails the development of sustainability management systems within organizations that can ensure standardized reporting on sustainability.
The objectives of the research include an analysis of the way sustainability has been reported in Romania and of how sustainable development practices influence economic performance when the said practices become transparent.
The sustainability reporting practices have been developed quickly, going through three periods of evolution: 1990–2000, 2000–2010, and 2010–present. These stages are also correlated to developing the dissemination and awareness of sustainability concepts within organizations and the society at large and the steps that should be taken to protect the environment. Before the mid-1990s, the annual report issued by companies included little information on the environment [3,4], given that sustainability research was developing slowly due to a lack of unifying theoretical concepts concerning environmental issues. However, significant scientific contributions were made in 1993 by Pezzey and Toman (2002) [5]. During the 2000–2010 period, the first separate sustainability reports appeared, the count increasing by 29% from the previous period, according to the Global Fortune Top 250 report on companies publishing reports [6].
To provide insight into the measurement of sustainability performance within organizations, the GRI (Global Reporting Initiative) established a framework for reporting on sustainability, ensuring reporting tools and sustainability reporting are considered from three perspectives: economic, environmental, and social [7].
The number of organizations that compile reports containing information on sustainability is constantly growing [8]. Sustainability reporting is of interest to all the following stakeholders: employees, taxpayers, lawmakers, local and international communities, as well as academia or researchers. Moreover, through environmental protection awareness and sustainable activities, organizations may obtain certain social, environmental, or financial advantages [9].
The European Union (UE) places a high value on sustainability reporting, which is considered an integral part of performance reporting. Sustainability reports serve two primary purposes: they are an information tool, and at the same time, they represent a management tool [10].
There are several benefits to using sustainability reports: increasing credibility, a high level of transparency, aiding in the identification of risks and opportunities, an increase in the awareness of the internal processes of the organization, and improvement of the strategies and policies of organizations. On the other hand, they can generate additional workload, just like any other different reporting process [10]. Implementing a sustainability management system within any organization could optimize this extra workload. Lately, the responsibility for achieving the sustainable development of organizations has become a matter of public necessity [11].
This research analyzed the context of standardizing sustainability reporting in Romania, and the content of sustainability reports published by the top 500 companies in Romania ranked by the number of employees in order to assess the impact that reporting on sustainable development practices has on economic performance.
2. Literature Review
The importance of information transparency on the objectives of sustainable development within organizations makes this a hotly debated topic in the scientific literature. An increasing number of countries have begun to regulate sustainability reporting in agreement with the global sustainable development policy [2] as a way to analyze the scope of the measures taken by organizations in this area.
By analyzing the literature in the field, we propose an overview of how non-financial reporting is regulated within the European Union and Romania, as well as how organizations operating in Romania (a European Union member state) position themselves regarding the legal requirements on sustainability reporting.
Sustainability reporting varies at the organization level, with many differences in the specific aspects companies may choose to report on by the voluntary reporting standards, possibly influenced by their interests [12].
The need for sustainability reporting is quite complex, both from the perspective of the companies and the stakeholders. For example, many opinions state that any information about a company can be obtained from its financial statements [13]. On the other hand, views claim that all stakeholders, especially investors, must have a complete and clear picture of any sustainability-related issues [14]. These opinions strengthen the idea that the relevance of information on sustainability may take many forms in society [15].
Given the increasing environmental protection and sustainability concerns, there must be tools to determine whether organizational processes are sustainable [16]. In many countries, the national law does not make organizations publish sustainability reports, but incipient regulations have been on this topic (Directive 2014/95/EU [17]). Whatever the factors motivating companies to provide sustainability reports, once they are carried out, they gradually become a custom in the organizational culture [18].
Directive 2014/95/EU [19] formally supports the dissemination of non-financial information of organizations regarding social or environmental issues [20]. The paper [21] considers that the reports based on the GRI framework (2019) provide a better-integrated outlook on sustainability information.
Drawing up these reports entails the need to design and implement a performance evaluation system and an information management system to provide data on the balance of financial, environmental, and social information [22] by the GRI standards or another set of reference standards.
Several studies exist in the literature on sustainability reporting according to the GRI standards. For example, paper [11] conducted a detailed analysis of the sustainability reports issued by 94 Canadian companies, most of which were elaborated by the GRI standards. In contrast, paper [23] used the GRI 2011 indexes to compare the reporting practices of India’s most important public and private companies.
To obtain better results regarding sustainability reporting in Romania, organizations must overcome certain deficiencies and limitations, such as failing to implement a sustainability management system that uses standards and procedures to assess sustainability. While such a system is lacking, the data could be more reliable and complete, making the elaboration of structured sustainability reports difficult, constituting a limitation to the research conducted.
Regarding the regulations, European Directive [19] is transposed into Romanian law by Order no 1938/2016 [24]. Therefore, a sustainability report should include information about the description of the organization and the following three sustainability dimensions: economic (responsibility to the community and suppliers, fight against corruption, etc.), environmental (responsible consumption of resources—water, energy, emissions, and waste management, etc.), social (employees, respecting human rights, non-discrimination, etc.).
The impact of the directive on the sustainability reports of the organizations in the EU member states was researched in numerous studies; Matuszak and Różańska (2021) [8] concluded that reporting increased significantly between 2015 and 2017, especially in terms of human rights and anti-corruption.
The connection between the way sustainability data are presented, and the organization’s performance has been analyzed by several research papers, some revealing positive associations between specific indicators, such as profitability presented through economic and financial data and the volume of sustainability and environmental reports [25]. Sustainability reporting was analyzed in terms of the information provided [26,27] and the level of detail by the page count in the sustainability reports [25].
The paper by Gunawan et al. (2022) [28] analyzed sustainability reports focusing on industries sensitive to environmental and social issues that need special attention. The document classifies constructions, electric utilities, food processing, mining, oil and gas, and other industries as sensitive, while airport operators and financial service industries are classified as non-sensitive.
Another paper by Garcia et al. (2017) considers that environmentally-sensitive industries are generally mining, oil and gas, metal, chemical products, and paper manufacturing [29]. Finally, the Sierra Garcia et al. (2018) [30] study analyzes the impact of adopting Directive 2014/95/EU on sustainability reporting in Spain. One of the conclusions was that the sensitive oil and gas industry, which produces the most emissions and air pollution, provides the most data on these issues.
The literature needs to include relevant studies on the evolution of sustainability reporting within organizations in Romania in various sectors of industry that analyze in depth how the GRI indexes are used. In addition, significant studies investigating the degree of influence of sustainability practices on the economic performance of organizations have yet to be found.
The Global Reporting Initiative 2021 [31] proposes a set of standards (GRI Standards) on sustainability reporting that concern several dimensions outlined below.
- Standards regarding the economic dimension (GRI 200) tackle market presence, economic performance, indirect economic impact, anti-corruption practices, anti-competitive behavior, taxes, etc.
- Standards regarding the environmental dimension (GRI 300) include several topics: recycled materials, direct and indirect energy and water consumption, biodiversity, emissions, waste, etc.
- Standards regarding the social dimension (GRI 400) include several topics referring to employment, work relations, workplace health and safety, formation and education, equal benefits for both men and women, investment and public procurement practices, local communities, customer health, and security, etc.
The analysis of regulations and standardization within the non-financial reporting of organizations in European Union countries is debated in several scientific papers [8,30,32]. There are papers that analyze sustainability reports in light of the GRI standard at the European level [32,33] or for specific European countries, Spain [34] and Poland [35]. For Romania, we have yet to identify any studies that have analyzed the impact of GRI standards on sustainability reports.
Since these standards on sustainability reporting are found in the European Union law, of which Romania is a member, this law is also implicitly applicable in Romania.
Specific studies in the literature have identified correlations between elements that define the sustainable development policy of organizations [8,36,37,38,39] and specific economic indicators [25,26,27] or correlations with the type of industry [28]. This study aims to analyze similar correlations for organizations operating in Romania.
3. Research Methodology
Based on the previous research [25,26], data on sustainability submitted by organizations were collected and analyzed considering the three dimensions—economic, social, and environmental—and the profile of the organizations—profitability and the industry to which they belong. The reason why this current research chose to study sustainability reporting based on the GRI standards is that an analysis of the content of the sustainability reports published by Romanian companies has revealed that most of them are guided by this set of standards, which offers a basis for analysis and comparison.
The following steps were taken when carrying out the study:
- Collecting sustainability reports
- Analyzing the correlations between the information on sustainability and the economic profile of the companies: total incomes, total expenses, net profit, etc.
- Establishing the results.
Figure 1 gives a visual representation of the stages of the research introduced in this study.
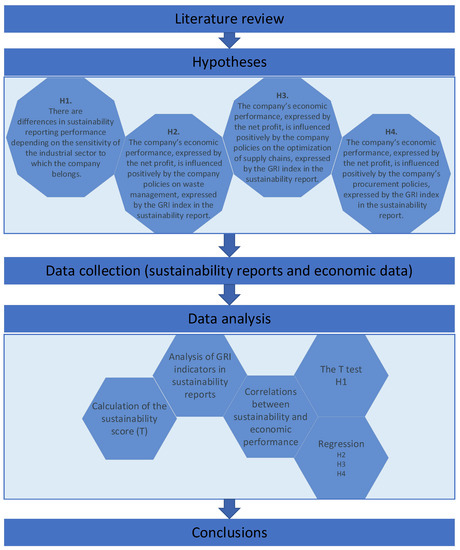
Figure 1.
Flowchart for the research methodology.
The literature has identified a few studies that point to a connection between the sustainability policies of the companies expressed as sustainability performance and the economic performance of the companies. For example, the authors of the paper, Barnett et al. (2012) [40], found a link between sustainability performance and economic performance; companies with a low social performance have a higher financial performance than companies with a moderate social performance, but companies with a high social performance have the highest economic performance. This could support the theoretical argument that stakeholders’ influencing capacity is the foundation for turning social responsibility into profit [40].
Pekovic et al. (2018) [41] found a connection between the measures taken for environmental protection and the net profit, in the sense that the effect of these measures was the reduction of the net profit. This could be explained by the fact that some environmentally conscious actions entail additional expenses and being sustainable is only sometimes cheap.
Taking into account the importance of the industrial sector as a potential environmental predictor and based on previous studies [26,28], the following industries were defined as sensitive: constructions, electric utilities, consumer goods and services, mining, oil and gas. The following values were allocated as below:
- 0 for the consumer goods and services sector
- 1 for the industry, oil and gas sector
- 2 for the financial sector
The preliminary study of the data concluded that the variables linked to the economic activity of the companies, total incomes, total expenses, and net profit present a high degree of asymmetry of the value distribution about their averages. The standard deviation gives a high dispersion of the values about the average. For this reason, the variables characterizing the economic activity of the companies were used during the research as logarithms. The variables selected to represent the economic activity of the companies also take into account other similar studies conducted by different authors and are presented in Table 1.

Table 1.
Description of the variables that were used.
The following hypotheses were formulated during the research:
H1.
There are differences in sustainability reporting performance depending on the sensitivity of the industrial sector to which the company belongs.
H2.
The company’s economic performance, expressed by the net profit, is influenced positively by the company policies on waste management, expressed by the GRI index in the sustainability report.
H3.
The company’s economic performance, expressed by the net profit, is influenced positively by the company policies on the optimization of supply chains, expressed by the GRI index in the sustainability report.
H4.
The company’s economic performance, expressed by the net profit, is influenced positively by the company’s procurement policies, expressed by the GRI index in the sustainability report.
4. Data Analysis
The Romanian companies selected for this study were taken from the first 500 companies by the number of employees, published by the topfirme.ro platform [45], specializing in compiling various charts and collecting data on the companies operating in Romania. The choice to select companies by the number of employees was made in connection to the internal regulations of Romania, stipulating that beginning with 2019, companies with over 500 employees must submit such a report annually (Directive 2014/95/EU [17] transposed into Romanian law by Order no. 1938/2016, Art 2 [24] supplemented by Order No. 3456/2018 Art 7,8 [46] regarding the modification and completion of specific accounting regulations).
The economic and financial data used in this research were consulted on the same web platform, topfirme.ro [45]. The sustainability reports used during the investigation were consulted on the official websites of the companies selected for the study.
The sustainability data used by the research refer to the year 2021. After researching the previous years, the authors concluded that the number of companies publishing such reports needed to be higher.
The research authors analyzed the content of the sustainability reports by identifying GRI indexes (Table 2) and calculated the sustainability report score (T).

Table 2.
GRI standards.
The graphical representations were made using Microsoft Excel, and the statistical data were processed using the JAMOVI open-source software [47].
The relevant aspects with implications for the study were derived during the descriptive statistical analysis. Table 3 presents the classification of the industries according to the NACE code valid in Romania [48].

Table 3.
The industries, according to https://caen.ro/ (accessed on 10 November 2022).
Figure 2 presents the number of organizations for each industry and the number of published sustainability reports in each sector. It also supplies how the reports were made (separate report in observance of the GRI standards, separate report without the GRI standard, information on sustainability integrated into the annual report, no sustainability report).
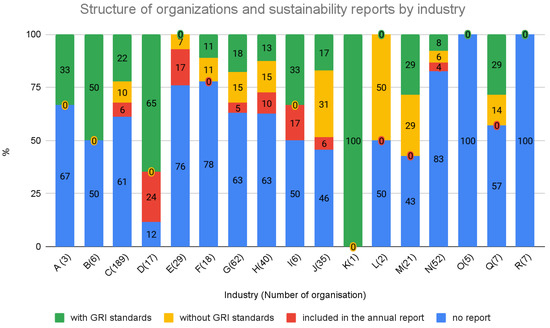
Figure 2.
Structure of organizations and sustainability reports by industry (green—separate report with GRI standard; orange—separate report without GRI standard; red—integrated into the annual report; blue—no report).
We can see that in the case of the companies included in the study belonging to the following industries E-Water distribution; sanitation, waste management, and decontamination activities; L-Real estate transactions, O-Public administration, and defense; social insurance from the public system, R-Performing, cultural and recreational activities there was no sustainability report in observance of the GRI standards. Naturally, this can raise a question as to the responsibility of the companies in the field regarding the sustainable policies by which they carry out their economic processes.
Table 4 presents the structure of the companies included in the study by the industry in which they operate. We can see that most of the organizations work in the Manufacturing sector (C), which is facing several problems related to environmental protection in general [29] but also in the Wholesale and retail trade, motor vehicle and motorcycle repair (G) industry.

Table 4.
The number of organizations by industry.
51.8% (259 organizations) of the total number of organizations belong to environmentally sensitive industries (industry, oil and gas), while 240 (48%) are in the consumer goods and services category, and a tiny percentage 0.2% belong to the financial category (Figure 3).
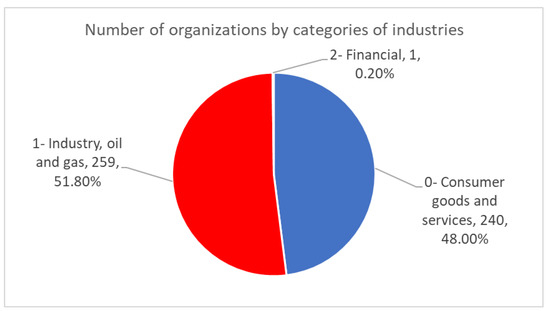
Figure 3.
Number of organizations by categories of industries.
The research concluded that not all organizations compiled sustainability reports, or they merely issued specific notices that also contained sustainability-related aspects, but without observing a particular structure by a specific set of clear standards, significantly decreasing the degree of systemic coherence and transparency of the reporting. Therefore, a scoring system was established, depending on the earnestness of the approach to openness about sustainability data (Table 5). According to Table 5, the maximum score was granted to organizations that drew up sustainability reports by the GRI standards, and no points were given to those who did not provide sustainability data.

Table 5.
How the score for the sustainability reports is granted.
One can see in Figure 4 that 62.2% (311 organizations) of the total companies did not provide a sustainability report, while 19.2% (96 organizations) drew up reports per the GRI standards. In addition, 6.6% (33 organizations) added sustainability issues to the annual reports, and 12% (60 organizations) compiled separate sustainability reports without indicating the GRI index.
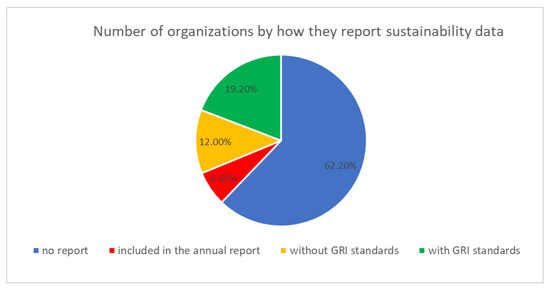
Figure 4.
Number of organizations by how they report sustainability data.
Since specific industries are more environmentally sensitive, an analysis was made to determine the number of organizations by reporting type and industry category (Figure 5). There is a balance in the number of organizations that provided reports locally for each industry category, except for the financial industry.
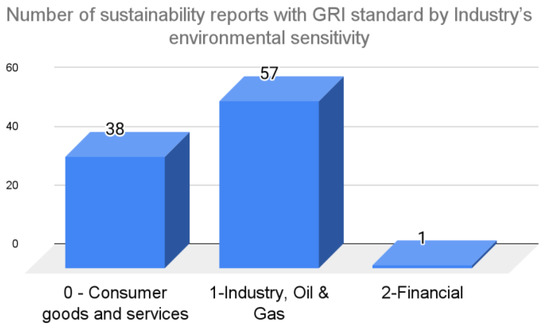
Figure 5.
Number of sustainability reports per GRI standards by environmental sensitivity of the industry.
A difficult task while analyzing the content was to obtain a sustainability score for each sustainability report. As a result, between 0–2 points were granted for each report in each year and each dimension (according to Table 6), the maximum score being 74 points (37 indexes × 2 points). Table 6 presents how the points are granted, based on which the sustainability score is calculated for each annual report.

Table 6.
How is the score granted for the sustainability dimension.
We found that specific organizations presented the indexes in a coherent, consistent, and very detailed manner, easy to follow, and referenced GRI standards. However, other organizations gave sustainability information narratively, without referencing GRI standards or another set of criteria. As a result, the general score of selected organizations varies from 6 to 74 points, with an average score of 42.8 (Table 7).

Table 7.
Score value statistics for sustainability reports and page count.
Organizations operating in environmentally sensitive industries (1-industry, oil and gas) have a higher score on their reports than those in the 0 category (consumer goods and services), and a smaller page count than those in the 0 category (consumer goods and services) as in Figure 6). Although other authors [25] have stated that the page count of a sustainability report is necessary, this study reveals that it has no influence whatsoever on the economic performance or the quality of the reporting process.
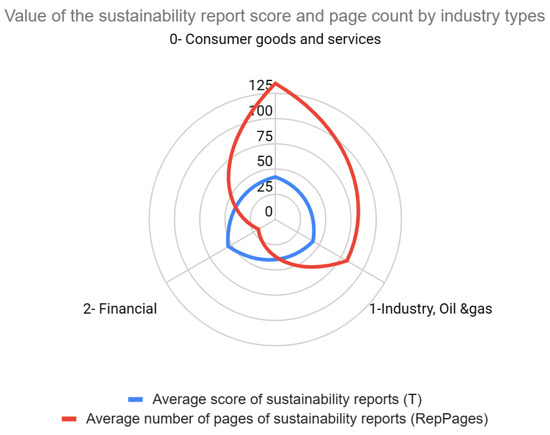
Figure 6.
Value of the sustainability report score and page count by industry types.
Regarding the most frequently reported indexes in the sustainability reports (Figure 7), the most reported index in the economic dimension is GRI 205 Anti-Corruption (written by 83 organizations). In the environmental dimension, it was GRI 302 Energy (reported by 92 organizations) and GRI 306 Effluents and Waste (83). Finally, in the social dimension, it was GRI 403 Occupational Health and Safety (88 organizations), GRI 405 Diversity and Equal Opportunity (82 organizations), GRI 401 Employment (81 organizations), and GRI 404 Training and Education (81 organizations).
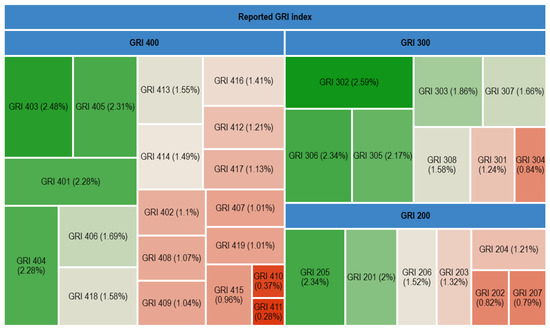
Figure 7.
Occurrence of GRI indexes specified in the companies’ sustainability reports.
Anti-Corruption (GRI 205) is one of the most common pieces of information in the sustainability reports, possibly also because there are many national and European concerns and regulations promoting anti-corruption, which was also found by [8]. The Corruption Perceptions Index (CPI) ranking 180 countries on a scale from 100 (immaculate) to 0 (very corrupt) places Romania at 69 [49]. The GRI 302 Energy index provides information on energy consumption. It is also one of the most reported indexes, showing that most companies pay enough attention to energy and water-related issues, as these generally apply to all industries [28]. Finally, the information on occupational health and safety about the GRI 403 index shows the organizations’ concern for labor protection; these data are found in most sustainability reports, as 92% of organizations report this index.
For hypothesis H1, independent test T was used to identify any statistically significant differences regarding the sustainability reporting performance expressed by the sustainability score (T) depending on the sensitivity of the industrial sector in which the company operates (SE).
The following statistical hypotheses were considered:
- H0: μ1 = μ2 there are no statistically significant differences as regards the sustainability reporting performance expressed by the sustainability score (T) depending on the industrial sector (SE).
- H1: μ1 <> μ2 there are statistically significant differences as regards the sustainability reporting performance expressed by the sustainability score (T) depending on the industrial sector (SE).
The results of the statistical processing are presented in Table 8.

Table 8.
Independent Samples T-Test for SE.
Given that the T critical value is 2.27 and the calculated T value is −0.903, the null hypothesis is not rejected. Therefore, there are no statistically significant differences as regards the sustainability reporting performance expressed by the sustainability score (T) depending on the industrial sector (SE). Also, given that the p-value is very high, the null hypothesis is not rejected, and hypothesis H1 is invalidated.
Analysis of the correlations between the information in the sustainability reports and the economic characteristics of the organizations.
For the analysis of the correlations based on the Pearson correlation coefficient (Table 9), we used the variables for the economic profile and the sustainability variables defined in the research methodology, reported by the companies for 2021, and presented in Table 1.

Table 9.
Correlation Matrix.
The analysis of the information presented in the correlation matrix under Table 9 showed the following:
- There is a moderate direct correlation between the sustainability report score (T) and total incomes (LOG_TV) at a 0.249 coefficient, slightly smaller than the moderate direct correlation between the sustainability report score (T) and total expenses (LOG_CH) at a 0.254 coefficient. We found that the sustainability report score has a moderately positive impact on two important indicators that measure the economic activity of a company—its income and expenses. The two indicators are two essential pillars for the net profit of companies.
- There is a moderate inverse correlation between the industry’s environmental sensitivity (SE) and the organization’s profit (LOG_PN) at a coefficient of −0.372. Therefore, organizations operating in environmentally sensitive industries (oil and gas) have a lower yield than those working in sectors that are not ecologically sensitive.
- There is no statistically significant correlation between the page count of a sustainability report and the other variables. Therefore, the analysis reveals that the page count of a sustainability report has no impact on the reliability of sustainability reporting or the economic performance of companies.
- There are statistically significant high direct correlations between the variables (LOG_PN, LOG_TV, LOG_CH) for the companies’ economic profile, reflecting the consistency of the financial data and their interdependence.
To deepen the research for testing hypotheses H2, H3, and H4, a regression model was built to highlight the degree to which the economic performance of companies reflected in the net profit (LOG_PN) depends on their sustainability policy reflected in the scores on the GRI indexes in their sustainability reports. The values of the dependent variable (LOG_PN) were taken from the topfirme.ro web platform and the independent variable values were calculated for this study based on the sustainability reports and the specific GRI indexes published on the companies’ official websites.
Using the regression model, we tried to identify the degree to which the economic performance of companies reflected in their net profit (dependent variable LOG_PN) can be explained using the independent variables (GRI_101, GRI_102, GRI_103, GRI_201, GRI_202, GRI_203, GRI_204, GRI_205, GRI_206, GRI_207, GRI_301, GRI_302, GRI_303, GRI_304, GRI_305, GRI_306, GRI_307, GRI_308, GRI_401, GRI_402, GRI_403, GRI_404, GRI_405, GRI_406, GRI_407, GRI_408, GRI_409, GRI_410, GRI_411, GRI_412, GRI_413, GRI_414, GRI_415, GRI_416, GRI_417, GRI_418, GRI_419) for sustainability as reported by the companies.
The logical architecture of the regression model is presented in Figure 8. For the regression model shown in Figure 7, we applied the Backward method to introduce the independent variables.
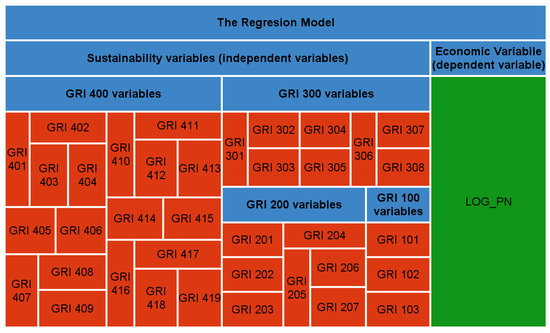
Figure 8.
The architecture of the regression model.
Applying JAMOVI software [47] for the regression, the most significant model is presented in Table 10 and Table 11.

Table 10.
Model Fit Measures for the second regression.

Table 11.
Collinearity Statistics for the second regression.
Table 10 shows that the value of the F coefficient equals 4.54, and the significant coefficient is lower than 0.001. These values indicate that the regression equation obtained is helpful for the intended purpose of the research. Therefore, the model is valid.
The Variance Inflation Factor (VIF) values show (Table 11) no multicollinearity in the model. These values indicate that the regression equation obtained is suitable for the intended purpose of this research. Therefore, the model is valid.
The remaining predictors in the last significant model are the following (Table 12): GRI_204, GRI_207, GRI_301, GRI_306, GRI_308, GRI_407, GRI_409, GRI_412, GRI_414.

Table 12.
Model Coefficients—LOG_PN for the second regression.
Table 10 shows that the regression equation explains 37.2% (value of R square—coefficient of determination) of the LOG_PN variance. The value of R (0.61) reveals that the correlation between the variables of the predictors and the LOG_PN dependent variable is moderate.
The regression equation obtained is presented within Formula (1).
LOG_PN = 6.945 + 0.237 GRI_204 − 0.27 GRI_207 − 0.184 GRI_301 + 0.409 GRI_306 − 0.298 GRI_308 + 0.513 GRI_407 − 0.278 GRI_409 − 0.211 GRI_412 + 0.461 GRI_414
Based on the visual observations (Figure 9), the residuals are within the accepted limits; the LOG_PN distribution follows the predicted distribution in the same proportion.
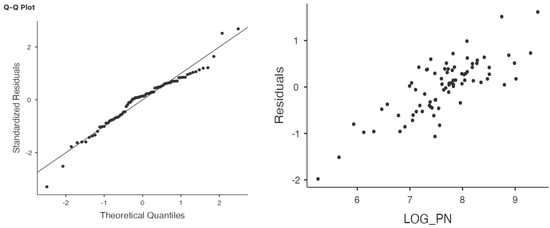
Figure 9.
Residual analysis.
The regression analysis shows that the proposed model is statistically significant and reflects the moderate correlation between the economic performance of the companies expressed through the net profit and a part of the GRI indexes presented in the sustainability reports, reflecting the companies’ concerns in the area.
We found a positive association between the most important predictor, GRI_407 freedom of association and collective bargaining, and higher company net profits. In addition, there are positive associations among the GRI_414 supplier social assessment, GRI_306 effluents and waste, GRI_204 procurement policies predictors, and companies with higher net profits, which have a higher interest in these areas.
Organizations that do not provide in their sustainability reports information on GRI_207 tax, GRI_301 materials, GRI 308 supplier environmental assessment, GRI 409 forced or compulsory labor, or GRI 412 human rights assessment have higher net profits than those who describe these issues in their reports.
Therefore, we see that following the regression analysis, the below hypotheses are confirmed:
- H2. The company’s economic performance, expressed by the net profit, is influenced positively by the company policies on waste management, expressed by the GRI index in the sustainability report.
- H3. The company’s economic performance, expressed by the net profit, is influenced positively by the company policies on the optimization of supply chains, expressed by the GRI index in the sustainability report.
- H4. The company’s economic performance, expressed by the net profit, is influenced positively by the company’s procurement policies, expressed by the GRI index in the sustainability report.
5. Conclusions and Limitations
The research showed that not all organizations compiled sustainability reports or they did provide some information, including issues related to sustainability, but without observing a particular structure by the specific GRI standards, which significantly decreases the degree of systemic coherence and transparency of the reporting. Furthermore, the analysis conducted in this study revealed that many companies operating in Romania do not show maturity as regards the implementation of a sustainability management system based on a set of standards, and the existing associations and interdependence between the economic indicators and sustainability indexes are relatively small but show promising trends for the future.
The study indicated that specific industries such as water distribution; sanitation, waste management, decontamination activities, real estate transactions, public administration and defense; social insurance from the public system, and performing cultural and recreational activities did not provide sustainability reports as per the GRI standards. Even though national regulations stipulate that they are compulsory, 62.2% of organizations still need to provide a sustainability report. This may raise a question as to the responsibility of the companies in the field in terms of the sustainable policies they apply to their economic processes.
Among the most frequent topics in their sustainability reports, we can find Anti-Corruption (GRI 205), Energy (GRI 302), Effluents and Waste (GRI 306), Occupational Health and Safety (GRI 403), Diversity and Equal Opportunity (GRI 405). Anti-Corruption GRI 205 is one of the most frequently presented data in the sustainability reports of the analyzed organizations, possibly also because there are many regulations promoting anti-corruption policies. According to experts and businesspeople, the Corruption Perceptions Index (CPI), measuring how corrupt a country’s public sector is perceived to be, ranks Romania at 69 out of 180 [49].
Given the concerns for the sustainable use of energy sources [2], one of the most frequently reported is the GRI 302 index, which provides information on the companies’ energy consumption. However, most companies pay sufficient attention to issues related to energy and water as they are generally applicable to all industry types [25].
The sustainability reports’ analysis shows that more environmental GRI indexes are reported than social and economic indexes. This means that company policies, reflected in sustainability reports, are influenced by a more significant concern for environmental protection than social and economic issues. Organizations in environmentally sensitive industries (industry, oil and gas) have a higher reporting score for the environmental dimension than those in the consumer goods and services category. Industries with a higher degree of pollution that are environmentally-sensitive face more challenges in terms of sustainability reporting requirements; there is more information presented in standard GRI form on these issues, a conclusion also reached by the Sierra-Garcia et al. study (2018) [30]. However, generally speaking, the research has proven that the industry sector a company belongs to does not influence the company’s sustainability policies, which could point to the idea that sustainability issues are equally crucial for all industries.
The study showed that the performance of the sustainability report expressed in this research by the sustainability report score has a moderately positive impact on two critical indicators measuring the economic activity of a company: incomes and expenses. These are the two basics in determining the net profit of companies. In addition, the aggregated sustainability scores also reveal this issue for the economic, environmental, and social dimensions and have a moderately positive impact on a company’s total income and expenses.
The study indicated that the page count of a sustainability report has no impact on the reliability of sustainability reporting or the economic performance of companies. However, other authors [25] found that the page count of the sustainability report does influence financial and sustainability performance.
The research revealed that there are statistically significant high direct correlations between the economic indicators characterizing the company’s economic profile, which reflects the consistency of the financial data and the interdependence between them.
The research finds that an indicator important to stakeholders, such as net profit, is influenced positively but quite moderately by the sustainable procurement policies of the companies, the waste management policies, the supply chain optimization policies, the policies on freedom of association, and collective bargaining. The companies communicate all these policies by reporting performance indicators based on the GRI standards. In addition, the company’s economic performance expressed through the net profit is also influenced positively and moderately by the company policies on freedom of association and collective bargaining, reflected in the GRI index in the sustainability report.
An important conclusion reached by the authors after conducting this research is that the performance and thoroughness of sustainability policies should be applied and monitored within an integrated sustainability management system, which would ensure a high level of consistency and transparency of the measures taken to this end, that is the provided data but also of the monitoring carried out within companies or by the stakeholders.
The accelerated growth of information technology causes the digitalization of more and more organizational activities. Combined with the need for transparency regarding the activities that organizations undertake for sustainability and environmental protection, this entails the development of a sustainability management system within each organization.
A limitation of the study is the use of the content analysis method to obtain the information from the sustainability reports, which is prone to subjectivity, and is associated with issues related to reliability and content validity. This is compounded by the fact that although many companies abide by the national regulations making sustainability reports compulsory, they do not compile them or they collect brief, narrative documents that do not provide concrete information on the actions and measures taken to ensure a sustainable operation.
Another limitation of this research is the exclusive focus on organizations in Romania, while it could be expanded to other countries in the EU and could consider cultural differences and possible sanctions for not complying with the national law.
Author Contributions
F.M. and O.E.A. were involved in the documentation phase, in choosing the research methodology, in data analysis, and the results of investigation and discussions. F.M. and O.E.A. participated in the manuscript preparation and approved the submitted manuscript. All authors have read and agreed to the published version of the manuscript.
Funding
This research received no external funding.
Data Availability Statement
Data available on request due to restrictions.
Conflicts of Interest
The authors declare no conflict of interest.
References
- Borges, F.M.M.G.; Rampasso, I.S.; Quelhas, O.L.G.; Leal Filho, W.; Anholon, R. Addressing the UN SDGs in Sustainability Reports: An Analysis of Latin American Oil and Gas Companies. Environ. Chall. 2022, 7, 100515. [Google Scholar] [CrossRef]
- ONU Transforming Our World: The 2030 Agenda for Sustainable Development | Department of Economic and Social Affairs. Available online: https://sdgs.un.org/2030agenda (accessed on 20 December 2022).
- Boiral, O.; Heras-Saizarbitoria, I. Sustainability Reporting Assurance: Creating Stakeholder Accountability through Hyperreality? J. Clean. Prod. 2020, 243, 118596. [Google Scholar] [CrossRef]
- Tschopp, D.; Nastanski, M. The Harmonization and Convergence of Corporate Social Responsibility Reporting Standards. J. Bus. Ethics 2014, 125, 147–162. [Google Scholar] [CrossRef]
- Toman, M.; Pezzey, J. The Economics of Sustainability: A Review of Journal Articles; Resources for the Future: Washington, DC, USA, 2002. [Google Scholar]
- Kolk, A.; van der Veen, M.; Hay, K.; Wennink, D. KPMG International Survey of Corporate Sustainability Reporting 2002; De Meern: KPMG: Utrecht, The Netherlands, 2002. [Google Scholar]
- GRI—Home. Available online: https://www.globalreporting.org/ (accessed on 19 December 2022).
- Matuszak, Ł.; Różańska, E. Towards 2014/95/EU Directive Compliance: The Case of Poland. Sustain. Account. Manag. Policy J. 2021, 12, 1052–1076. [Google Scholar] [CrossRef]
- Barbosa, C.D.F.; Francato, A.L.; Barbosa, P.S.F. Towards Brazilian Corporations Better Stock Price Valuation and Operational Performance with Corporate Social Responsibility and Environmental Socio Responsibility. In Corporate Social Responsibility in Brazil; Springer International Publishing: Berlin/Heidelberg, Germany, 2019. [Google Scholar]
- European Court Of Auditors Rapid Case Review: Reporting on Sustainability: A Stocktake of EU Institutions and Agencies. Available online: https://www.eca.europa.eu/Lists/ECADocuments/RCR_Reporting_on_sustainability/RCR_Reporting_on_sustainability_EN.pdf (accessed on 19 December 2022).
- Roca, L.C.; Searcy, C. An Analysis of Indicators Disclosed in Corporate Sustainability Reports. J. Clean. Prod. 2012, 20, 103–118. [Google Scholar] [CrossRef]
- Pati, S. Sustainability Reporting Pathway—Is It a True Reflection of Organisational Safety Culture: Insights from Oil and Gas and Process Sector of India. Saf. Sci. 2023, 159, 106006. [Google Scholar] [CrossRef]
- The International Integrated Reporting Council (IIRC) Investors Support Integrated Reporting as a Route to Better Understanding of Performance. Available online: https://www.integratedreporting.org/wp-content/uploads/2017/09/Investor-statement_FinalS.pdf (accessed on 21 December 2022).
- Novick, B.; Fink, L. A Fundamental Reshaping of Finance. Harvard Law School Forum on Corporate Governance, 16 January 2020. [Google Scholar]
- Grassmann, M. The Relationship between Corporate Social Responsibility Expenditures and Firm Value: The Moderating Role of Integrated Reporting. J. Clean. Prod. 2021, 285, 124840. [Google Scholar] [CrossRef]
- Ching, H.; Gerab, F.; Toste, T. Analysis of Sustainability Reports and Quality of Information Disclosed of Top Brazilian Companies. Int. Bus. Res. 2013, 6, 62. [Google Scholar] [CrossRef]
- European Commission (EC) Directive 2014/95/EU of the European Parliament and the Council of 22 October 2014 Amending Directive 2013/34/EU as Regards Disclosure of Non-Financial and Diversity Information by Certain Large Undertakings and Groups. Available online: https://eur-lex.europa.eu/legal-content/EN/TXT/?uri=celex:32014L0095 (accessed on 21 December 2022).
- Gray, R.; Javad, M.; Power, D.M.; Sinclair, C.D. Social and Environmental Disclosure and Corporate Characteristics: A Research Note and Extension. J. Bus. Financ. Account. 2001, 28, 327–356. [Google Scholar] [CrossRef]
- European Commission (EC) Directive (EU) 2022/2464 of the European Parliament and of the Council of 14 December 2022 Amending Regulation (EU) No 537/2014, Directive 2004/109/EC, Directive 2006/43/EC and Directive 2013/34/EU, as Regards Corporate Sustainability Reporting (Text with EEA Relevance). Available online: https://eur-lex.europa.eu/legal-content/EN/TXT/?uri=uriserv%3AOJ.L_.2022.322.01.0015.01.ENG&toc=OJ%3AL%3A2022%3A322%3ATOC (accessed on 21 December 2022).
- Carmo, C.; Ribeiro, C. Mandatory Non-Financial Information Disclosure under European Directive 95/2014/EU: Evidence from Portuguese Listed Companies. Sustainability 2022, 14, 4860. [Google Scholar] [CrossRef]
- Karaman, A.S.; Orazalin, N.; Uyar, A.; Shahbaz, M. CSR Achievement, Reporting, and Assurance in the Energy Sector: Does Economic Development Matter? Energy Policy 2021, 149, 112007. [Google Scholar] [CrossRef]
- Gray, R.; Kouhy, R.; Lavers, S. Corporate Social and Environmental Reporting: A Review of the Literature and a Longitudinal Study of UK Disclosure. Account. Audit. Account. J. 1995, 8, 47–77. [Google Scholar] [CrossRef]
- Yadava, R.N.; Sinha, B. Scoring Sustainability Reports Using GRI 2011 Guidelines for Assessing Environmental, Economic, and Social Dimensions of Leading Public and Private Indian Companies. J. Bus. Ethics 2016, 138, 549–558. [Google Scholar] [CrossRef]
- Ministry of Public Finance Order Regarding the Modification and Completation of Some Accounting Regulations No. 1938/2016 of 17 August 2016. Off. Gaz. 2016, 680. Available online: https://static.anaf.ro/static/10/Anaf/legislatie/OMFP_1938_2016.pdf (accessed on 10 December 2022).
- Lungu, C.I.; Caraiani, C.; Dascălu, C. Research on Corporate Social Responsibility Reporting. Amfiteatru Econ. J. 2011, 13, 117–131. [Google Scholar]
- Tiron-Tudor, A.; Nistor, C.S.; Ştefănescu, C.A.; Zanellatto, G. Encompassing Non-Financial Reporting in A Coercive Framework for Enhancing Social Responsibility: Romanian Listed Companies’ Case. Amfiteatru Econ. 2019, 21, 590–606. [Google Scholar] [CrossRef]
- Galant, A.; Cerne, K. Non-Financial Reporting in Croatia: Current Trends Analysis and Future Perspectives. Management 2017, 12, 41–58. [Google Scholar] [CrossRef]
- Gunawan, J.; Permatasari, P.; Fauzi, H. The Evolution of Sustainability Reporting Practices in Indonesia. J. Clean. Prod. 2022, 358, 131798. [Google Scholar] [CrossRef]
- Garcia, A.S.; Mendes-Da-Silva, W.; Orsato, R.J. Sensitive Industries Produce Better ESG Performance: Evidence from Emerging Markets. J. Clean. Prod. 2017, 150, 135–147. [Google Scholar] [CrossRef]
- Sierra-Garcia, L.; Garcia-Benau, M.A.; Bollas-Araya, H.M. Empirical Analysis of Non-Financial Reporting by Spanish Companies. Adm. Sci. 2018, 8, 29. [Google Scholar] [CrossRef]
- GRI—GRI Standards English Language. Available online: https://www.globalreporting.org/how-to-use-the-gri-standards/gri-standards-english-language/ (accessed on 19 December 2022).
- Opferkuch, K.; Caeiro, S.; Salomone, R.; Ramos, T.B. Circular Economy Disclosure in Corporate Sustainability Reports: The Case of European Companies in Sustainability Rankings. Sustain. Prod. Consum. 2022, 32, 436–456. [Google Scholar] [CrossRef]
- Perello-Marin, M.R.; Rodríguez-Rodríguez, R.; Alfaro-Saiz, J.-J. Analysing GRI Reports for the Disclosure of SDG Contribution in European Car Manufacturers. Technol. Forecast. Soc. Chang. 2022, 181, 121744. [Google Scholar] [CrossRef]
- Ibáñez- Forés, V.; Martínez-Sánchez, V.; Valls-Val, K.; Bovea, M.D. Sustainability Reports as a Tool for Measuring and Monitoring the Transition towards the Circular Economy of Organisations: Proposal of Indicators and Metrics. J. Environ. Manag. 2022, 320, 115784. [Google Scholar] [CrossRef] [PubMed]
- Michalska-Szajer, A.; Klimek, H.; Dąbrowski, J. A Comparative Analysis of CSR Disclosure of Polish and Selected Foreign Seaports. Case Stud. Transp. Policy 2021, 9, 1112–1121. [Google Scholar] [CrossRef]
- Ibáñez-Forés, V.; Martínez-Sánchez, V.; Valls-Val, K.; Bovea, M.D. How Do Organisations Communicate Aspects Related to Their Social Performance? A Proposed Set of Indicators and Metrics for Sustainability Reporting. Sustain. Prod. Consum. 2023, 35, 157–172. [Google Scholar] [CrossRef]
- Patara, S.; Dhalla, R. Sustainability Reporting Tools: Examining the Merits of Sustainability Rankings. J. Clean. Prod. 2022, 366, 132960. [Google Scholar] [CrossRef]
- Al-Shaer, H.; Hussainey, K. Sustainability Reporting beyond the Business Case and Its Impact on Sustainability Performance: UK Evidence. J. Environ. Manag. 2022, 311, 114883. [Google Scholar] [CrossRef] [PubMed]
- Yan, M.; Jia, F.; Chen, L.; Yan, F. Assurance Process for Sustainability Reporting: Towards a Conceptual Framework. J. Clean. Prod. 2022, 377, 134156. [Google Scholar] [CrossRef]
- Barnett, M.L.; Salomon, R.M. Does It Pay to Be Really Good? Addressing the Shape of the Relationship between Social and Financial Performance. Strateg. Manag. J. 2012, 33, 1304–1320. [Google Scholar] [CrossRef]
- Pekovic, S.; Grolleau, G.; Mzoughi, N. Environmental Investments: Too Much of a Good Thing? Int. J. Prod. Econ. 2018, 197, 297–302. [Google Scholar] [CrossRef]
- Duran, I.J.; Rodrigo, P. Why Do Firms in Emerging Markets Report? A Stakeholder Theory Approach to Study the Determinants of Non-Financial Disclosure in Latin America. Sustainability 2018, 10, 3111. [Google Scholar] [CrossRef]
- Venturelli, A.; Caputo, F.; Cosma, S.; Leopizzi, R.; Pizzi, S. Directive 2014/95/EU: Are Italian Companies Already Compliant? Sustainability 2017, 9, 1385. [Google Scholar] [CrossRef]
- Amin, M.A.; Islam, M.R.; Halim, M.A. Sustainability Reporting Based on GRI Indicators. J. Sustain. Bus. Econ. 2022, 5, 1–13. [Google Scholar] [CrossRef]
- Top Companies from Romania. Available online: https://www.topfirme.com/numar-angajati/ (accessed on 21 December 2022).
- Ministry of Public Finance Order Regarding the Modification and Completation of Some Accounting Regulations, No. 3456/2018. Off. Gaz. 2018, 942. Available online: https://static.anaf.ro/static/10/Anaf/legislatie/OMFP_3456_2018.pdf (accessed on 10 December 2022).
- The Jamovi Project Jamovi—Open Statistical Software for the Desktop and Cloud (Version 2.3). Available online: https://www.Jamovi.Org (accessed on 20 December 2022).
- Ministry of Justice; National Trade Register Office. Sindla.com Classification of Activities in the National Economy. Available online: https://caen.ro (accessed on 20 December 2022).
- 2020 Corruption Perceptions Index—Explore Romania’s Results. Available online: https://www.transparency.org/en/cpi/2020 (accessed on 19 December 2022).
Disclaimer/Publisher’s Note: The statements, opinions and data contained in all publications are solely those of the individual author(s) and contributor(s) and not of MDPI and/or the editor(s). MDPI and/or the editor(s) disclaim responsibility for any injury to people or property resulting from any ideas, methods, instructions or products referred to in the content. |
© 2023 by the authors. Licensee MDPI, Basel, Switzerland. This article is an open access article distributed under the terms and conditions of the Creative Commons Attribution (CC BY) license (https://creativecommons.org/licenses/by/4.0/).