Abstract
Nowadays, the classical aperture theory is supplemented by data on the properties of electromagnetic fields in the near radiated field zone. A fundamental feature of the functioning of antennas in this area is the possibility of spatial focusing of electromagnetic energy. In this case, it is possible to realize the maximum field strength at a given point in space and reduce the field strength outside this point. The focusing effect itself is provided by the in-phase addition of fields from elementary sources. Also, in addition to the formation of the maximum field strength at the focusing point, it is also possible to realize a minimum field strength at the focusing point by implementing antiphase addition of partial fields at the focusing point. The fundamental possibility of forming sum and difference amplitude distributions of electromagnetic fields in the near radiated field zone makes it possible to realize sum–difference signal processing in order to reduce the level of the secondary maximum of the focused field. This article discusses the features of the formation of the sum and difference amplitude distributions and the principles of the sum–difference processing of focused electromagnetic fields, along with the implementation of technical solutions for non-destructive testing and technical diagnostic tasks.
1. Introduction
Methods of non-destructive radio wave testing are widely used in various fields of industry [1,2,3]. In general, such methods can be distinguished into active and passive diagnostic methods. In the active methods, to detect internal defects in the object under test, an electromagnetic wave is excited, and the presence and parameters of waves reflected from irregularities are recorded. In the passive methods, used particularly in medical diagnostics, the receiving equipment detects a local source of anomalous intrinsic radio thermal radiation.
In any of these cases, antennas act as sensors. Usually, antennas of the contact type are used, which are directly adjacent to the surface of the object being examined. The potential ability to detect anomalies and determine their location is largely determined by the antenna’s characteristics.
One of the promising ideas for improving the technical performance of radio wave diagnostic equipment is the use of focused antennas as sensors. This paper discusses the main properties of such focused antennas and features of their application to improve the performance characteristics of non-destructive radio wave testing.
A significant number of works [4,5,6,7,8,9] describe the variants of construction and the technical applications of focused antenna arrays. In [4], the authors proposed an approach to control the parameters of a focused field in problems of microwave hyperthermia. The control is carried out by an antenna focused on the area of the fat-mimicking phantom that is subjected to hyperthermia. In [5,6], the results of calculations of the distribution of focused fields were presented. It was shown that the side lobe level is quite significant, which leads to a deterioration in the resolution of diagnostic industrial complexes. In [7,8], the authors considered the problems of using focused fields in radio-frequency identification of objects (RFID) and access control. The authors of [9] considered a hexagonal arrangement of emitters of a focused antenna array used in problems of tumor hyperthermia.
For most technical applications based on the use of focused antenna arrays, such as those described in [4,5,6,7,8,9], the use of sum- and difference-type focused fields can improve their technical characteristics. Therefore, there is an urgent need for improvement of methods for the formation of focused electromagnetic fields for use in non-destructive testing and technical diagnostic tasks. This article focuses on the usage of sum–difference signal processing methods.
2. Radiation Zones of Focused Fields
The aperture theory of antennas uses the representation of the radiation field of an antenna as a superposition of the fields of elementary sources, characterized by their type and amplitude–phase spatial distribution. Usually, an elementary electric source (Hertzian dipole), a magnetic source, or a Huygens-type element, which is a combination of both, is used. The electromagnetic field of the Hertzian dipole, as is well known, can be written as
where , is the phase velocity, and is the characteristic resistance of the medium.
The electromagnetic field created by a source of finite electrical dimensions has a different structure depending on the position of the observation point [10]. Figure 1 shows the radiation zones characteristic of a source of finite dimensions.
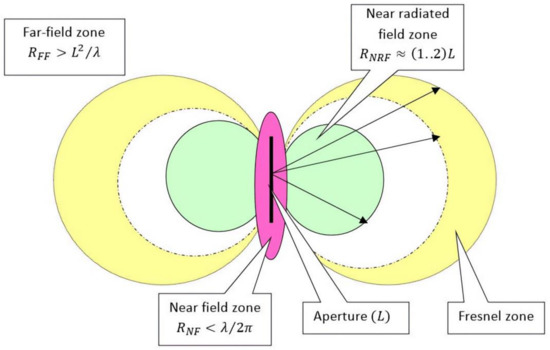
Figure 1.
Radiated zones from an electromagnetic radiation source with finite dimensions.
The near zone corresponds to a distance from the sources that is much smaller than the wavelength. The electromagnetic field has a quasi-static character with a predominance of electric or magnetic components.
In the far-field zone, at sufficiently large distances from the sources, the electromagnetic field is an inhomogeneous spherical wave characterized by a monotonic decrease in amplitude and a more or less pronounced angular dependence:
In most practical radio communication tasks, electromagnetic fields are used in the far-field zone. The electromagnetic field excited by a directional antenna can be considered as focused in a given direction .
The area enclosed by the indicated boundaries is usually called the intermediate zone, characterized by a nonmonotonic dependence on the range and angular coordinates. In the intermediate zone, it is advisable to single out an area bounded from below by the conditional boundary of the near zone and from above by a distance from sources of the order of the size of the current region. This region is called the near radiated field zone. The electromagnetic field in this region is formed by the interference of inhomogeneous spherical waves emitted by elementary sections of the current region.
3. Properties of Electromagnetic Fields in the Near Radiated Field Zone
Electromagnetic fields focused in the near radiated field zone have a number of unique properties that significantly distinguish them from the case of the far-field zone when focusing in a given direction . Focused antennas were first studied in [11] and further considered in a number of papers. Detailed results can be found in the book [12]. Below is an enumeration of the most important properties of focused fields at the near radiated field zone.
3.1. Focusing
Directional radiation of the antenna in the far-field zone can be interpreted as the result of the in-phase addition (focusing) of electromagnetic waves emitted by individual sections of the aperture in a given direction at distance . Similarly, in the near radiated field zone, focusing to the point means ensuring the in-phase summation of the waves emitted by individual sections of the aperture. The fundamental property of the near radiated field zone is the possibility of three-dimensional focusing (in contrast to the far-field zone, where only two-dimensional focusing is fundamentally realized).
For better clarity, further consideration is limited to the case of a linear antenna (Figure 2).
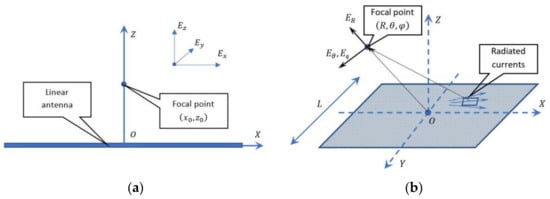
Figure 2.
Linear (a) and planar (b) apertures.
The spatial distribution of the intensity of the electromagnetic field in this case is a pronounced peak, surrounded by bursts of lower intensity, similar to side lobes in the radiation pattern. The effect of the in-phase and close-to-in-phase addition of partial fields is observed only at the focus point and in its immediate vicinity. Outside this neighborhood, the phase relations of partial fields will be random, which leads to bursts of field strengths of varying intensity. When evaluating the focusing effect, one is usually confined to one-dimensional graphs characterizing the distribution of the field strength along the axis parallel to the aperture and that perpendicular to it (Figure 3a,b). In some cases, for a more visual representation of the effect of focusing the electromagnetic field, two-dimensional graphs can be built, for example, such as in Figure 3c,d.
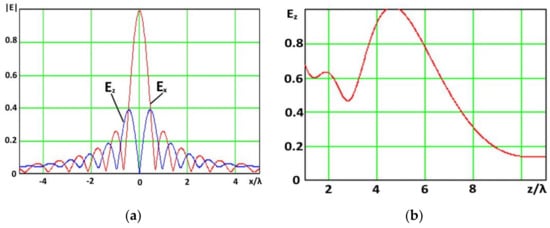
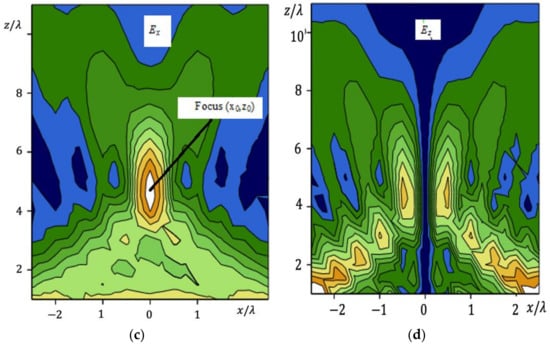
Figure 3.
Spatial distributions of electric field intensity: (a) dependence of the horizontal and vertical components in the focal plane; (b) dependence in the transverse direction; (c,d) spatial dependences of the and components.
During the formation of the focused fields presented in Figure 3, a uniform distribution of currents in a focused aperture was used.
3.2. Poynting Vector
As is known, in the far-field zone, in the vicinity of the radiation pattern maximum, there is a divergent flow of the real part of the Poynting vector, while its imaginary part is practically absent. In the near radiated field zone, the real part of the Poynting vector is a stream converging to a focal point with a subsequent divergence in space of an inhomogeneous spherical wave. The imaginary part of the Poynting vector, which describes the oscillatory movement of power, shows its movement in both the longitudinal and transverse directions (Figure 4 and Figure 5). For the formation of the spatial distributions of the Poynting vector presented in Figure 4 and Figure 5, a uniform distribution of currents in a focused aperture was used.
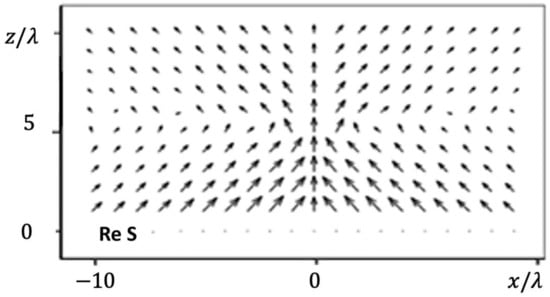
Figure 4.
Spatial distribution of the real part of the Poynting vector in a lossless environment: antenna length, 10 wavelengths; focus,; amplitude distribution, uniform.
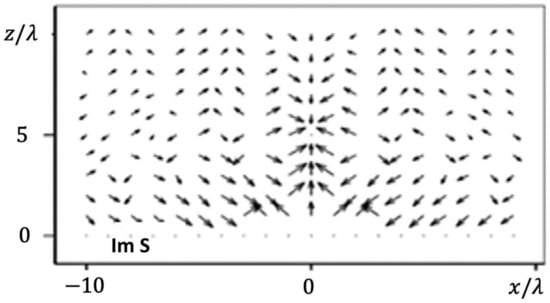
Figure 5.
Spatial distribution of the imaginary part of the Poynting vector in a lossless environment: antenna length, 10 wavelengths; focus, ; amplitude distribution, uniform.
The information presented in Figure 4 and Figure 5 clarifies a number of features of the energy transfer process for an antenna focused in the zone of the near radiated field. Let us underline two of them.
- The movement of energy occurs from the aperture in the direction of the focus point, followed by a divergence in space (it is curious to note that the form of Figure 4, built on the basis of calculating the values of the electric and magnetic fields, fully corresponds to the geometric–optical representations in the form of rays directed to the focus point);
- The dependence of the imaginary part of the Poynting vector has a more complex (and less expected) character. Firstly, there is an oscillatory process in both directions, along and across the aperture. Secondly, the distribution pattern of the vector contains alternating sections with different instantaneous values of the oscillation direction. This, in particular, means the presence of limited "centers" of the oscillatory process. The most significant is that the oscillatory motion of energy takes place not only in the direction along the aperture, but also in the transverse direction, which is contrary to the widespread opinion about the nature of this process as taking place only along the aperture.
3.3. Directivity Factor of a Focused Antenna
In the presence of any kind of irregularity located in the far-field zone of radiation, a reflected wave arises, propagating, among other things, in the opposite direction, towards the aperture. This fact determines the possibility of detecting an irregularity (for example, a defect). The intensity of the reflected signal is proportional to the gain of the antenna.
A similar situation occurs in the case of a focused aperture. The difference from the case of the far-field zone is that in the near radiated field zone, the gain is defined as the ratio of the square of the modulus of the electric field strength at the focus point created by the focused aperture to a similar value corresponding to radiation from an ideal isotropic source. This ideal isotropic source is located at the aperture point closest to the focusing point, provided that the radiation powers of the focused and omnidirectional antennas are equal:
where is the electric field strength at the focus point; is the field strength at the focusing point, created by an omnidirectional emitter.
In the near radiated field zone, the value of the gain is always limited. It is limited not by the electric aperture size but by the relative focal length . The value decreases as focal length decreases. On the other hand, increases to a value of , corresponding to the gain in the far-field zone, as focal length . For each value of the relative focal length , there is a maximum achievable value of . In addition, the antenna gain in the near radiated field zone significantly depends on the polarization and shape of the elementary source pattern in the aperture (Figure 6). In this case, an increase in the directivity of the elementary source, as a rule, leads to a decrease in the gain of the focused antennas.
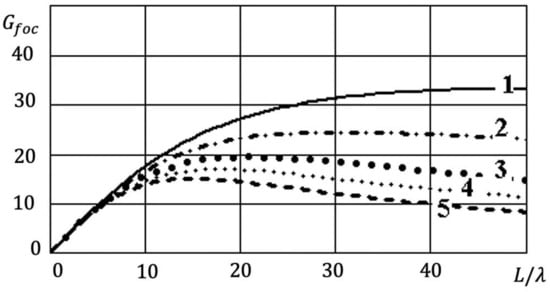
Figure 6.
Dependence of on the dimensions of the linear aperture for various polarization and radiation patterns of elementary sources with focusing depth . 1, isotropic emitter oriented across the aperture; 2, isotropic emitter oriented along the aperture; 3, radiation pattern type along the aperture; 4 and 5, emitters in the form of a Huygens element oriented across the aperture and along the aperture.
We note that for each value of relative focal length , there is a maximum achievable value of the directivity factor and corresponding value of the optimal electrical length of the antenna, (Figure 7). Increasing the length of the antenna relative to its optimal size leads to a decrease in the gain. This property is well explained if we take into account that as the size of the aperture increases, the relative contribution of peripheral regions decreases due to an increase in the distance from them to the focusing point.
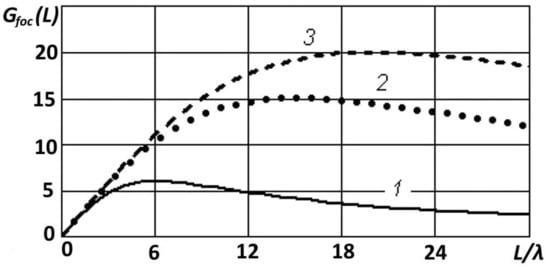
Figure 7.
Dependence of on the dimensions of the linear aperture at different depths of focusing point : curve 1; curve 2; curve 3.
In general, the dependence of on the type of amplitude distribution corresponds to cases of behavior for the far-field zone: lower values of directivity correspond to functions falling towards the edges (Figure 8).
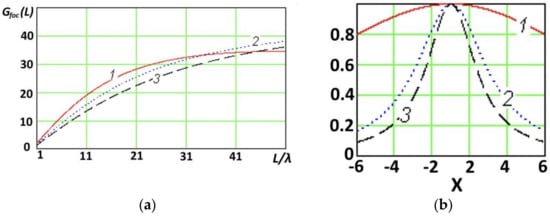
Figure 8.
Influence of the types of amplitude distribution on for a focused antenna with focusing point depth : dependence of on the electrical length of the antenna (a) and on the type of amplitude distribution (b).
It is well known that the directivity factor of any antenna in the far-field zone can be written as
where is the aperture efficiency. It depends on the type of amplitude distribution. Obviously, the maximum directivity factor can be achieved with a uniform amplitude distribution, for which .
For an electromagnetic field focused on the near radiated field zone, we can offer a similar formula for the directivity factor:
The maximum value of parameter can be reached with an optimal amplitude distribution:
where is the distance between the focus point and partial source on the antenna surface, and is the type of directivity pattern of the partial source and its orientation relative to the antenna axis.
Thus, in contrast to the case of the far-field zone, for the case of focusing in the near radiated field zone, the optimal amplitude distribution meets the following:
- Depends on the type of elementary source and its orientation;
- For each type of partial sources, is a family of functions that depend on the value of the focal length .
The dependence of the maximum directivity factor achieved with the optimal amplitude distribution for various radiation patterns of an elementary source is illustrated in Figure 9. Curves 1 and 2 correspond to an omnidirectional emitter, curve 3 corresponds to an emitter with a directivity pattern of the form , and curves 4 and 5 correspond to an emitter in the form of a Huygens element polarized across and parallel to the linear aperture, respectively. The focus point was located at a depth of . Table 1 shows different types of optimal amplitude distributions and optimal aperture efficiency for it.
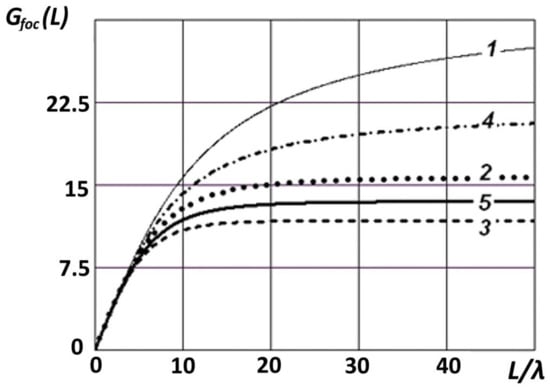
Figure 9.
Dependence of the directivity factor on the size of the aperture for the optimal amplitude distribution and various RPs of the elementary source.

Table 1.
Values of the parameter corresponding to optimal amplitude distributions.
Figure 10 shows the corresponding dependences of the maximum possible values of for optimal amplitude distributions.
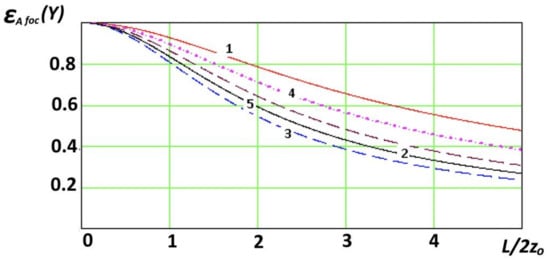
Figure 10.
Dependence of on values corresponding to optimal amplitude distributions in accordance with the data from Table 1.
3.4. Focus Area Dimensions and Side Lobe Level
In echolocation tasks in the far-field zone, the accuracy of determining the angular position of an object in space and the resolution are determined, for a given signal-to-noise ratio, by the angular dimensions of the radiation pattern [13]. Its width in the far-field zone is inversely proportional to the electrical size of the aperture and cannot be less than the value corresponding to the uniform amplitude distribution of radiating currents. In this case, the third coordinate—the range—can be determined by the value of the time delay of the reflected signal and, therefore, requires the use of non-monochromatic signals.
In the near radiated field zone, the determination of all three coordinates is fundamentally possible when probing with a monochromatic signal. In this case, the accuracy of determining the coordinates is determined by the size of the focus area. Focused antennas have a specific dependence of the size of the focusing area and the level of side lobes on the parameters of the amplitude distribution and the electrical dimensions of the antenna.
For a given type of amplitude distribution and type of elementary source, the electrical dimensions of the focused field region are limited not by the electrical dimensions of the aperture but by the relative focal length. In this case, the principle of similarity holds: the characteristics of an antenna with length focused to a point practically coincide with the parameters of an antenna with length focused to a point (Figure 11).
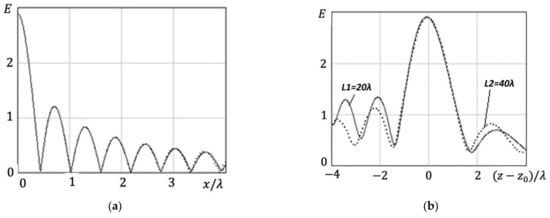
Figure 11.
Longitudinal (a) and transverse (b) dependences of the field distribution in the vicinity of the focus for apertures with uniform amplitude distribution and at and .
For linear antennas, the minimum dimensions of the focused field area (at the −3 dB level) in the longitudinal and, accordingly, in the transverse are about 0.45λ × 1.3λ and are achieved at a focal length of the order of several wavelengths.
In the near radiated field zone, the objectivity of the behavior of the side lobes also noticeably differs from the case of the far-field zone. In particular, they cannot be significantly reduced by choosing the shape of the amplitude distribution of radiating currents. For most practical applications, it is not a mistake to assume that achieving low levels of side lobes, such as in the radiation field of an antenna, for example, with an optimal Dolph–Chebyshev distribution, is impossible in the near radiated field. The approximate level of side lobes is about −10 dB or slightly less (Figure 12).
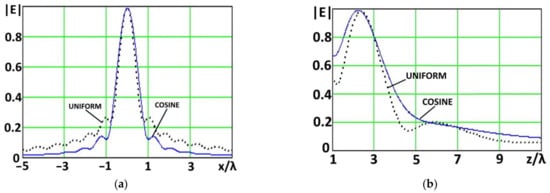
Figure 12.
Distribution of the electric field strength module in directions (a) parallel and (b) perpendicular to the aperture for uniform and cosine amplitude distributions , focal length m.
This circumstance obviously worsens the possibility of separate observation of small-sized reflecting objects located close to larger irregularities. In addition, the accuracy of determining the coordinates may not always be sufficient due to the limited size of the focus area.
4. Formation of Spatial Distributions of the Difference Type
In classical radiolocation, to improve the accuracy of determining the angular coordinates, antennas with directivity patterns with sum and difference types are widely used in combination [14]. In this case, symmetrical distributions of currents in the aperture are used for the formation of the sum radiation pattern, and antimetric distributions of currents in the aperture are used for the difference patterns.
In the near radiated field zone, the formation of spatial distributions of the difference type is also possible, characterized at the focusing point by zero values of the field strength. An important difference from the case of the far-field zone is that the formation of two types of difference distributions is possible here.
The first of them is similar to the difference radiation pattern of the far-field antenna and is an odd function of the coordinate parallel to the aperture with zero value at the focus point .
The second type does not have an analogue of the radiation field in the far-field zone. The spatial distribution of the field strength in the normal direction to the antenna is described by a function with a zero value at the focus point and antiphase values at points located on opposite sides of the focus point. In other words, difference distributions of the first type are formed in the direction of the axis passing through the focus point parallel to the aperture, while difference distributions of the second type are formed in the direction of the axis passing through the focus point .
The formation of difference distributions of the first type is completely analogous to the case of the far-field zone: the phase distribution for the two halves of the symmetrical aperture differs by 1800, i.e., for a focus point located on the axis of symmetry of the antenna, it has the form
To form difference distributions of the second type, two antiphase sections are formed in the aperture, located in the central and peripheral parts of the aperture:
The phase distributions and and the corresponding sum–difference distributions of the electric field strength for a linear antenna of isotropic elementary radiators with a uniform amplitude distribution, , and focal point coordinates are shown in Figure 13. The figure also shows the spatial distributions of the sum and difference types for the same antenna array.
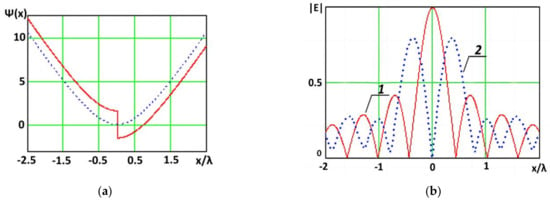
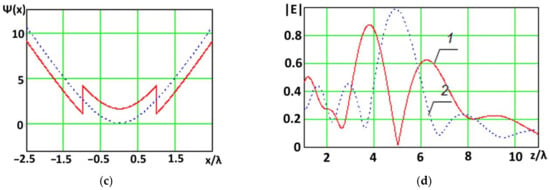
Figure 13.
Phase distributions and and the corresponding sum–difference-type radiation patterns formed in planes parallel and perpendicular to the aperture: (a) phase distribution of the first type; (b) sum–difference distribution of the electric field strength in a plane parallel to the aperture: 1—sum radiation pattern, 2—differential radiation pattern; (c) phase distribution of the second type; (d) sum–difference distribution of the electric field strength in a plane parallel to the aperture: 1—sum radiation pattern, 2—differential radiation pattern.
5. Using the Principles of Sum–Difference Processing of Focused Fields
The implementation of echolocation in the near radiated field zone using antennas with distributions of the sum and difference types is similar to that of monopulse location in the far-field zone [13]. The difference is the use of distributions of the second type, which makes it possible to increase the accuracy of determining coordinates not only in the longitudinal but also in the transverse direction.
In addition, the use of focused antennas with spatial distributions of the sum and difference type allows, similarly to the cases of far-field radiolocation, side lobe reception suppression processing.
The essence of the method of processing received signals with suppression of side lobes is as follows. For a given spatial position of the focusing point , sequentially in time, reception is carried out corresponding to the formation of two spatial distributions of the sum and difference types: and . Further, the reflected signal is considered received (corresponding to the main peak of the spatial distribution of the sum type) if its amplitude exceeds the value corresponding to reception using the focused spatial distribution of the difference type :
As an illustration, we present the graphs in Figure 14.
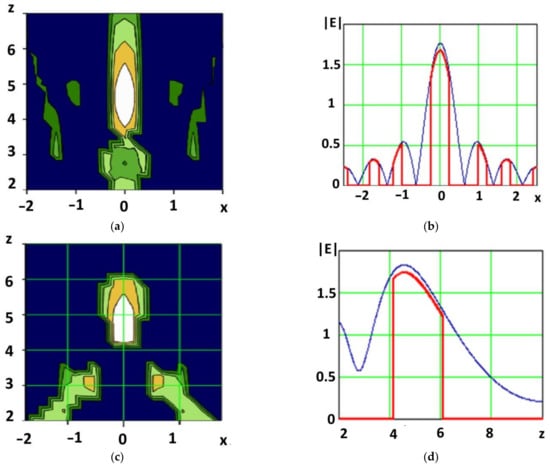
Figure 14.
Results of processing according to the algorithm (8): (a,c) spatial distributions; (b,d) sections at the focal point in the directions across and along the aperture, blue line shows sum type of distribution, red line shows result of sum-difference processing.
The usage of the focusing method with the joint use of spatial distributions of the sum and difference types, in comparison with the traditional cases of in-phase and focused aperture, allows us to achieve the following:
- -
- Improve the accuracy of determining the spatial position of a small-sized irregularity by reducing the effective size of the focused field area;
- -
- Weaken or eliminate the influence of irregularities localized near the region of the focused field.
Figure 15 shows a comparison of the spatial distributions of electromagnetic fields in the near radiated field zone.
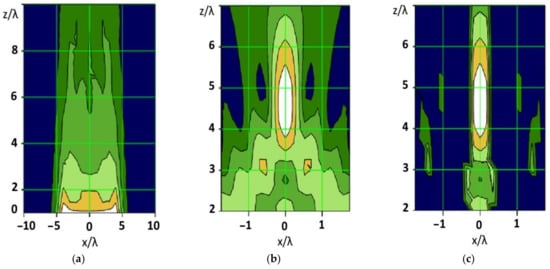
Figure 15.
Spatial distributions in the near radiated field zone for antenna length with a uniform phase distribution (a), focused to the point (0.5) (b), and focused to the point (0.5 ) with sum–difference processing (c).
Thus, the usage of the focused aperture principle with the formation of virtual spatial fields of a difference type makes it possible to perform a more accurate determination of irregularities and to enhance the possibility of their detection and observation in the presence of closely spaced reflecting objects.
6. Technical Solution for Non-Destructive Testing
Modern technical diagnostics and non-destructive testing actively use coherent methods, including the principle of synthetic aperture. As applied to ultrasonic technology, it is called the synthetic aperture focused technique [15,16]. The essence of the method is that the emission and/or reception is carried out from several points, and the received signals are stored and processed together. In the simplest version, the processing consists in a complex weighted summation of the received signals (reflected from a point object with coordinates at points ) (Figure 16).
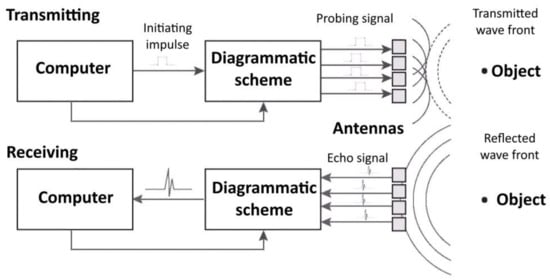
Figure 16.
One of the variants of non-destructive testing equipment.
Weighted summation corresponds to focusing at a point , where can take on different values within the field of view. When the probe is moved, the principle of a synthesized aperture is implemented (Figure 17).
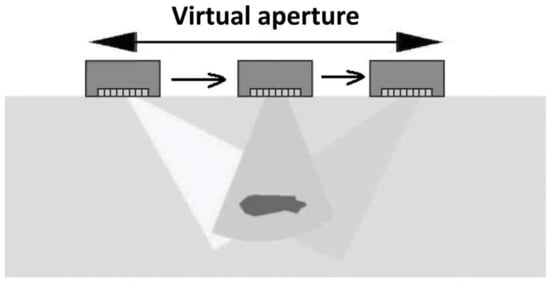
Figure 17.
Realization of the SAFT method.
With a sufficiently large number of samples, this expression is a function of the spatial distribution of a focused antenna. In a particular case, it is a linear antenna focused to a point .
To eliminate the effects associated with side lobe reception, side lobe suppression using sum–difference distributions can be successfully used. At the same time, the hardware part is not subject to any changes. Only the processing algorithm is changed.
We are confident that the generalization of methods for the formation of difference distributions focused at the near radiated field zone onto flat focused antenna arrays and the use of sum–difference processing will improve the efficiency of non-destructive testing and medical systems. The produced method is innovative. At the moment, we are making efforts to expand the potential of the application of focused fields.
7. Conclusions
This paper showed how it is possible to form focused electromagnetic fields of the difference type, similar to the difference antenna pattern in the far-field zone. Their use, as in tasks of echolocation in the far-field zone, allows us not only to increase the accuracy of determining the coordinates of the reflecting object, but also to mitigate the negative impact of receiving the reflected signal due to the presence of side lobes.
In conclusion, we note that in this work only brief information about the most essential properties of antennas focused in the near radiated field zone is given. More information can be found in the book [12].
Author Contributions
Conceptualization, Y.S.; methodology Y.S. and D.V.; formal analysis A.N. and D.V.; investigation A.N.; data curation D.V.; writing—original draft preparation T.A.; writing—review and editing D.V.; visualization D.V.; supervision O.M. and Y.S.; project administration O.M.; funding acquisition O.M. All authors have read and agreed to the published version of the manuscript.
Funding
The work was financially supported by the Ministry of Science and Higher Education of the Russian Federation: “Priority 2030” program.
Institutional Review Board Statement
Not applicable.
Informed Consent Statement
Not applicable.
Data Availability Statement
The data presented in this study are available on request from the corresponding author.
Conflicts of Interest
The authors declare no conflict of interest.
References
- Helier, C.J. Handbook of Nondestructive Evaluation, 1st ed.; McGraw-Hill Professional: New York, NY, USA, 2001. [Google Scholar]
- Matveev, V.I. Radiovolnovyj Kontrol’; Spektr: Moscow, Russia, 2011. [Google Scholar]
- Li, Z.; Meng, Z. A Review of Radio Frequency Nondestructive Testing for Carbon-fiber Composites. Meas. Sci. Rev. 2016, 16, 68–76. [Google Scholar] [CrossRef]
- He, X.; Geyi, W.; Wang, S. Optimal design of focused arrays for microwave-induced hyperthermia. IET Microw. Antennas Propag. 2015, 9, 1605–1611. [Google Scholar] [CrossRef]
- Bogosanovic, M.; Williamson, A.G. Microstrip Antenna Array with a Beam Focused in the Near-Field Zone for Application in Noncontact Microwave Industrial Inspection. IEEE Trans. Instrum. Meas. 2007, 56, 2186–2195. [Google Scholar] [CrossRef]
- Bogosanovic, M.; Thakur, K.; Holmes, W.S.; Cresswell, K.J. A comparison of the systems for non-contact and non-destructive natural product inspection. In Proceedings of the 5th International Conference on Electromagnetic Wave Interaction with Water and Moist Substances ISEMA, Rotorua, New Zealand, 23–26 March 2003. [Google Scholar]
- Buffi, A.; Serra, A.; Nepa, P.; Manara, G.; Luise, M. Near field focused microstrip arrays for gate access control systems. In Proceedings of the IEEE Antennas and Propagation Society International Symposium, North Charleston, SC, USA, 1–5 June 2009. [Google Scholar]
- Siragusa, R.; Lemaitre-Auger, P.; Tedjini, S. Near field focusing circular microstrip antenna array for RFID applications. In Proceedings of the 2009 IEEE Antennas and Propagation Society International Symposium, North Charleston, SC, USA, 1–5 June 2009; pp. 1–4. [Google Scholar] [CrossRef]
- He, X.; Geyi, W.; Wang, S. A Hexagonal Focused Array for Microwave Hyperthermia: Optimal Design and Experiment. In IEEE Antennas and Wireless Propagation Letters; IEEE: New York, NY, USA, 2016; Volume 15, pp. 56–59. [Google Scholar] [CrossRef]
- Hancen, R.C. Microwave Scanning Antenna; Apertures; Academic Press: New York, NY, USA; London, UK, 1964; Volume 1, p. 536. [Google Scholar]
- Bicmore, R.W. On focusing electromagnetic radiators. J. Phys. 1957, 15, 1292–1298. [Google Scholar] [CrossRef]
- Sedelnikov, Y.E.; Testoedov, N.A.; Vedenkin, D.A.; Danilov, I.Y.; Potapova, O.V.; Romanov, A.G.; Fadeeva, L.Y.; Choni, Y.I. Antenny, Sfokusirovannye v Zone Blizhnego Izluchennogo Polja; Sedelnikov, Y.E., Testoedov, N.A., Eds.; Sibirskij Gosudarstvenny Ajerokosmicheski Juniversitet: Krasnoyarsk, Russia, 2015; p. 308. [Google Scholar]
- Barton, D.K.; Ward, H.R. Handbook of Radar Measurements; Prentice-Hall Inc.: Englewood Cliffs, NJ, USA, 1969; p. 386. [Google Scholar]
- Skolnik, I. Radar Handbook; Radar and Systems; McGraw-Hill Book Company: New York, NY, USA, 1970; Volume 4. [Google Scholar]
- Shevaldykin, V.G.; Kozlov, V.N.; Samokrutov, A.A. Inspection of Concrete by Ultrasonic Pulse-Echo Tomograph with Dry Contact. In Proceedings of the 7th European Conference on Non-Destructive Testing, Copenhagen, Denmark, 26–29 May 1998. [Google Scholar]
- Chahbaz, A.; Sicard, R. Comparative Evaluation between Ultrasonic Phased Array and Synthetic Aperture Focusing Techniques. AIP Conf. Proc. 2003, 657, 769–776. [Google Scholar]
Disclaimer/Publisher’s Note: The statements, opinions and data contained in all publications are solely those of the individual author(s) and contributor(s) and not of MDPI and/or the editor(s). MDPI and/or the editor(s) disclaim responsibility for any injury to people or property resulting from any ideas, methods, instructions or products referred to in the content. |
© 2023 by the authors. Licensee MDPI, Basel, Switzerland. This article is an open access article distributed under the terms and conditions of the Creative Commons Attribution (CC BY) license (https://creativecommons.org/licenses/by/4.0/).