Abstract
With the development of power technology and communication technology, the power grid and power communication network have become interdependent and closely coupled. The load shedding operation of the power grid is an important means to reduce the occurrence of chain faults and ensure the safe and stable operation of the power grid. Based on the transmission of load control services in the communication network, this paper establishes a model for a dual-network coupled cyber physical power system (CPPS). Considering communication edge faults, the associated load capacity of the communication edge and the expected load loss of the power grid are defined. On this basis, the paper proposes a complete information zero-sum game mechanism called “defense attack defense” for communication edge failures, which takes the expected loss of load from the power grid as the benefit. The paper studies the optimal attack and defense game strategies and provides the algorithm implementation process for the three stages of the game. Considering the bandwidth capacity of the communication edge, this paper uses the Dijkstra algorithm or k shortest paths (KSP) algorithm with the cost factor of the communication edge as the weight to plan the main and backup communication channels for multiple load control services. The simulation results show that the game mechanism proposed in this paper can effectively reduce the expected load loss from the power grid and improve the stability of the CPPS.
1. Introduction
With the widespread application of the optical fiber composite overhead ground wire (OPGW), the integration of optical fiber communication technology and transmission technology has deepened the interdependence between power communication networks and power systems. At the same time, the functional coupling of the main power system and the secondary control system have caused the modern power grid to develop into a kind of cyber physical power system (CPPS) [1,2,3] with a dual coupling structure and function. The CPPS system integrates technologies, such as power, communication, sensing, computing, and control, making safe operation and control extremely complex [4,5]. Faults on the power grid or communication network side can lead to cascading failures in the CPPS system [6] and even network crashes. To ensure the safe and stable operation of the CPPS system and avoid the occurrence of chain failures, the system should have the ability to self regulate and reduce system losses. There have been numerous publications on the performance indicators of regulation methods and strategies for the study of CPPS cascading failures and system regulation mechanisms [7,8,9]. To maintain the power balance and stability of the power system, disconnecting a portion of the load from the grid is called load shedding.The load shedding operation of the power grid is an important means to ensure the safe and stable operation of the power grid [10,11], and the value of the load power change caused by the load shedding operation is called the load shedding amount.
The secondary power system undertakes the transmission of load control services, and with the deepening of internet services, the demand for information exchange between internet services and energy services has continued to increase, leading to a further increase in the possibility of attacks on the power communication network. Therefore, in CPPS systems, power communication networks are more prone to malfunctions. In order to reduce the impact of communication network failures on the CPPS, most research has focused on optimizing the routing of service information transmission. For example, Reference [12] achieves service recovery from N-1 faults in the power grid optical communication network by reconstructing routing and reducing the service interruption time. Reference [13] proposes a risk assessment algorithm for power communication service routing, which optimizes the traffic channel of communication risk through a dynamic routing constraint algorithm to reduce the risk of power interruption, Reference [14] proposes ant colony optimization algorithms to optimize the power communication line and obtain the shortest distance and the optimal path. Reference [15] considers the impact of communication link failures in device-to-device (D2D) communication structures on the microgrid (MG), and implements MG control and management through deep learning methods.
The sources of faults in the power communication network can be divided into two categories from the perspective of system management: uncontrollable factors and controllable factors. Communication failures caused by natural disasters, such as hurricanes, rainstorms, and snow disasters [16], are uncontrollable and sudden. To ensure the safe and stable operation of the power communication network, it is necessary to carry out maintenance on communication equipment [17,18]. During the maintenance process that does not meet the distance requirements for live working, maintenance personnel need to cut off the power supply of the optical cable in order to refurbish some equipment on the tower [19,20], resulting in the optical cable not working properly. Therefore, the impact of communication equipment maintenance on the communication network can be regarded as a source of faults and a controllable factor. New technologies and equipment can be adopted to extend maintenance cycles and reduce the probability of fiber optic cable power outages. Both types of fault sources mentioned above can cause communication network failures, resulting in incorrect transmission of power services data.
The topological structure of the power communication network is often represented by a graph composed of communication nodes (CNs) and communication edges (CEs), where CNs correspond to communication sites, CEs correspond to communication lines, and CEs are channels connecting all CNs. According to the different communication technologies used, the CEs of the power communication network are divided into wired CEs and wireless CEs. Wired CEs refer to optical cable links that use optical communication technologies such as the synchronous digital transport system (SDH) and optical transmission network (OTN) [21,22] with a wide coverage area and long communication distance. Wireless CEs refer to communication lines that use wireless communication technologies such as 2G/3G/4G/5G with a small coverage range and a close communication distance. During the operation of the power communication network, the protection measures of CNs are relatively flexible, while CEs are difficult to maintain and are greatly affected by external factors, resulting in a high probability of failure [23]. For example, in power systems with a large number of distributed energy resources (DER), there are a large number of Internet of Things (IoT) devices connected to the power communication network. Compared to traditional power networks, CEs are more susceptible to faults caused by human or natural factors [24]. Therefore, the paper ignores CN faults and focuses on studying communication network faults caused by CE faults.
On the other hand, game theory, as an important discipline of operations research, is one of the mathematical methods used to study the phenomenon of competition between members who participate in a game. It can effectively make logical decisions on events with an antagonistic nature and is widely used in many fields. For example, Reference [25] uses the noncooperative Stackelberg game theory model to study the management of a green electric vehicle energy network. According to the energy consumption and unit energy price required for charging and discharging, the Nash equilibrium solution of charging and discharging is obtained, and the energy network management scheme of electric vehicles is generated. Reference [26] considers distributed generation operators, distribution network operators, and power users and proposes a multi-agent collaborative planning method based on noncooperative game theory, which balances the economic benefits of each agent. Reference [27], based on the virtual power plant platform, uses the multi-agent reinforcement learning strategy to realize game behavior among multiple power generation enterprises, energy storage enterprises, and load users and works out the Nash equilibrium solution for the total income of the game participants to maximize the overall income of each participant.
From the perspective of the interaction between the power communication network and the power network, based on the load shedding operation and the transmission of load control services in the power network, this paper establishes a CPPS model for the coupling of the power network and the power communication network. The communication network adopts the main and backup routing methods, plans communication channels for multiple load control services, and describes the importance of CEs based on the associated load capacity. Furthermore, when given the probability of CE failure, the expected load loss of the power grid is defined to measure the impact of communication network failures on the power grid. On this basis, a three-stage zero-sum game mechanism of the CPPS is proposed based on the expected loss of load from the power grid. The attacker attacks the CE edge, and the defender plans a new load control service channel for defense. The Dijkstra algorithm or KSP algorithm is used for load control service channel planning. The paper studies the optimal attack strategy and optimal defense strategy and conducts algorithm implementation and simulation experiments.
2. CPPS System Model
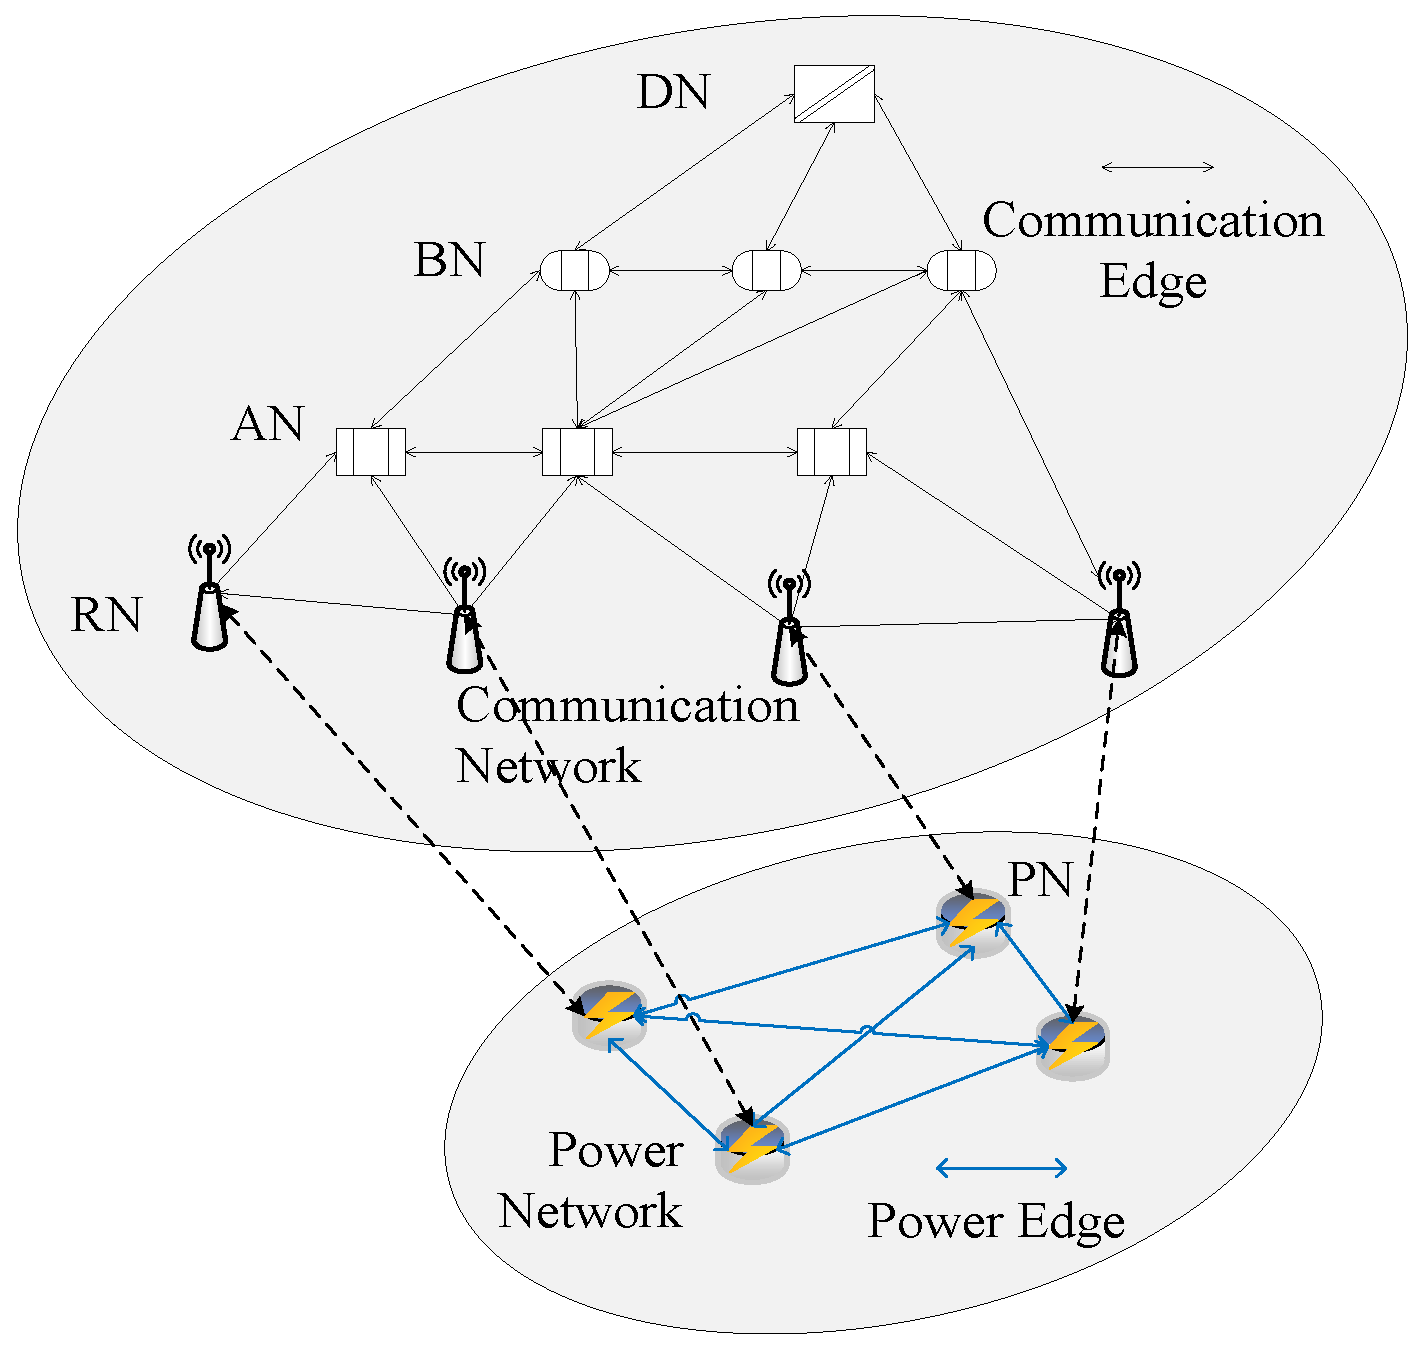
2.1. Model Composition
The CPPS system model coupled with power and communication networks is shown in Figure 1. The system model consists of a power network and a communication network, which are abstracted from the main power system and the secondary control system, respectively. The power generation equipment and users of the main power system are power nodes (PNs), and the transmission and distribution lines are abstracted as power edges. In the secondary control system, data collection devices and monitoring control devices are abstracted as remote terminal unit (RTU) nodes (RNs), and relay stations, regional control nodes, and data processing devices are abstracted as access nodes (ANs), backbone nodes (BNs), and dispatch nodes (DNs), collectively referred to as communication nodes (CNs). The communication lines between CNs are called CEs, and wireless communication is used between RTU nodes, while wired communication is used between other nodes, such as OPGW fiber optic communication. The RN of the communication network is connected to the PN of the power network one-by-one, and the line connecting the two is called the coupling edge.
Figure 1.
Schematic diagram of the coupling model between the CPPS communication network and the power network.
The numbers of communication networks (CNs) and CEs are set as N and M, where the numbers of DN, BN, AN, and RN are , , , and , . The set of communication node numbers is represented by , and the sets of numbers for DN, BN, AN, and RN are represented by , , , and , which satisfies . The connections between communication nodes can be described by the adjacency matrix . When there is a CE between the i-th CN and the j-th CN, . Otherwise, . The set of directed CEs in a communication network can be represented by , where represents the directed CE from the i-th CN to the j-th CN, with two directed CEs corresponding to one undirected CE.
2.2. Cost Factor of the CE
The communication network carries power service data, and service data pass through multiple CNs and multiple CEs from the source node to the destination node. The physical properties of CNs and CEs play important roles in the selection of service routes. We ignore the CN and define the parameters related to the CE. From the CPPS system model presented in Figure 1, it can be seen that the communication network includes a wired CE and a wireless CE. For the wired CEs , the cable length, bandwidth capacity, and reliability coefficient are set as , , and , respectively. The reliability coefficient is related to factors, such as the type of CE and its operating year. The service data are transmitted from an optical cable with a length of , the transmission delay value is , and the speed of light is c. Taking into account the reliability and delay of the CE, the cost factor for data transmission on CE is defined as
Considering the use of wireless communication between RN nodes in the communication network, compared to fiber optic communication between other nodes, the transmission rate of wireless communication is much lower than that of fiber optic communication, and the cost of a CE between RN nodes is greater than that of other CEs. When planning service communication channels, the cost factor of a CE can be used as the weight of the CE to calculate the total weight of all CEs on the channel and select the channel with a smaller weight. The bandwidth capacity of a CE determines the ability to carry services on that CE, and the bandwidth usage of all services carried on a CE cannot exceed the bandwidth capacity.
2.3. Communication Channel Planning for the Power Network Load Control Service
The degree to which the load shedding of the power grid is affected is an important indicator for measuring the stability of the power grid. To ensure the stable operation of the power grid, the CPPS monitors and regulates the operational status of the power grid. The RN collects power grid data and uploads them to the DN through the CN. The DN adopts corresponding control strategies to calculate the load shedding of power nodes, form the load control service (LCS) of the power grid, and search for communication channels for it. According to the planned communication channel, load control services are transmitted down to the RN through the BN and the AN, controlling the PN connected to the RN for load shedding operations. Load control services are transmitted in the direction of DN → BN → AN → RN and cannot be transmitted in reverse. Therefore, the cost factor of a CE that is not allowed to participate in load control service transmission is set to infinity. In all CNs, , when , or . The cost factors of all CEs in the entire communication network are represented in matrix form, and the inherent cost factor matrix of the communication network is defined as . At the same time, the initial bandwidth occupation matrix of the communication network is defined as a full zero matrix, .
Let the CPPS generate K grid load control services at a certain time, and use the set = to represent their numbered set. The k-th LCS can be represented by . Among them, is the source node of the services, is the destination node, is the load shedding of the power node associated with the destination node , and is the communication bandwidth occupied by the LCS.
When planning communication channels for power grid load control services, the “1 + 1” main backup mode is adopted to plan the main backup communication channels for it. For the k-th service, we define the main and backup communication channel matrices and . If the transmission of the services passes through CE, the elements and in the i-th row and j-th column of the matrix have values of 1; otherwise, they have values of 0. At the same time, the main and backup communication channels meet the nonintersection condition of CEs:
Considering the bandwidth capacity limitations of CEs and the main and backup mechanisms of services, the selection of communication channels for different services and the selection of the main and backup channels for the same service both require the cost factor matrix and bandwidth occupancy matrix of the communication network to be updated.
2.4. Expected Load Loss from the Power Grid during CE Failure
The communication network carries K load control services, and each CE can carry multiple load control services. If a CE malfunctions, the data from all services it carries cannot be correctly transmitted to the destination node, and the corresponding PN cannot accurately perform load shedding operations, thereby affecting the stable operation of the power grid. Therefore, the importance of a CE can be represented by the associated load, and the associated load of a CE is represented as
In the above equation, .
When service data cannot be reliably transmitted on a CE, it is said that the CE has malfunctioned. Considering that communication networks have inherent protection or defense mechanisms, when a CE is affected by various uncontrollable or controllable factors, service data on a CE may not be reliably transmitted with a certain probability. In this paper, protective mechanisms or defensive measures are quantitatively represented as defensive resources. If there is a large number of defense resources, there is a low probability of CE failure; if the number of defense resources is small, the probability of CE failure is high.
If the probability of CE failure is , then the expected load loss value corresponding to the CE is . The CE with the highest expected load loss value is defined as the most important CE, represented as
The higher the value of , the greater the importance or fragility of the CE. To reduce the impact of communication network failures on the power grid, more defense resources should be allocated to important CEs.
The sum of the expected load loss values of all CEs in the entire communication network and all attacked CEs in the communication network is defined as the expected load loss from the power network. For M CEs in the communication network, define 0–1 variables and to indicate whether the CE is under attack. For example, indicates that CE and CE are under attack; otherwise, . The expected load loss from the power grid is expressed as
The expected load loss can be used as a quantitative indicator to characterize the degree of impact of communication network faults on the power grid. The key symbol table is as Table 1:
Table 1.
Key symbol.
3. CPPS Attack and Defense Game for CE Faults
When a certain CE side fails, it may prevent the successful transmission of some power grid load control services, affecting the load shedding of the power grid and disrupting the stable operation of the CPPS. At this point, the CPPS system should have the ability to adapt and self regulate, searching for new communication channels for power grid load control services and reducing the impact of CE faults. The anomaly detection and intrusion detection system can determine the location of the attacked CE for the system administrator of the CPPS and issue an alarm to remind management personnel to prepare strategies for the failure of CE after being attacked. Therefore, deploying and upgrading anomaly detection and intrusion detection systems can improve the efficiency of CPPS when responding to attacks.
The zero-sum game is a branch of game theory, which means that users who participate in the game compete very strictly with each other. The gain of one user corresponds to the loss of other users, and the sum of the gains and losses of all users is always zero. Considering the source of CE faults as an attack, the CPPS system’s response to CE faults is viewed as a defense, and a fully informative dynamic zero-sum attack defense game model is proposed to describe it. A is the attacker, D is the defender, is the set of attack strategies, and is the set of defense strategies. and respectively represent the benefits of the attacker and defender, satisfying . The strategic actions taken by the attacker and defender have a sequential order, and both parties in the game have a complete understanding of CPPS information, fully understand the strategies adopted by both parties, and know the benefits of various game situations for both parties. In a game, the attacker and defender adopt attack or defense strategies to maximize their own profits, which is a noncooperative game.
Specifically, the communication network of the CPPS has M CEs, and attacker A is defined as the factor causing CE failure, for example, natural factors, such as hurricanes and lightning, as well as human interference factors, such as cutting off optical cables and injecting false data. Defender D is defined as the automatic maintenance program or the CPPS administrator of the CPPS system, and the attacker’s profit is defined as the expected load loss of the power grid. For attackers, the attack strategy is to select m out of M CE edges for attack with a total of attack strategies. For defenders, in order to counter the attacked CE, mobilize defense resources, and adopt various methods and measures to reduce the probability of CE damage, at the same time, it is necessary to plan new communication channels for load control services to reduce the expected load loss from the power grid.
As shown in Figure 2, the game process adopts a three-stage process of defense–attack–defense, which is described as follows:
Figure 2.
Game flow chart of three stages of the game.
- Stage 1:
- Defense stage
To ensure the safe transmission of power grid load control information, the defender plans the initial communication channel for all power grid load control services. The associated load of each CE is calculated using Equation (3) to determine the importance of the CE. According to the importance of the CE, defense resources are allocated to the CE, the probability of CE failure after being attacked is reduced, and the load loss from the power grid is reduced.
- Stage 2:
- Attack stage
Under the assumption of a complete information game, attacker A knows the communication channels of all LCSs in the first stage and the allocation of defense resources to each CE. On this basis, the attacker develops optimal attack strategies to attack the CE, leading to the possibility of CE failure. A malfunctioning CE will block the transmission of LCSs on that CE, resulting in the destination node of the LCS, the RN corresponding to the LCS, not being able to successfully receive this information, ultimately resulting in an inability to complete the load shedding operation and increasing the expected load loss from the power grid.
- Stage 3:
- Defender response stage
The communication network is under attack, and the dispatch center in the communication network issues an alarm. Defenders adopt defense strategies based on the attack situation of the communication network, and re-plan the main and backup communication channels for load control services to minimize the load loss from the power network.
In the above three stages, the defender first plans the initial communication channel and defends against important CEs. Under the assumption of a complete information game, both attack and defense parties are aware of various parameters in the power communication network. Therefore, based on various information in the current power communication network, the attacker aims to maximize the expected load loss from the power network and launch an attack on the CE. Finally, the defender adjusts the communication channel of the attacked power communication network to reduce the expected load loss from the power network. Using the expected loss of load from the power grid as the revenue indicator of the entire game can accurately reflect the impact of LCS transmission obstruction on the normal operation of the power grid.
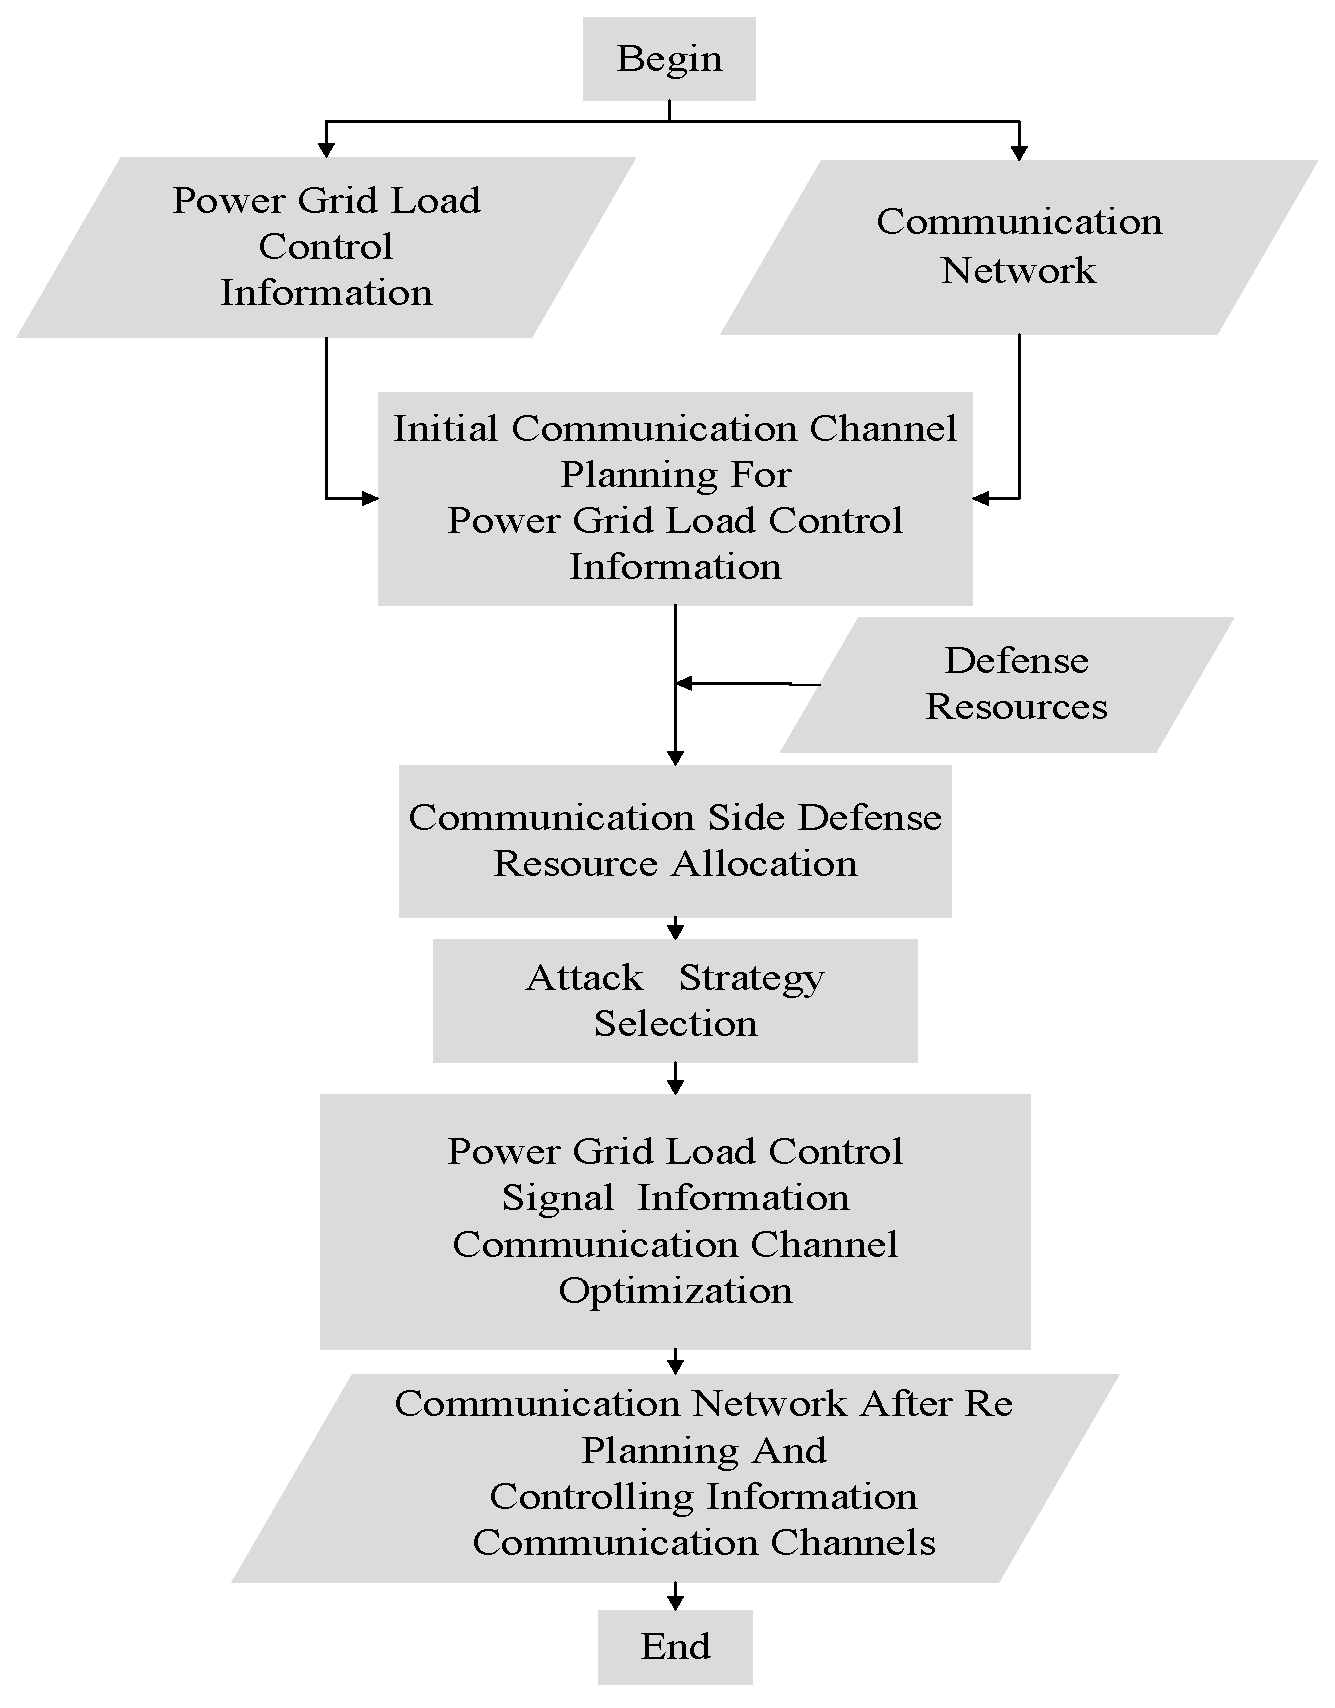
4. Optimal Attack and Defense Strategies of CPPS Offensive and Defense Games
4.1. Initial Communication Channel Planning and Defense Resource Allocation for the LCS
In the first stage, the defense behavior of the defender includes initial communication channel planning for load control information and defense resource allocation. The Dijkstra algorithm is used to select the main and backup communication channels for K services, and defense resources are allocated based on the importance of the CE, reducing the probability of important CE failures.
4.1.1. Initial Communication Channel Planning for the LCS
The Dijkstra algorithm is a greedy algorithm that is used for finding the shortest path of a weighted graph, which can find the shortest path from the source node to the destination node. For the communication network of the CPPS, the data transmission cost factor defined in Equation (1) is used as the weight of the CE to find the path with the minimum sum for the cost factors of the CE that the services passes through. Considering the bandwidth capacity limitations of the CE and the main and backup mechanisms of services, the selection of communication channels for different services and the selection of the main and backup channels for the same service both require the cost factor matrix and bandwidth occupancy matrix of the communication network to be updated. For the LCS numbered , when the communication channel planning is completed, the bandwidth occupation of CE is
Assuming , the bandwidth occupation matrix of the communication network is , and the cost factor matrix is represented as . For the k-th load control service , the bandwidth is . To prevent CE in the communication channel not meeting the bandwidth capacity limit, the estimated bandwidth usage of the CE is calculated and denoted as
When the estimated bandwidth usage of the CE exceeds the bandwidth capacity, it cannot participate in the transmission of services. The cost factor of the CE can be set to infinity; that is, when , . The cost factors of other CEs remain unchanged, and the cost factor matrix is updated to . Furthermore, it is determined that the main communication channel of is , and it is assumed that the CE set contained in is
The sum of the cost factors of all CEs included in , has the smallest value. When searching for the backup channel matrix , in order to satisfy the conditions of Equation (2), the cost factor of CE that passes through is set to infinity and represented as
The cost factors of the other CEs remain unchanged, and the cost factor matrix is updated. The backup communication channel used for planning is , and the bandwidth occupancy matrix of the communication network is
In addition, considering the different load shedding corresponding to each service, the impact on the load shedding of the power grid is also different. When planning communication channels, they are rearranged in the order of from top to bottom. LCS’ with higher values of have higher priority and prioritize the finding of communication channels. The number set after LCS reordering is set as , where the number of the services with the highest load shedding is , and so on. For convenience of expression, the new sequence number of the LCS with the original number is still , and so on. The new sequence number of the LCS with the original number is . The main and backup communication channels are planned one-by-one for K load control services in a new order. The steps are as follows:
- Step 1:
- Reorder the load control service numbers and obtain . Set .
- Step 2:
- According to Equation (7), calculate the estimated bandwidth usage of the CE and update the cost factor matrix .
- Step 3:
- Using the Dijkstra algorithm, determine the main channel matrix . According to Equation (9), update the cost factor matrix .
- Step 4:
- Using the Dijkstra algorithm, determine the backup channel matrix . According to Equation (10), update the bandwidth occupancy matrix .
- Step 5:
- Let , and end when is met; otherwise, go to step 2.
4.1.2. Defense Resource Allocation
There are M CEs in the communication network, and defense resources with a total amount of are allocated to CEs in L rounds. Each round allocates defense resources to the most important CEs. To improve the utilization of defense resources, select the edge with the highest expected load loss, that is, the most important edge, to allocate defense resources, and reduce the expected load loss value of the entire system.
According to Section 4.1.1, plan the main and backup channels for K power grid control services, which can carry multiple services on the CE. Calculate the associated load of the CE using Equation (3). When there are no defense resources, the probability of a CE being attacked and failing is 1. As defense resources are allocated to the CE, the probability of its failure gradually decreases. Assuming that the defense resources possessed by the -th and n-th rounds of the directed CE are and , respectively, and their probabilities of failure after being attacked are and , then , and
The expected load loss value of a CE in the n-th round is
The CE with the largest is the most important CE, denoted as
CE obtains defense resources for this round, and the calculation formula for the amount of defense resources it possesses is
Other edges with expected load losses of less than CE do not obtain defense resources, and the defense resource amount remains unchanged.
The defense resource allocation steps are as follows:
- Step 1:
- Set the defense resources and initial failure probability of each CE to , respectively. Set .
- Step 2:
- Calculate the expected load losses of all CEs according to Equation (12).
- Step 3:
- According to Equation (13), find the most important CE.
- Step 4:
- Step 5:
- According to Equation (11), calculate the failure probability of a CE being under attack.
- Step 6:
- Let , and end when ; otherwise, go to step 2.
It can be seen that the defense resource allocation steps adopted can enable CEs with high expected load loss values to obtain more defense resources, reducing their failure probability and thus reducing the expected load loss for the entire power grid.
4.2. Attack Strategy Selection Based on the Maximum Expected Load Loss in the Power Grid
Attackers obtain the importance information of a CE in the CPPS, adopt the best attack strategy, launch an attack, and maximize the expected load loss from the power grid. For attackers, the attack strategy is to select m out of M CEs for attack, having a total of attack strategies. The attack matrix is defined as . It is a binary symmetric matrix, and its dimensions are . If attacking m edges, there are elements in that are valued at 1, and the others are valued at 0. Set all possible sets of attack matrices to . From the first stage of the game, it can be seen that after a CE is allocated defense resources, the probability of failure after being attacked is . Define the failure probability matrix for all CEs in the communication network under attack. For the k-th LCS, assuming that CEs do not affect each other and use the main communication channel for transmission, the probability of service transmission failure is
Equation (16) can be expressed in matrix form as
where · represents the dot product of the matrix, and represents the -norm of the matrix, which is the sum of the absolute values of all elements in the matrix, such as = . Similarly, if backup communication channel A is used for transmission, the probability of service transmission failure is
For K load control services for the entire power grid, the main and backup communication channels work independently, and the expected load loss caused by service transmission failure in the power grid is
The optimal attack matrix can be expressed as
In the attack matrix, set , select that maximizes as the attack matrix, determine the CE to attack, and carry out the attack. At this point, the calculation formula for the expected load loss of the power grid is
4.3. Optimization of the Communication Channel for the Power Network Load Control Service Based on the KSP Algorithm
In the third stage, based on the probability of CE failure when attacked and the optimal attack matrix, the defender re-plans the main and backup communication channels for each LCS to minimize the expected load loss from the power grid. From the second stage of the game, it can be seen that the attack matrix is , the communication network CE failure probability matrix is , and the set of the main and backup channel matrices of all K LCSs is and , respectively. Therefore, the expected load loss from the power network caused by this attack matrix is
Given the communication network, the corresponding matrix sets and and the main and backup channels for each LCS are simultaneously found to minimize the expected load loss of the entire power network, represented as
The optimization problem that uses Equation (23) as the objective function has high complexity. To simplify the operation, the K-shortest paths (KSP) algorithm is used for a class exhaustive search to find a possible set of main and backup channels. Under the condition of meeting the CE bandwidth capacity of the communication network, with the aim of minimizing the expected load loss from the power network, the optimal set of main and backup channels for K LCSs is selected.
4.3.1. The KSP Algorithm Obtains the Set of Main and Backup Channels
For the k-th LCS , use the KSP algorithm to search for possible main communication channels. For each possible main communication channel, search for possible backup communication channels. For LCS k, let the set of possible main communication channels be represented as . For any possible main communication channel , the corresponding set of possible backup communication channels is represented as , and the set of backup channels corresponding to the main channel set is represented as . For any , the cost factor of the communication network CE is , and the cost factor matrix is . When searching for the backup communication channel for , the cost factor needs to be updated. Similarly to Equation (9), let the CE set contained in be , and set the cost factor of the CE passed by to infinity, denoted as
The cost factors of other CEs are the same as the inherent cost factor matrix of the communication network and remain unchanged:
4.3.2. Select the Optimal Set of Main and Backup Channels for K LCSs
Select an element from as the main channel set of the k-th service, and select one element from its corresponding backup channel as the backup channel . Assuming and , there are possible combinations of main and backup channel matrices, represented as
Let the combination of have U types. The u-th combination is represented by , . For the pair of main and backup channels and of the k-th LCS, the expected load loss from the power grid is
The expected load loss from the power grid considering the entire LCS transmission is
At this point, Equation (23) can be converted to
At the same time, considering the bandwidth capacity limitation of the communication network CE, for the pair of main and backup channels and of the k-th LCS, according to Equation (6), it can be seen that the bandwidth occupancy matrix of all CEs in the communication network is represented as
Then, the bandwidth occupancy matrix of all LCS is
Then, the element in the i-th row and j-th column of the bandwidth occupancy matrix needs to satisfy
4.3.3. Steps for Optimizing the Communication Channel of the LCS
The steps for re-planning communication channels and for all LCSs are as follows:
- Step 1:
- , .
- Step 2:
- According to matrix , apply the KSP algorithm to plan the set of possible main communication channels .
- Step 3:
- Step 4:
- , when . Determine the set ; otherwise, go to step 3.
- Step 5:
- . When the condition is met, end and obtain possible combinations of the main and backup channel matrices; otherwise, proceed to step 2.
- Step 6:
- Step 7:
Therefore, after the third stage of the game, if the new main and backup channel matrices for the k-th LCS are , . The calculation formula for the expected load loss from the power grid that has gone through the three stages of the game is
5. Experimental Simulation and Analysis
This paper used the power and communication networks of some cities in Shandong Province as examples for the experimental simulation and studied the CPPS game mechanism and strategy proposed in the paper.
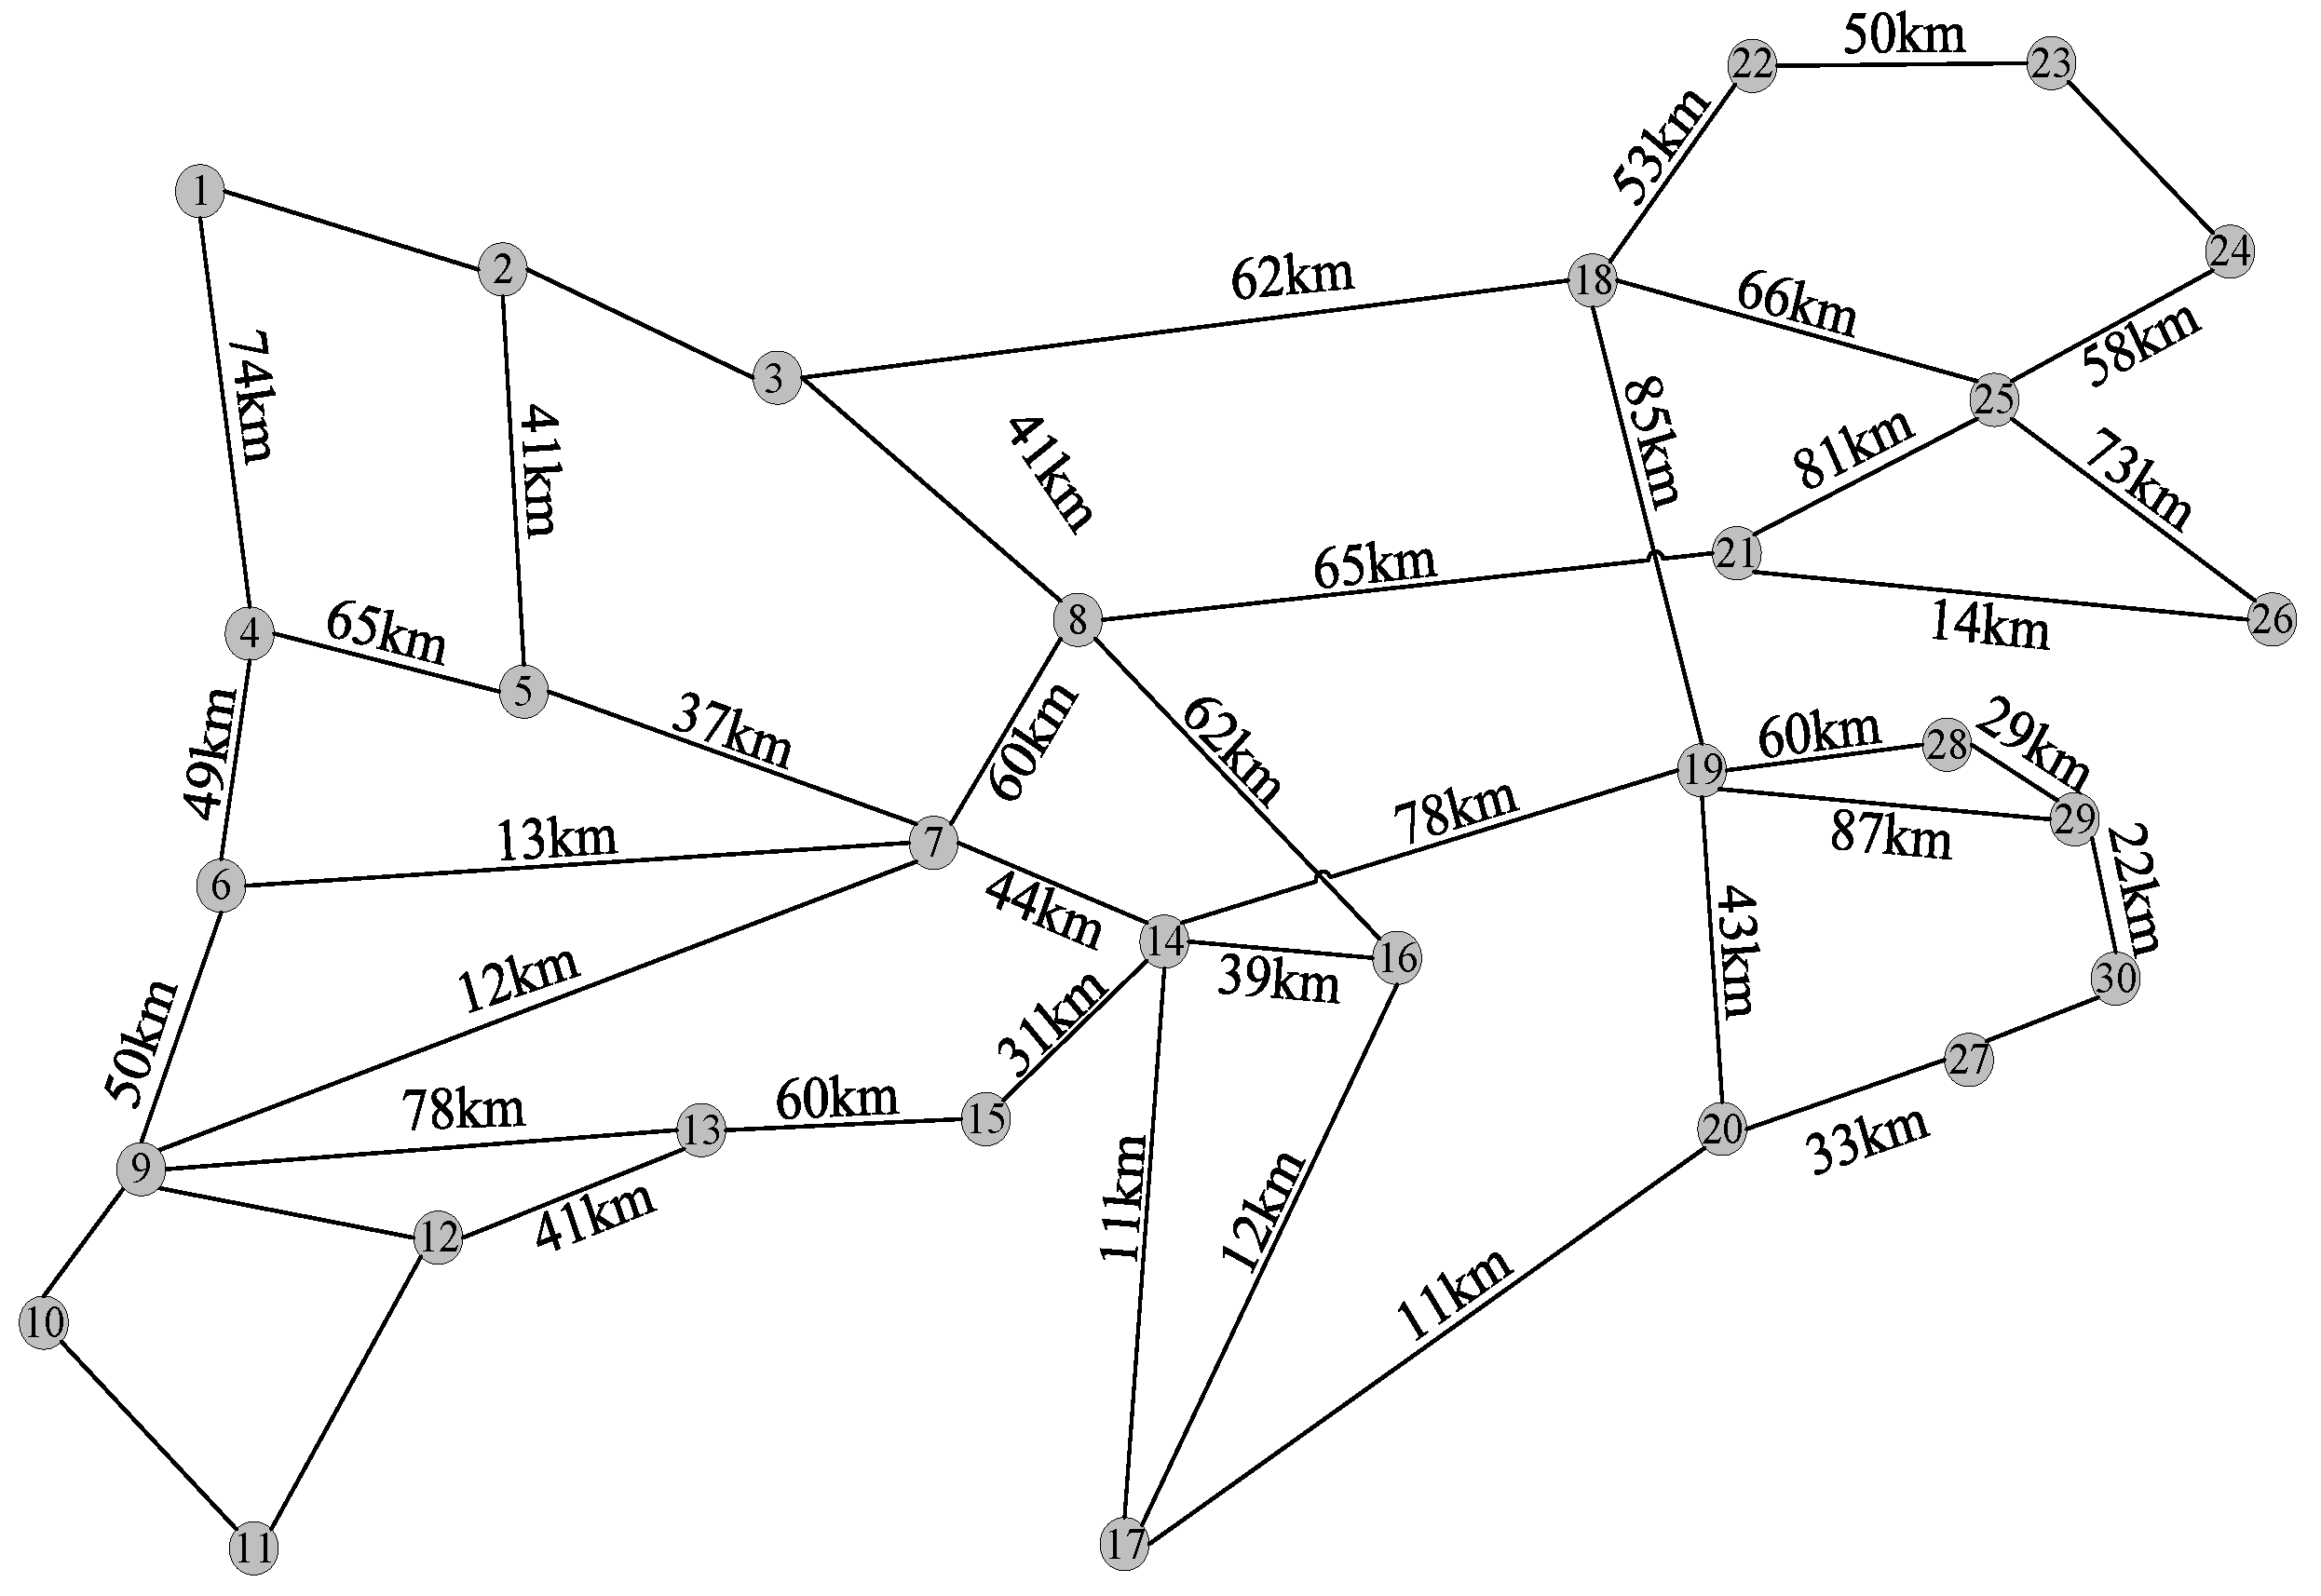
5.1. Experimental Parameter Settings
The topological structure of the communication network is shown in Figure 3. It includes 30 CNs and 45 undirected CEs. The numbering sets of the four types of nodes, DN, BN, AN, and RN, in the CN are , , = , and .
Figure 3.
Topology of power communication networks in part of Shandong Province.
The DN, BN, and AN nodes use fiber optic communication, while the RN communicates wirelessly, with one RN corresponding to one PN node. In Figure 3, the length of the cable CE is marked on the line segment, and the reliability coefficient is set to 100. Considering that the cost factor for data transmission in a wired CE ranges from 0 to 1, the cost factor for the wireless communication CE is set to 1. In addition, the bandwidth capacity of all CEs in the communication network is set to 14 Mbps.
For the load control service , the source node and destination node are randomly selected from the set and according to the uniform distribution. Load shedding follows a normal distribution for the mean and variance , the bandwidth is set to 2 Mbps, and the number of rounds of defense resource allocation in the first stage of the game is .
In the first stage of the game, due to the sparsity of the experimental topology and the use of multiple Dijkstra algorithms during initial communication channel planning, the algorithm complexity of the initial communication channel planning is . At the same time, in this stage, the algorithm’s complexity for defense resource allocation is . In the second stage of the game, the algorithm’s complexity for the optimal attack strategy is . In the third stage of the game, the algorithm’s complexity when using the KSP algorithm to plan the possible main and backup communication channels is , and the algorithm’s complexity when selecting the optimal communication channel is . Therefore, the algorithm’s complexity of the game mechanism proposed in this article is .
5.2. Simulation Experiment on the Three-Stage Process of CPPS Attack and Defense Game
In the experiment, it is assumed that the mean and variance of the normal distribution are and , and the communication network generates power network load control services at the same time. The parameter information of the LCS is shown in Table 2.
Table 2.
Parameters of grid load control services.
In the three stages of the game, the relevant parameters are set as follows: In the first stage of the game, the total amount of defense resources is , In the second stage of the game, the attacker selects the number of communication edges to attack, . In the third stage of the game, the number of possible main and backup communication channels is . In the first stage of the game, with the cost factor of the CE as the weight, initial communication channel planning is carried out for seven LCSs. The main and backup channels contain the CE, as shown in Table 3.
Table 3.
Initial communication channel planning results for the power grid load control services.
In the first stage of the game, defense resources are allocated to CEs. Among them, certain defense resources are allocated to CEs (6,4), (4,6), (7,6), (6,7), (9,7), (7,9), (13,15), (15,13), (14,7), (7,14), (14,15), (15,14), (16,8), (8,16), (16,17), (17,16), (17,20), (20,17), (18,19), (19,18), (19,20), and (20,19). The failure probabilities during attack are 0.769, 0.769, 0.769, 0.769, 0.769, 0.833, 0.833, 0.833, 0.833, 0.472, 0.472, 0.833, 0.833, 0.714, 0.714, 0.769, 0.769, 0.909, 0.909, 0.625, 0.625, 0.556, and 0.556, respectively. Other CEs are not allocated defense resources, so their probability of failure when attacked is .
In the second stage of the game, the CEs corresponding to the optimal attack matrix are (4,6), (6,7), (3,8), and (16,17). At this point, the attack benefit , i.e., the expected loss of load G from the power grid, is 417.88 MW.
In the third stage of the game, communication channel optimization is carried out for the LCS, and the CE of the new main and backup communication channels is shown in Table 4.
Table 4.
Communication channel optimization results.
Comparing Table 2 and Table 3, it can be seen that after the third stage, the main communication channels of the second and third LCSs and the backup communication channels of the first, second, and third LCSs have been optimized after searching for new communication channels for the attacked edges. For example, for the first LCS, the optimized main communication channel avoids the attacked edges (6,7), while the backup channel avoids the attacked edges (16,17). According to Equation (33), the expected load loss from the power grid in the third stage of the game is. Compared to the expected loss of load in the second stage of the game, the expected loss of load in the third stage decreased by 175.39 MW, a decrease of 41.972%. This game process simulation is based on the i7-12700 processor, which only takes 0.7394 s.
5.3. Research on the Performance of the CPPS Game Mechanism
According to the three-stage attack and defense game process proposed in the paper, it can be seen that parameters , and all affect the expected loss of load G in the third stage of the game. Based on the parameter settings presented in Section 5.1, the following is a specific study of the impact of each parameter on the expected loss of load G in the third stage of the game. In the simulation experiment, the Monte Carlo method is used. The average expected loss of load in the third stage of the game with multiple experiments is taken as the experimental result, and the number of Monte Carlo experiments is 1000. In the experiment, the number of concurrent LCS is relatively small, and the bandwidth resources of the communication network are relatively sufficient. There is no blocking in the planning of LCS channels; that is, each service will obtain the planning details from the main and backup communication channels.
In summary, in the topology of some real power communication networks in Shandong Province, assuming the presence of seven LCSs at the same time, the expected load loss from the power network is significantly reduced after the system experiences a complete game mechanism, and the game mechanism consumes an extreme amount of time, indicating the efficiency of the game mechanism proposed in this article.
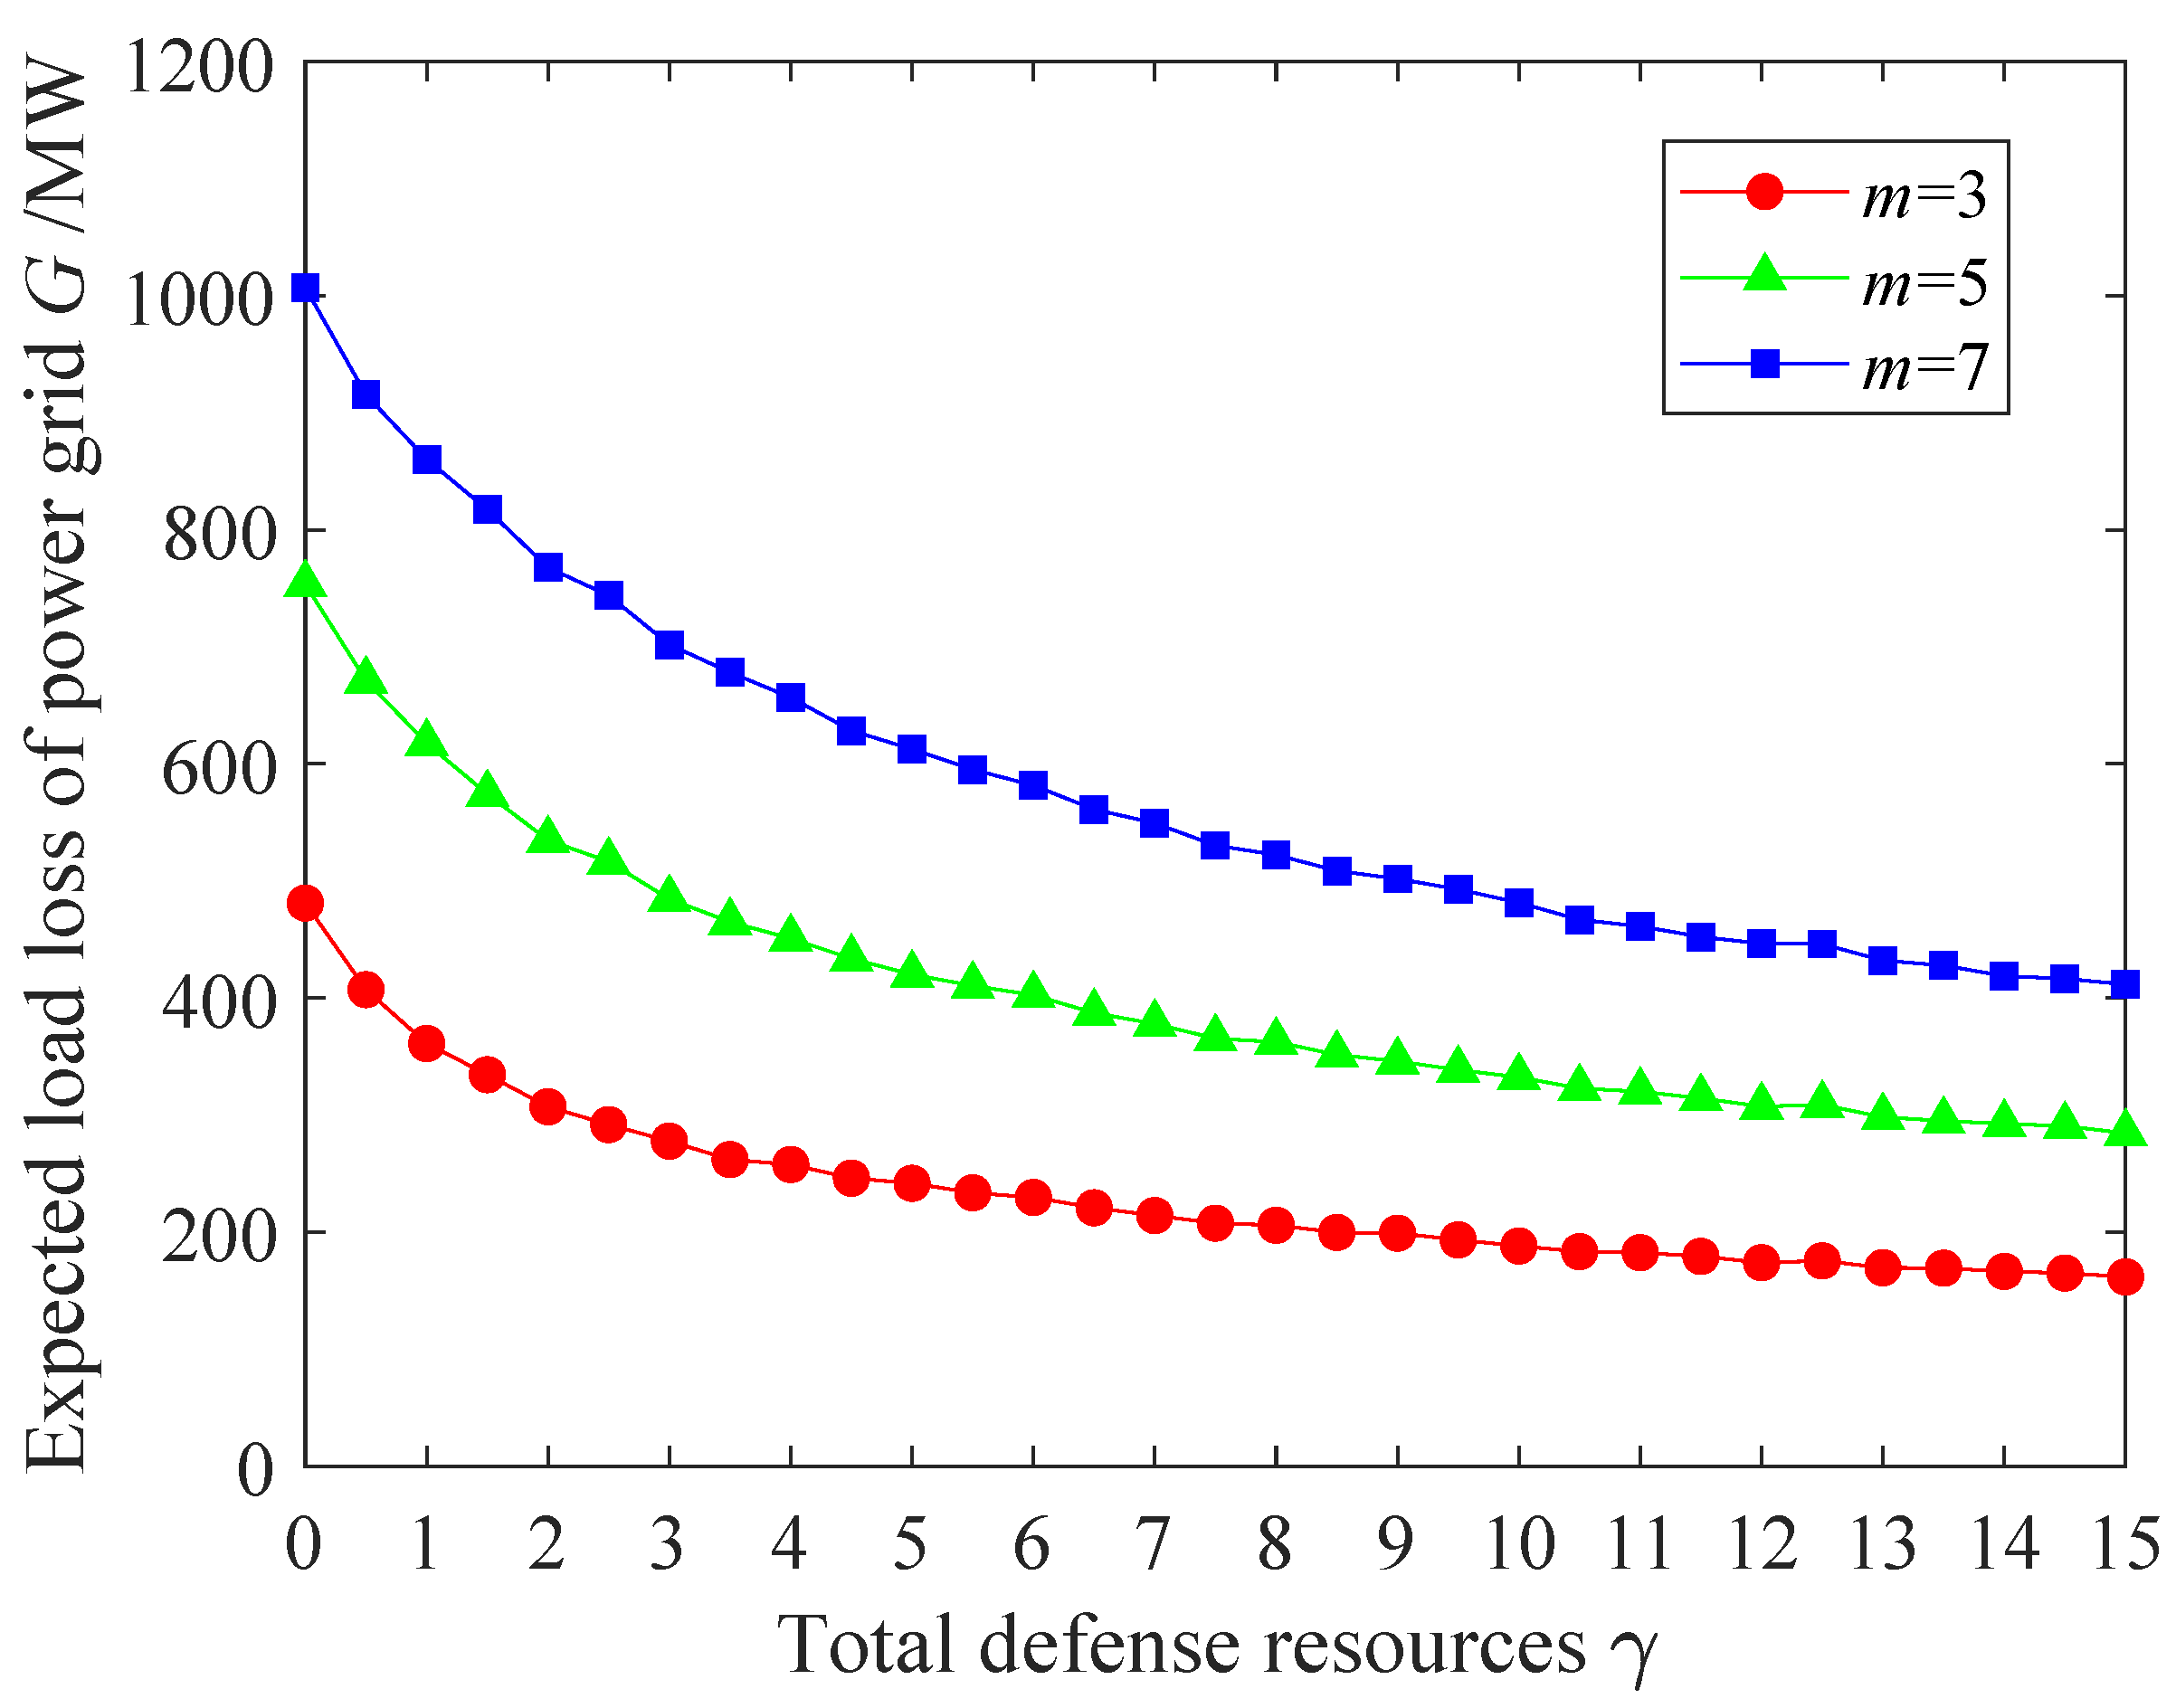
5.3.1. The Influence of Total Defense Resources and the Attack CE Number m on the Expected Loss of Load G in the Third Stage of the Game
The values of the numbers of main and backup communication channels and remained unchanged, and the effects of the total defense resources and the number of attacked CEs m on the expected loss of load G in the third stage of the game were studied.
Figure 4 shows the curve of the expected loss of load G in the third stage of the game as a function of the total defense resources when , . It can be seen from Figure 4 that, given the number m of attacked CEs and the number of main and backup channels searched in the third stage of the game, the expected load loss G in the third stage of the game will gradually decrease with an increase in the total defense resources . When is valued from 0 to 4.5, G rapidly decreases. When is valued from 4.5 to 10.5, the speed of G decrease slows down and approximates a linear decrease. When is greater than 10.5, the speed of G further slows down. For example, given , , and values of 0 and 4.5, the corresponding G values are 753.407 MW and 433.578 MW with a difference of 319.829 MW. However, when the values are 9.5, 10, and 10.5, the G values are 193.280 MW, 188.077 MW, and 183.229 MW with differences of 5.203 MW and 4.848 MW, and the difference decreases. The reasons for the analysis are as follows.
Figure 4.
The Influence of total defense resources on the expected loss of load G from the power grid when .
When the number of rounds of defense resource allocation is fixed, the number of total defense resources increases, and the number of defense resources allocated in each round increases. In the n round of allocation, the defense resource of the CE allocated with defense resources increases. After all defense resources have been allocated, the defense resources of each CE in the network remain unchanged or increase compared to the situation where the total number of defense resources is small. According to Equation (11), the more defense resources CE is allocated, the lower the probability of being attacked by a failure. Therefore, as the total amount of defense resources increases, the probability of each CE in the network being attacked and malfunctioning remains unchanged or decreases. According to Equation (12), the smaller the probability of CE being attacked by a fault, the smaller its corresponding expected loss of load is. According to Equation (5), the expected loss of load from the power grid is the sum of the expected losses of all CEs in the entire communication network, ultimately leading to a decrease in the expected loss of load G in the third stage of the game. Moreover, according to Equation (11), as increases, the speed at which decreases gradually slows down, resulting in the same slowing down of .Therefore, with the increase in the total number of defense resources , the expected loss of load G in the third stage of the game is gradually reduced, and the decrease in speed gradually reduces.
At the same time, according to Figure 4, given , and , with the increase in m, the expected loss of load G in the third stage of the game gradually increases. For example, given , and , when m takes values of 3, 5, and 7, the corresponding G values are 246.021 MW, 433.578 MW, and 628.392 MW, respectively. According to Section 4.2, as m increases, the number of CEs under attack increases, and the number of elements with a value of 1 in the attack matrix increases. According to Equation (33), if remains unchanged or increases, and the expected loss of load G in the third stage of the game obtained by summing k increases.
5.3.2. The Influence of the Number of Main and Backup Communication Channels and on the Expected Loss of Load G
The total amount of fixed defense resources and the number of attacked CEs m were used to study the impact of the numbers of main and backup communication channels and on the expected loss of load G in the third stage of the game.
Table 5 shows the expected loss of load G values in the third stage of the game under different and conditions when and . Compared to rows 2, 5, and 6 of Table 5, given , the larger the value of the number of main communication channels , the smaller the value of G. Compared to rows 2, 3, and 4 of Table 5, given , the larger the value of the number of backup communication channels , the smaller the value of G. The reasons for the analysis are as follows:
Table 5.
The expected loss of load G in the third stage of the game under different and values.
According to Section 4.3, as increases, the third stage of the game will search for more possible main and backup communication channels. At this point, the total number U of main and backup communication channels increases, and the solution space of Equation (29) is larger. It is possible to find a combination of main and backup communication channels that makes the G value smaller. Therefore, an increase in may lead to a decrease in the value of G. In an experiment, setting a larger will result in an equal or smaller G value compared to a smaller . Similarly, setting a larger will result in a smaller G value. Therefore, as or increases, the expected loss of load G in the third stage of the game decreases.
5.4. Comparative Research on Defense Resource Allocation Algorithms and Attack Strategies
The algorithm for allocating defense resources in the first stage of the game in this article is called the optimal allocation algorithm, and the attack strategy selected in the second stage is called the optimal attack strategy. The following section describes the study and analysis of the impact of optimal allocation algorithms and optimal attack strategies on the results of the game process. For convenience of description, the game scheme using the optimal allocation algorithm and optimal attack strategy is marked as Scheme A.
5.4.1. Research on the Optimal Allocation Algorithm in the First Stage of Game Theory
When allocating defense resources in the first stage of the game, the total amount of defense resources is divided equally according to the number of CEs M, and the divided defense resources are allocated to each CE through a process called the average allocation algorithm. The game scheme that uses the average allocation algorithm and the optimal attack strategy is Scheme B. Figure 5a shows the trend for the expected loss of load G in the third stage of the game with the total amount of defense resources when Scheme A and Scheme B are used, where and .
Figure 5.
Comparison of different schemes. (a) The influence of the total defense resources on the expected loss of load G from the power grid under different schemes. (b) The influence of the number of attacked CEs on the expected loss of load G from power networks under different schemes.
From the figure, it can be seen that under Scheme A and Scheme B, as the total amount of defense resources increases, the expected loss of load G of the power grid shows a downward trend, and its rate of decline tends to stabilize. When Scheme A is adopted, defense resources are evenly allocated to all CEs, and CEs with larger and smaller associated loads are allocated the same number of resources, resulting in the same probability of failure under attack. When Scheme B is adopted, CEs with a larger associated load are allocated a greater number of defense resources, resulting in a lower probability of failure. CEs with a smaller associated load are allocated fewer resources, resulting in a higher probability of failure during attacks. Therefore, according to Equation (33), when the optimal attack strategy is adopted in the second stage, Scheme A has a small expected loss of load, and the optimal allocation algorithm can effectively reduce the expected loss of load.
5.4.2. Research and Analysis of the Optimal Attack Strategy in the Second Stage of Game Theory
To analyze the impact of the optimal attack strategy on the outcome of the game process, a random attack strategy was used for comparison. The random attack strategy randomly selects m CEs from all CEs in the communication network for attack. The scheme that uses the optimal allocation algorithm and random attack strategy is Scheme C. By comparing the game process results using Scheme A and Scheme C, we analyzed the impact of the optimal attack strategy on the game process results.
Given and , the attack strategy was changed to select the number of CE attacks m, and the impacts of different attack strategies in the second stage of the game on the expected loss of load G in the third stage were studied. Figure 5b shows the trend for the mean expected loss of load G in the third stage of the game with a change in m when Scheme A and Scheme C are used. Each mean is the average of 200 Monte Carlo experiments.
From Figure 5b, it can be seen that as the number of attacked CEs increases, the expected loss of load G in the third stage of the game between Scheme A and Scheme C shows an increasing trend, and the trend is approximately linear, but the G value of Scheme A is always greater than that of Scheme C. This is because the optimal attack strategy will search for important CEs in the communication network to attack, thus obtaining the maximum attack benefit, i.e., the maximum expected loss of load G. Therefore, adopting the optimal attack strategy can be used to study the defense strategies of the power grid when important CEs in the power communication network are attacked to varying degrees.
6. Conclusions
In response to the situation of CE failures caused by maintenance and natural factors in the CPPS, this paper established a dual-network coupling CPPS model, defined the communication-side-associated load based on load shedding and the expected load loss from the power grid, and established the correlation relationship between the communication network and the power grid. On this basis, the game theory method was applied to analyze the actual power system regulation process, and a three-stage zero-sum game mechanism with complete information considering CE faults was proposed. The regulation process of the CPPS during a CE attack was simulated, and the optimal strategies for both the attack and defense sides were studied. When a CE is attacked or repaired, the expected load loss from the power grid is reduced and the stability of the CPPS improves. Specifically, in a single game model simulation, the expected loss of load from the power grid decreased by 41.972% when using some of the actual power communication networks in Shandong Province as the topology. In multiple Monte Carlo experiments, when five CEs were attacked and the total defense resource value was 4.5, compared to the situation without defense resources, the expected loss of load from the power grid decreased by 42.451%. When adjusting the possible main communication channels in the third stage of the game from 2 to 4, the expected load loss of the power grid also decreased by 21.493%.
With the continuous acceleration of the construction speed of the power communication network, the number and types of communication equipment have increased, and the network structure has become increasingly complex, continuously increasing the pressure on communication maintenance to strengthen security risk prevention and control. The game strategy studied in this article can provide a theoretical and experimental basis for the risk assessment of communication maintenance, enabling power communication maintenance to ensure the safe and effective operation of power communication networks and various LCSs. It can improve the security and stability of power systems with an increasing number of IoT devices.
Author Contributions
Methodology, G.Z.; Software, Q.Y.; Investigation, S.X.; Resources, P.M.; Data curation, S.Q.; Visualization, Y.Z.; Supervision, G.H. All authors have read and agreed to the published version of the manuscript.
Funding
The work was supported by the Science and Technology project of State Grid Corporation of China (Research on Dispatching Fusion Communication Oriented to Power Communication Network and Its Cooperative Control with Power Network Operation, 52060022001B).
Data Availability Statement
Not applicable.
Conflicts of Interest
The authors declare no conflict of interest.
References
- Yohanandhan, R.V.; Elavarasan, R.M.; Manoharan, P.; Mihet-Popa, L. Cyber-Physical Power System (CPPS): A Review on Modeling, Simulation, and Analysis With Cyber Security Applications. IEEE Access 2020, 8, 151019–151064. [Google Scholar] [CrossRef]
- Guo, J.; Wang, Y.; Guo, C.; Dong, S.; Wen, B. Cyber-Physical Power System (CPPS) reliability assessment considering cyber attacks against monitoring functions. In Proceedings of the 2016 IEEE Power and Energy Society General Meeting (PESGM), Boston, MA, USA, 17–21 July 2016; pp. 1–5. [Google Scholar]
- Zhang, D.; Li, X.; Zhou, L.; Li, H.; Shi, H.; Gao, F. The Control Strategy for Power CPS Microgrid under Network Attack. In Proceedings of the 2022 4th Asia Energy and Electrical Engineering Symposium (AEEES), Chengdu, China, 25–28 March 2022; pp. 161–165. [Google Scholar]
- Xin, S.; Guo, Q.; Sun, H.; Zhang, B.; Wang, J.; Chen, C. Cyber-Physical Modeling and Cyber-Contingency Assessment of Hierarchical Control Systems. IEEE Trans. Smart Grid 2015, 6, 2375–2385. [Google Scholar] [CrossRef]
- Cordova-Garcia, J.; Wang, X.; Xie, D.; Zhao, Y.; Zuo, L. Control of Communications-Dependent Cascading Failures in Power Grids. IEEE Trans. Smart Grid 2019, 10, 5021–5031. [Google Scholar] [CrossRef]
- Wang, Z.; Chen, G.; Liu, L.; Hill, D.J. Cascading risk assessment in power-communication interdependent networks. Phys. A Stat. Mech. Its Appl. 2020, 540, 120496. [Google Scholar] [CrossRef]
- Zhao, Z.; Zhou, T.; Wang, Q.; Gao, W.; Zhou, Z. Research on Modeling and Simulation of CPPS and Its Cascading Failure Mechanism. In Proceedings of the 2021 IEEE 12th International Conference on Software Engineering and Service Science (ICSESS), Beijing, China, 20–22 August 2021; pp. 42–47. [Google Scholar]
- Yu, C.; Zhang, L.; Sun, S.; Sun, Y.; Yin, X.; Wang, C. Cascading Failure Propagation in Cyber Physical Power Systems under Extreme Weather Events. In Proceedings of the 2022 4th International Conference on Smart Power & Internet Energy Systems (SPIES), Beijing, China, 9–12 December 2022; pp. 1486–1490. [Google Scholar]
- Nazari, M.H.; Wang, L.Y.; Grijalva, S.; Egerstedt, M. Communication-Failure-Resilient Distributed Frequency Control in Smart Grids: Part I: Architecture and Distributed Algorithms. IEEE Trans. Power Syst. 2020, 35, 1317–1326. [Google Scholar] [CrossRef]
- Zhou, X.; Ning, L.; Wang, B.; Yang, C.; Sun, H.; Liu, Y. An Industrial Park Load Shedding Scheme Based on Smart Contract. In Proceedings of the 2022 IEEE 6th Conference on Energy Internet and Energy System Integration (EI2), Chengdu, China, 11–13 November 2022; pp. 1811–1816. [Google Scholar]
- Zhu, X.; Li, Z.; Jia, Y.; Tang, X.; Dou, F.; Wang, Q. Study on Low Voltage Precise Load Shedding Measures in Receiving-side Power Grid Considering Source-Grid-Load Coordination. In Proceedings of the 2022 China International Conference on Electricity Distribution (CICED), Changsha, China, 7–8 September 2022; pp. 1613–1618. [Google Scholar]
- Lv, J.; Liu, Y.; Gao, K.; Wang, J.; Guo, X.; Yu, X.; Zhao, Y.; Zhang, J. Service Awareness Recovery under N-1 Failure in Power Grid Optical Communication Networks. In Proceedings of the 2021 IEEE 4th International Conference on Automation, Electronics and Electrical Engineering (AUTEEE), Shenyang, China, 19–21 November 2021; pp. 303–306. [Google Scholar]
- Guo, Y.; Xu, M. Research on reliability evaluation model and path optimization for power communication network. In Proceedings of the 2015 5th International Conference on Electric Utility Deregulation and Restructuring and Power Technologies (DRPT), Changsha, China, 26–29 November 2015; pp. 2495–2500. [Google Scholar]
- Sun, W.; Zhu, Y.; Li, L.; Qian, Y. On Route Design with Ant Colony Optimization Algorithm for Power Line Communication Network. In Proceedings of the 2020 IEEE International Conference on Advances in Electrical Engineering and Computer Applications (AEECA), Dalian, China, 25–27 August 2020; pp. 799–802. [Google Scholar]
- Arbab-Zavar, B.; Sharkh, S.M.; Palacios-Garcia, E.J.; Vasquez, J.C.; Guerrero, J.M. Reducing Detrimental Communication Failure Impacts in Microgrids by Using Deep Learning Techniques. Sensors 2022, 22, 6006. [Google Scholar] [CrossRef] [PubMed]
- Dagle, J. Data management issues associated with the August 14, 2003 blackout investigation. In Proceedings of the IEEE Power Engineering Society General Meeting, Denver, CO, USA, 6–10 June 2004; Volume 2, pp. 1680–1684. [Google Scholar]
- Shi, Z.; Zeng, Y.; Sun, L.q. Operation and maintenance analysis for power communication networks based on big data. In Proceedings of the 2016 China International Conference on Electricity Distribution (CICED), Xi’an, China, 10–13 August 2016; pp. 1–4. [Google Scholar]
- Zhu, L.; Xu, M.; Zhou, A.; Qiao, J. Metadata modeling and management for power communication network operation and maintenance. In Proceedings of the 2022 IEEE 10th Joint International Information Technology and Artificial Intelligence Conference (ITAIC), Chongqing, China, 17–19 June 2022; Volume 10, pp. 1947–1951. [Google Scholar]
- Lovrenčić, V.; Ribič, P.; Ogrizek, P.; Lušin, M.; Lovrenčič, A. Safe Work in The Vicinity of Live Parts on High Voltage Double-Circuit Overhead Lines. In Proceedings of the 2022 13th International Conference on Live Maintenance (ICOLIM), Turin, Italy, 15–17 June 2022; pp. 1–6. [Google Scholar]
- Xiao, B.; Liu, K.; Wu, T.; Liu, T.; Peng, Y.; Lei, X.; Su, Z.; Tang, P. Experimental research on minimum approach distances and complex gaps for live working in substation. In Proceedings of the 2015 5th International Conference on Electric Utility Deregulation and Restructuring and Power Technologies (DRPT), Changsha, China, 26–29 November 2015; pp. 1595–1599. [Google Scholar]
- Dong, W.; Liu, X.; He, X. Evaluation index system of electric power SD-OTN service riskfactors. In Proceedings of the 2017 16th International Conference on Optical Communications and Networks (ICOCN), Wuzhen, China, 7–10 August 2017; pp. 1–3. [Google Scholar]
- Ma, L.; Li, D.; Nan, D.; He, L. Troubleshooting and Maintenance of SDH Optical Transmission System. In Proceedings of the 2022 IEEE 6th Information Technology and Mechatronics Engineering Conference (ITOEC), Chongqing, China, 4–6 March 2022; Volume 6, pp. 1629–1632. [Google Scholar]
- Yuan, H.; Zhu, G.; Xu, J.; Dong, L.; Dai, D.; Zheng, L. Research on power system line vulnerability analysis and quantitative assessment under blind attack. In Proceedings of the 2021 13th International Conference on Measuring Technology and Mechatronics Automation (ICMTMA), Beihai, China, 16–17 January 2021; pp. 244–250. [Google Scholar]
- Fragkos, G.; Johnson, J.; Tsiropoulou, E.E. Centralized and Decentralized Distributed Energy Resource Access Control Implementation Considerations. Energies 2022, 15, 6375. [Google Scholar] [CrossRef]
- Mondal, A.; Misra, S. Game-theoretic green electric vehicle energy networks management in smart grid. In Proceedings of the 2015 IEEE International Conference on Advanced Networks and Telecommuncations Systems (ANTS), Kolkata, India, 15–18 December 2015; pp. 1–6. [Google Scholar]
- Yang, Y.; Liu, W.; Zhou, J.; Zhou, J.; Zhang, J. Non-cooperative-game-based Multi-agent Collaborative Planning Method for Distributed Generations. In Proceedings of the 2020 IEEE 4th Conference on Energy Internet and Energy System Integration (EI2), Wuhan, China, 30 October–1 November 2020; pp. 273–278. [Google Scholar]
- Que, L.; Jiang, X.; Wang, B.; Jin, X.; Cai, Z.; Shi, L.; Lyn, Q. Virtual Power Plant Adjustable Resource Aggregation Adjustment Optimization Strategy Based on Multi-agent Game. In Proceedings of the 2021 International Conference on Networking, Communications and Information Technology (NetCIT), Manchester, UK, 26–27 December 2021; pp. 285–290. [Google Scholar]
Disclaimer/Publisher’s Note: The statements, opinions and data contained in all publications are solely those of the individual author(s) and contributor(s) and not of MDPI and/or the editor(s). MDPI and/or the editor(s) disclaim responsibility for any injury to people or property resulting from any ideas, methods, instructions or products referred to in the content. |
© 2023 by the authors. Licensee MDPI, Basel, Switzerland. This article is an open access article distributed under the terms and conditions of the Creative Commons Attribution (CC BY) license (https://creativecommons.org/licenses/by/4.0/).