
Emotion Analysis and Dialogue Breakdown Detection in Dialogue of Chat Systems Based on Deep Neural Networks


Abstract
1. Introduction
- S: “Where did you buy those clothes?”
- U: “I bought them at the ** department store. They are my favorite.”
- S: “They look cheap.”
- O: Not a breakdown: it is easy to continue the conversation.
- T: Possible breakdown: it is difficult to continue the conversation smoothly.
- X: Breakdown: it is difficult to continue the conversation.
2. Related Works
2.1. Method of Dialogue Breakdown Detection
2.2. Emotion Recognition from Dialogue Text
2.3. Intention or Interaction Recognition in Dialogue
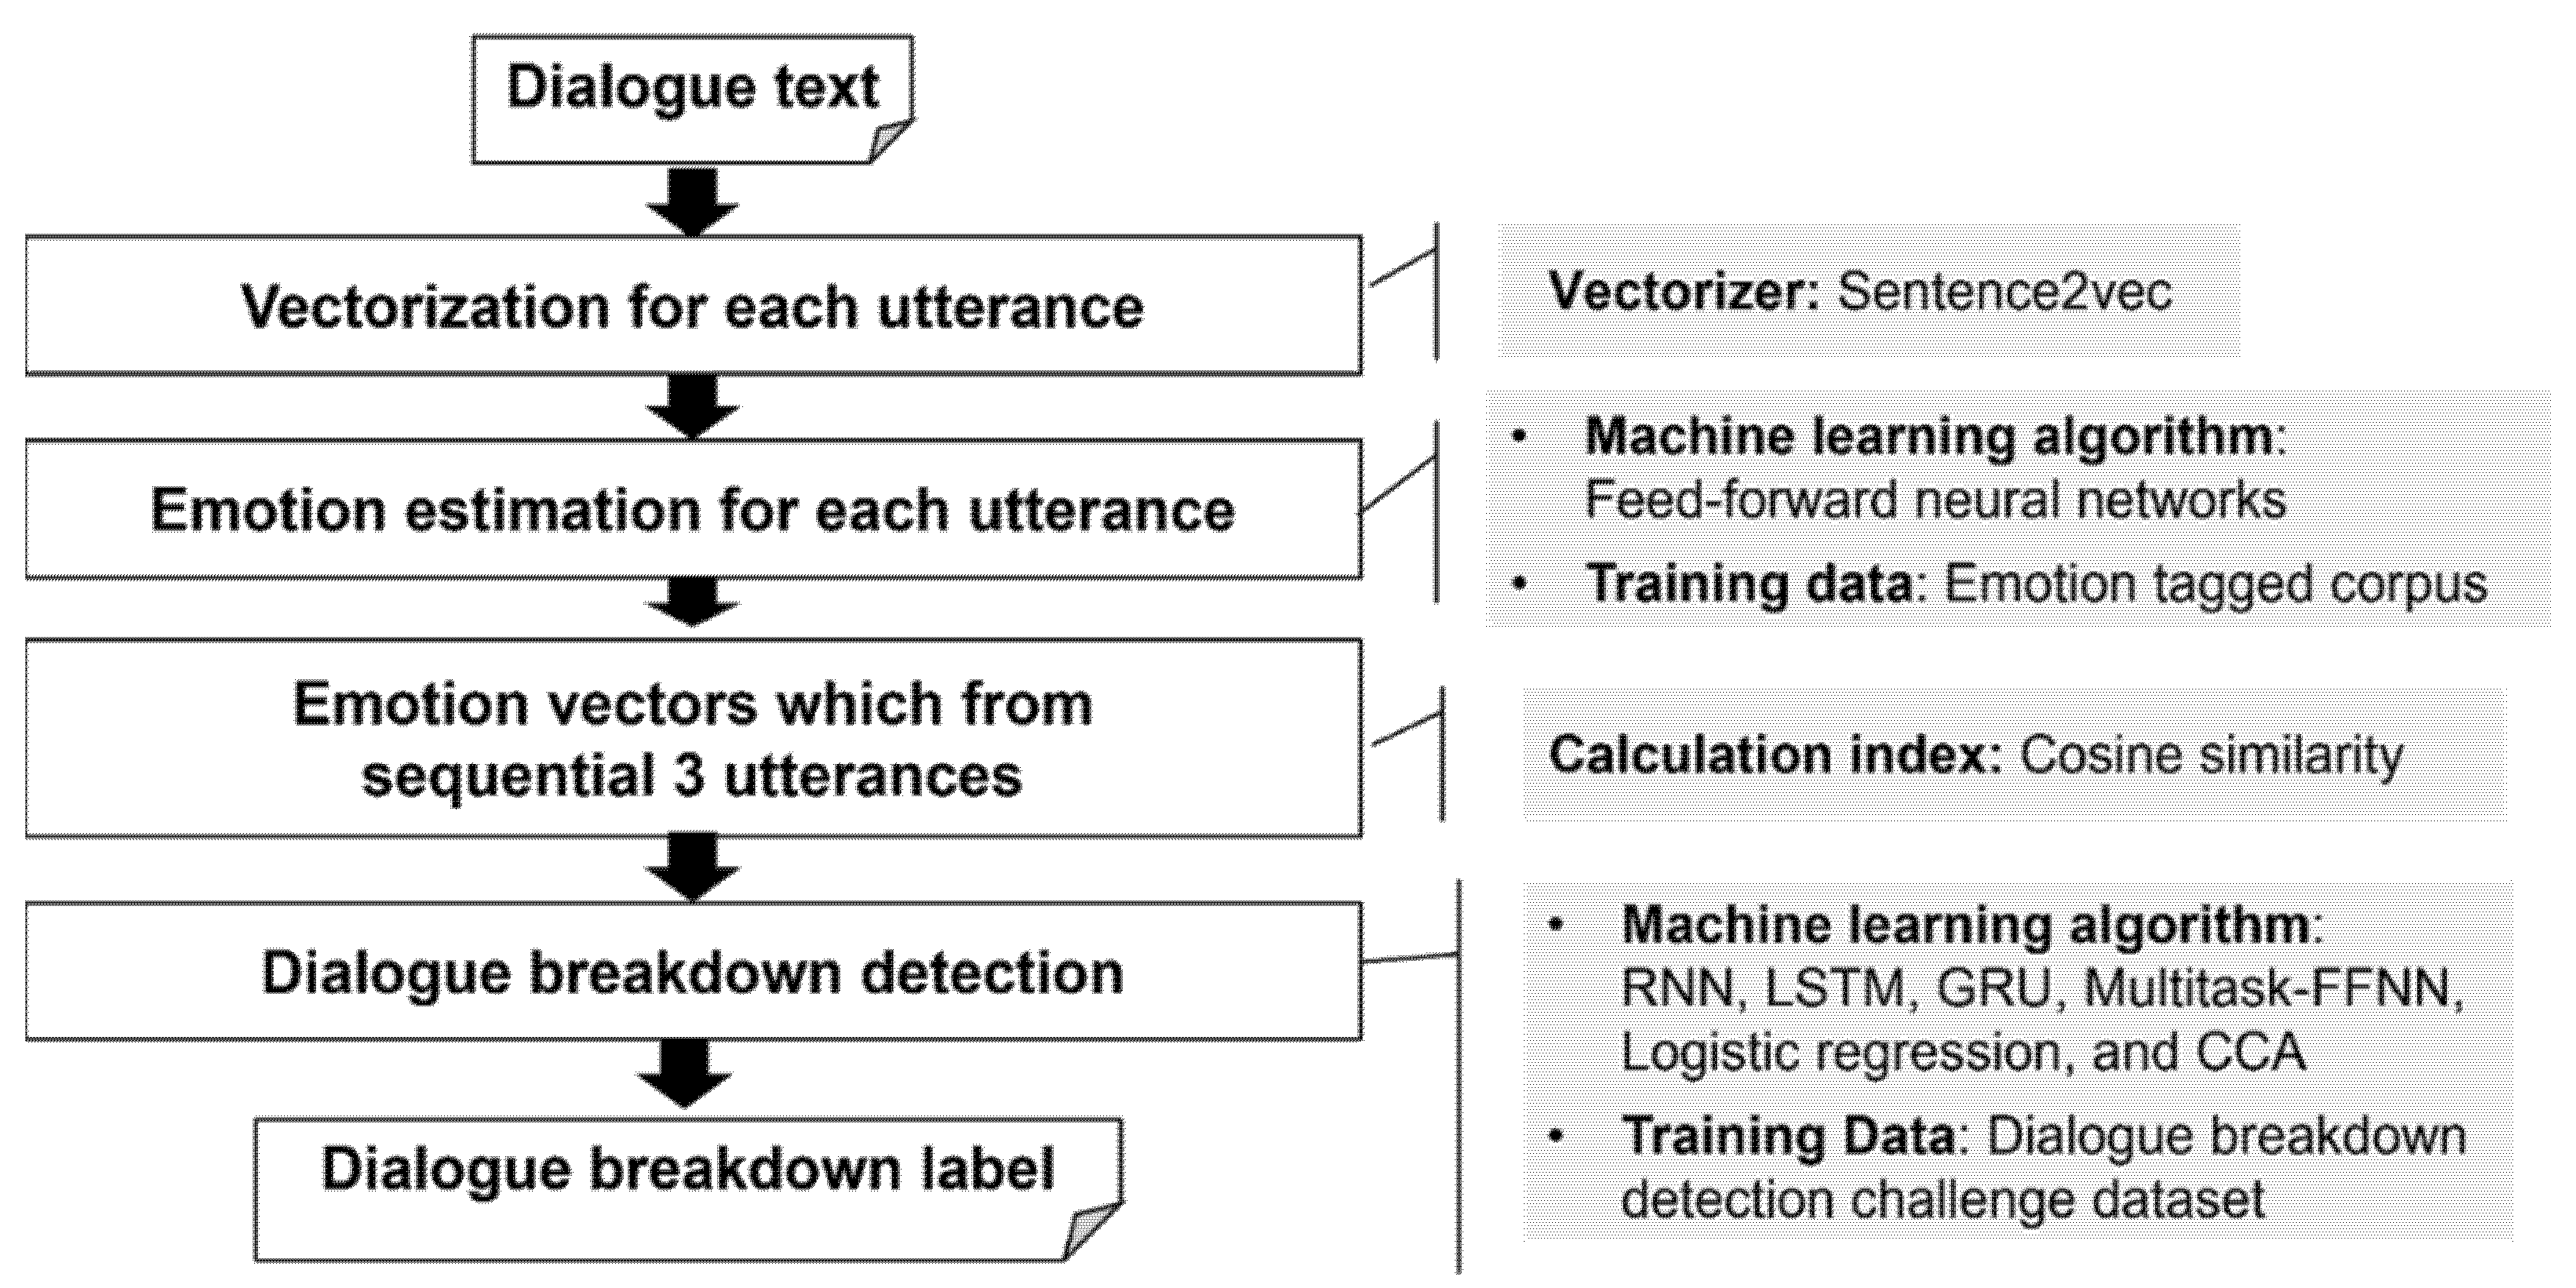
3. Proposed Method
3.1. Target Corpus
3.2. Emotion Estimation
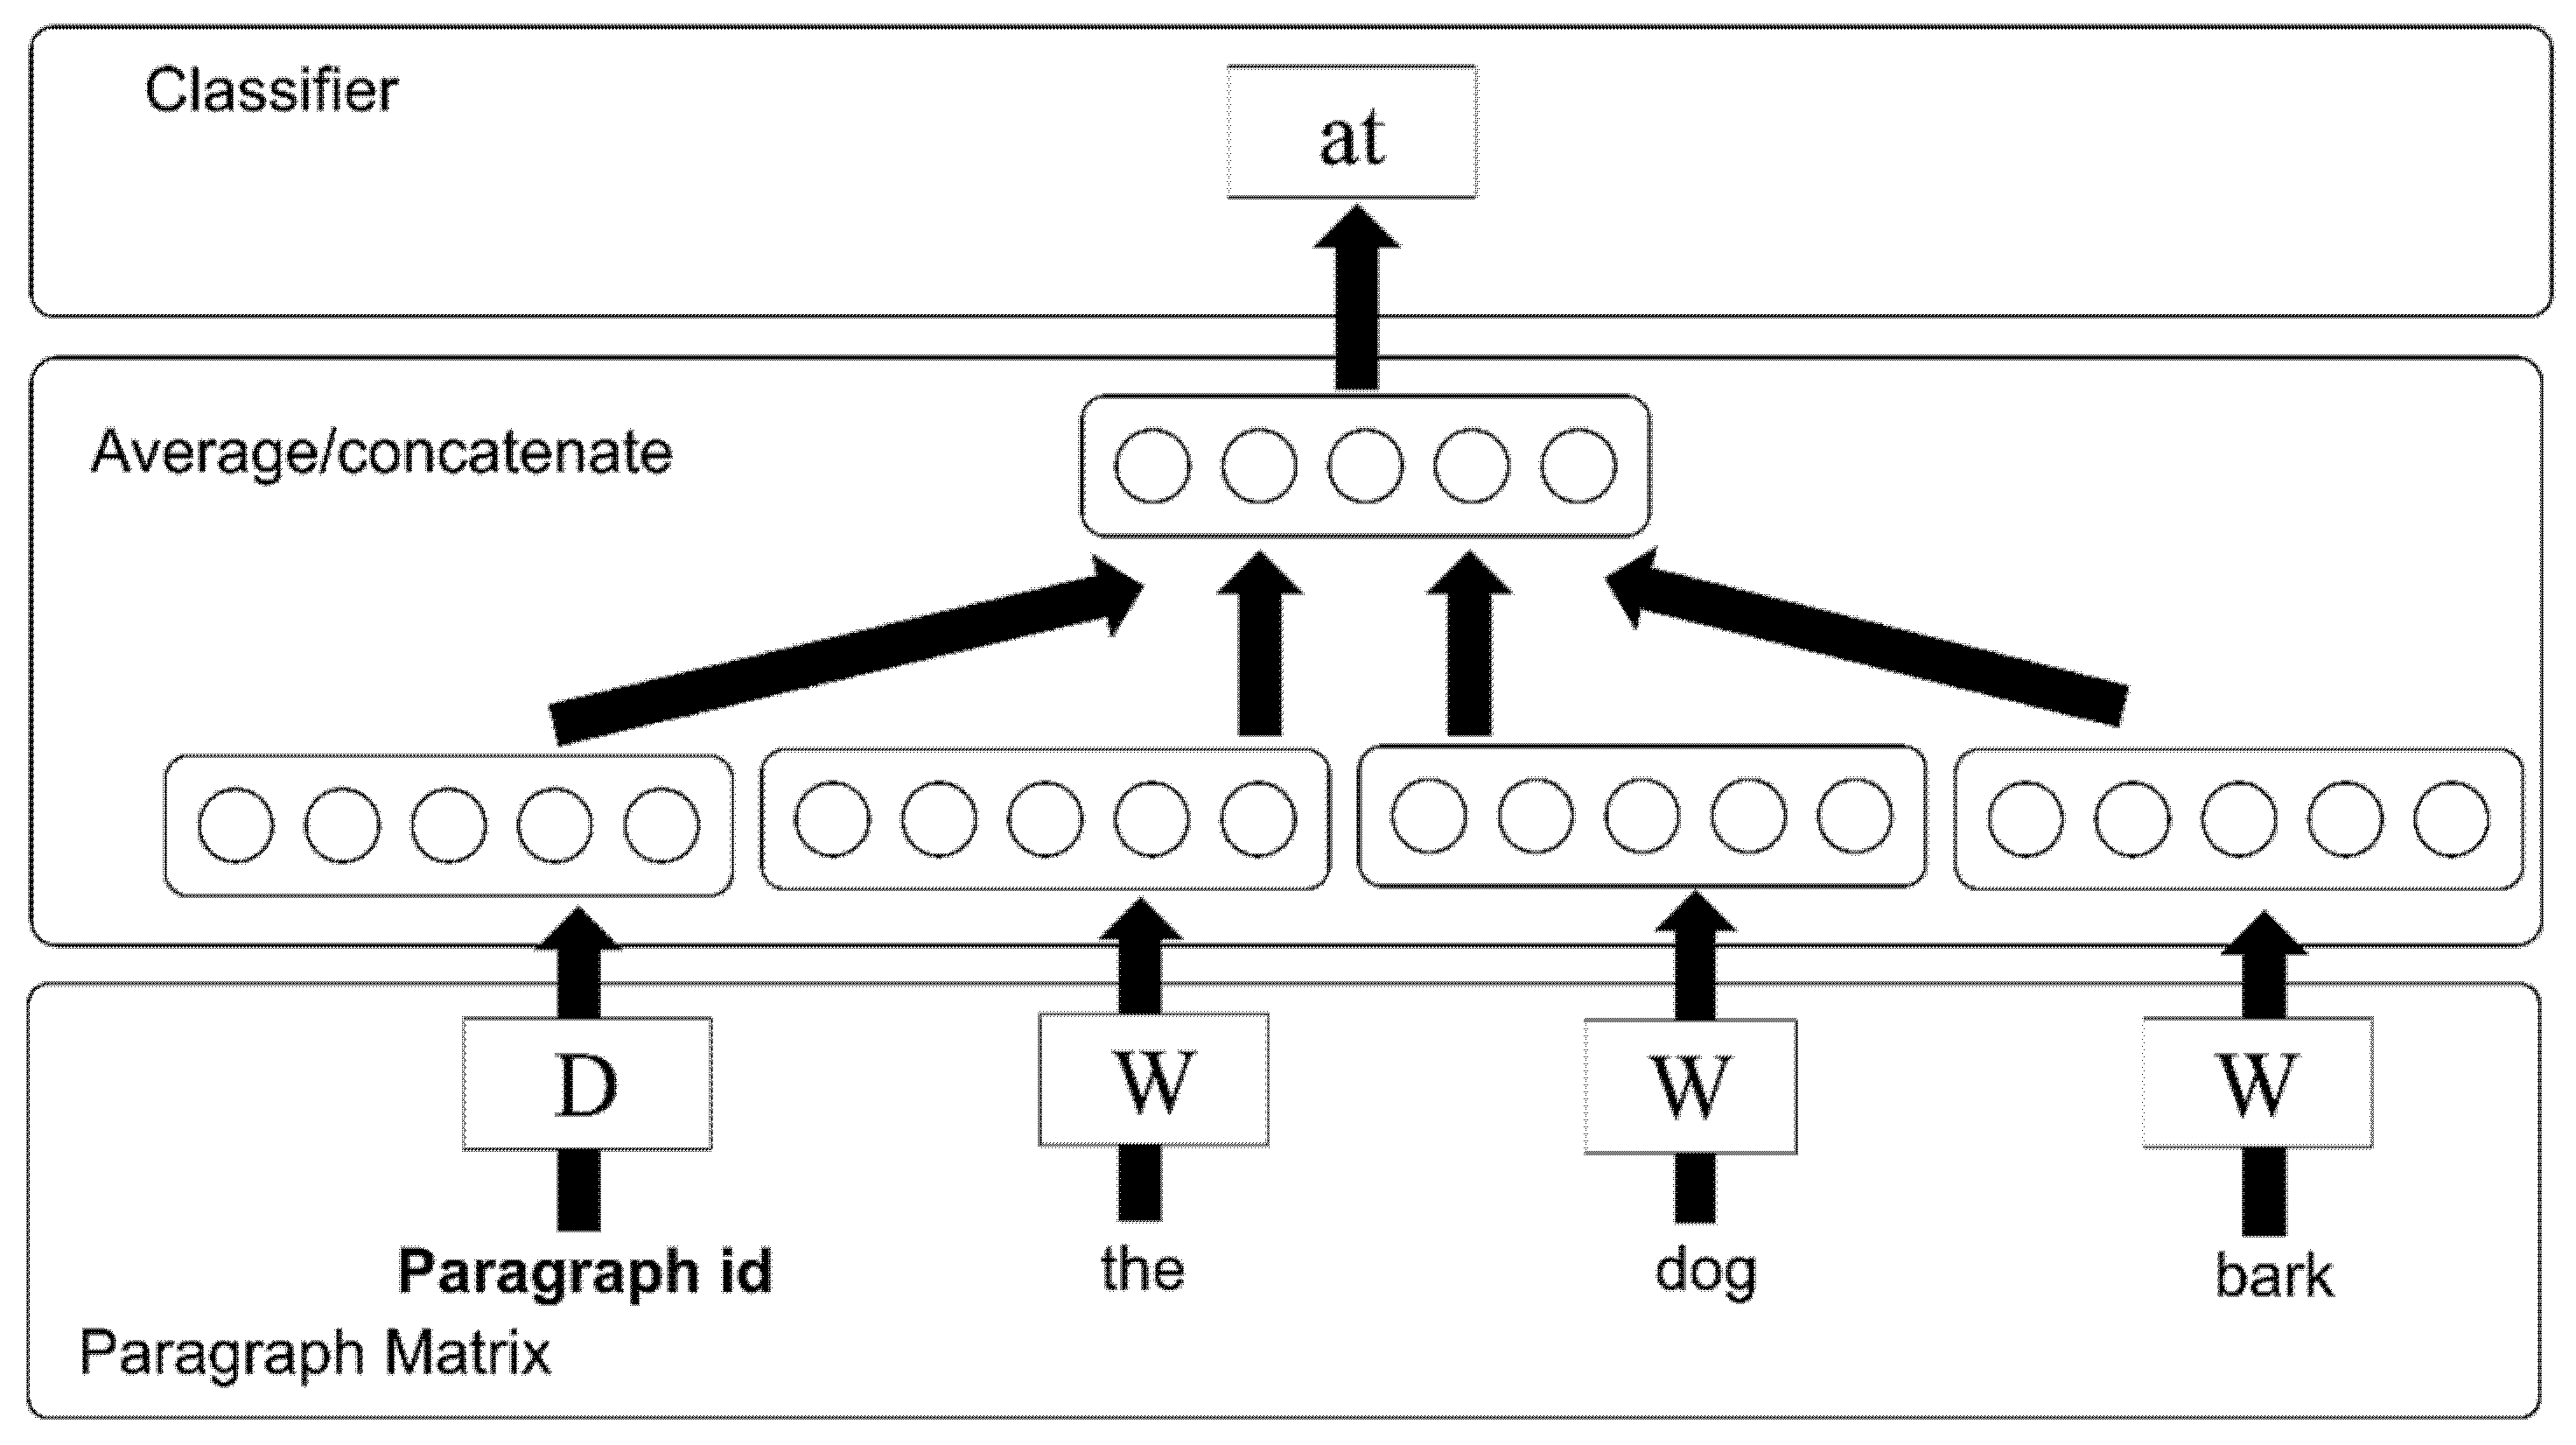
3.2.1. Sentence Embedding
3.2.2. Neural Networks
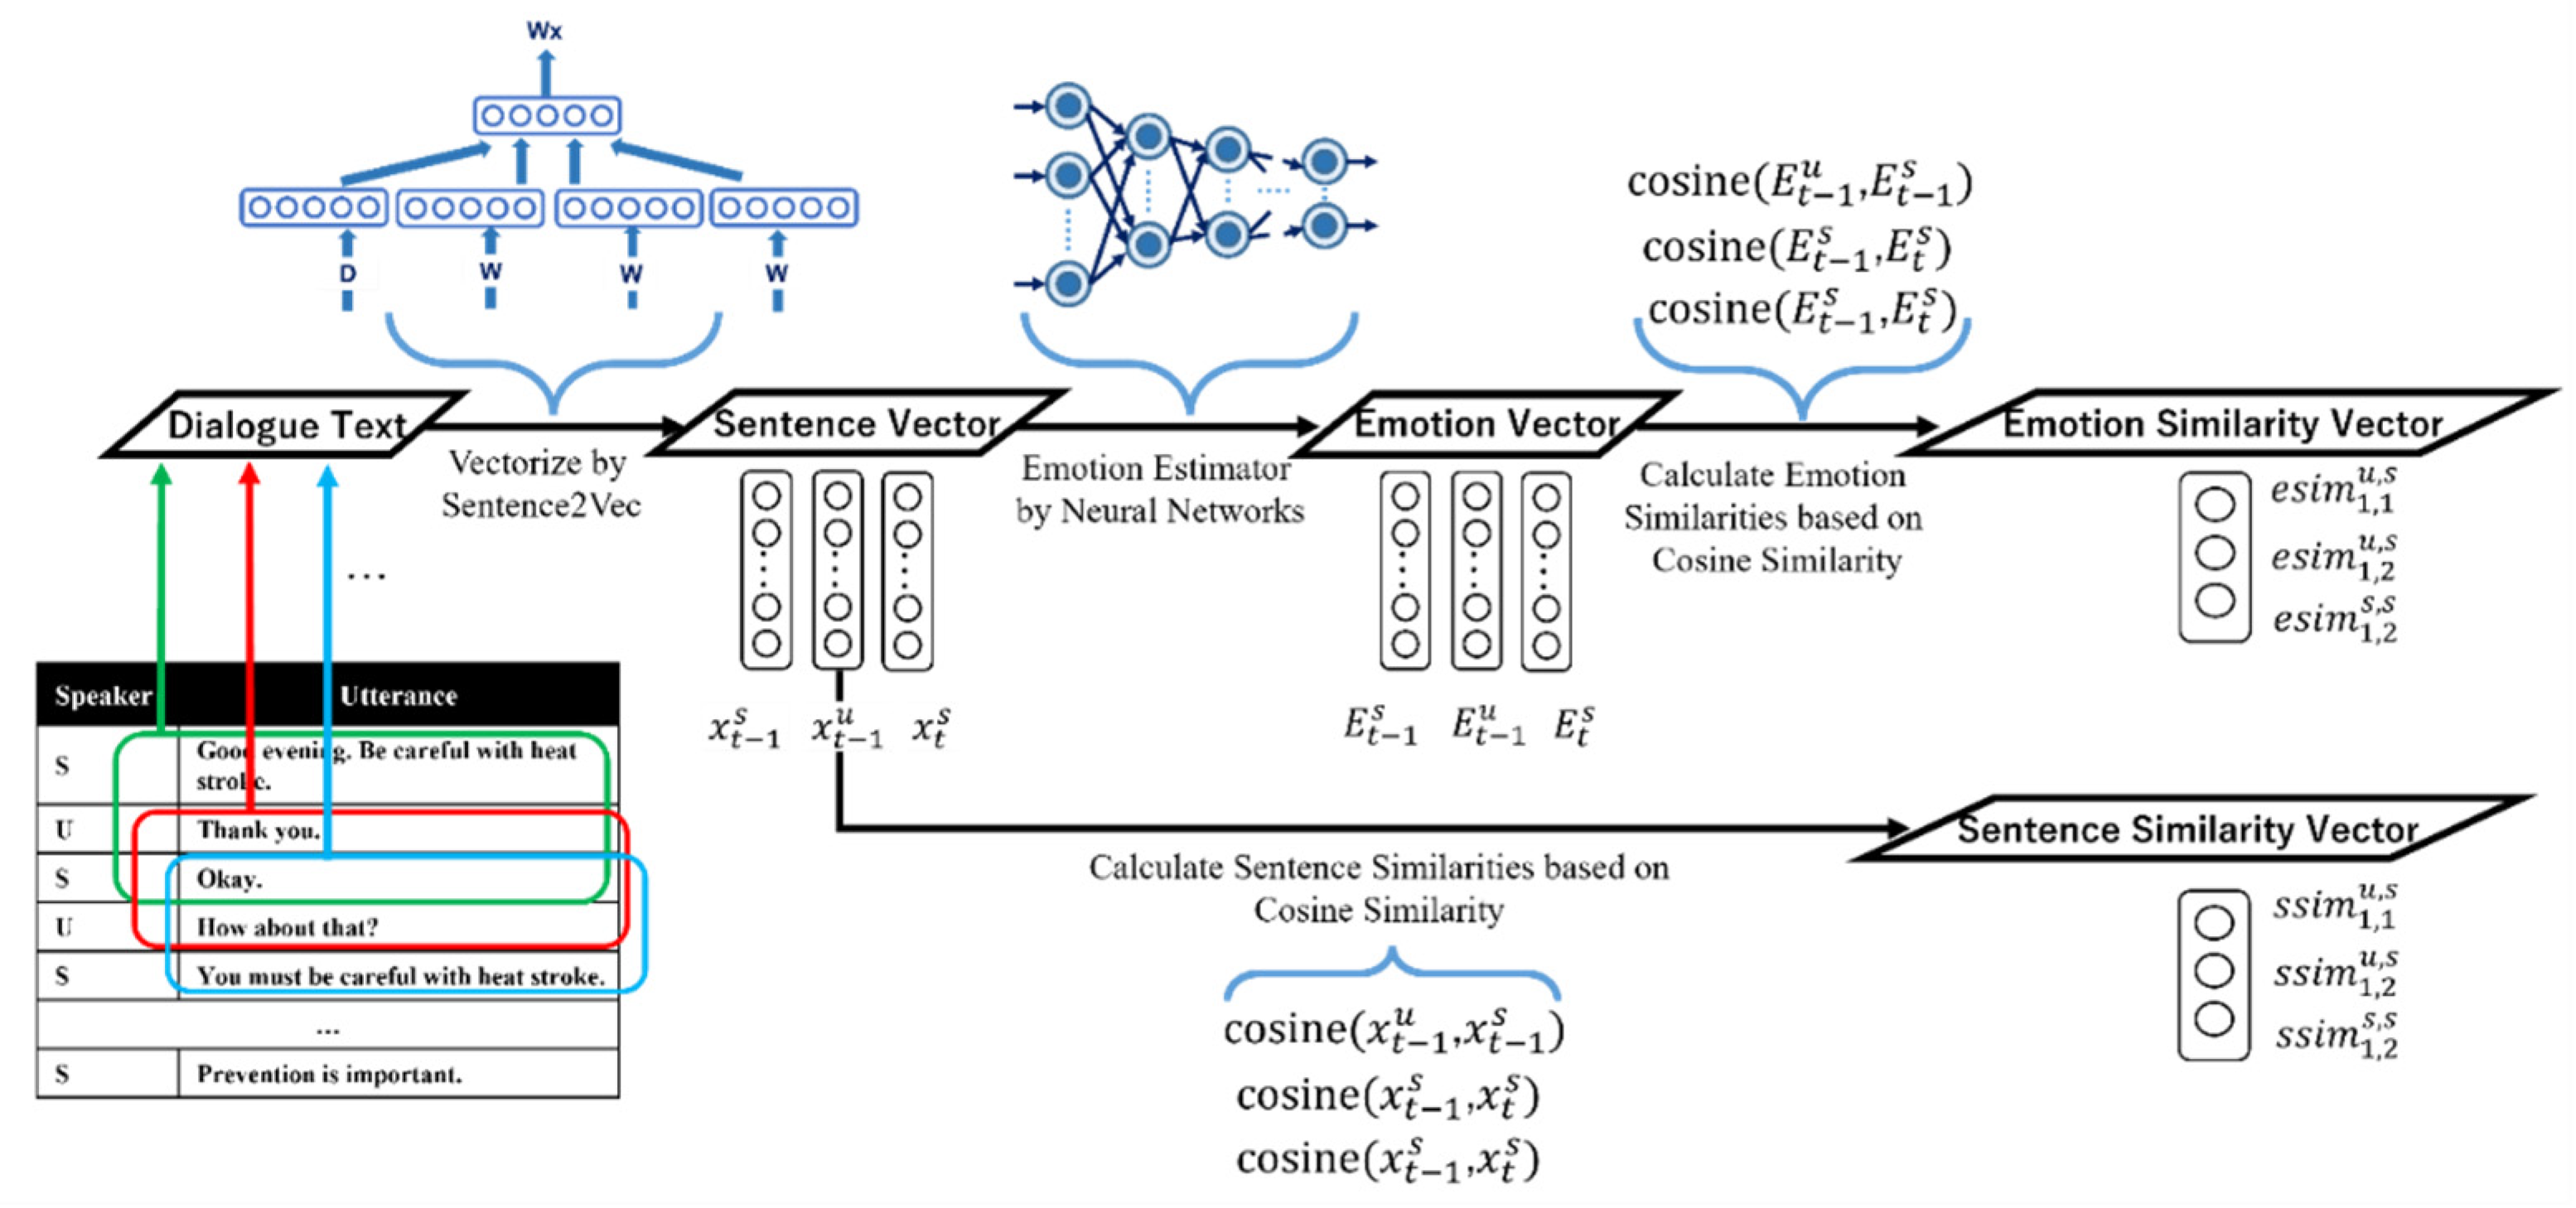
3.3. Extraction of Similarity Pattern Feature
- Similarity between the emotion () present in the latest utterance of the user and the emotion () generated in the current system response.
- Similarity between the emotion () present in the latest response by the system and the emotion () generated in the current system response.
- Similarity between the emotions and .
- Similarity between the sentence distributed representation () that occurred in the latest user’s utterance and the sentence distributed representation () of the current system response utterance.
- Similarity between the sentence distributed representation () that occurred in the previous system response utterance and the sentence distributed representation () of the current system response utterance.
- Similarity between the sentence distributed representations and .
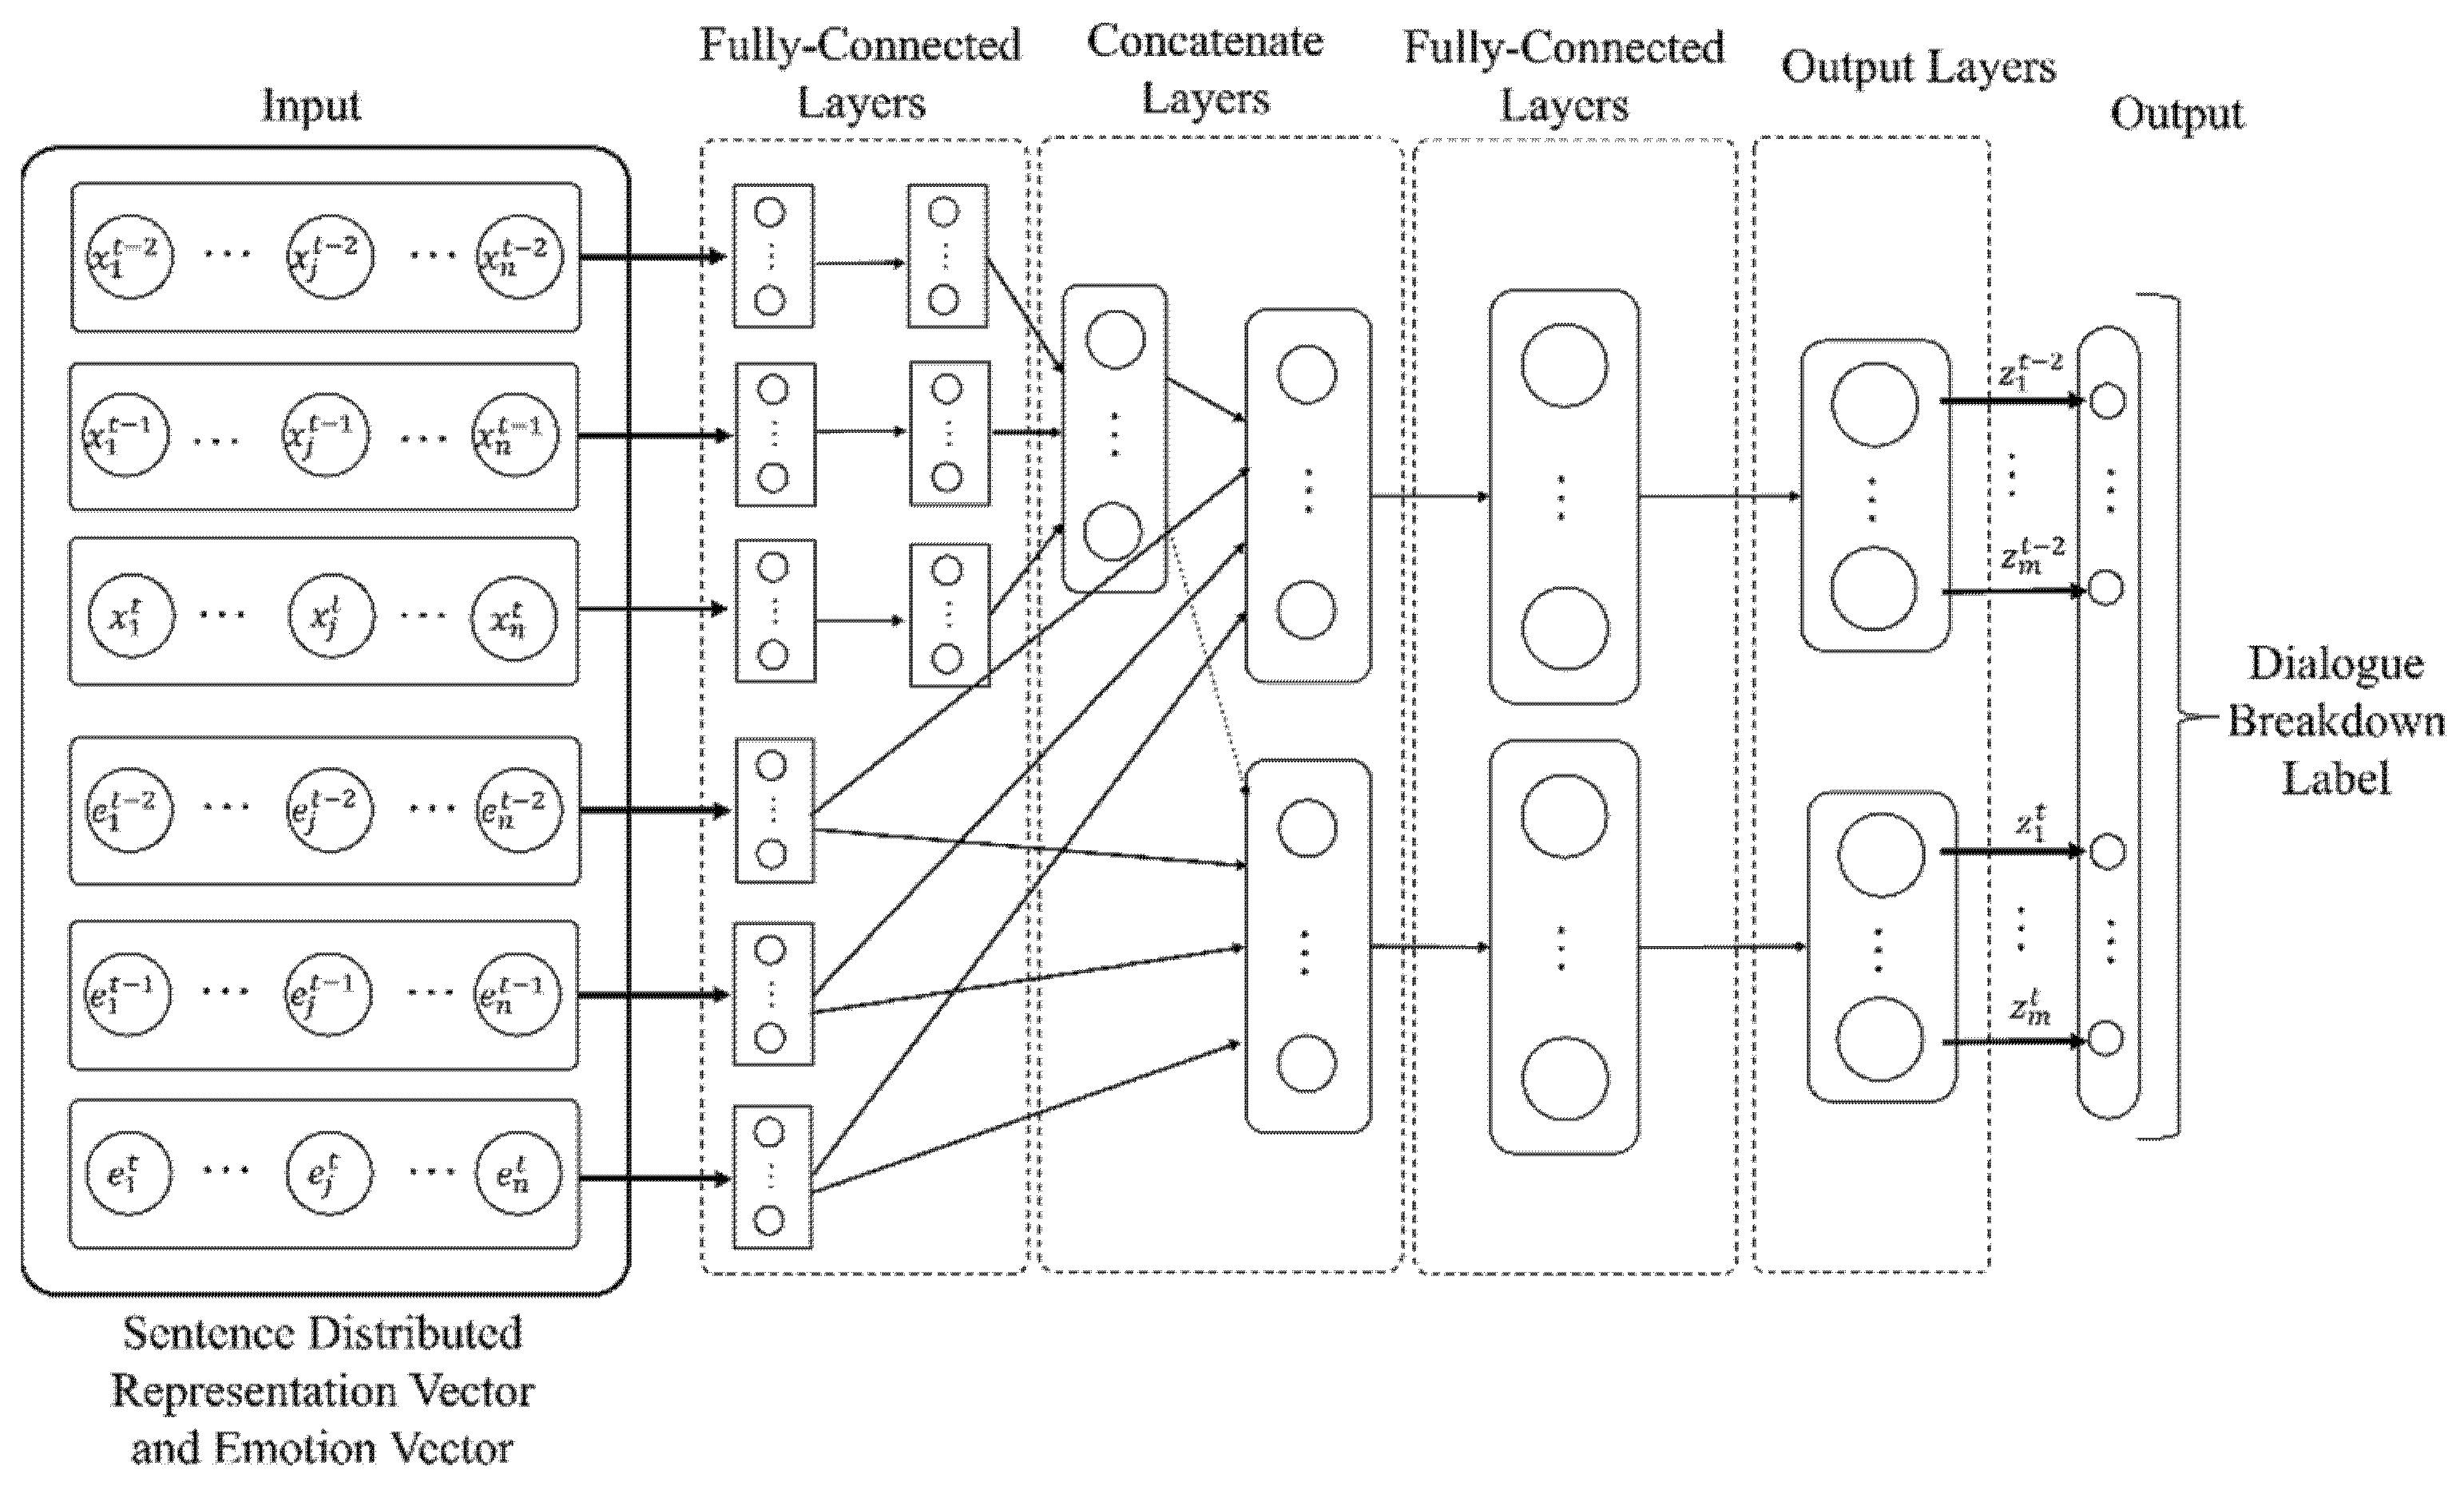
3.4. Estimation of Dialogue Breakdown Label
- Number of units of each layer
- Input layers: 500
- Middle Layers-1: 300, Middle Layers-2: 100
- Output Layers: 2 × 2 (binary) or 3 × 2 (three-valued)
- Dropout rate:
- Middle Layers-1: 0.4, Middle Layers-2: 0.1
- Activation function: softplus (Middle Layers-1, and 2), softmax (Output layers)
- Kernel initializer: Glorot’s uniform
- Batch size: 1024
- Epochs: 200
3.4.1. Canonical Correlation Analysis
3.4.2. Logistic Regression
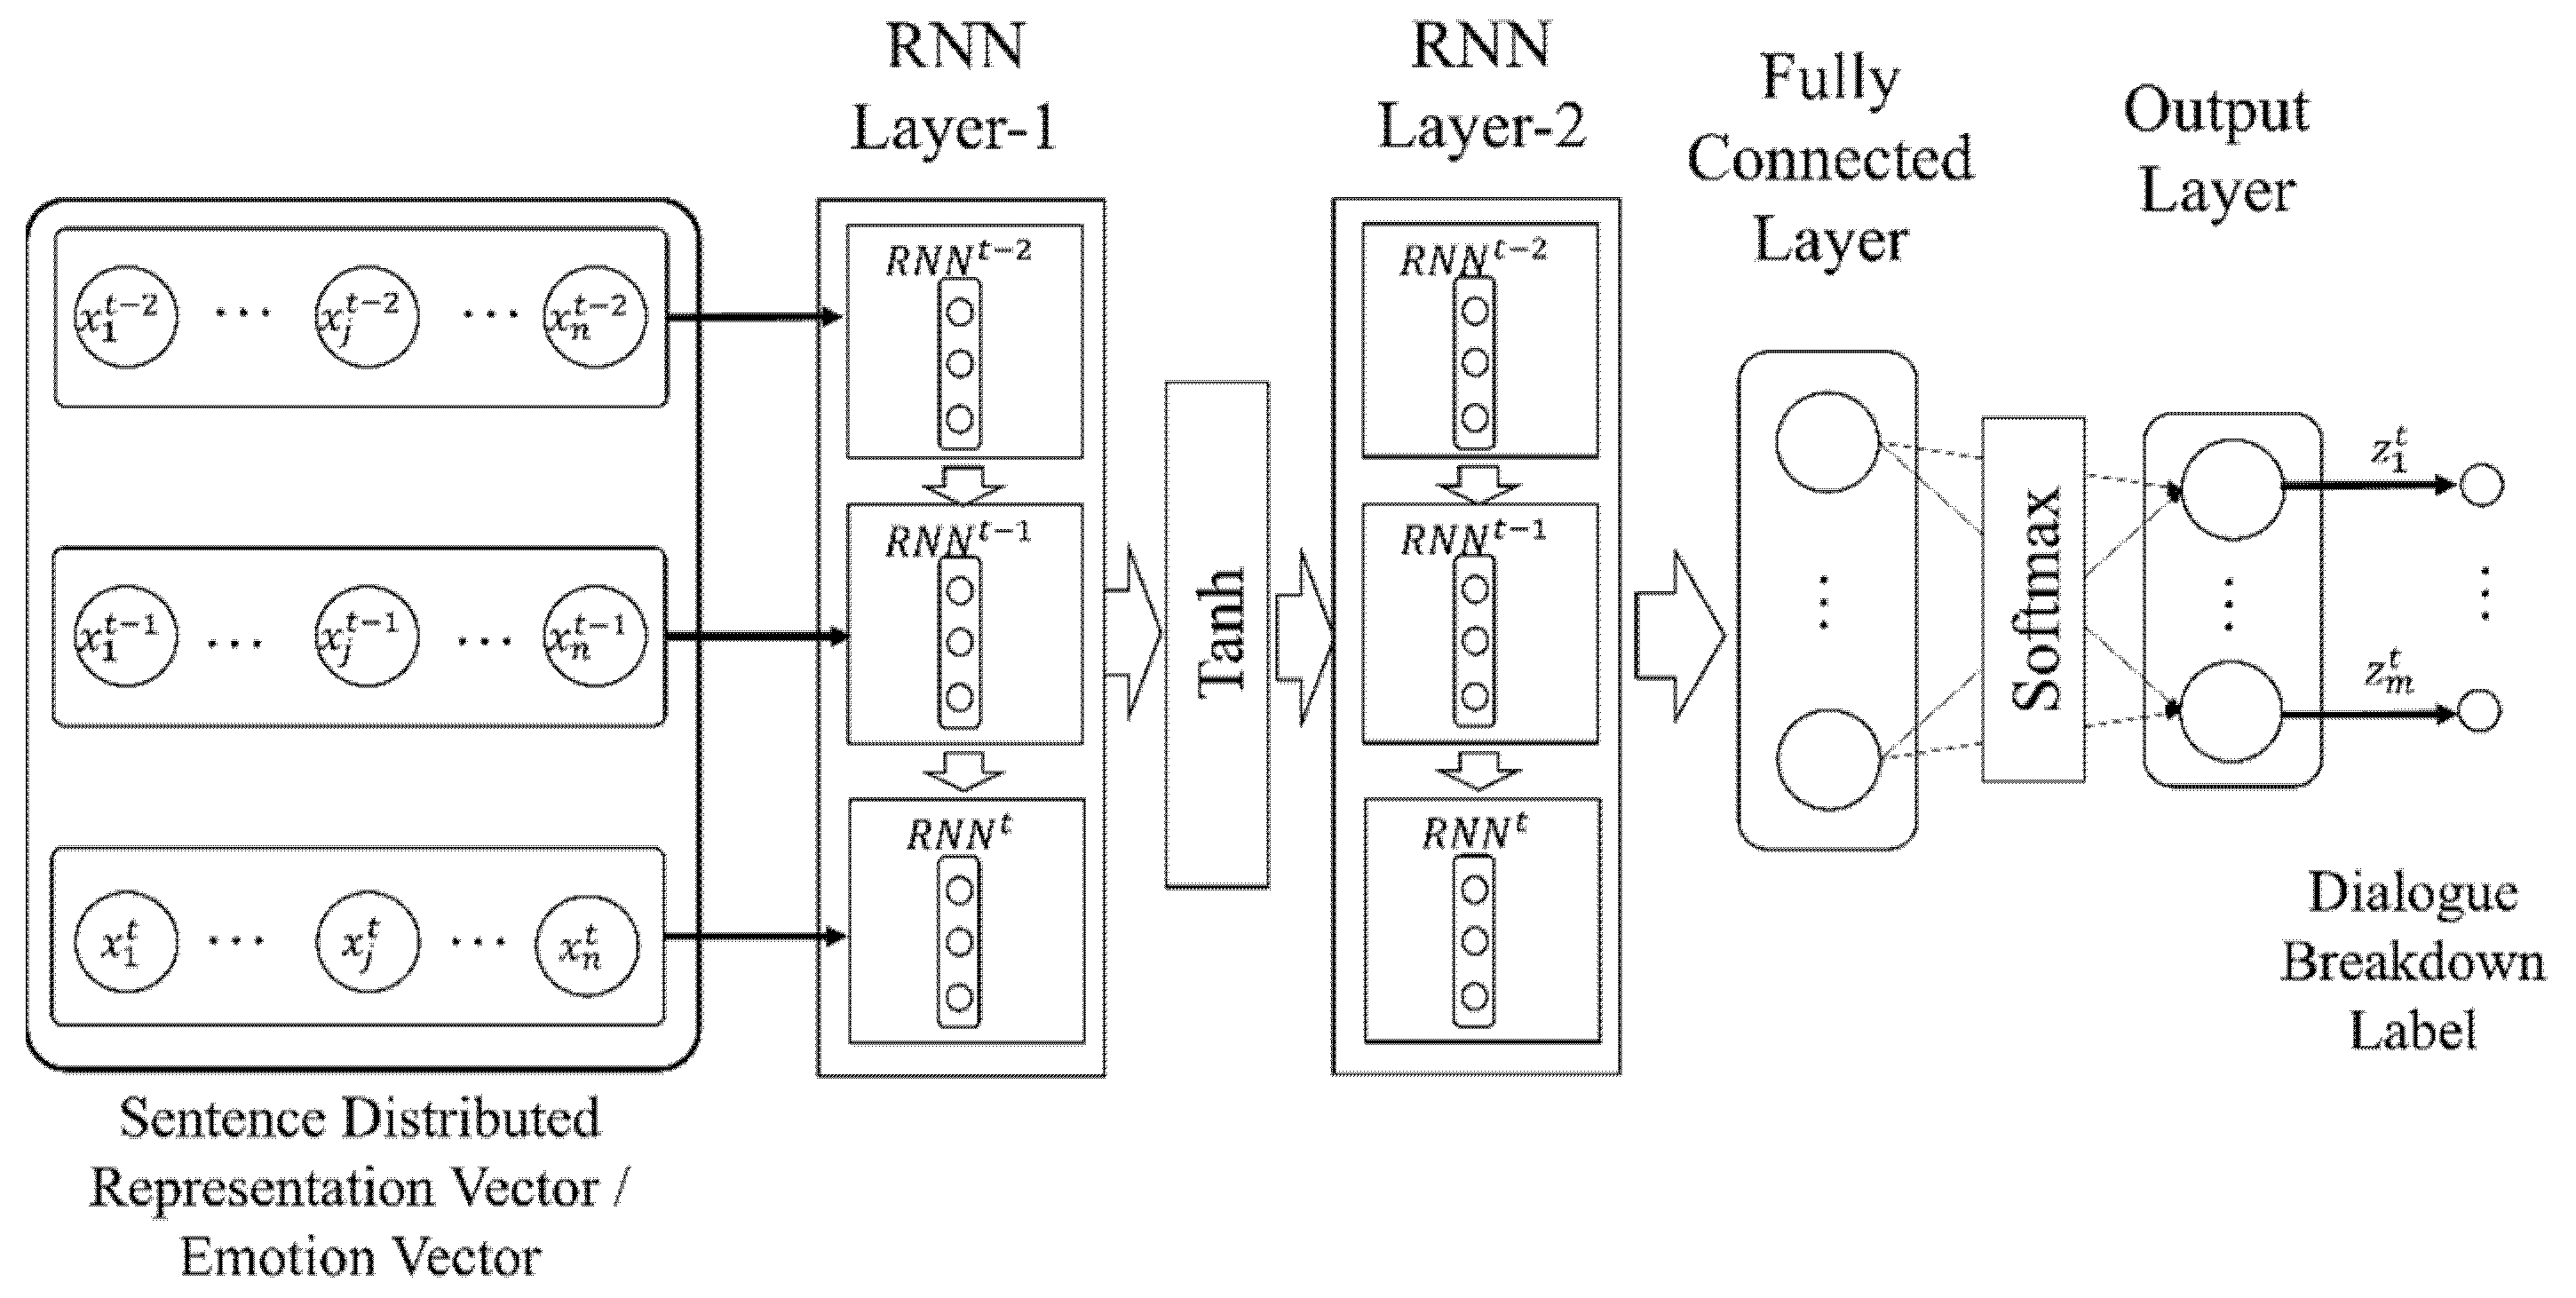
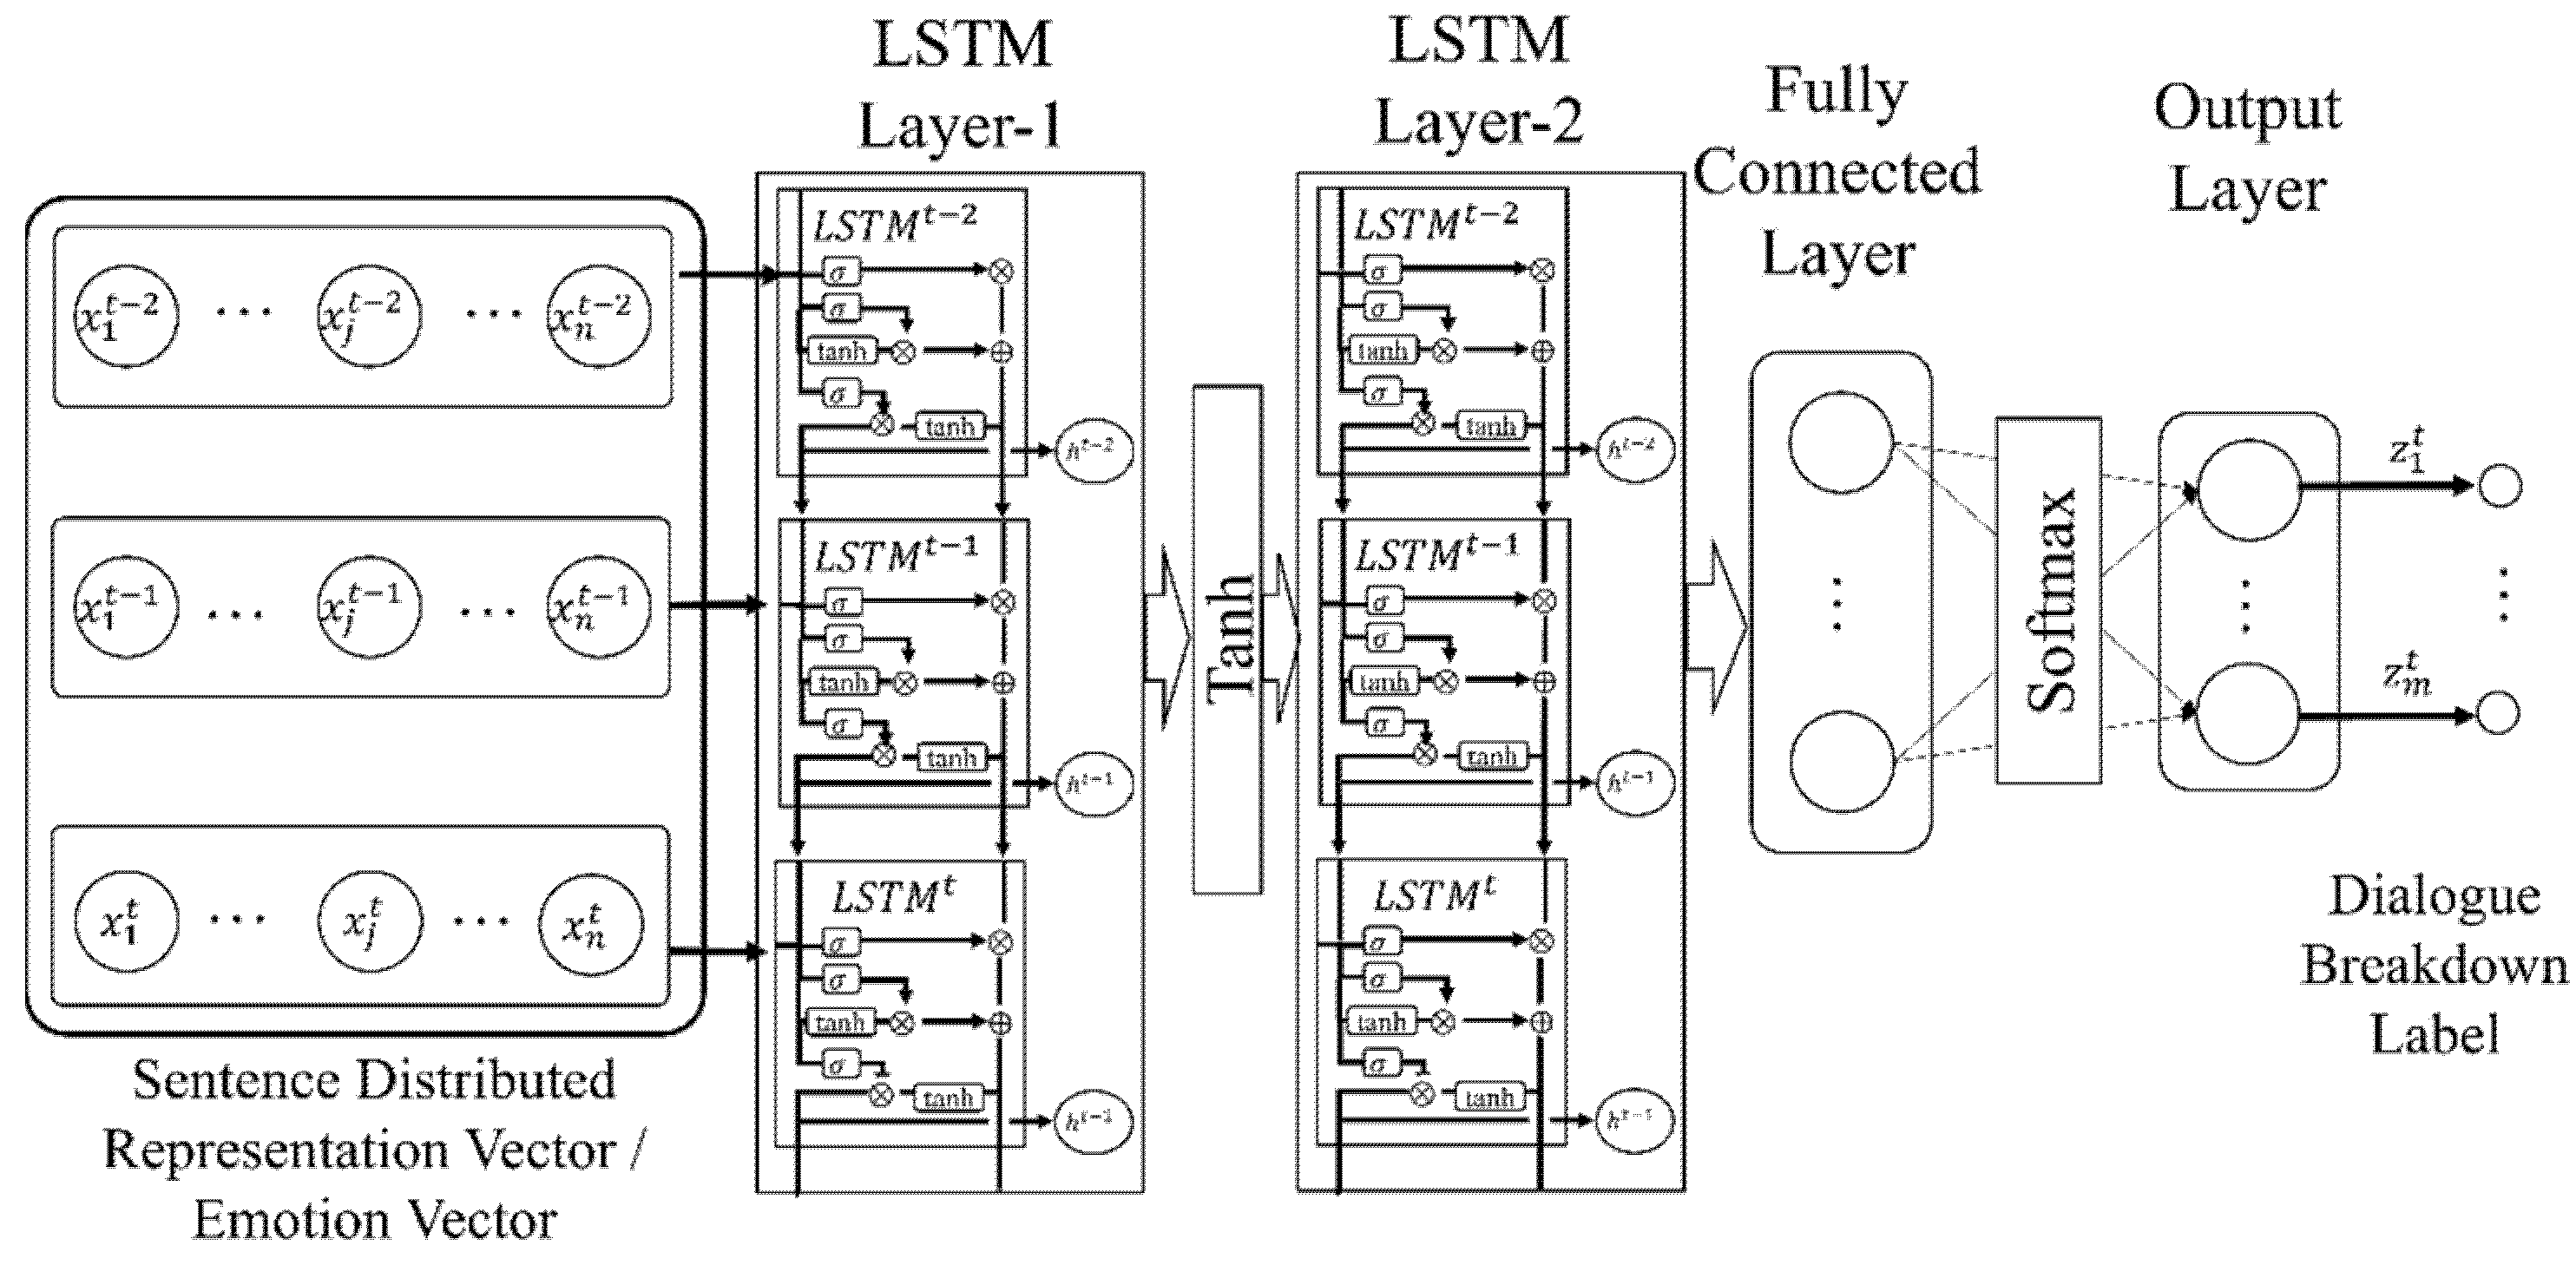
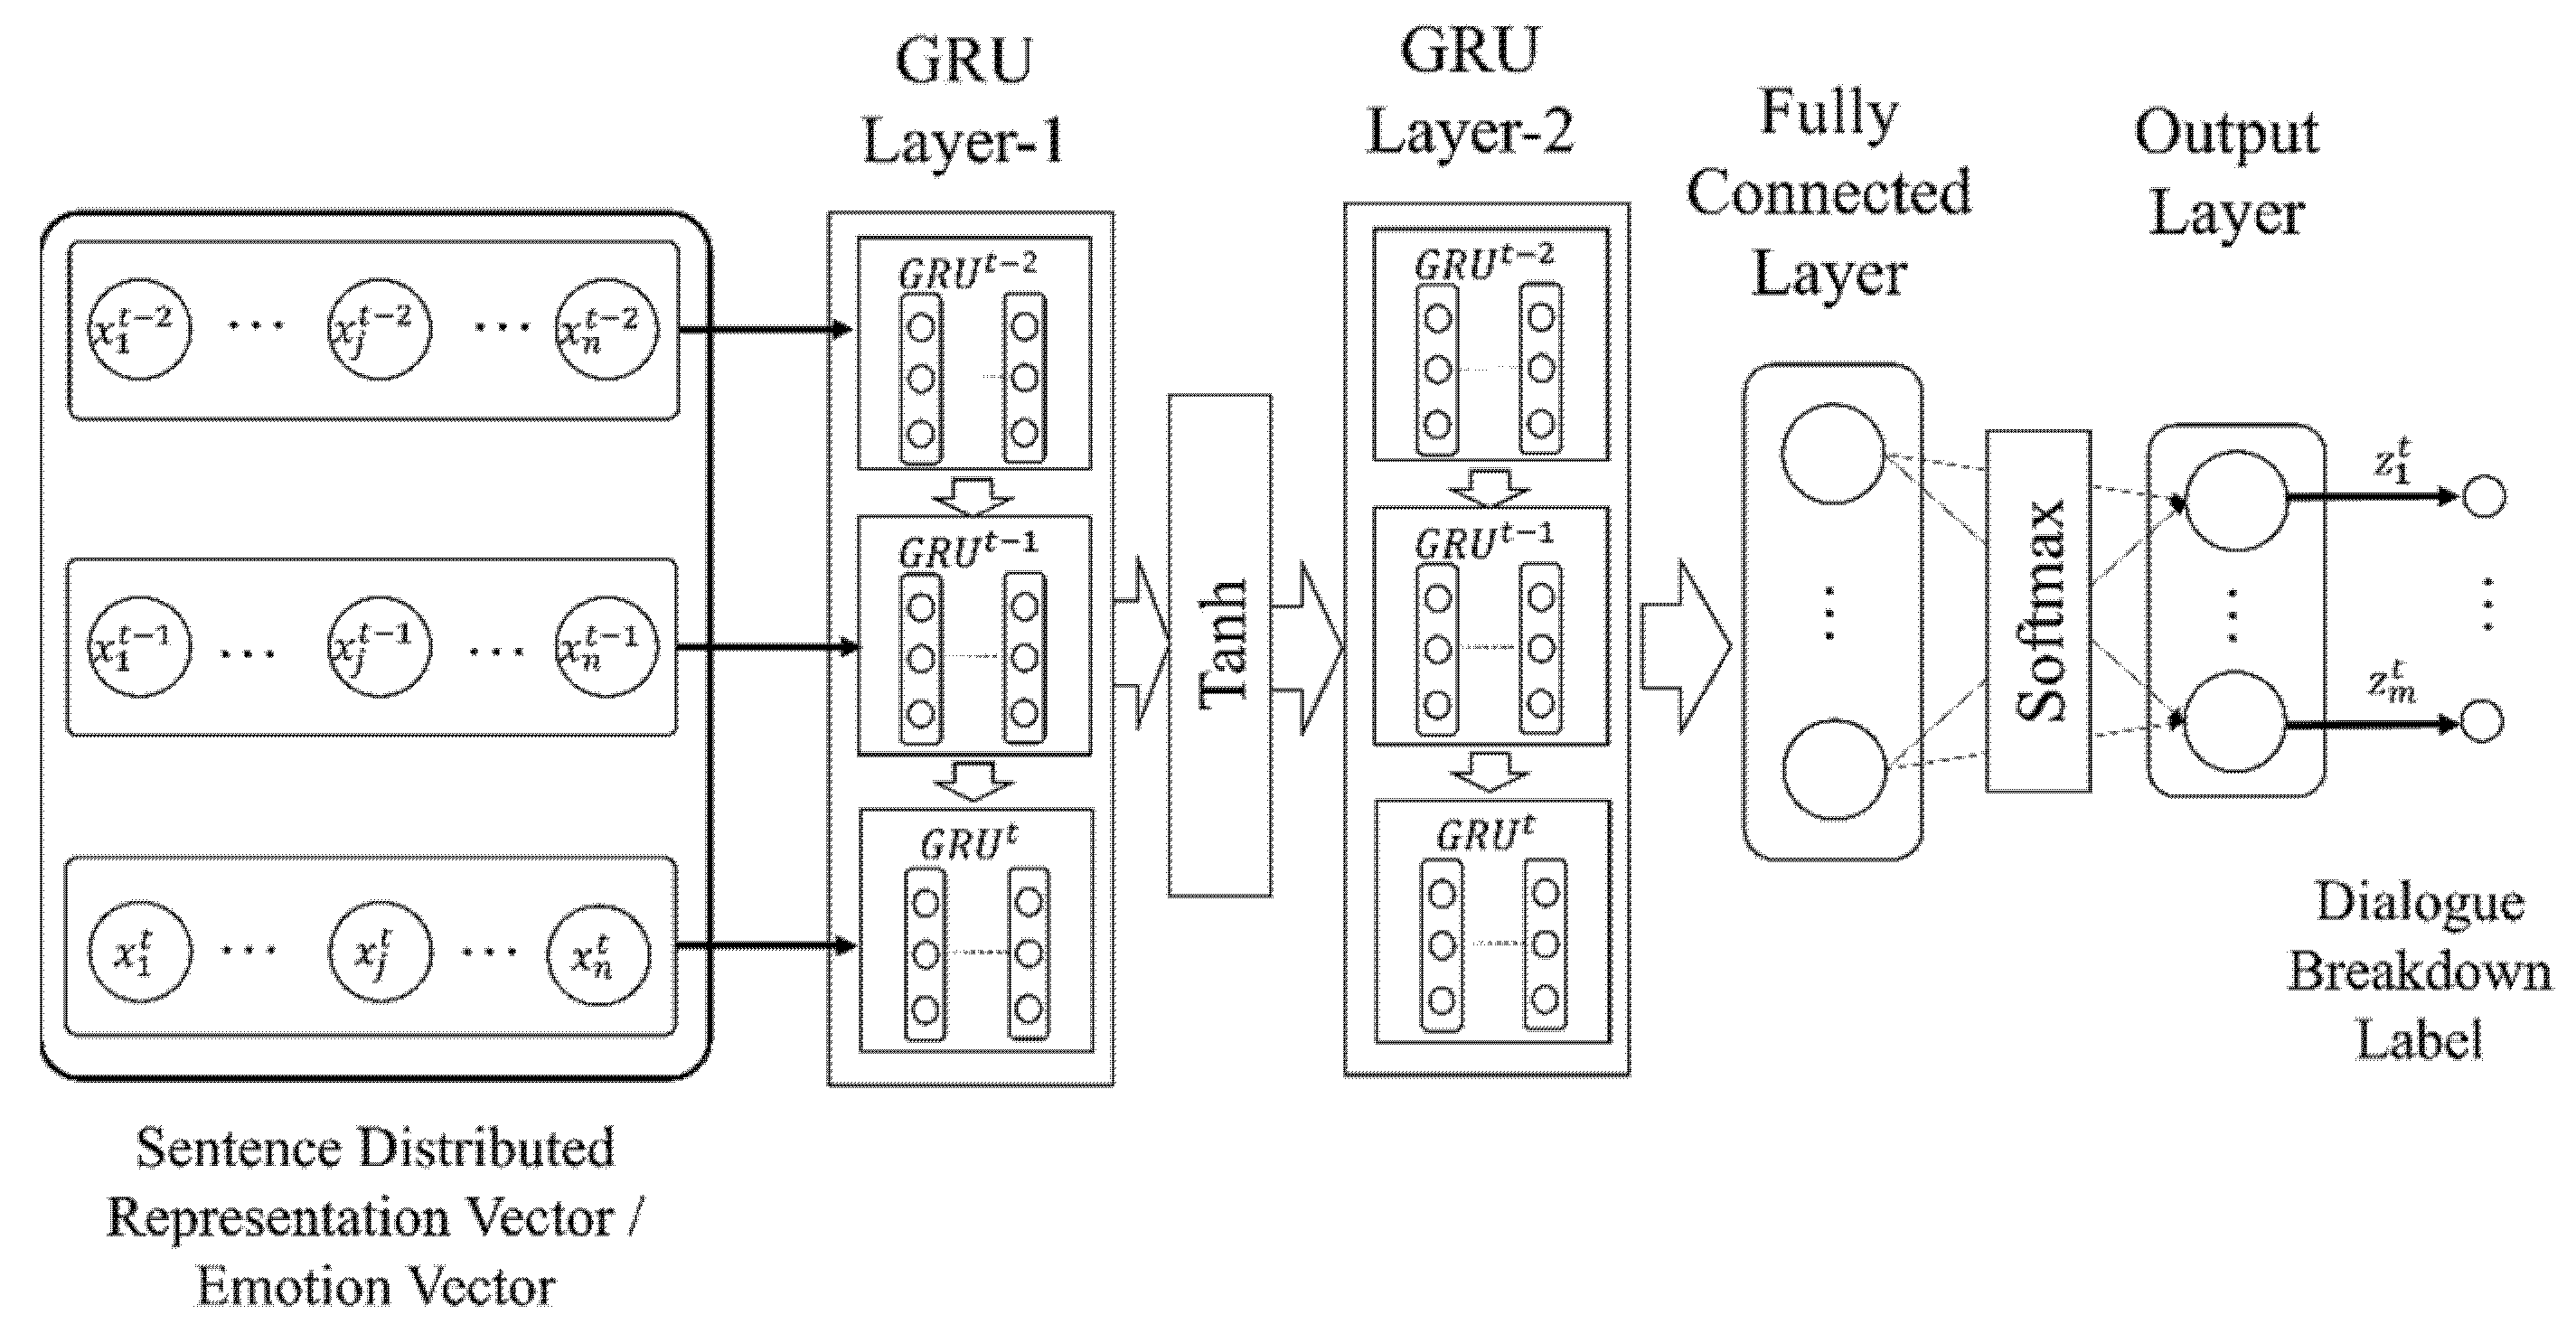
3.4.3. Recurrent Neural Networks
4. Experiment and Results
4.1. Experimental Data
4.2. Evaluation of Emotion Estimation
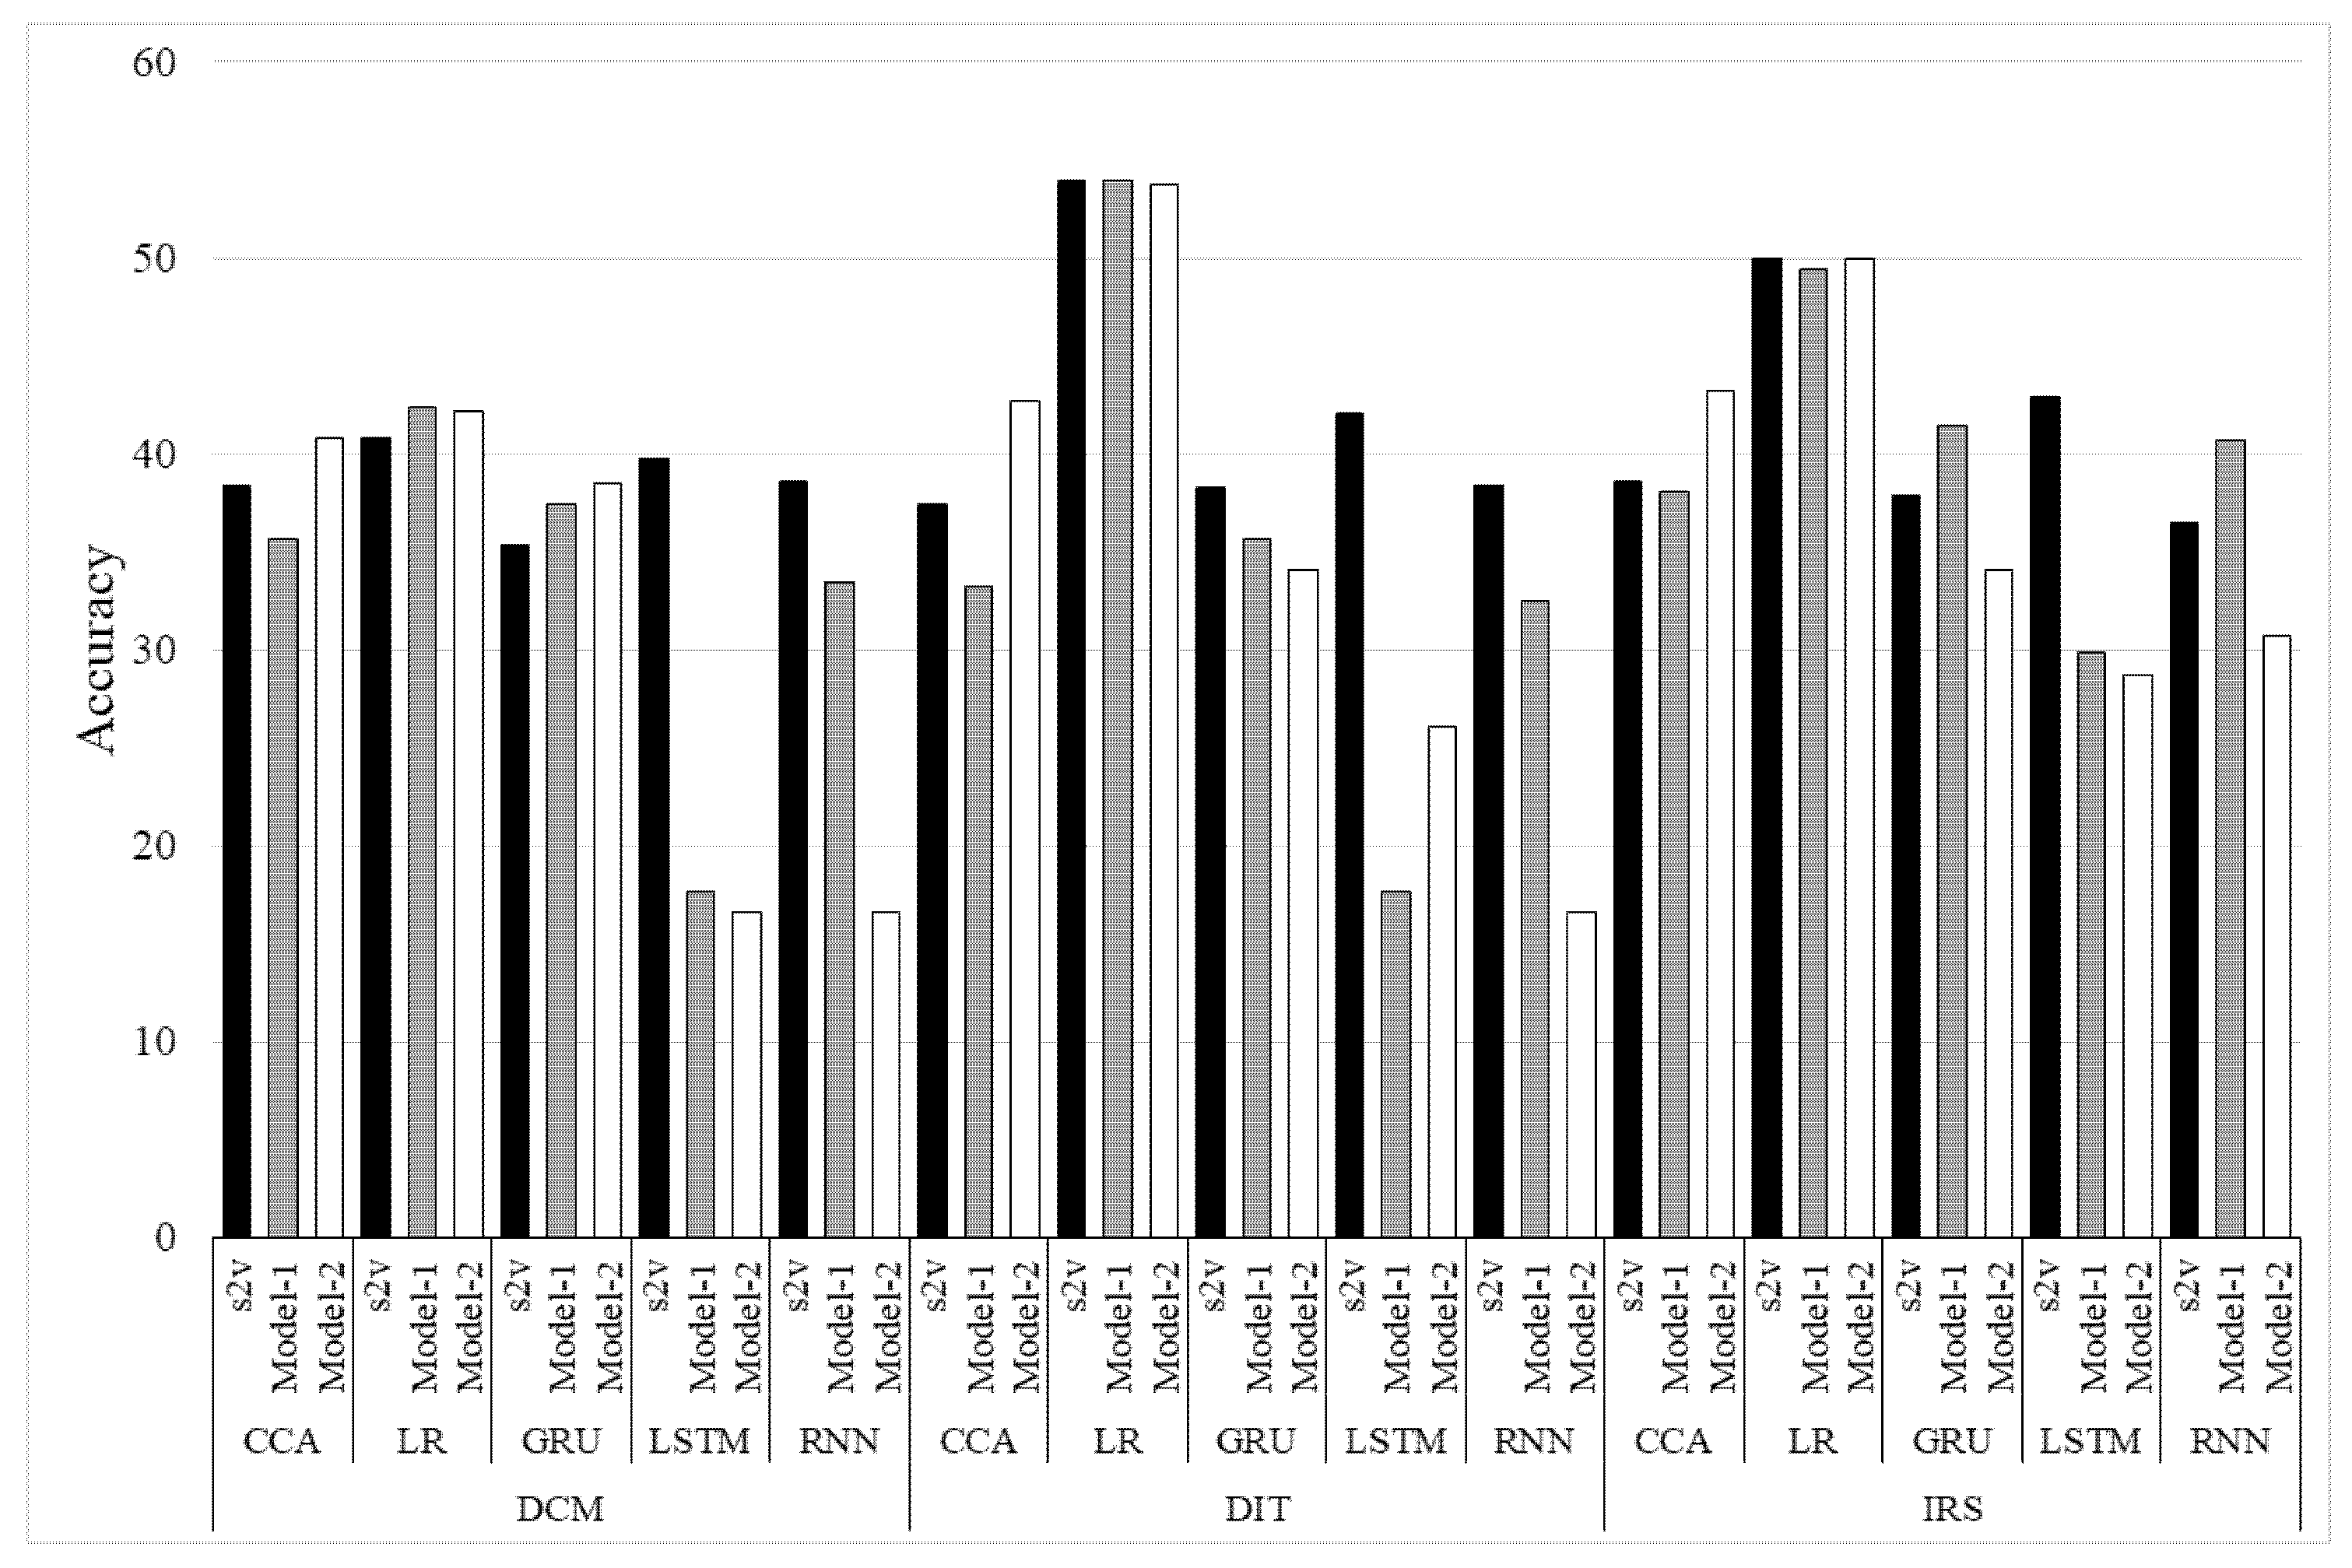
4.3. Evaluation of Dialogue Breakdown Detection
- For the distribution of correct labels and the distribution of the labels that were outputted by the dialogue breakdown, compare
- —
- Cosine Similarity,
- —
- Jensen-Shannon Divergence (JSD) [54],
- —
- Mean Squared Error (MSE).
- Apply the detection rate of the dialogue breakdown response sentence (a rate that succeeded in estimating dialogue breakdown sentences correctly) (Accuracy).
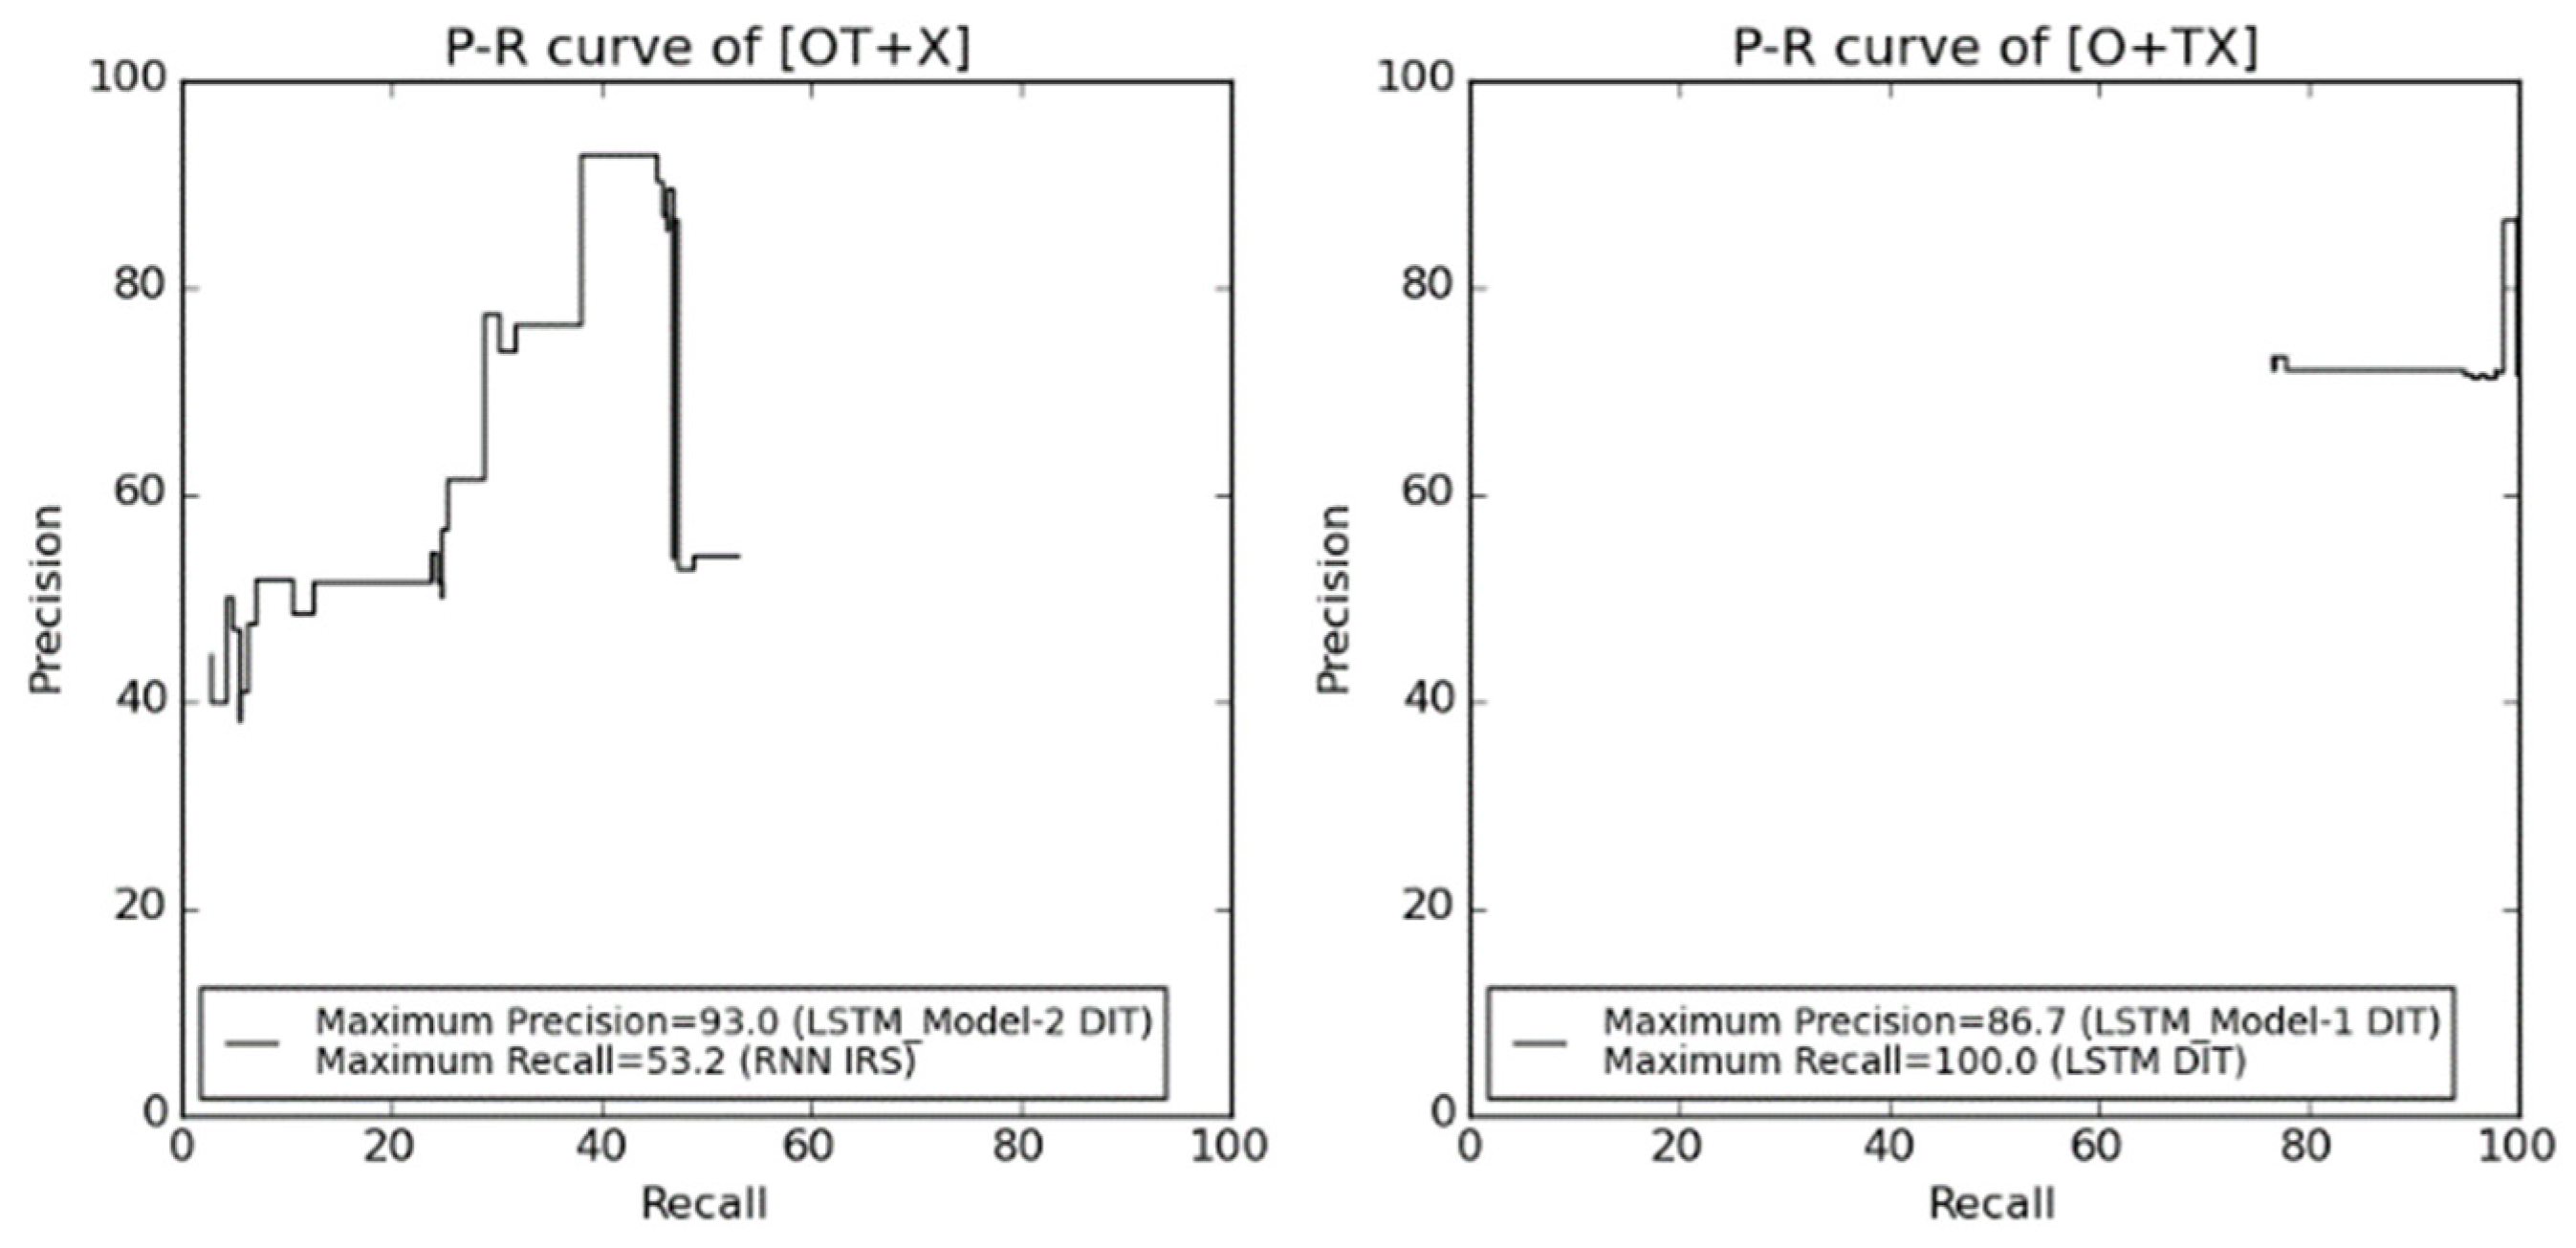
- [OT + X]: O and T are “Not breakdown”, X is “Breakdown”.
- [O + TX]: O is “Not breakdown”, T and X are “Breakdown.”
5. Discussions
6. Conclusions
Author Contributions
Funding
Institutional Review Board Statement
Acknowledgments
Conflicts of Interest
References
- Amazon Alexa. Available online: https://developer.amazon.com/ja/alexa (accessed on 29 December 2021).
- Google Assistant. Available online: https://assistant.google.com/intl/ja_jp/ (accessed on 29 December 2021).
- Apple Siri. Available online: https://www.apple.com/jp/siri/ (accessed on 29 December 2021).
- Microsoft Cortana. Available online: https://www.microsoft.com/en-us/cortana (accessed on 29 December 2021).
- Arend, B.; Sunnen, P.; Caire, P. Investigating breakdowns in human robot interaction: A conversation analysis guided single case study of a human-robot communication in a museum environment. Int. J. Mech. Aerosp. Ind. Mechatron. Manuf. Eng. 2017, 11, 5. [Google Scholar]
- Higashinaka, R.; Mizukami, M.; Funakoshi, K.; Araki, M.; Tsukahara, H.; Kobayashi, Y. Fatal or not? finding errors that lead to dialogue breakdowns in chat-oriented dialogue systems. In Proceedings of the 2015 Conference on Empirical Methods in Natural Language Processing, Lisbon, Portugal, 17–21 September 2015; pp. 2243–2248. [Google Scholar]
- Takayama, J.; Nomoto, E.; Arase, Y. Dialogue breakdown detection considering annotation biases. In Proceedings of the Dialog System Technology Challenges, DSTC6, Long Beach, CL, USA, 10 December 2017. [Google Scholar]
- Sugiyama, H. Dialogue breakdown detection based on estimating appropriateness of topic transition. In Proceedings of the Dialog System Technology Challenges, DSTC6, Long Beach, CL, USA, 10 December 2017. [Google Scholar]
- Iki, T.; Saito, A. End-to-end character-level dialogue breakdown detection with external memory models. In Proceedings of the Dialog System Technology Challenges, DSTC6, Long Beach, CL, USA, 10 December 2017. [Google Scholar]
- Xie, Z.; Ling, G. Dialogue breakdown detection using hierarchical bi-directional LSTMs. In Proceedings of the Dialog System Technology Challenges, DSTC6, Long Beach, CL, USA, 10 December 2017. [Google Scholar]
- Higashinaka, R.; Funakoshi, K.; Kobayashi, Y.; Inaba, M. The dialogue breakdown detection challenge: Task description, datasets, and evaluation metrics. In Proceedings of the Tenth International Conference on Language Resources and Evaluation (LREC 2016), Portoroz, Slovenia, 23–28 May 2016; pp. 3146–3150. [Google Scholar]
- Dialogue Breakdown Detection Challenge Dataset. Available online: https://sites.google.com/site/dialoguebreakdowndetection2/downloads (accessed on 29 December 2021).
- Higashinaka, R.; Funakoshi, K.; Mizukami, M.; Tsukahara, H.; Kobayashi, Y.; Araki, M. Analyzing Dialogue Breakdowns in Chat-oriented Dialogue Systems. In Proceedings of the Interspeech Satelite Workshop, Errors by Humans and Machines in Multimedia, Multimodal and Multilingual Data Processing (ERRARE 2015), Sinaia, Romania, 11–13 September 2015. [Google Scholar]
- Higashinaka, R.; Funakoshi, K.; Araki, M.; Tsukahara, H.; Kobayashi, Y.; Mizukami, M. Text Chat Dialogue Corpus Construction and Analysis of Dialogue Breakdown. J. Nat. Lang. Process. 2016, 23, 59–86. (In Japanese) [Google Scholar] [CrossRef][Green Version]
- Higashinaka, R.; Funakoshi, K.; Kobayashi, Y.; Inaba, M. The Dialogue Breakdown Detection Challenge. In Proceedings of the JSAI Technical Report, 75th SIG-SLUD, Tokyo, Japan, 29–30 October 2015. (In Japanese). [Google Scholar] [CrossRef]
- Hori, C.; Perez, J.; Higashinaka, R.; Hori, T.; Boureau, Y.-L.; Inaba, M.; Tsunomori, Y.; Takahashi, T.; Yoshino, K.; Kim, S. Overview of the sixth dialog system technology challenge: DSTC6. Comput. Speech Lang. 2019, 55, 1–25. [Google Scholar] [CrossRef]
- Tsunomori, Y.; Higashinaka, R.; Takahashi, T.; Inaba, M. Selection of evaluation metrics for dialogue breakdown detection in dialogue breakdown detection challenge 3. Trans. Jpn. Soc. Artif. Intell. 2020, 35, 1–10. (In Japanese) [Google Scholar] [CrossRef]
- Maitreyee, M.; Lindgren, H. Younger and older adults perceptions on role, behavior, goal and recovery strategies for managing breakdown situations in human-robot dialogues. In Proceedings of the 9th International User Modeling, Adaptation and Personalization Human-Agent Interaction (HAI 2021), Nagoya, Japan, 9–11 November 2021; pp. 433–437. [Google Scholar] [CrossRef]
- Kontogiorgos, D.; Tran, M.; Gustafson, J. A systematic cross-corpus analysis of human reactions to robot conversational failures. In Proceedings of the 23rd ACM International Conference on Multimodal Interaction, ICMI 2021, Montreal, ON, Canada, 18–21 October 2021. [Google Scholar] [CrossRef]
- Takayama, J.; Nomoto, E.; Arase, Y. Dialogue breakdown detection robust to variations in annotators and dialogue systems. Comput. Speech Lang. 2019, 54, 31–43. [Google Scholar] [CrossRef]
- Görer, B. Emotion classification of text based conversations through dialog act modeling. In Proceedings of the 2014 22nd Signal Processing and Communications Applications Conference (SIU), Trabzon, Turkey, 23–25 April 2014. [Google Scholar] [CrossRef]
- Ren, F.; She, T. Utilizing external knowledge to enhance semantics in emotion detection in conversation. IEEE Access 2021, 9, 154947–154956. [Google Scholar] [CrossRef]
- Chen, J.; Liu, C.; Li, M. Automatic emotional spoken language text corpus construction from written dialogs in fictions. In Proceedings of the 2017 Seventh International Conference on Affective Computing and Intelligent Interaction (ACII), San Antonio, TX, USA, 23–26 October 2017. [Google Scholar] [CrossRef]
- Gao, X.; Zhao, Y.; Zhang, J.; Cai, L. Pairwise emotional relationship recognition in drama videos: Dataset and benchmark. In Proceedings of the 29th ACM International Conference on Multimedia (MM 2021), Virtual Online, 20–24 October 2021; pp. 3380–3389. [Google Scholar] [CrossRef]
- Song, J.; Luo, Q.; Nie, J. Research and application of multi-round dialogue intent recognition method. In Proceedings of the 2020 16th International Conference on Computational Intelligence and Security (CIS), Guangxi, China, 27–30 November 2020. [Google Scholar] [CrossRef]
- Wei, W.-L.; Lin, J.-C.; Wu, C.-H. Interaction style recognition based on multi-layer multi-view profile representation. IEEE Trans. Affect. Comput. 2017, 8, 355–368. [Google Scholar] [CrossRef]
- Saha, T.; Gupta, D.; Saha, S.; Bhattacharyya, P. Emotion Aided Dialogue Act Classification for Task-Independent Conversations in a Multi-modal Framework. Cogn. Comput. 2021, 13, 277–289. [Google Scholar] [CrossRef]
- Sentence2vec. Available online: https://github.com/klb3713/sentence2vec (accessed on 29 December 2021).
- Le, Q.; Mikolov, T. Distributed representations of sentences and documents. In Proceedings of the 31st International Conference on Machine Learning (ICML2014), Beijing, China, 21–26 June 2014; pp. 1188–1196. [Google Scholar]
- Mikolov, T.; Chen, K.; Corrado, G.; Dean, J. Efficient estimation of word representations in vector space. In Proceedings of the CoRR, Athens, Greece, 11–14 September 2013; Available online: http://arxiv.org/abs/1301.3781 (accessed on 29 December 2021).
- Mikolov, T.; Sutskever, I.; Chen, K.; Corrado, G.; Dean, J. Distributed representations of words and phrases and their compositionality. Adv. Neural Inf. Process. Syst. 2013, 26, 3111–3119. [Google Scholar]
- MeCab: Yet Another Part-of-Speech and Morphological Analyzer. Available online: http://taku910.github.io/mecab/ (accessed on 29 December 2021).
- Fischer, K.W.; Shaver, P.; Carnchan, P. A skill approach to emotional development: From basic- to subordinate-category emotions. In Child Development Today and Tomorrow; Damon, W., Ed.; Wiley: Hoboken, NJ, USA, 1989; pp. 107–136. [Google Scholar]
- Poria, S.; Gelbukh, A.; Cambria, E.; Hussain, A.; Huang, G.B. 2014. EmoSenticSpace: A novel framework for affective common-sense reasoning. Knowl. Based Syst. 2014, 69, 108–123. [Google Scholar] [CrossRef]
- Ptaszynski, M.; Dybala, P.; Shi, W.; Araki, K. Contextual affect analysis: A system for verification of emotion appropriateness supported with contextual valence shifters. Int. J. Biometrics 2010, 2, 2. [Google Scholar] [CrossRef]
- Thelwall, M.; Buckley, K.; Paltoglou, G.; Cai, D. Sentiment strength detection in short informal text. J. Am. Soc. Inf. Sci. Technol. 2010, 61, 2544–2558. [Google Scholar] [CrossRef]
- Strapparava, C.; Mihalcea, R. Learning to identify emotions in text. In Proceedings of the 2008 ACM symposium on applied computing, Fortaleza, Brasil, 16–20 March 2008. [Google Scholar]
- Liew, S.Y.J.; Turtle, R.H. Exploring fine-grained emotion detection in tweets. In Proceeding of the 2016 Conference of the North American Chapter of the Association for Computational Linguistics: Human Language Technologies, San Diego, CA, USA, 12–17 June 2016. [Google Scholar]
- Surace, L.; Patacchiola, M.; Sonmez, B.E.; Spataro, W.; Cangelosi, A. Emotion recognition in the wild using deep neural networks and Bayesian classifiers. In Proceedings of the 19th ACM International Conference on Multimodal Interaction, Glasgow, Scotland, 14–17 November 2017; pp. 593–597. [Google Scholar]
- Hassan, A.; Mahmood, A. Deep learning approach for sentiment analysis of short texts. In Proceedings of the 3rd International Conference on Control, Automation and Robotics (ICCAR), Nagoya, Japan, 24–26 April 2017. [Google Scholar]
- Fan, X. Canonical correlation analysis as a general analytic model. In Advances in Social Science Methodology; Thompson, B., Ed.; JAI: Greenwich, CT, USA, 1996; Volume 4, pp. 71–94. [Google Scholar]
- Fan, X. Canonical correlation analysis and structural equation modeling: What do they have in common? Struct. Equ. Modeling 1997, 4, 65–79. [Google Scholar] [CrossRef]
- Thompson, B. Canonical Correlation Analysis: Uses and Interpretation; Sage: Newbury Park, CA, USA, 1984. [Google Scholar]
- Akaho, S. A kernel method for canonical correlation analysis. In Proceedings of the International Meeting of Psychometric Society, Osaka, Japan, 15–19 July 2001. [Google Scholar]
- Akaho, S. Introduction to canonical correlation analysis: Mutual information extraction from multimodal observations. Brain Neural Netw. 2013, 20, 62–72. (In Japanese) [Google Scholar] [CrossRef][Green Version]
- Cox, D.R. The regression analysis of binary sequences (with discussion). J. Roy. Stat. Soc. B 1958, 20, 215–242. [Google Scholar]
- Graves, A.; Liwicki, M.; Fernandez, S.; Bertolami, R.; Bunke, H.; Schmidhuber, J. A novel connectionist system for improved unconstrained handwriting recognition (PDF). IEEE Trans. Pattern Anal. Mach. Intell. 2008, 31, 855–868. [Google Scholar] [CrossRef]
- Hochreiter, S.; Schmidhuber, J. Long short-term memory. Neural Comput. 1997, 9, 1735–1780. [Google Scholar] [CrossRef]
- Gers, A.F.; Schmidhuber, J.; Cummins, F. Learning to forget: Continual prediction with LSTM. Neural Comput. 2000, 12, 2451–2471. [Google Scholar] [CrossRef]
- Kyunghyun, C.; Merrienboer, B.; Gulcehre, C.; Bahdanau, D.; Bougares, F.; Schwenk, H.; Bengio, Y. Learning phrase representations using RNN encoder-decoder for statistical machine translation. arXiv 2014, arXiv:1406.1078. [Google Scholar]
- NTT Docomo Chat-Oriented Dialogue API. Available online: https://www.nttdocomo.co.jp/service/developer/smart_phone/analysis/chat/ (accessed on 29 December 2021).
- Tsukahara, H.; Uchiumi, K. System utterance generation by label propagation over association graph of words and utterance patterns for open-domain dialogue systems. In Proceedings of the 29th Pacific Asia Conference on Language, Information and Computation (PACLIC 2015), Shanghai, China, 30 October–1 November 2015; pp. 323–331. [Google Scholar]
- Ritter, A.; Cherry, C.; Dolan, W.B. Data-driven response generation in social media. In Proceedings of the Empirical Methods in Natural Language Processing (EMNLP 2011), Edinburgh, Scotland, 27–31 July 2011; pp. 583–593. [Google Scholar]
- Fuglede, B.; Topsoe, F. Jensen-Shannon Divergence and Hilbert Space Embedding. In Proceedings of the International Symposium on Information Theory, ISIT 2004, Chicago, IL, USA, 27 June–2 July 2004. [Google Scholar]
- Kullback, S.; Leibler, R.A. On information and sufficiency. Ann. Math. Stat. 1951, 22, 79–86. [Google Scholar] [CrossRef]
- Wang, Y.; Zhang, J.; Ma, J.; Wang, S.; Xiao, J. Contextualized Emotion Recognition in Conversation as Sequence Tagging. In Proceedings of the 21th Annual Meeting of the Special Interest Group Discourse and Dialogue, Virtual, 1–3 July 2020; pp. 186–195. [Google Scholar]
- Guibon, G.; Labeau, M.; Lefeuvre, L.; Clavel, C. Few-shot emotion recognition in conversation with sequential prototypical networks. Softw. Impacts 2022, 12, 100237. [Google Scholar] [CrossRef]
- Poria, S.; Hazarika, D.; Mihalcea, R. DialogueRNN: An Attentive RNN for Emotion Detection in Conversations. In Proceedings of the 33rd AAAI Conference on Artificial Intelligence, Honolulu, HI, USA, 27 January–1 February 2022; pp. 6818–6825. [Google Scholar]


| S/U | Utterance | (O, X, T) |
|---|---|---|
| S | Good evening. Be careful with heat stroke. | (30, 0, 0) |
| U | Thank you. | (−1, −1, −1) |
| S | Okay. | (11, 9, 10) |
| U | How about that? | (−1, −1, −1) |
| S | You must be careful with heat stroke. | (5, 11, 14) |
| U | Yes. And I got you a heat stroke at first sight. | (−1, −1, −1) |
| S | Heat stroke is okay. | (8, 8, 14) |
| U | Which way are you talking about? | (−1, −1, −1) |
| S | Prevention is important. | (6, 12, 12) |
| Label | Example of Emotions | Num. of Annotations |
|---|---|---|
| A-1 | Joy, relief, sensation, hope, etc. | 24,044 |
| A-2 | Love, respect, like, etc. | 7124 |
| B-1 | Surprise, amazement, etc. | 2350 |
| C-1 | Anger, hate, spite, etc. | 13,037 |
| D-1 | Sorrow, pity, guilt, etc. | 8201 |
| D-2 | Anxiety, fear, etc. | 7816 |
| E-1 | Neutral | 8717 |
| Type | Example | Emotion Label |
|---|---|---|
| Spoken sentences | You cheated! | C-1 |
| My head may hurt. | D-1 | |
| Now, I will drink v (≧∇≦) v | A-1 | |
| hardship | D-1 | |
| Emotional words/phrases | bluff | C-1 |
| cozy | A-1 |
| # of Examples | 61,802 |
|---|---|
| # of Words | 845,940 |
| # of Vocabularies | 43,444 |
| Layer | Num. of Units | Activation Function | Dropout Rate |
|---|---|---|---|
| Input | 500 | tanh | 0.5 |
| Hidden-1 | 128 | tanh | 0.5 |
| Hidden-2 | 256 | tanh | 0.5 |
| Hidden-3 | 512 | tanh | 0.5 |
| Hidden-4 | 256 | tanh | 0.5 |
| Output | 6 | softmax | -- |
| Layer | Num. of Units | Activation Function | Dropout Rate |
|---|---|---|---|
| Input | 500 | tanh | 0.0 |
| Hidden-1 | 200 | tanh | 0.0 |
| Hidden-2 | 500 | tanh | 0.1 |
| Hidden-3 | 1000 | -- | 0.1 |
| Hidden-4 | 100 | -- | 0.1 |
| Output | 7 | softmax | -- |
| S/U | Utterance | Emotion Vector | Emotion Similarity (Top 2 Emotions) Vector | (O, X, T) |
|---|---|---|---|---|
| S | Good evening. Be careful with heat stroke. | A2:0.355 A1:0.330 C1:0.277 E1:0.038 | - | (30, 0, 0) |
| U | Thank you. | E1:0.965 D1:0.027 | - | (−1, −1, −1) |
| S | Okay. | A1:0.482 C1:0.264 A2:0.132 E1:0.121 | 0.00 0.00 0.60 | (11, 9, 10) |
| U | How about that? | E1:0.980 D1:0.020 | 0.00 0.00 1.00 | (−1, −1, −1) |
| S | You must be careful with heat stroke. | A1:0.728 A2:0.163 C1:0.088 E1:0.020 | 0.00 0.00 0.86 | (5, 11, 14) |
| U | Yes. And I got you a heat stroke at first sight. | E1:0.976 D1:0.024 | 0.00 0.00 1.00 | (−1, −1, −1) |
| S | Heat stroke is okay. | E1:0.900 A1:0.036 C1:0.027 A2:0.026 D1:0.011 | 0.00 1.00 0.04 | (8, 8, 14) |
| U | Which way are you talking about? | E1:0.951 D1:0.029 | 1.00 1.00 1.00 | (−1, −1, −1) |
| S | Prevention is important. | A1:0.889 A2:0.080 C1:0.031 | 1.00 0.00 0.04 | (6, 12, 12) |
| System | # of Dialogues | # of Utterances (System) | # of Utterances (User) | # of Words (System) | # of Words (User) |
|---|---|---|---|---|---|
| DCM | 50 | 550 | 500 | 4197 | 4179 |
| DIT | 50 | 550 | 500 | 15083 | 5204 |
| IRS | 50 | 550 | 500 | 8286 | 5341 |
| Gender | Age | Number |
|---|---|---|
| Male | 17 | 1 |
| 19 | 1 | |
| 20 | 9 | |
| 38 | 1 | |
| Female | 20 | 2 |
| Dialogue System | System/User | Emotion Tag (Code) | ||||||
|---|---|---|---|---|---|---|---|---|
| Joy (A-1) | Love (A-2) | Surprise (B-1) | Anger (C-1) | Sorrow (D-1) | Anxiety (D-2) | Neutral (E-1) | ||
| DCM | System | 270 | 188 | 77 | 37 | 31 | 74 | 320 |
| User | 212 | 139 | 160 | 44 | 71 | 57 | 275 | |
| DIT | System | 216 | 180 | 131 | 14 | 50 | 39 | 330 |
| User | 177 | 149 | 251 | 18 | 91 | 40 | 236 | |
| IRS | System | 214 | 201 | 159 | 23 | 92 | 50 | 247 |
| User | 203 | 172 | 189 | 32 | 78 | 25 | 255 | |
| Emotion | Precision | Recall | F-Value |
|---|---|---|---|
| A-1 | 76.5 | 81.6 | 79.0 |
| A-2 | 59.3 | 85.1 | 69.9 |
| B-1 | 0.0 | 0.0 | 0.0 |
| C-1 | 19.1 | 60.8 | 29.1 |
| D-1 | 25.6 | 26.2 | 25.9 |
| D-2 | 17.3 | 22.6 | 19.6 |
| Average | 33.0 | 46.0 | 37.2 |
| Emotion | Precision | Recall | F-Value |
|---|---|---|---|
| A-1 | 56.0 | 60.1 | 58.0 |
| A-2 | 39.8 | 50.3 | 44.4 |
| B-1 | 25.0 | 1.1 | 2.1 |
| C-1 | 8.6 | 63.0 | 15.2 |
| D-1 | 7.5 | 11.5 | 9.0 |
| D-2 | 6.7 | 9.5 | 7.8 |
| E-1 | 80.2 | 40.9 | 54.2 |
| Average | 32.0 | 33.8 | 27.2 |
| Method | Feature | Accuracy | P(X) | R(X) | F(X) | P(XT) | R(XT) | F(XT) |
|---|---|---|---|---|---|---|---|---|
| RNN | s2v | 37.9 | 38.1 | 5.6 | 9.8 | 71.5 | 96.9 | 82.3 |
| Model-1 | 42.9 | 48.6 | 12.6 | 20.0 | 72.0 | 95.0 | 81.9 | |
| Model-2 | 36.5 | 40.0 | 4.2 | 7.6 | 71.3 | 96.4 | 81.9 | |
| LSTM | s2v | 35.3 | 47.1 | 5.6 | 10.0 | 71.7 | 95.5 | 81.9 |
| Model-1 | 39.8 | 40.9 | 6.3 | 10.9 | 71.4 | 97.8 | 82.5 | |
| Model-2 | 38.6 | 44.4 | 2.8 | 5.3 | 71.6 | 100.0 | 83.5 | |
| GRU | s2v | 38.3 | 47.6 | 7.0 | 12.2 | 71.2 | 96.1 | 81.8 |
| Model-1 | 42.1 | 51.7 | 10.5 | 17.4 | 72.2 | 97.8 | 83.0 | |
| Model-2 | 38.4 | 50.0 | 4.9 | 8.9 | 71.9 | 98.6 | 83.2 | |
| Multi-task Learning | s2v | 43.0 | 36.0 | 14.0 | 20.0 | 64.0 | 100.0 | 78.0 |
| s2v_Model-2 | 38.0 | 24.0 | 30.0 | 26.0 | 64.0 | 100.0 | 78.0 | |
| HCU_run3 | 50.4 | 52.0 | 29.2 | 37.4 | 91.0 | 39.6 | 55.1 | |
| smap_run1 | 41.5 | 43.4 | 47.8 | 45.5 | 73.9 | 90.8 | 81.5 | |
| RSL16BD_run1 | 40.5 | 0.0 | 0.0 | 0.0 | 100.0 | 0.0 | 0.0 | |
| NTTCS_run1 | 52.7 | 47.7 | 65.2 | 55.1 | 84.2 | 71.0 | 77.0 | |
| NTTCS_run2 | 56.5 | 52.3 | 58.4 | 55.2 | 87.5 | 62.4 | 72.8 | |
| NTTCS_run3 | 52 | 47.8 | 65.7 | 55.3 | 83.0 | 70.5 | 76.2 | |
| KIT16_run2 | 45.5 | 45.3 | 57.3 | 50.6 | 75.3 | 82.5 | 78.7 | |
| OKSAT_run3 | 35.5 | 38.2 | 85.4 | 52.8 | 73.6 | 81.6 | 77.4 | |
| kanolab_run1 | 43.3 | 37.2 | 92.7 | 53.1 | 72.7 | 90.0 | 80.4 | |
| Method | Feature | Accuracy | P(X) | R(X) | F(X) | P(XT) | R(XT) | F(XT) |
|---|---|---|---|---|---|---|---|---|
| RNN | s2v | 41.5 | 85.6 | 46.3 | 60.1 | 86.6 | 99.8 | 92.7 |
| Model-1 | 29.8 | 76.5 | 38.0 | 50.8 | 86.7 | 100.0 | 92.9 | |
| Model-2 | 40.7 | 86.6 | 47.3 | 61.2 | 86.7 | 100.0 | 92.9 | |
| LSTM | s2v | 37.4 | 89.7 | 46.8 | 61.5 | 86.6 | 100.0 | 92.8 |
| Model-1 | 17.7 | 73.9 | 31.7 | 44.4 | 86.7 | 100.0 | 92.9 | |
| Model-2 | 33.4 | 93.0 | 45.4 | 61.0 | 86.7 | 100.0 | 92.9 | |
| GRU | s2v | 35.7 | 87.2 | 46.3 | 60.5 | 86.6 | 100.0 | 92.8 |
| Model-1 | 17.7 | 77.5 | 30.2 | 43.5 | 86.7 | 100.0 | 92.9 | |
| Model-2 | 32.5 | 90.4 | 45.9 | 60.8 | 86.7 | 100.0 | 92.9 | |
| Multi-task Learning | s2v | 48.0 | 11.0 | 2.0 | 3.0 | 77.0 | 100.0 | 87.0 |
| s2v_Model-2 | 41.0 | 23.0 | 27.0 | 25.0 | 77.0 | 100.0 | 87.0 | |
| HCU_run1 | 62.2 | 65.2 | 81.4 | 72.4 | 90.1 | 74.8 | 81.7 | |
| HCU_run3 | 62.4 | 65.5 | 81.8 | 72.7 | 90.4 | 84.2 | 87.2 | |
| smap_run1 | 58.4 | 59.7 | 81.8 | 69.0 | 84.7 | 99.3 | 91.4 | |
| RSL16BD_run1 | 59.1 | 54.0 | 100.0 | 70.1 | 84.3 | 100.0 | 91.5 | |
| NTTCS_run1 | 64 | 61.5 | 93.9 | 74.4 | 89.5 | 91.0 | 90.3 | |
| NTTCS_run2 | 65.5 | 63.2 | 94.3 | 75.7 | 90.0 | 89.1 | 89.5 | |
| KIT16_run2 | 59.1 | 59.4 | 83.7 | 69.5 | 86.5 | 93.2 | 89.7 | |
| OKSAT_run1 | 58.9 | 54.2 | 99.2 | 70.1 | 84.3 | 98.8 | 90.9 | |
| kanolab_run1 | 57.1 | 53.2 | 98.9 | 69.1 | 82.3 | 98.1 | 89.5 | |
| Method | Feature | Accuracy | P(X) | R(X) | F(X) | P(XT) | R(XT) | F(XT) |
|---|---|---|---|---|---|---|---|---|
| RNN | s2v | 34.1 | 54.2 | 53.2 | 53.7 | 73.4 | 77.9 | 75.6 |
| Model-1 | 28.7 | 61.5 | 28.8 | 39.2 | 71.6 | 100.0 | 83.5 | |
| Model-2 | 30.7 | 50.0 | 24.9 | 33.2 | 71.6 | 100.0 | 83.5 | |
| LSTM | s2v | 38.5 | 53.9 | 46.8 | 50.1 | 72.2 | 76.8 | 74.4 |
| Model-1 | 16.6 | 54.3 | 24.4 | 33.7 | 71.6 | 100.0 | 83.5 | |
| Model-2 | 16.6 | 51.6 | 23.9 | 32.7 | 71.6 | 100.0 | 83.5 | |
| GRU | s2v | 34.1 | 52.9 | 48.8 | 50.8 | 73.5 | 76.5 | 75.0 |
| Model-1 | 26.1 | 56.5 | 25.4 | 35.0 | 71.6 | 100.0 | 83.5 | |
| Model-2 | 16.6 | 51.5 | 24.9 | 33.6 | 71.6 | 100.0 | 83.5 | |
| Multi-task Learning | s2v | 35.0 | 17.0 | 51.0 | 26.0 | 67.0 | 95.0 | 78.0 |
| s2v_Model-2 | 36.0 | 18.0 | 56.0 | 27.0 | 66.0 | 94.0 | 77.0 | |
| HCU_run1 | 53.1 | 56.7 | 58.9 | 57.7 | 77.7 | 53.8 | 63.6 | |
| smap_run1 | 42.0 | 48.3 | 54.1 | 51.0 | 72.5 | 98.3 | 83.5 | |
| RSL16GBD_run2 | 55.1 | 49.4 | 96.1 | 65.3 | 73.9 | 93.0 | 82.4 | |
| RSL16GBD_run3 | 55.3 | 49.7 | 96.1 | 65.5 | 74.0 | 92.7 | 82.3 | |
| NTTCS_run2 | 58.4 | 55.4 | 80.1 | 65.5 | 79.1 | 77.3 | 78.2 | |
| NTTCS_run3 | 58.4 | 53.9 | 84.0 | 65.7 | 78.9 | 82.6 | 80.7 | |
| KIT16_run2 | 49.8 | 50.6 | 68.8 | 58.3 | 75.0 | 85.7 | 80.0 | |
| OKSAT_run1 | 53.1 | 48.7 | 88.3 | 62.8 | 74.0 | 86.8 | 79.9 | |
| OKSAT_run3 | 45.1 | 50.1 | 86.1 | 63.4 | 75.6 | 84.0 | 79.6 | |
| Name | Method | Difference for Each Run |
|---|---|---|
| HCU_run1 | RNN, Multi-Layer Perceptron | Minimize MSE |
| HCU_run3 | Minimize MSE and average of four models | |
| smap_run1 | Neural Conversation Model, SVM | Use both outputs of Encoder/Decoder |
| RSL16BD_run1 | Word2Vec | Use breakdown rate of the develop data |
| RSL16BD_run2 | Use breakdown rate for each pattern | |
| RSL16BD_run3 | Combination of run1 and run2 | |
| NTTCS_run1 | Extra Trees Regression | Change features and training data |
| NTTCS_run2 | ||
| NTTCS_run3 | ||
| KIT16_run2 | Multi-Layer Perceptron, LSTM, Recurrent Convolutional Neural Networks | Type of dialogue breakdown was not used |
| OKSAT_run1 | Rule | Change rule |
| OKSAT_run3 | ||
| kanolab_run1 | Word2Vec, Rule | Liberalize threshold for judgment |
| ML | Feature | Cos | JSD | MSE |
|---|---|---|---|---|
| CCA | s2v | 0.2306 | 1.5881 | 13.9775 |
| Model-1 | 0.5165 | 0.6127 | 1.6238 | |
| Model-2 | 0.5335 | 0.6431 | 0.5197 | |
| LR | s2v | 0.8116 | 0.1727 | 0.1305 |
| Model-1 | 0.8113 | 0.1735 | 0.1308 | |
| Model-2 | 0.8101 | 0.1735 | 0.1310 | |
| RNN | s2v | 0.8189 | 0.1650 | 0.1275 |
| Model-1 | 0.8276 | 0.1598 | 0.1232 | |
| Model-2 | 0.8221 | 0.1630 | 0.1261 | |
| LSTM | s2v | 0.8229 | 0.1628 | 0.1260 |
| Model-1 | 0.8275 | 0.1604 | 0.1241 | |
| Model-2 | 0.8270 | 0.1610 | 0.1249 | |
| GRU | s2v | 0.8240 | 0.1623 | 0.1256 |
| Model-1 | 0.8297 | 0.1590 | 0.1230 | |
| Model-2 | 0.8259 | 0.1614 | 0.1250 |
| ML | Feature | Cos | JSD | MSE |
|---|---|---|---|---|
| CCA | s2v | 0.4470 | 0.8176 | 2.4040 |
| Model-1 | 0.5774 | 0.4688 | 0.8583 | |
| Model-2 | 0.5242 | 0.7380 | 0.7088 | |
| LR | s2v | 0.8592 | 0.1326 | 0.1051 |
| Model-1 | 0.8603 | 0.1326 | 0.1048 | |
| Model-2 | 0.8578 | 0.1346 | 0.1056 | |
| RNN | s2v | 0.8781 | 0.1211 | 0.0985 |
| Model-1 | 0.8750 | 0.1247 | 0.1014 | |
| Model-2 | 0.8784 | 0.1219 | 0.0982 | |
| LSTM | s2v | 0.8838 | 0.1181 | 0.0966 |
| Model-1 | 0.8742 | 0.1254 | 0.1028 | |
| Model-2 | 0.8804 | 0.1212 | 0.0983 | |
| GRU | s2v | 0.8819 | 0.1192 | 0.0974 |
| Model-1 | 0.8740 | 0.1256 | 0.1029 | |
| Model-2 | 0.8798 | 0.1212 | 0.0982 |
| ML | Feature | Cos | JSD | MSE |
|---|---|---|---|---|
| CCA | s2v | 0.2618 | 0.9637 | 2.7551 |
| Model-1 | 0.3812 | 0.8584 | 2.1685 | |
| Model-2 | 0.5060 | 0.6977 | 0.6770 | |
| LR | s2v | 0.7828 | 0.1954 | 0.1375 |
| Model-1 | 0.7821 | 0.1955 | 0.1377 | |
| Model-2 | 0.7826 | 0.1963 | 0.1376 | |
| RNN | s2v | 0.7028 | 0.2593 | 0.1773 |
| Model-1 | 0.8020 | 0.1802 | 0.1334 | |
| Model-2 | 0.7934 | 0.1848 | 0.1367 | |
| LSTM | s2v | 0.7207 | 0.2447 | 0.1689 |
| Model-1 | 0.8077 | 0.1775 | 0.1317 | |
| Model-2 | 0.8050 | 0.1788 | 0.1326 | |
| GRU | s2v | 0.7049 | 0.2556 | 0.1762 |
| Model-1 | 0.8069 | 0.1777 | 0.1318 | |
| Model-2 | 0.8012 | 0.1809 | 0.1341 |
Publisher’s Note: MDPI stays neutral with regard to jurisdictional claims in published maps and institutional affiliations. |
© 2022 by the authors. Licensee MDPI, Basel, Switzerland. This article is an open access article distributed under the terms and conditions of the Creative Commons Attribution (CC BY) license (https://creativecommons.org/licenses/by/4.0/).
Share and Cite
Matsumoto, K.; Sasayama, M.; Yoshida, M.; Kita, K.; Ren, F. Emotion Analysis and Dialogue Breakdown Detection in Dialogue of Chat Systems Based on Deep Neural Networks. Electronics 2022, 11, 695. https://doi.org/10.3390/electronics11050695
Matsumoto K, Sasayama M, Yoshida M, Kita K, Ren F. Emotion Analysis and Dialogue Breakdown Detection in Dialogue of Chat Systems Based on Deep Neural Networks. Electronics. 2022; 11(5):695. https://doi.org/10.3390/electronics11050695
Chicago/Turabian StyleMatsumoto, Kazuyuki, Manabu Sasayama, Minoru Yoshida, Kenji Kita, and Fuji Ren. 2022. "Emotion Analysis and Dialogue Breakdown Detection in Dialogue of Chat Systems Based on Deep Neural Networks" Electronics 11, no. 5: 695. https://doi.org/10.3390/electronics11050695
APA StyleMatsumoto, K., Sasayama, M., Yoshida, M., Kita, K., & Ren, F. (2022). Emotion Analysis and Dialogue Breakdown Detection in Dialogue of Chat Systems Based on Deep Neural Networks. Electronics, 11(5), 695. https://doi.org/10.3390/electronics11050695