We introduce the process of creating JN-Logo, a comparison of JN-Logo and related databases, and a visual analysis of JN-Logo.
3.1. Methodology
This section describes the steps to construct the dataset: acquisition, filtering and annotation.
3.1.1. Collecting
LogoNews has more than 50 popular categories of content, including more than 90 different countries and regions and 49 design agencies. LogoPond can find the most popular logo designs on the Internet today. It mainly provides mock-up logo design videos and other services. Its biggest feature is to update the logo designs and other works uploaded by some artists or designers every month. The website “
www.zhengbang.com.cn” (accessed on 25 March 2021) includes China’s top 500 companies, such as CCTV, Bank of China, China Southern Power Grid, and other companies, as well as Internet companies such as Baidu and Alibaba. It contains more than 50 industry categories, such as the Internet, new technology telecommunications, aviation, automobiles, home appliances, central enterprises, real estate, banking, medical and pharmaceuticals, road transportation, logistics, corporate services, consulting, etc. Thus, we can search for original domestic logos at this website. To increase the diversity of the dataset, we also grabbed logo images from categories such as “Internet company logo”, “cultural industry company logo”, “cosmetic brand logo” and “food brand logo” from online engines such as “Baidu.com”. We also supplemented information by photographing storefronts, company signs and logos. Through the above methods, we have collected a large number of pictures from different countries, industries, classifications and graphics, and with rich colors.
3.1.2. Interviews and Questionnaires
This section discusses annotations through interviews, questionnaires and data cleaning. To obtain the stylistic attributes of the logo images, this paper conducted a questionnaire to observe the participants’ preferences for style. The questionnaire contained 50 random logo images and 2 questions, as shown in
Table 1:
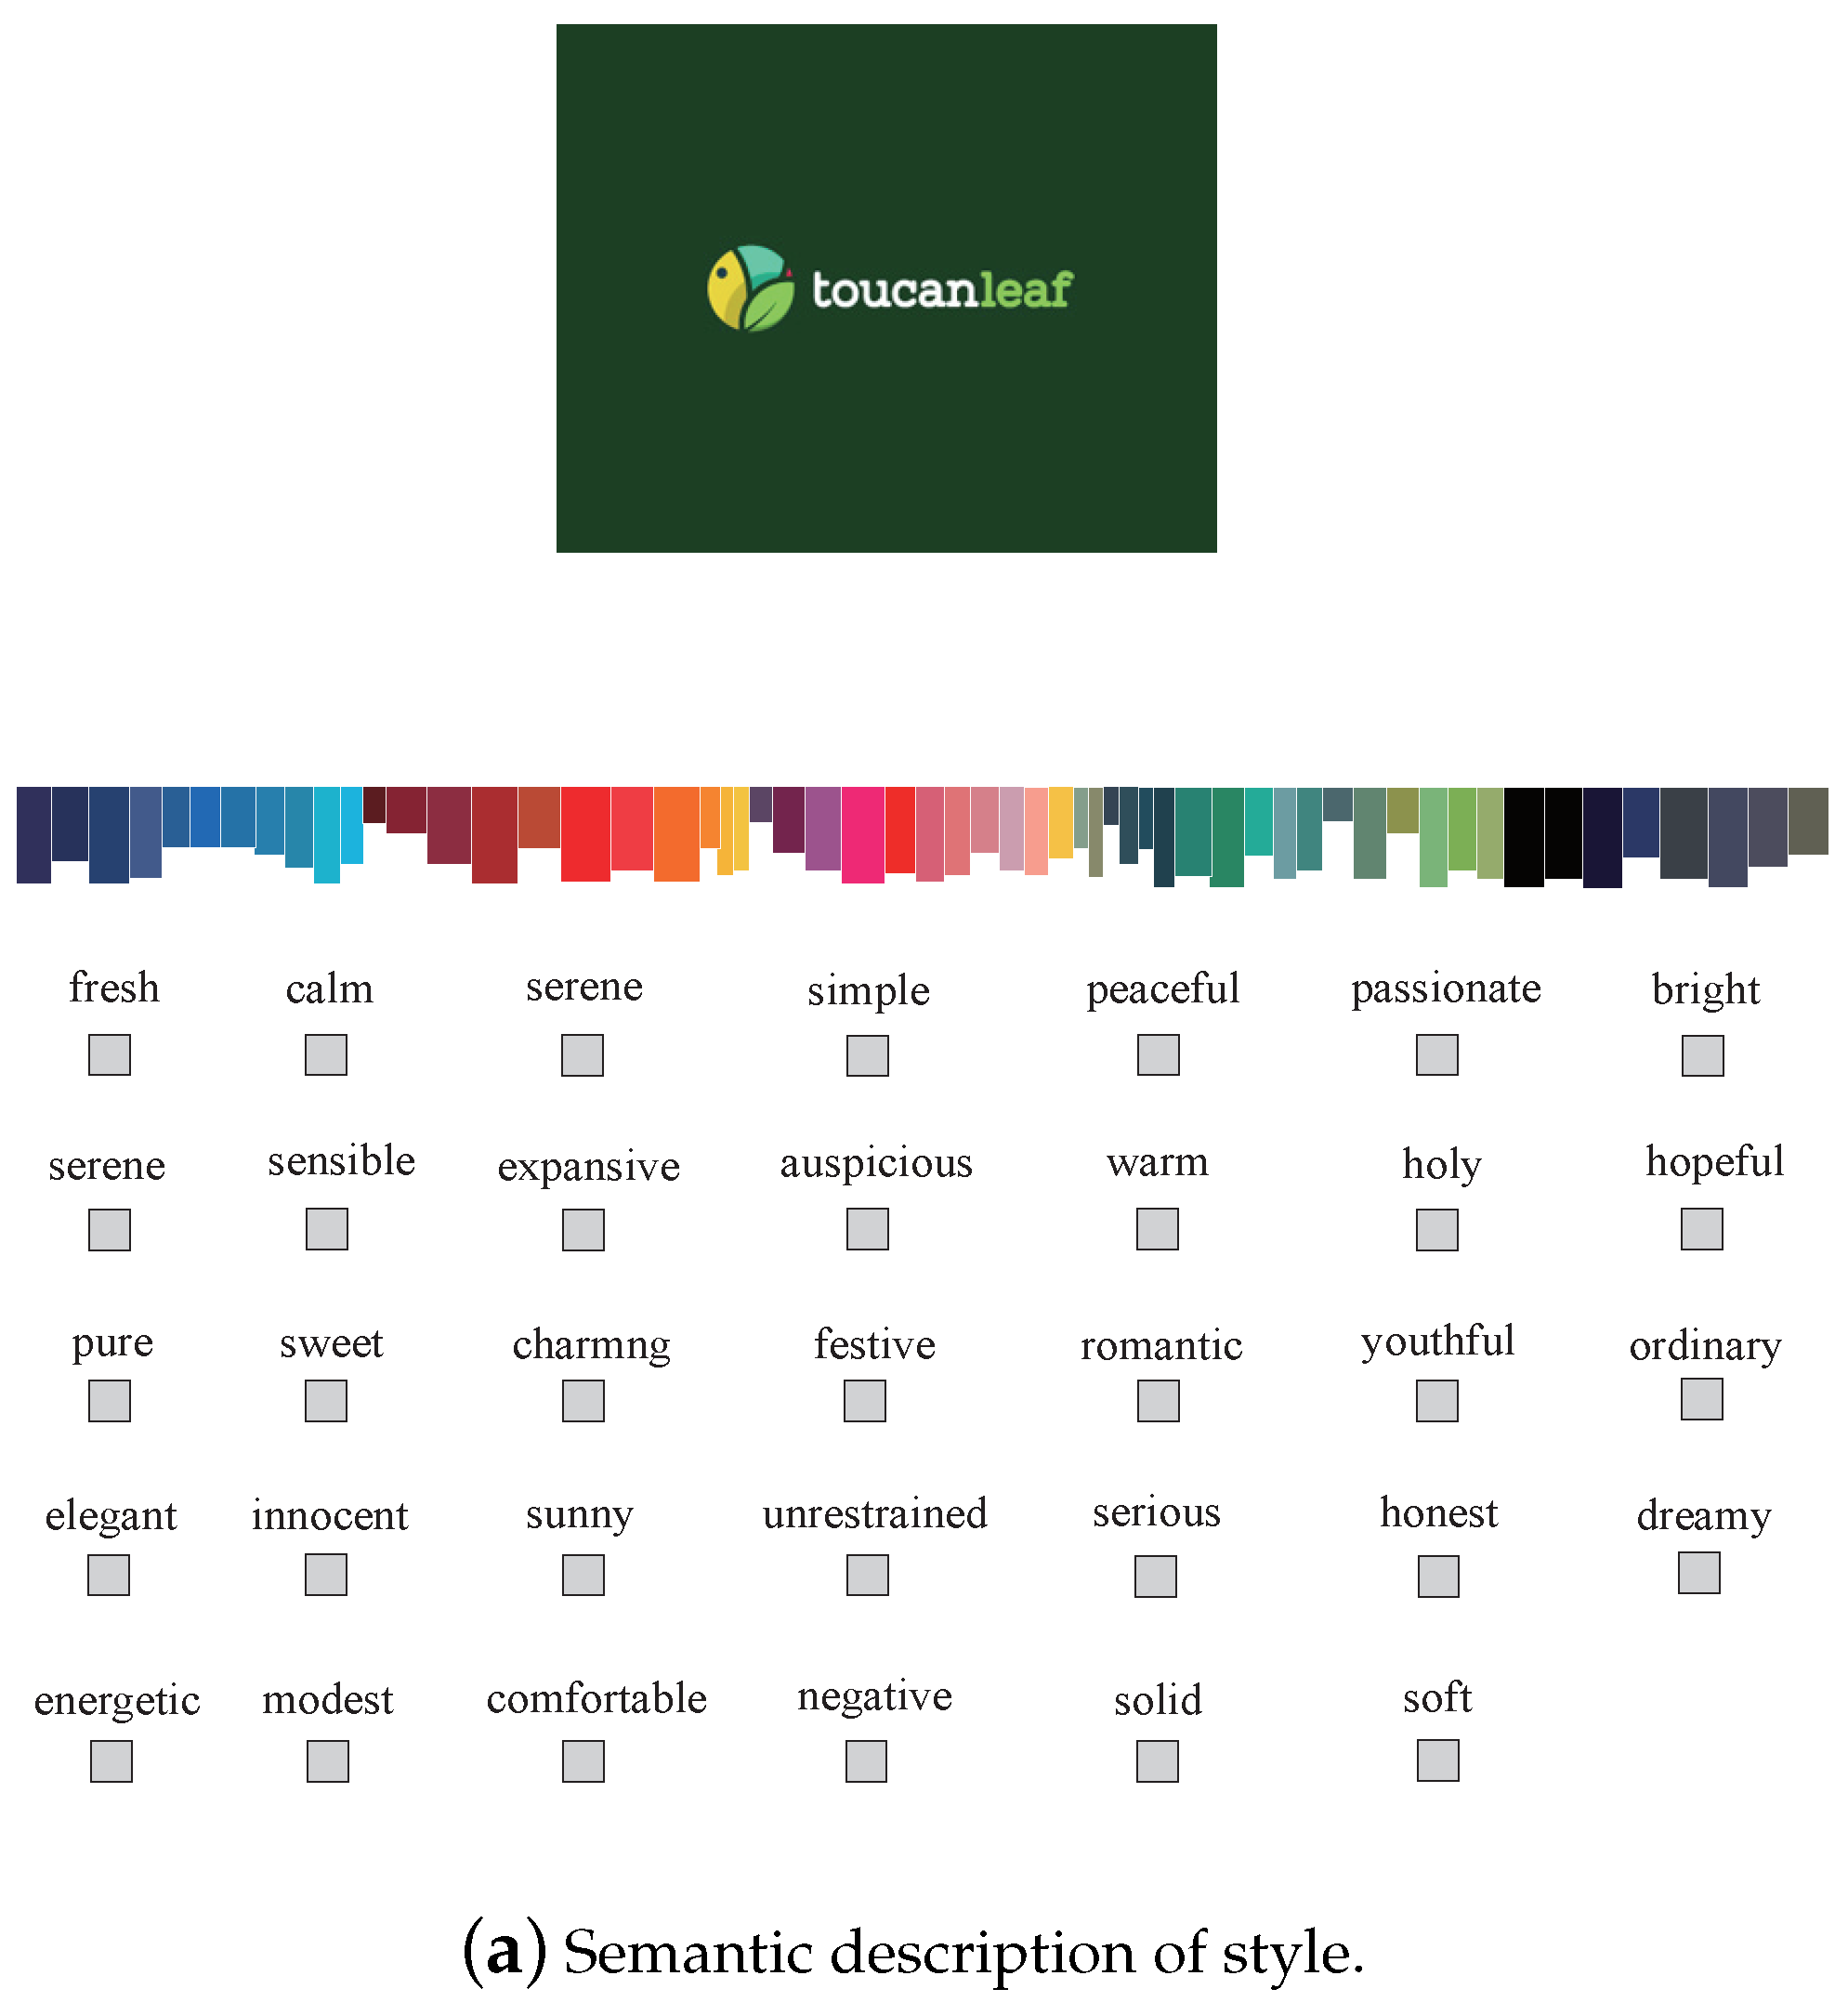
According to the correlation between color and psychological feeling, we set dozens of labels with regard to Question 1. The content of the labels combines people’s psychological attributes, emotional attributes and aesthetic preferences. Finally, we evaluated style preference. Question 2 aims to understand people’s aesthetic preferences.
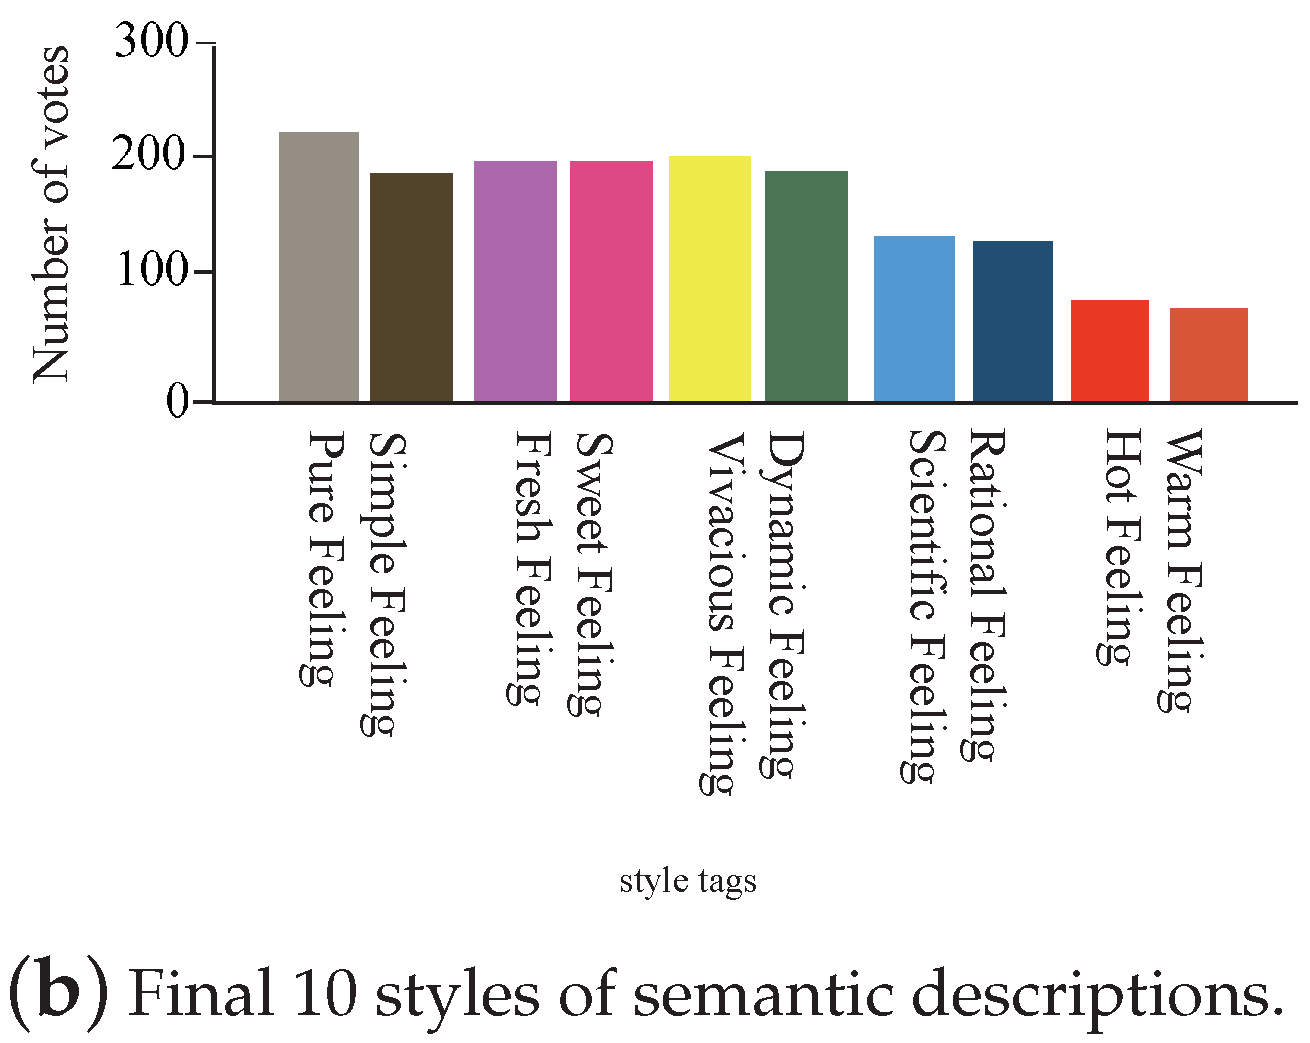
The content of the labeling is shown in
Figure 1. It can be seen that the 10 most-appearing style descriptions were finally obtained through voting.
3.1.3. Cleaning
We obtained valid questionnaires from training subjects. This preliminary work was used for data cleaning. Then, to ensure data quality, the data were cleaned before labeling. We sanitized the data to ensure that the logo images were the appropriate size. In particular, we removed the following logo images: (a) images with length or height less than 300 pixels or extreme aspect ratios and (b) images with extreme aspect ratios.
3.1.4. Annotation
In JN-Logo, we provide three types of annotations: aesthetic, style and semantics. We chose 100 random images and asked subjects to annotate the images. In the annotation system, one image is randomly selected from the logo dataset at a time, each of which conforms to the original aspect ratio.
A total of 14,917 images were set and divided into image quality of 0–5 points and style attributes of 1–6. Approximately 150 people participated in marking during the scoring process. Finally, 6 quality scores, 6 style attributes and 11 style descriptions were obtained. With our scoring system, each subject annotated 100 images, and 150 people took turns annotating 14,917 images. The final scores for aesthetics, style and semantics were obtained.
3.2. JN-Logo Visual Analysis
This section analyzes the score distribution and style classification distribution of the JN-Logo data. Score distribution and style classification distribution can solve two problems: (1) image quality score can learn the aesthetic preferences of landmark images, and (2) the distribution of style classification can learn style preferences and semantic descriptions.
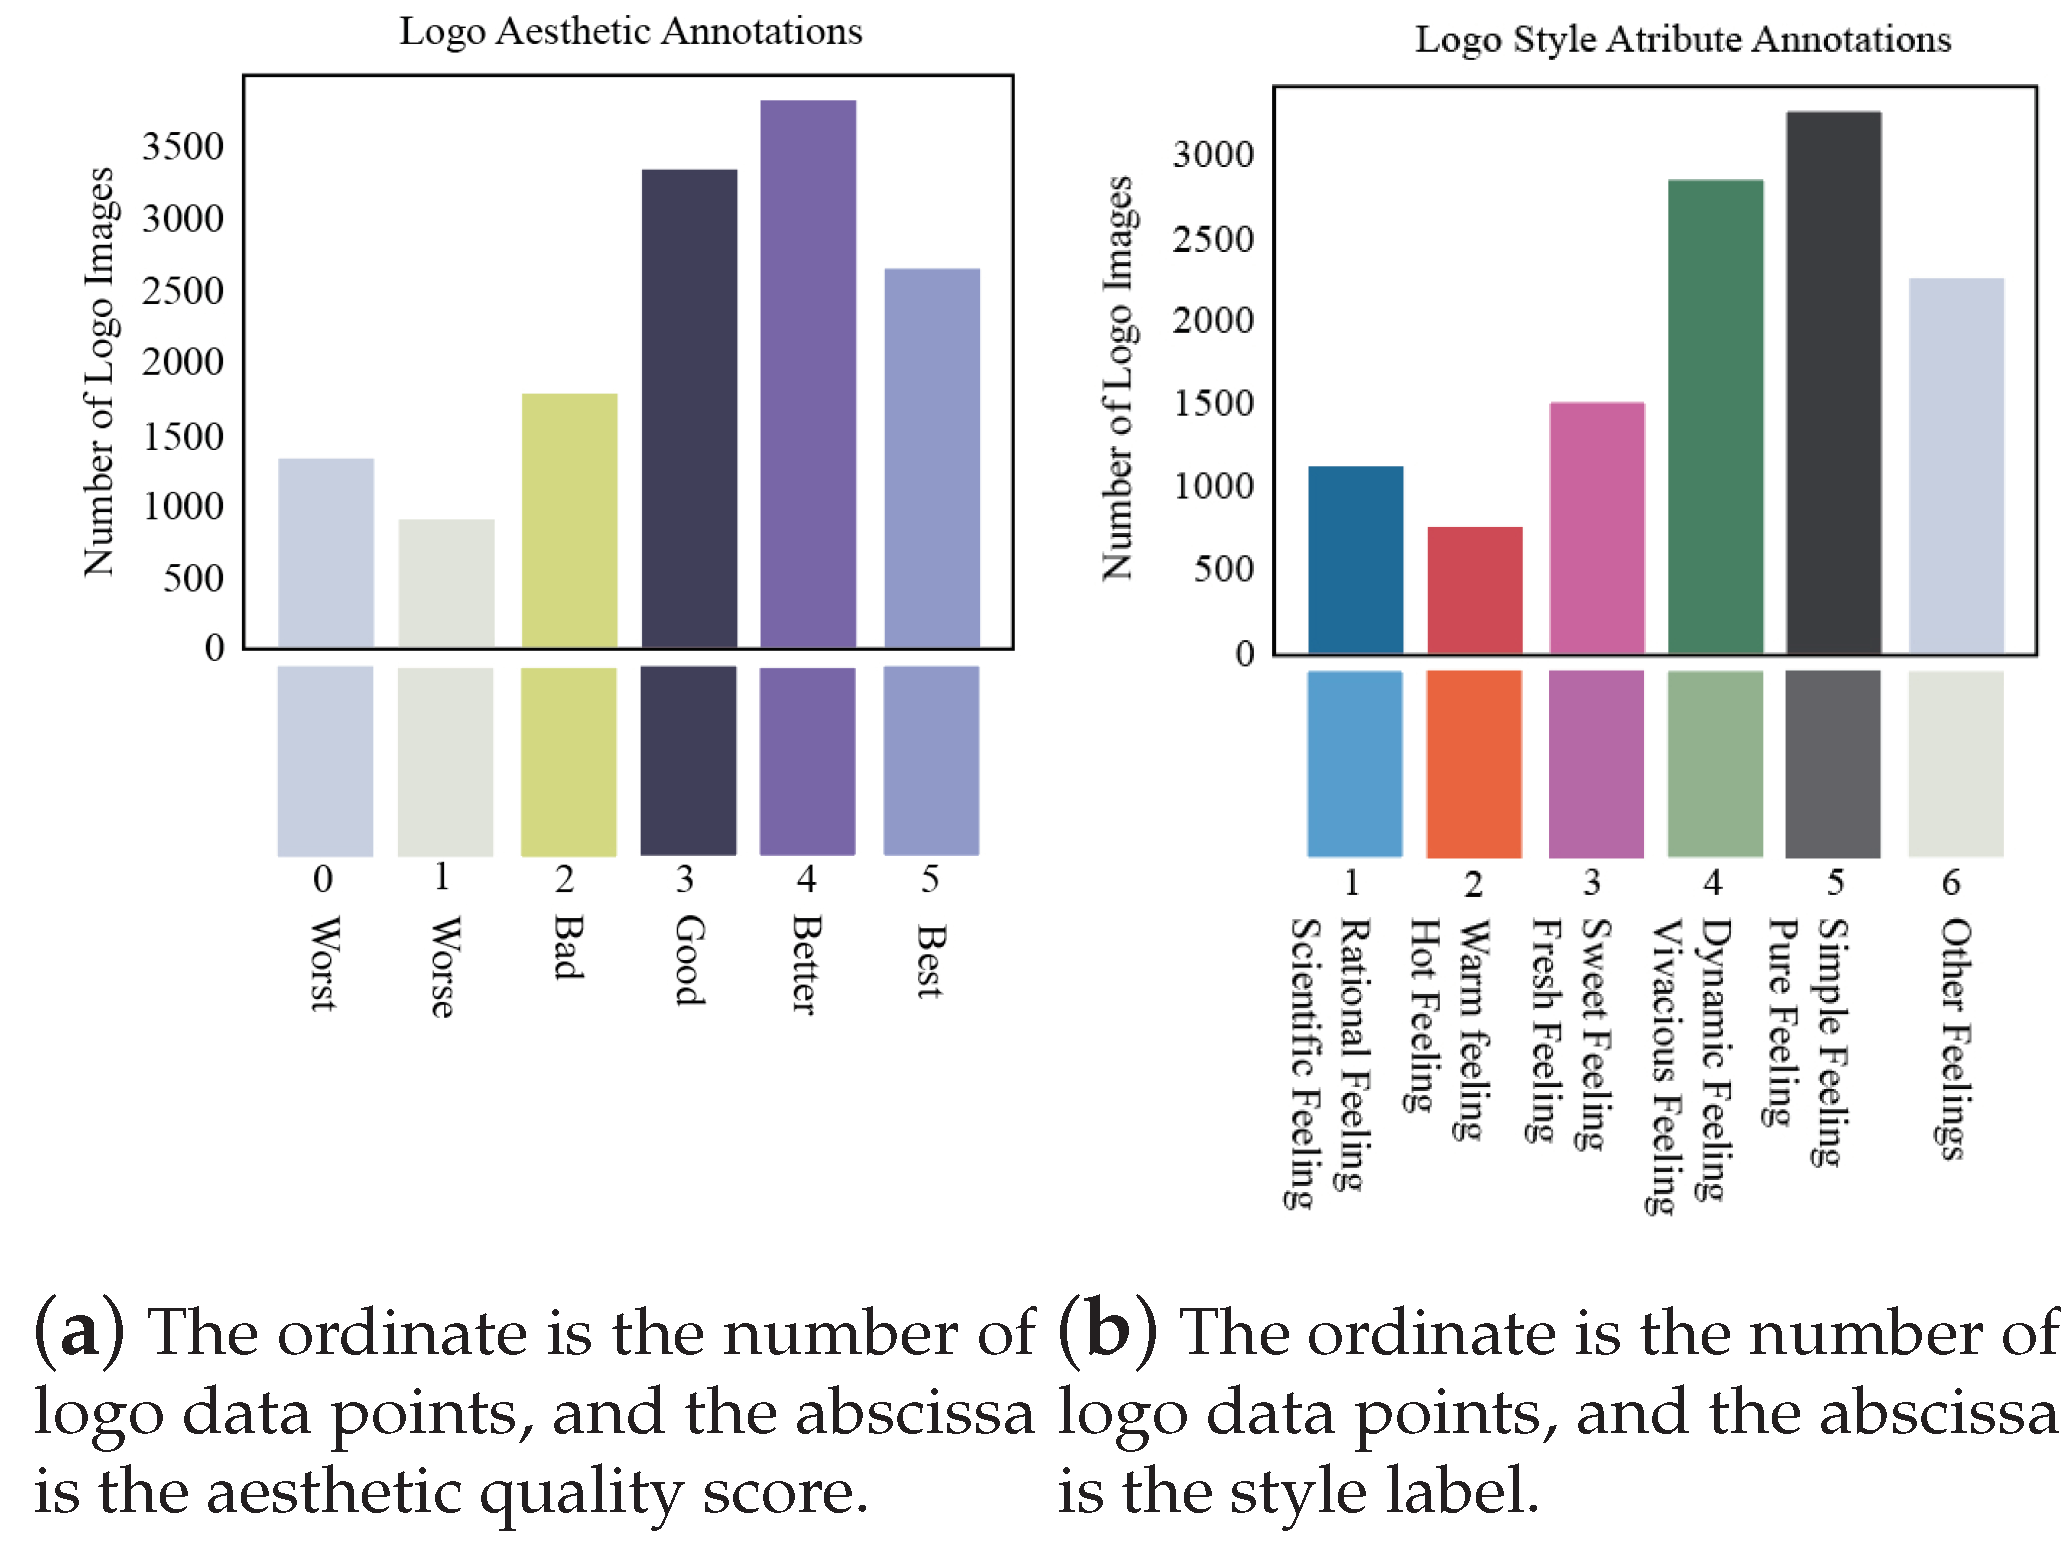
Figure 2 shows the amount of data for aesthetic ratings and the amount of data for style attributes.
It can be seen from
Figure 2b that the number of data points for style attributes is mainly concentrated in Attribute 1 and Attribute 5. Further, it can be seen from the histogram that about 12 kinds of blue, such as dark blue and light blue, account for a large proportion in Attribute 1. From dark red, red, orange, and yellow, about 10 colors account for a large proportion in Attribute 2. From purplish red, rose red, light pink, light yellow, and mint green, about 13 colors account for the largest proportion in Attribute 3; it has the most mixed colors. In attribute 4, green has a large proportion, and about 13 green color systems have a large proportion. In attribute 5, the proportion of color distribution is relatively balanced, and about 9 different dark colors account for a large proportion. As shown in
Figure 2a, the scoring data points are mainly concentrated between 3–5 points, with 4 points being the most popular. The category with picture quality of 1 point has the smallest number of pictures, about 800. From the perspective of database construction, this trend conforms to a uniform distribution. Quality score data and style attribute data are generally in line with the actual situation, and there is no extreme class imbalance problem, which means the dataset can meet the training requirements and can be used for classification and training algorithms.
As shown in
Figure 2, the scoring data points are mainly concentrated between 3–5 points, and the logo data with 4 points is the most popular.
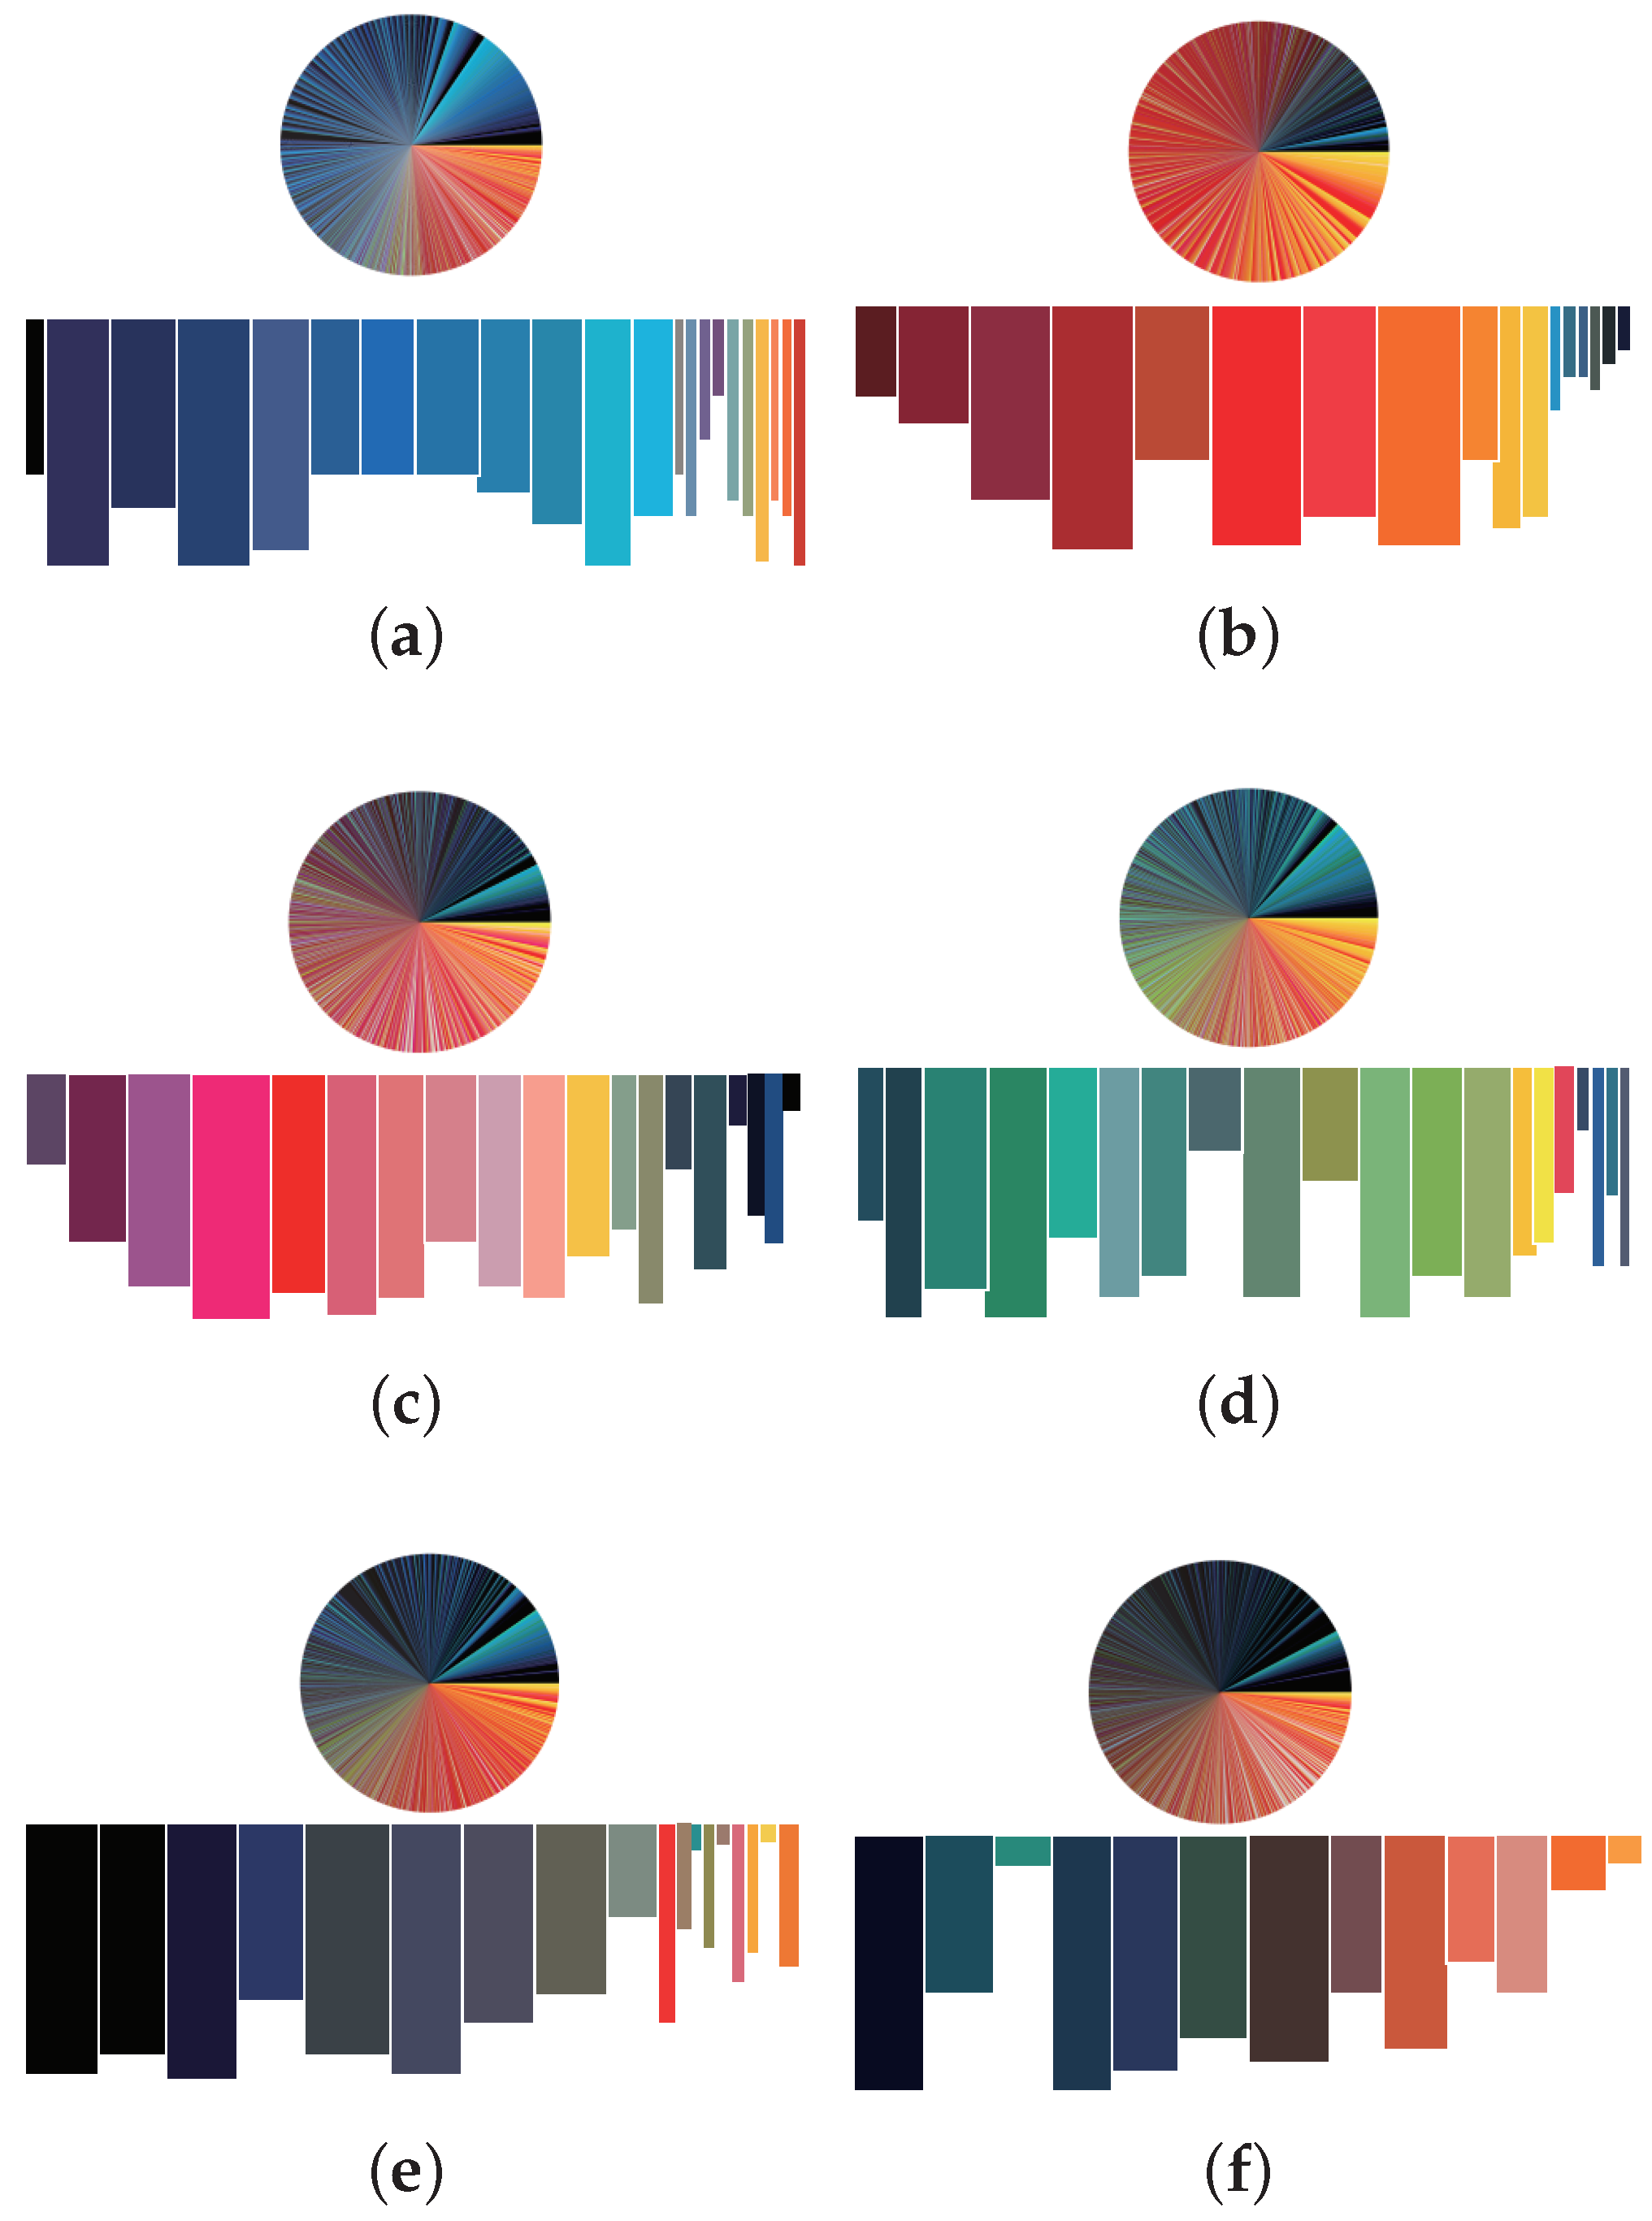
Figure 3 shows the color distribution of 6 style attributes and 11 style descriptions.
A circle chart is a visualization of color data, and a histogram is a visualization of color value and specific gravity distribution extracted from the circle chart.
Figure 4 shows a visualization of 57 colors. We extracted a total of 57 dominant colors from the data.
We performed statistical analysis of the colors in the six data styles of the style annotation. This can be seen in
Figure 2 and
Figure 3.
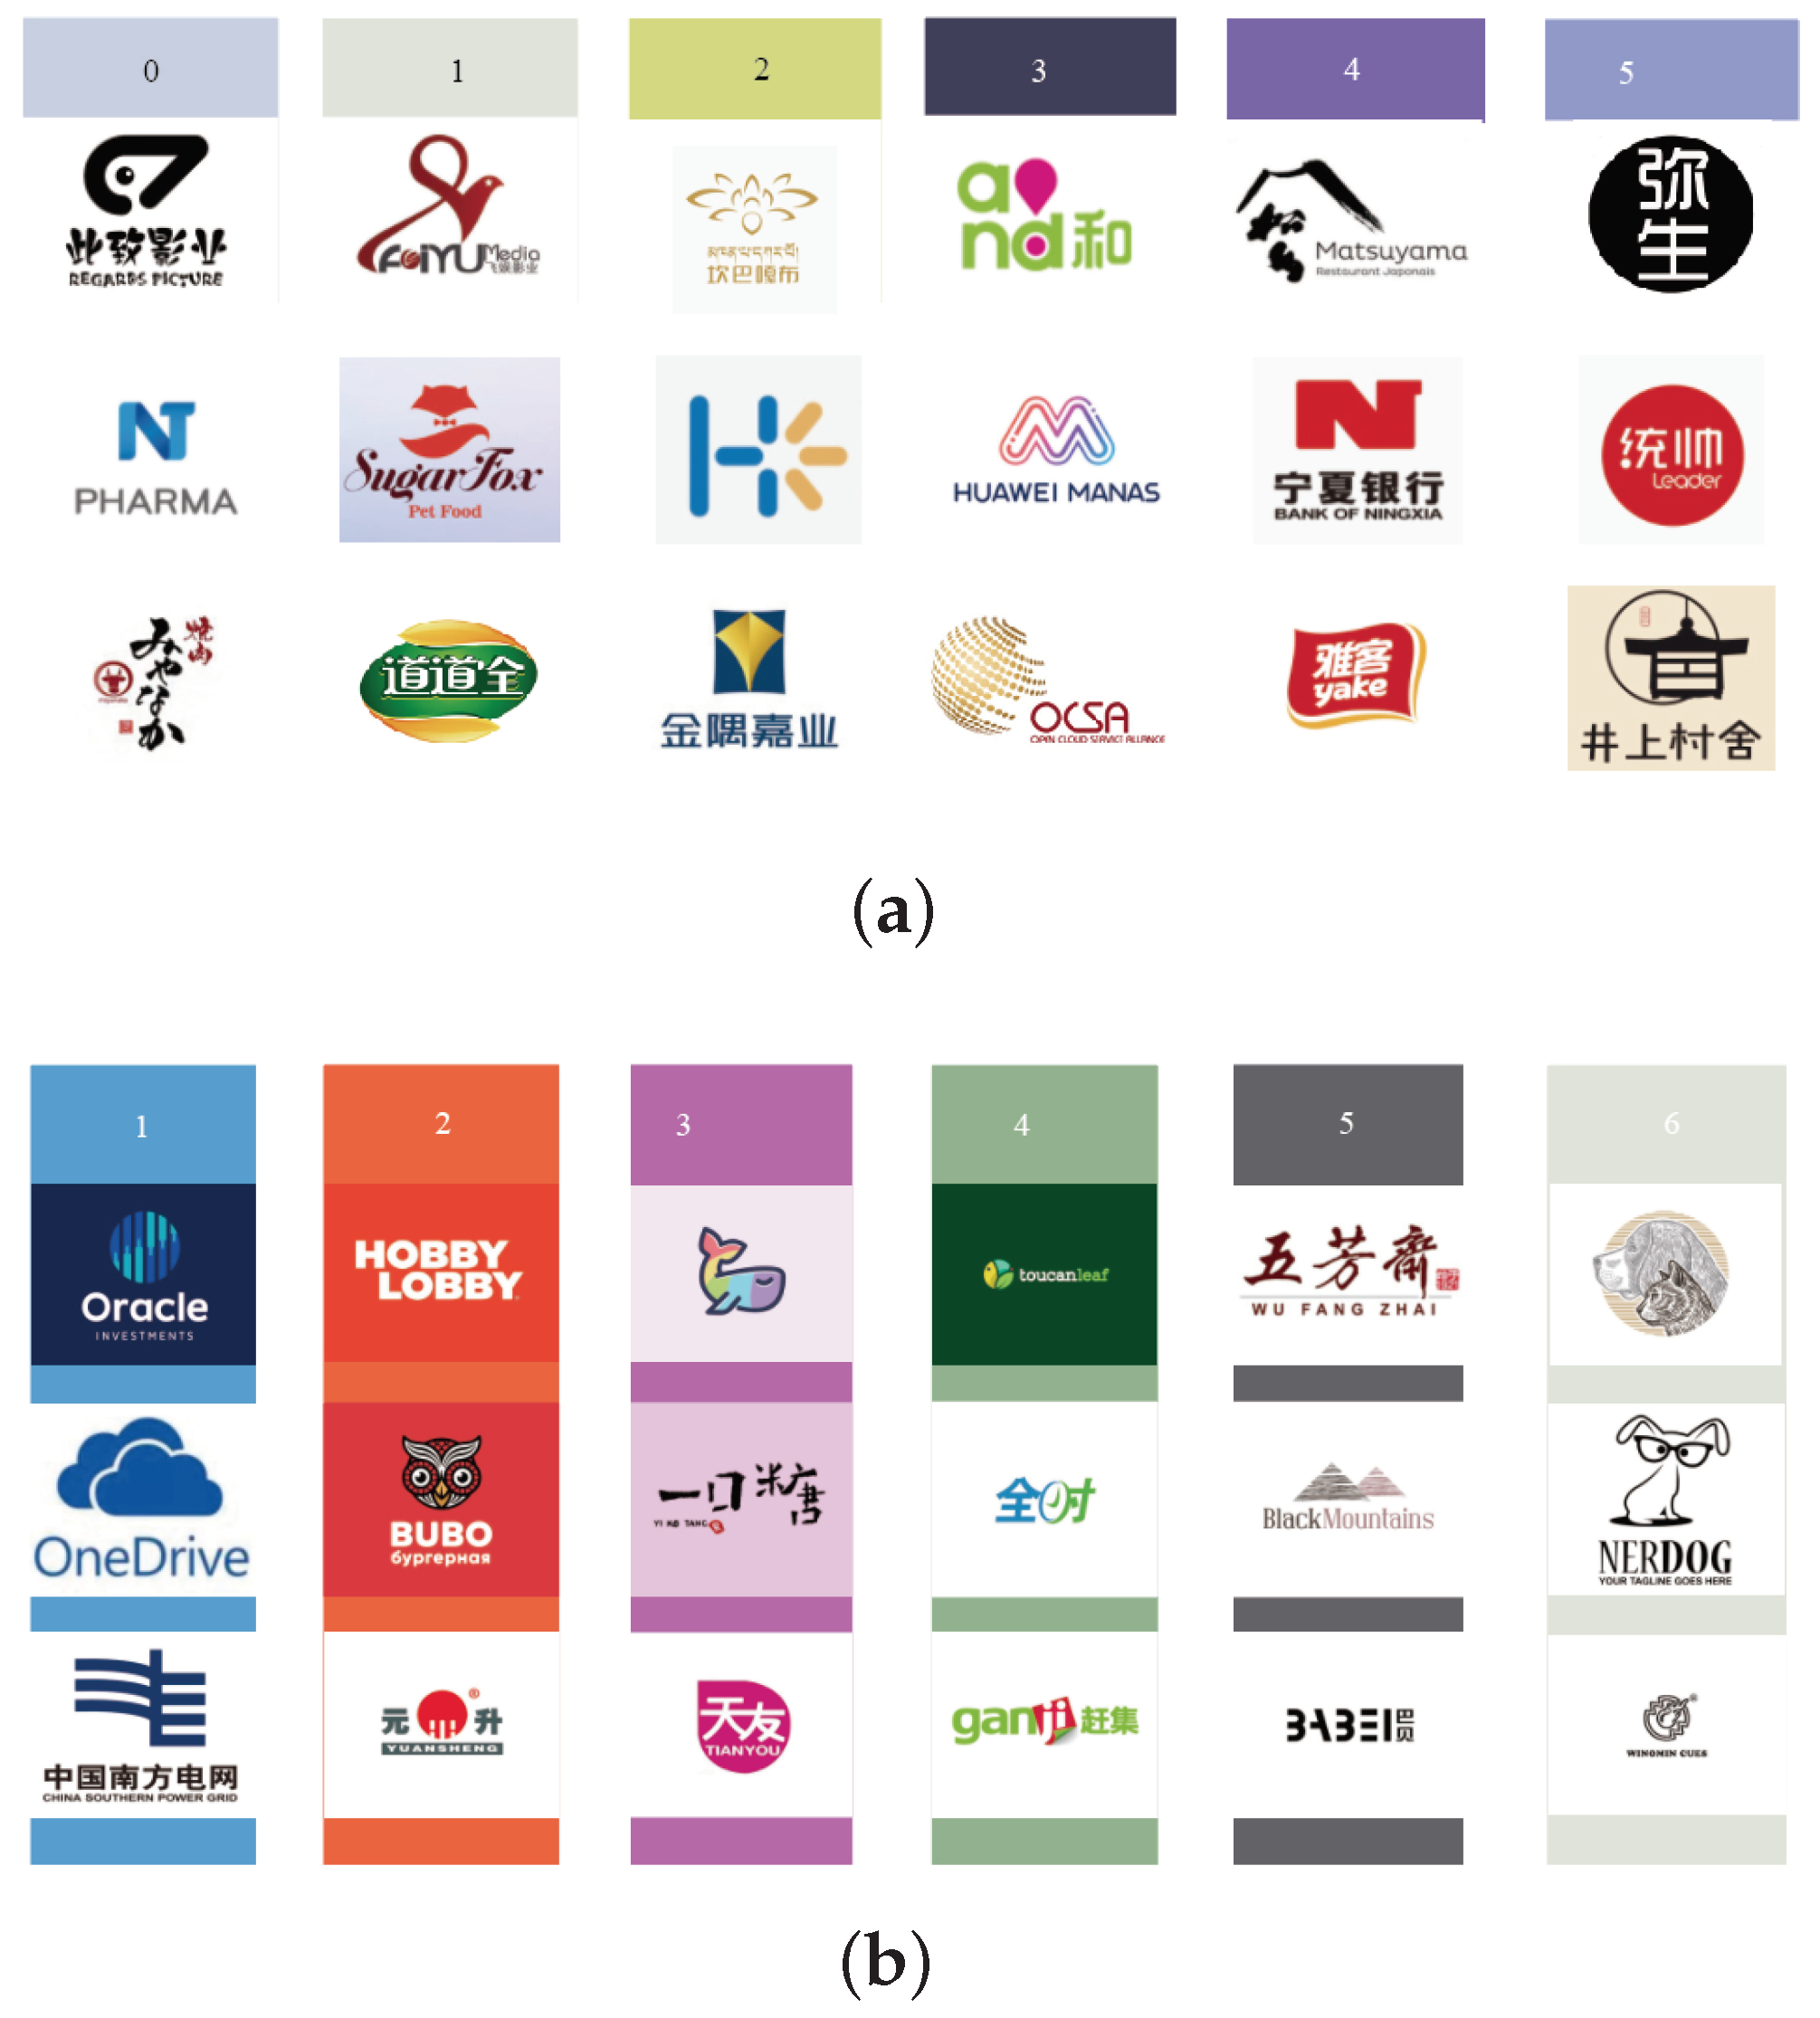
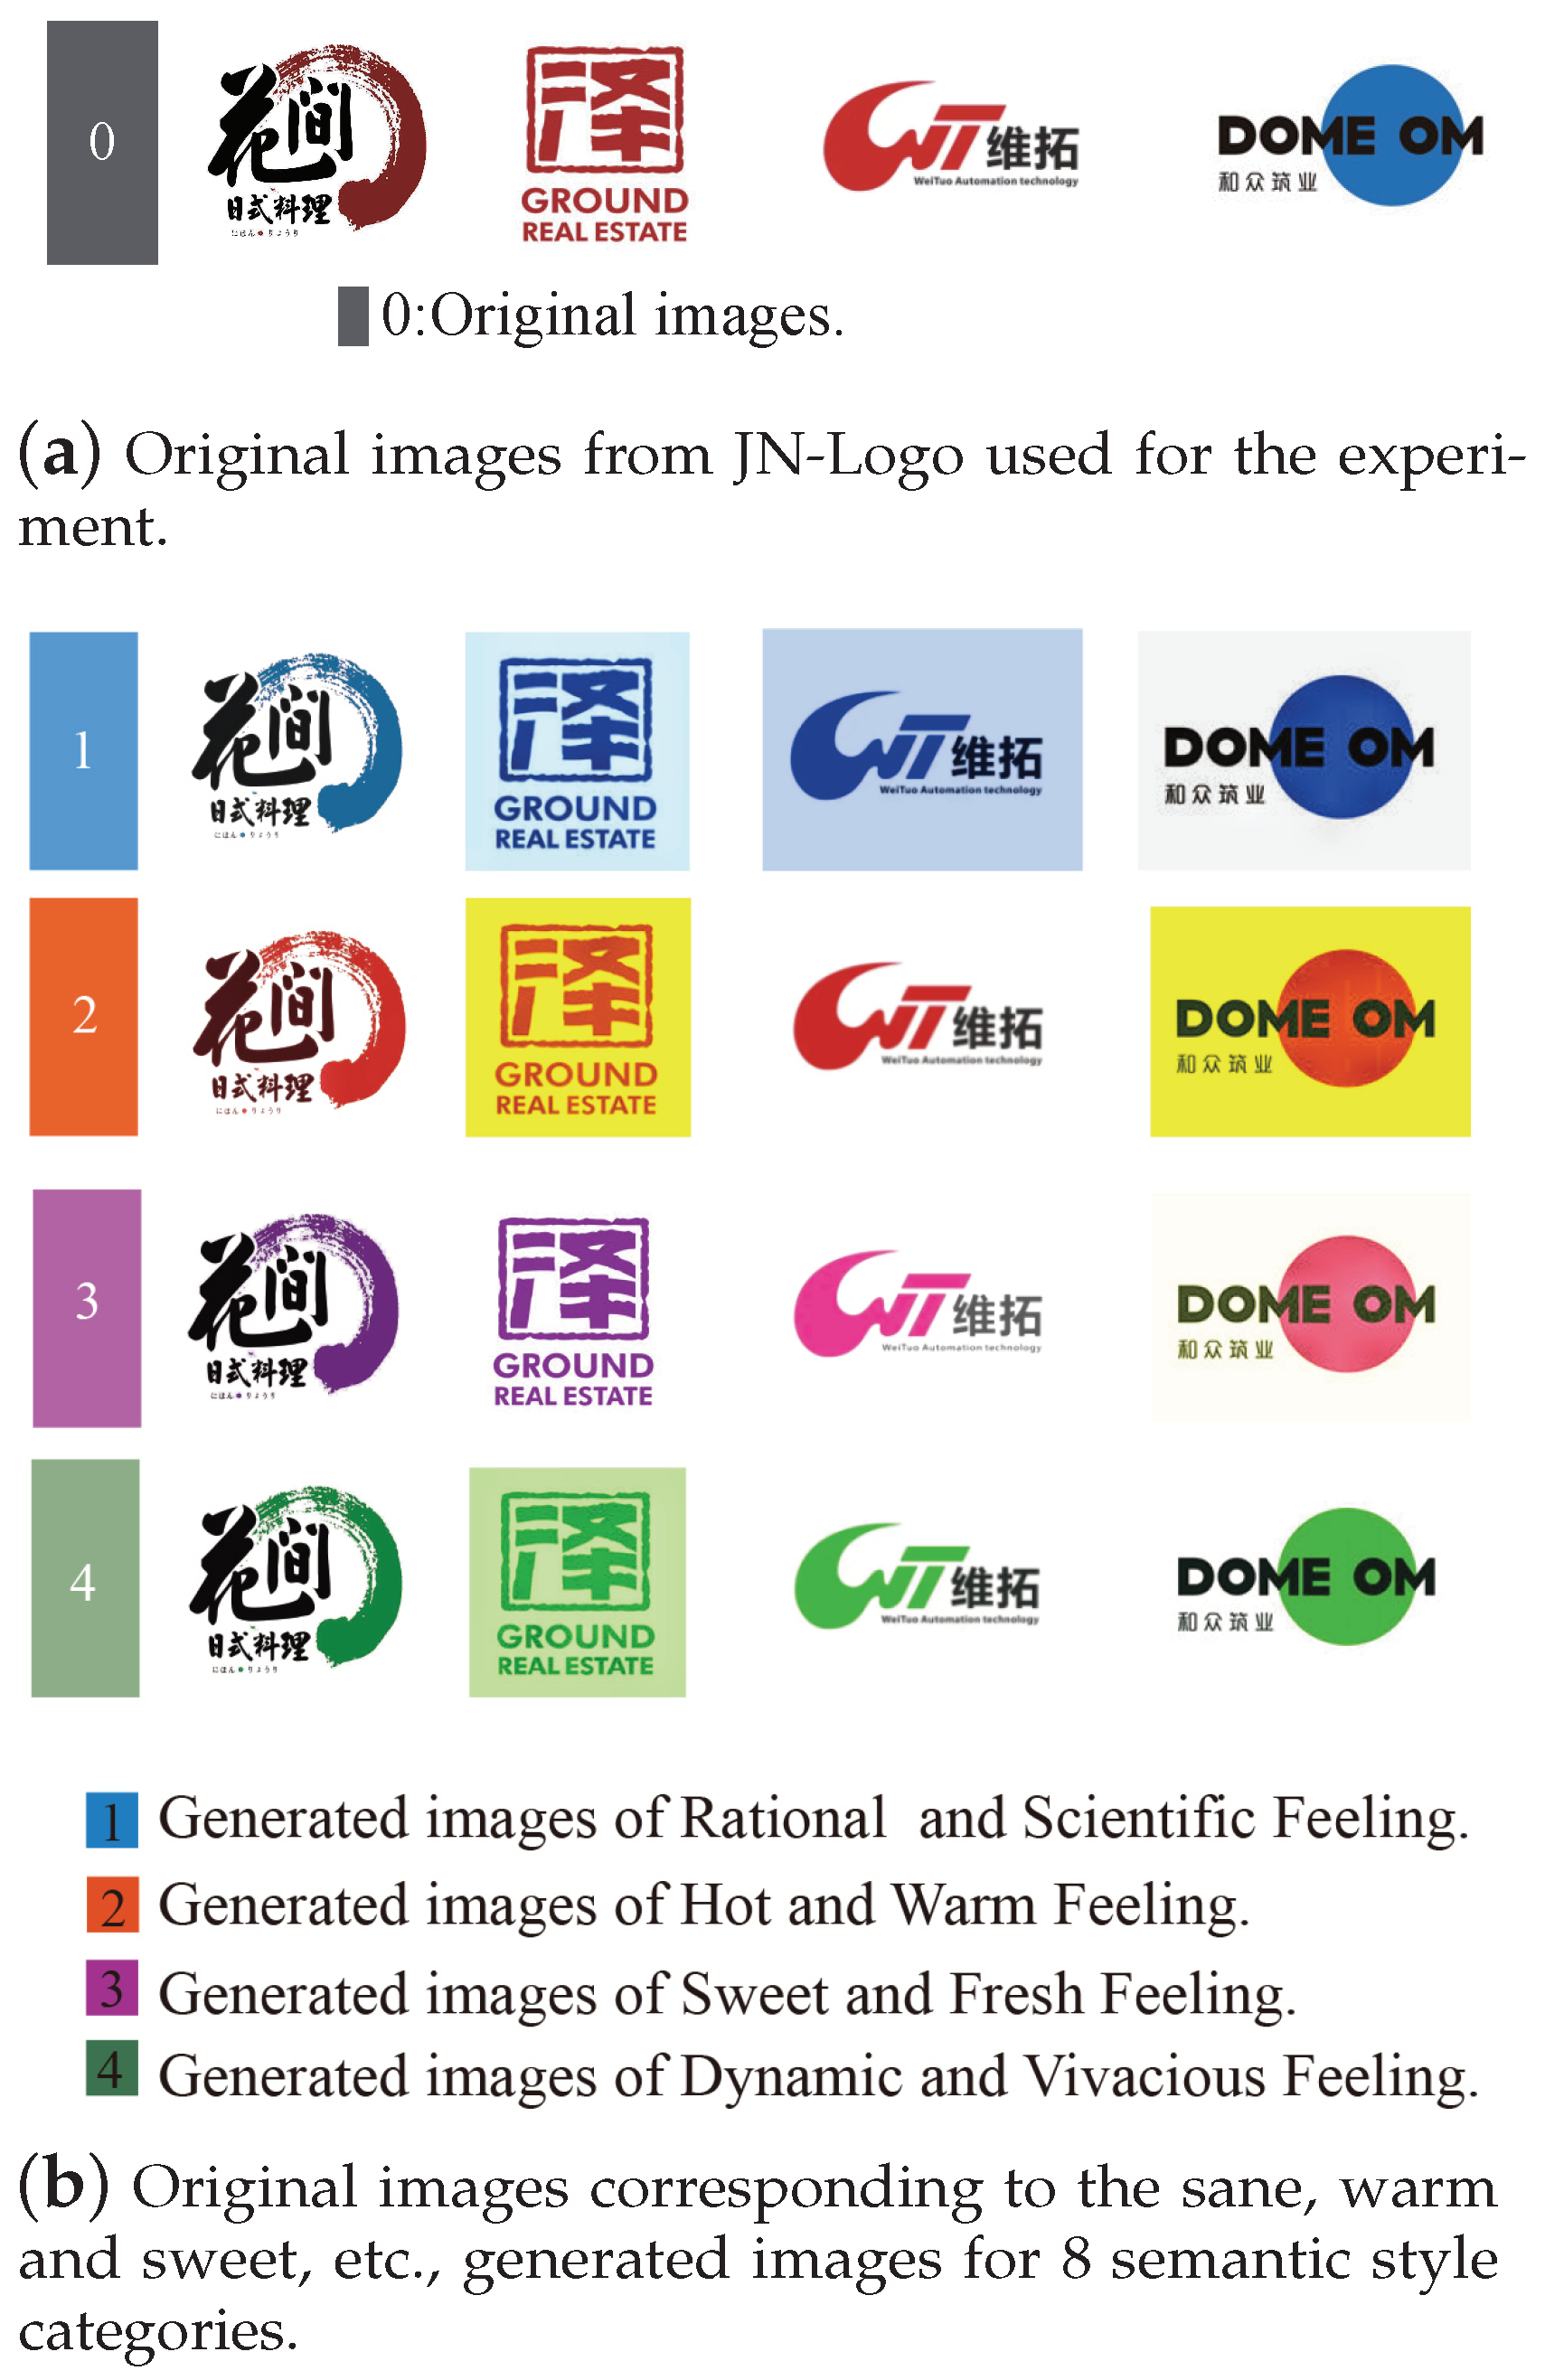
Finally,
Figure 5 shows the image quality score image category (
Figure 5a), and the style attribute image category (
Figure 5b) with style semantic description.
A score of 0–5 is shown in
Figure 5a, representing worst, worse, bad, good, better and best, respectively, with 5 points being the highest score.
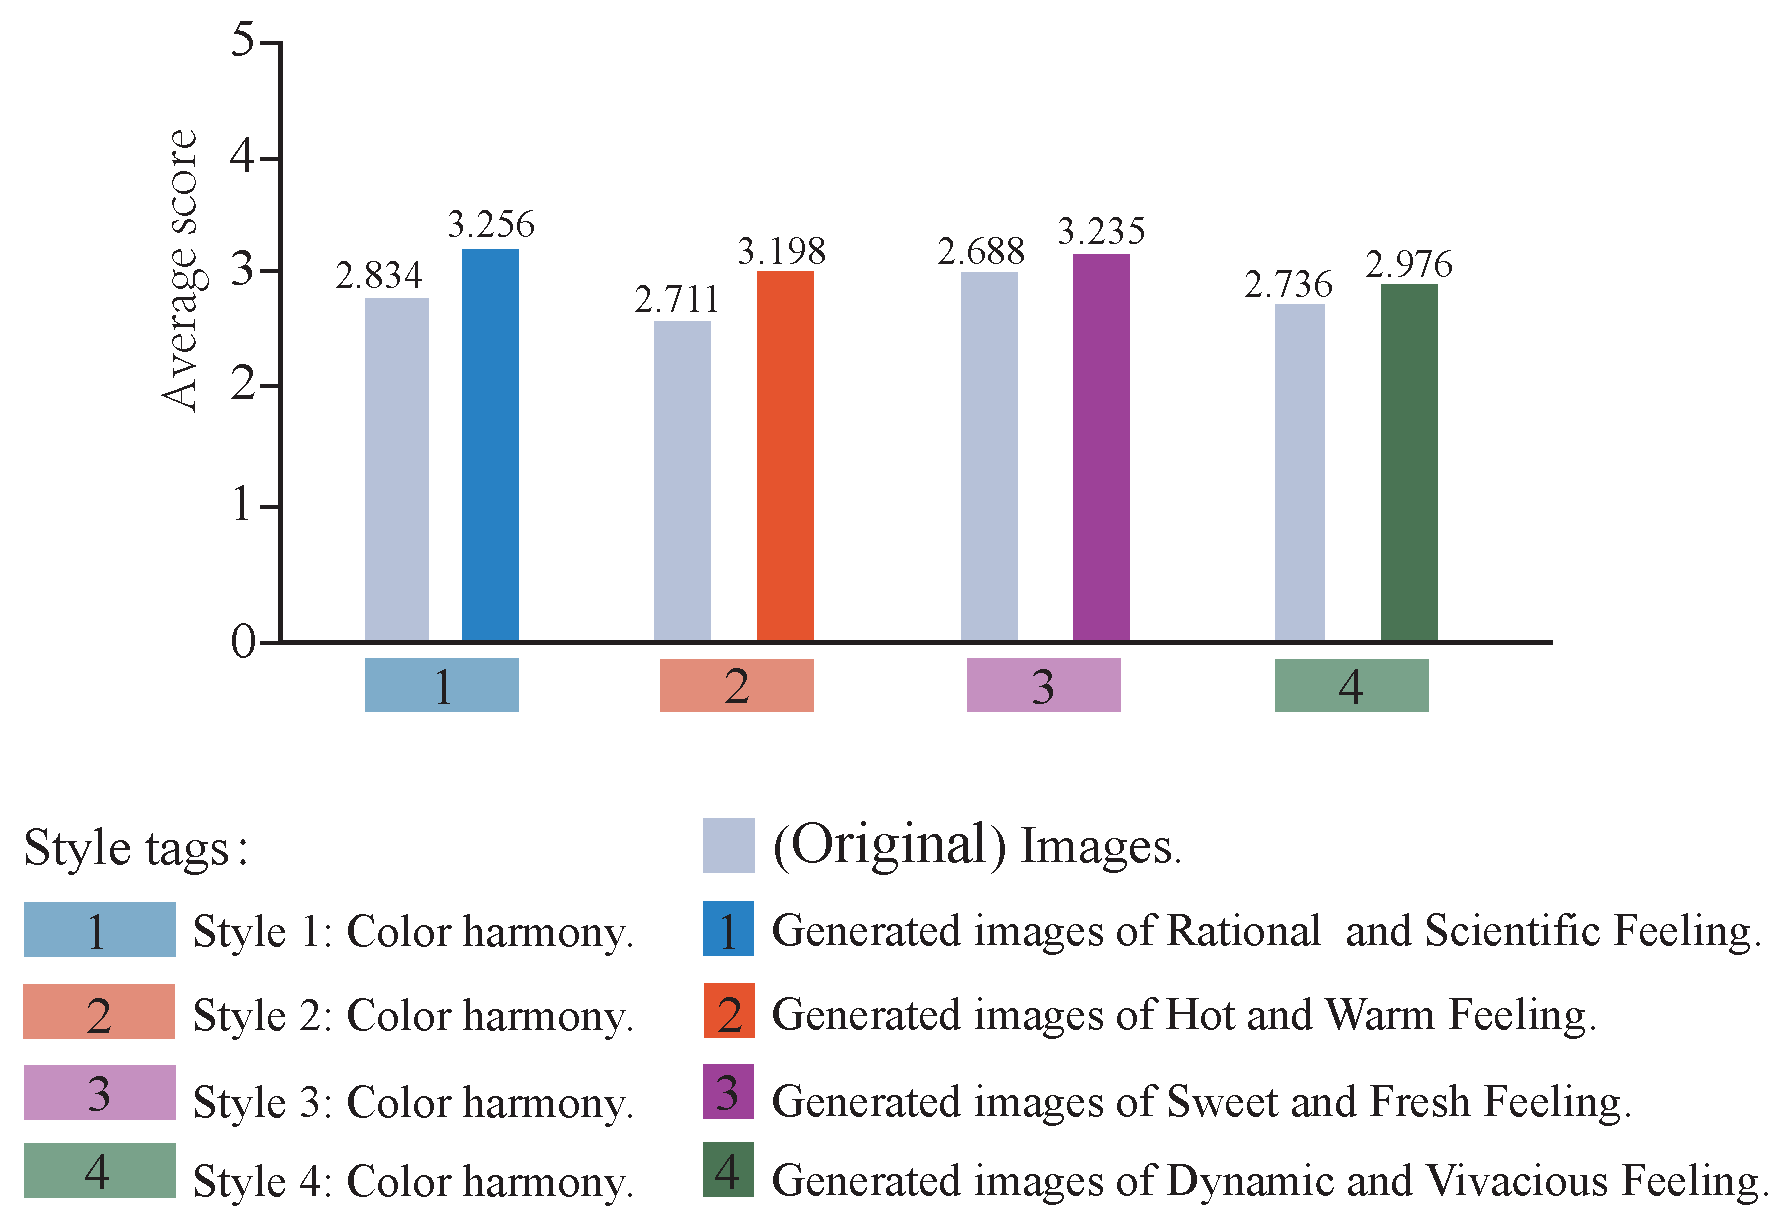
Figure 5b shows feelings of Rational, Scientific, Warm, Hot, Sweet, Fresh, Dynamic, Vivacious, Simple, Pure and Others. Thus, there are a total of 6 styles and 11 semantically described logo images. Due to the different subjective feelings of participants, their understanding of beauty was different. Subjects were judged on the basis that images with low clarity were rated lower. Further, the participants had different preferences for colors, graphics and content of images. It can be seen that although subjects had different aesthetic preferences, subjects still rated images with low clarity as lower.
Ultimately, the accuracy of the image quality score is unstable and is close to random guessing. On the other hand, the subjects of the style category images are more uniform in matching style selection and semantic description, so the distribution of style attributes is relatively accurate. The specific prediction method is introduced in
Section 4.
3.3. Comparison of JN-Logo-Related Datasets
In
Table 2 and
Table 3, we compare JN-Logo with similar aesthetic databases and logo databases.
This section compares the JN-Logo database to similar quality-evaluation databases and logo databases in
Table 2 and
Table 3, respectively. Five advantages of the JN-Logo database are having logo images as data objects, rich annotations, quality scores for image aesthetics, style attribute labels and description of the style; these aspects demonstrate the advantages of this database. We discuss the similarities and differences between JN-Logo and related databases.
The AVA [
2] database contains approximately 250,000 images. Each image was scored by 78 to 549 raters, with scores ranging from 1 to 10. The average score is used as the ground-truth label for each image. The author annotated 1 to 2 semantic labels for each image based on the information in the text of each image. There are a total of 66 textual tags in the entire database. The pictures in AVA are marked with photographic attributes, which involve photographic aesthetics and are described from the three directions of light, color and composition. There are a total of 14 photographic attributes. This database contains by far the largest amount of aesthetic-quality evaluation data. However, the semantic annotations are not strictly classified and mainly describe the content and style of the images.
Both JN-Logo and AVA obtain human aesthetic preference scores and style attributes through manual annotation. The difference is that JN-Logo scores range from 0–5 points and style attributes from 1–6 points. The number of scores is 0: 1303, 1: 896, 2: 1775, 3: 3320, 4: 3793 and 5: 2636. In the style attribute annotation, the number in each category is 2752, 1622, 1733, 2647, 3268 and 2895, respectively. The distribution is shown in
Figure 2.
The second difference is that JN-Logo is different from photographic databases. Logo image datasets are more suitable for design and have more research value and innovation. The third difference is that JN-Logo is based on the characteristics of logo design by adding image descriptions of visual psychological feelings to the style attributes, such as sense of reason and technology, enthusiasm and warmth, sweetness and vitality. The AVA dataset does not use this approach.
Photo.Net dataset (PN) (
https://www.photo.net) [
7] is a sharing platform for photography enthusiasts. Each picture has a rating of 1–7, and 7 is the most beautiful photograph. One advantage of PN scoring is that the scores are provided by online photography peers, and each image receives two or more points [
2]. The difference between
http://Photo.net and JN-Logo is that the former does not provide rich annotations, nor does it have style tags or semantic descriptions of styles.
CUHK [
3] (
http://DPChallenge.com) contains approximately 12,000 photographic images. Each photo has been scored by at least 100 users. CUHK has the same user score as AVAs with an advantage: the scoring method is different. All photos have only binary labels. The top and bottom 10% of photos are extracted and designated as high-quality professional photos and low-quality snapshots, respectively, but 80% of photos are ignored. CUHK has no style tags or semantic descriptions of styles. CUHK-PQ [
4,
5] (
http://DPChallenge.com (accessed on 25 March 2021)) contains 17,690 images. All photos still only have binary labels (1 = high-quality images, 0 = low-quality images). However, photos have more content-based tags. The data are grouped into seven scene categories: animal, plant, still life, architecture, landscape, people and night scenery.
The difference between CUHK-PQ and JN-Logo is that the former has content-based classification labels. However, it does not have style tags. The most significant difference between JN-Logo and the above four databases is that JN-Logo’s content is not photographs but rather logo images, and JN-Logo adds a semantic description of the style.
There are four logo datasets introduced as follows: BelgaLogos [
20] is the first benchmark for logo detection and is used to detect logos. All images are manually annotated, and the dataset consists of 10,000 images with 37 logos and 2771 logo instances annotated with bounding boxes. It has no score distribution, style labels or semantic descriptions.
WebLogo-2M [
25] uses the social media site Twitter as its data source, with 194 logo categories and 1,867,177 images. WebLogo-2M is the first large-scale fully automated dataset constructed by exploiting inherently noisy web data. However, there is no human annotation, and it is not a public dataset.
Logo-2K+ [
22] is a dataset for logo image recognition only. It is similar to the LogoDet-3K dataset and can be used for image classification and object detection. Logo-2K+ contains 10 major categories, 2341 subcategories and 167,140 images, with at least 50 images for each logo category. Logo-2K+ is a large logo dataset containing human annotations but does not have score distributions, style labels or semantic descriptions.
LogoDet-3K [
21] is used for copyright infringement detection, brand awareness monitoring, etc. It is the largest logo detection dataset with complete annotations. It has 3000 logo categories, approximately 200,000 manually annotated logo objects and 158,652 logo images. The photos are human-annotated in detail, and each logo object is annotated and contains multiple instances of the logo. To ensure the annotation quality of LogoDet-3K, each bounding box is manually annotated and placed as close as possible to the logo object. LogoDet-3K contains not only logos and photos of logos but also a large logo dataset with human annotations. However, it has no score distribution, style labels or semantic descriptions.
The four aesthetic databases are based on photographs and refer to photographic aesthetics, and are mainly used for the aesthetic evaluation and classification of photographs. However, these data are not design-related images and are not fully applicable to the design field. The four logo datasets, such as BelgaLogos [
20], have logo objects and photos containing logos, which are mainly used for retrieval, object detection, classification and image recognition. However, they do not have the aesthetic characteristics of images such as image quality scores and image style attributes. JN-Logo can be used for image quality assessment as well as logo image recognition and retrieval. In contrast, our JN-Logo database consists of logo images that can be used for logo-related aesthetic evaluation, retrieval, classification and generation.
The introduction of the eight databases above shows that the photographic image dataset for quality scoring and the logo image database for identification meet technical needs to a certain extent. However, different types of data (images) make it difficult to meet the needs of all disciplines. Because the content of the images is different, it is difficult to meet the needs of all disciplines, nor can it meet the needs of researchers in design disciplines for databases. The better the quality of the image and the closer the data type is to the needs of the algorithm, the more advantageous. Therefore, the JN-Logo database can meet the needs of designers and intelligent technology of logo images.
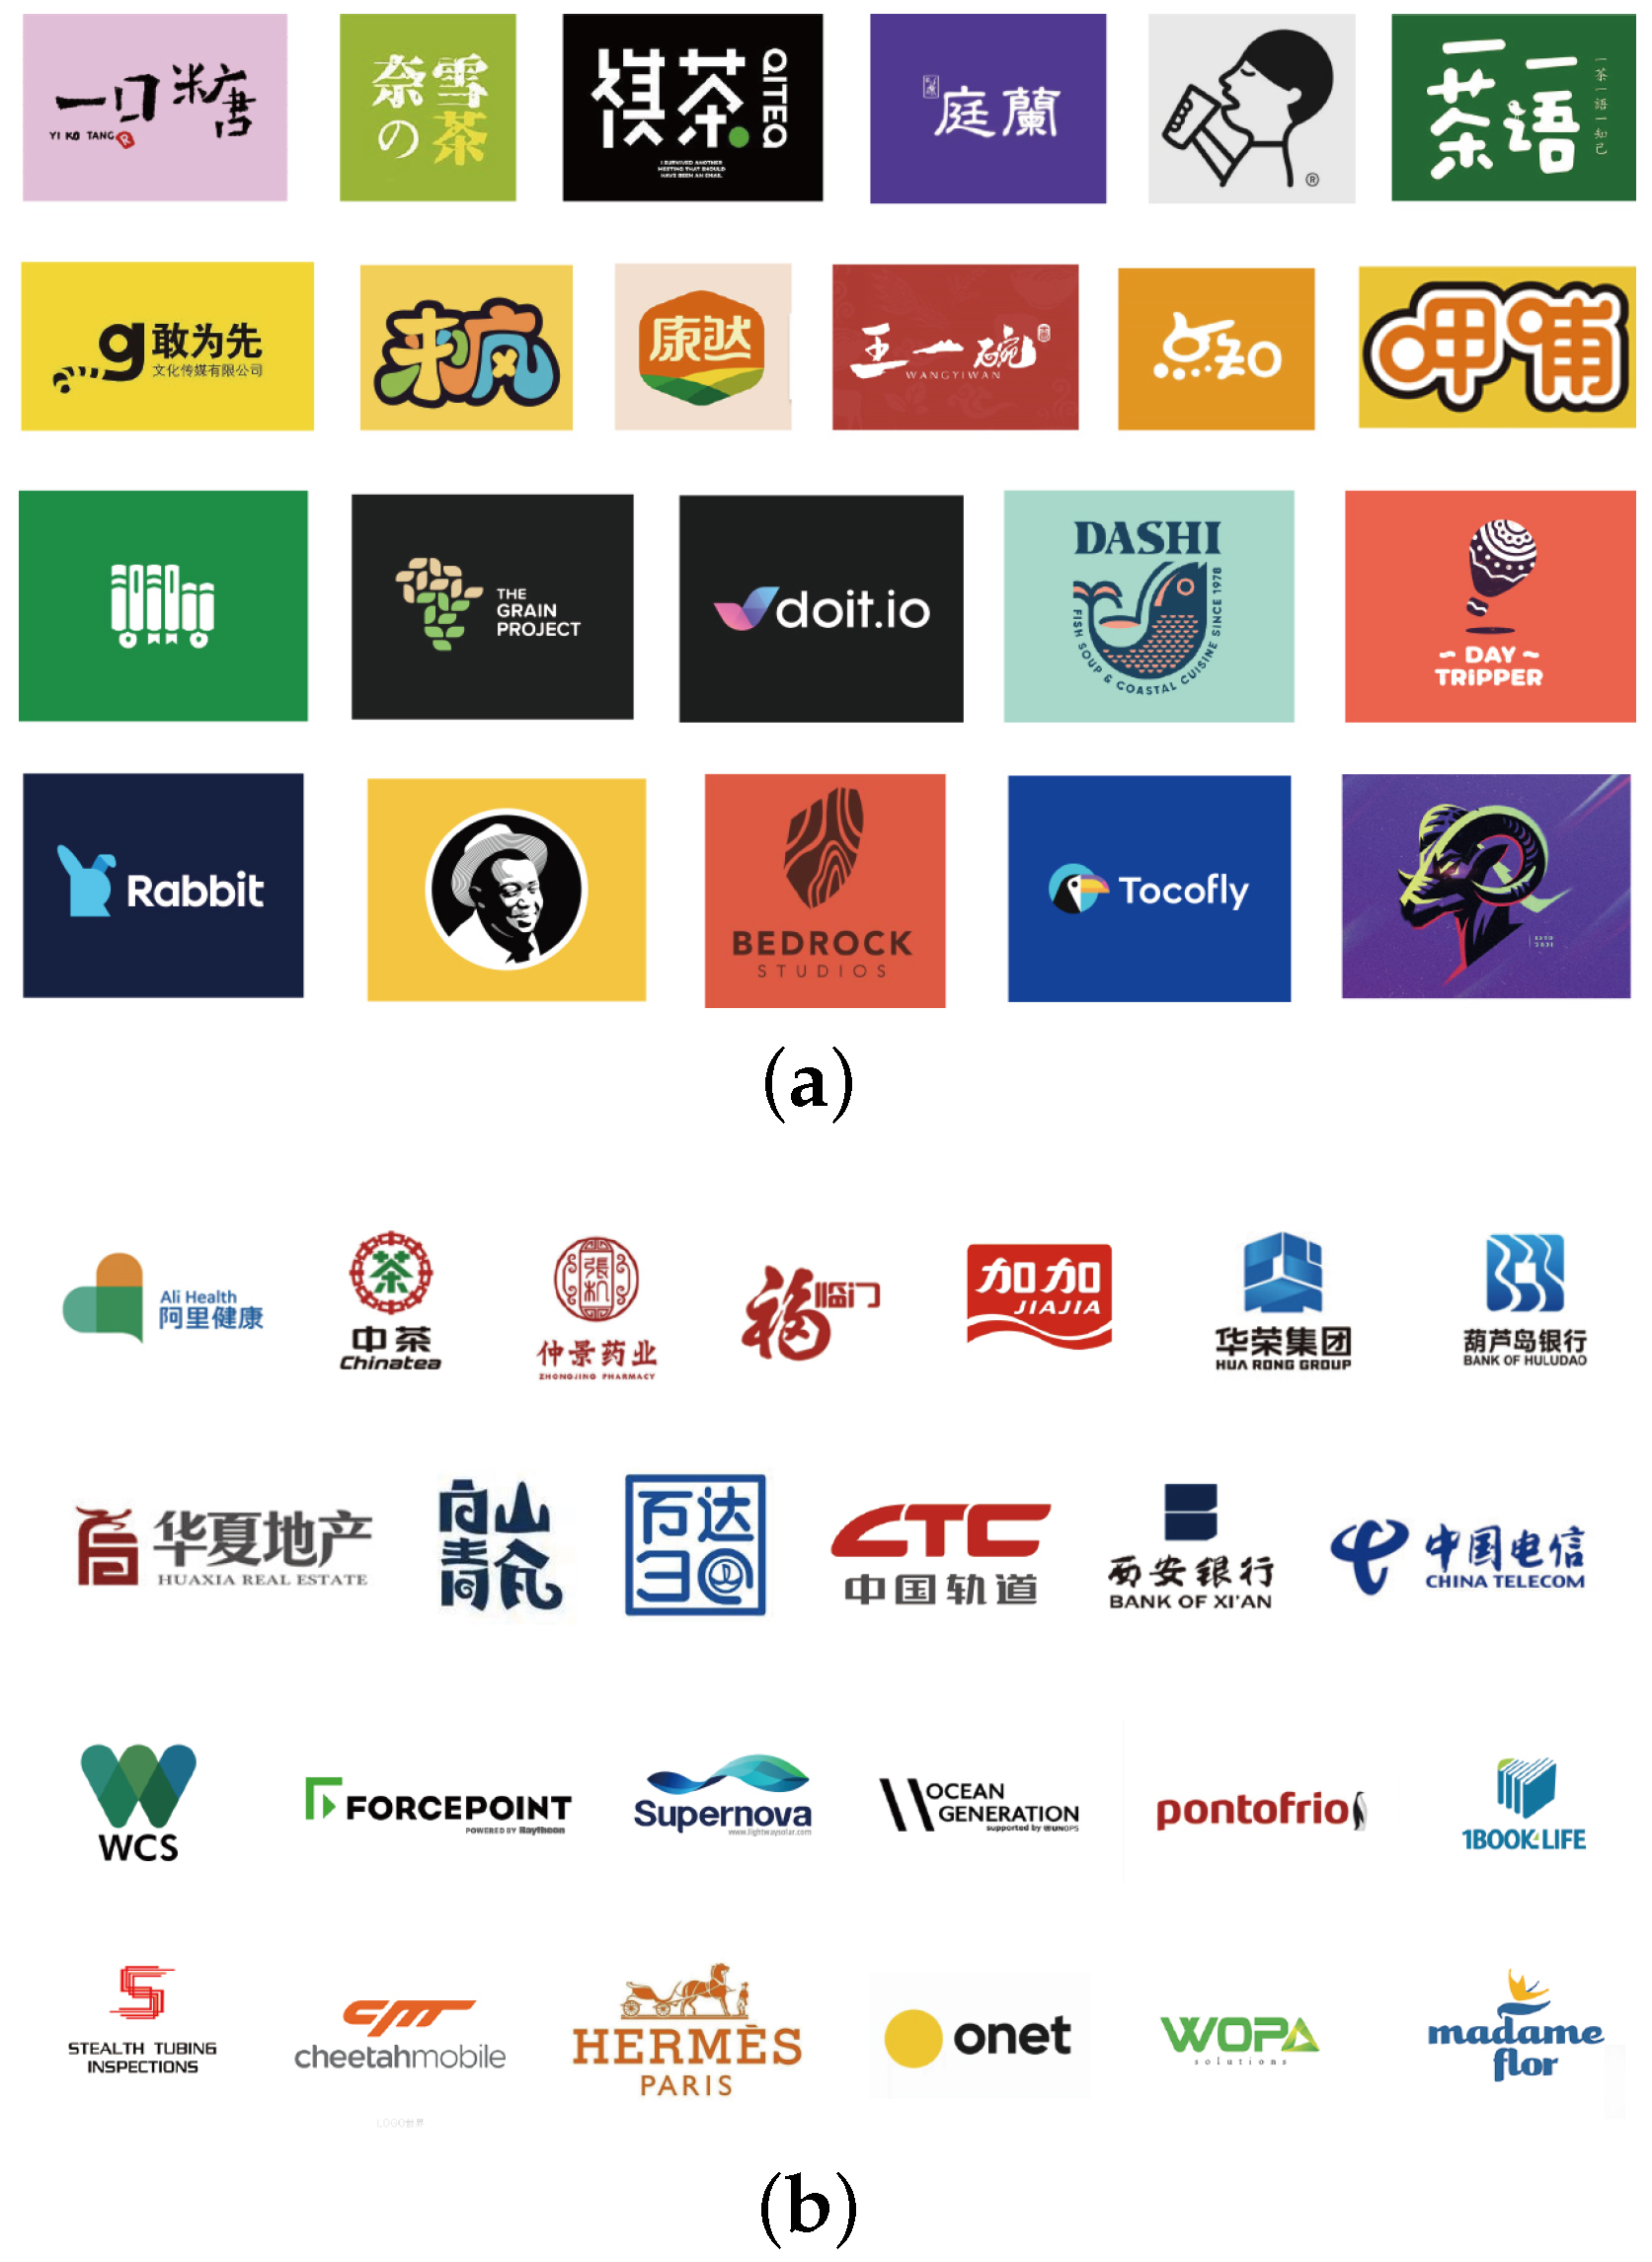
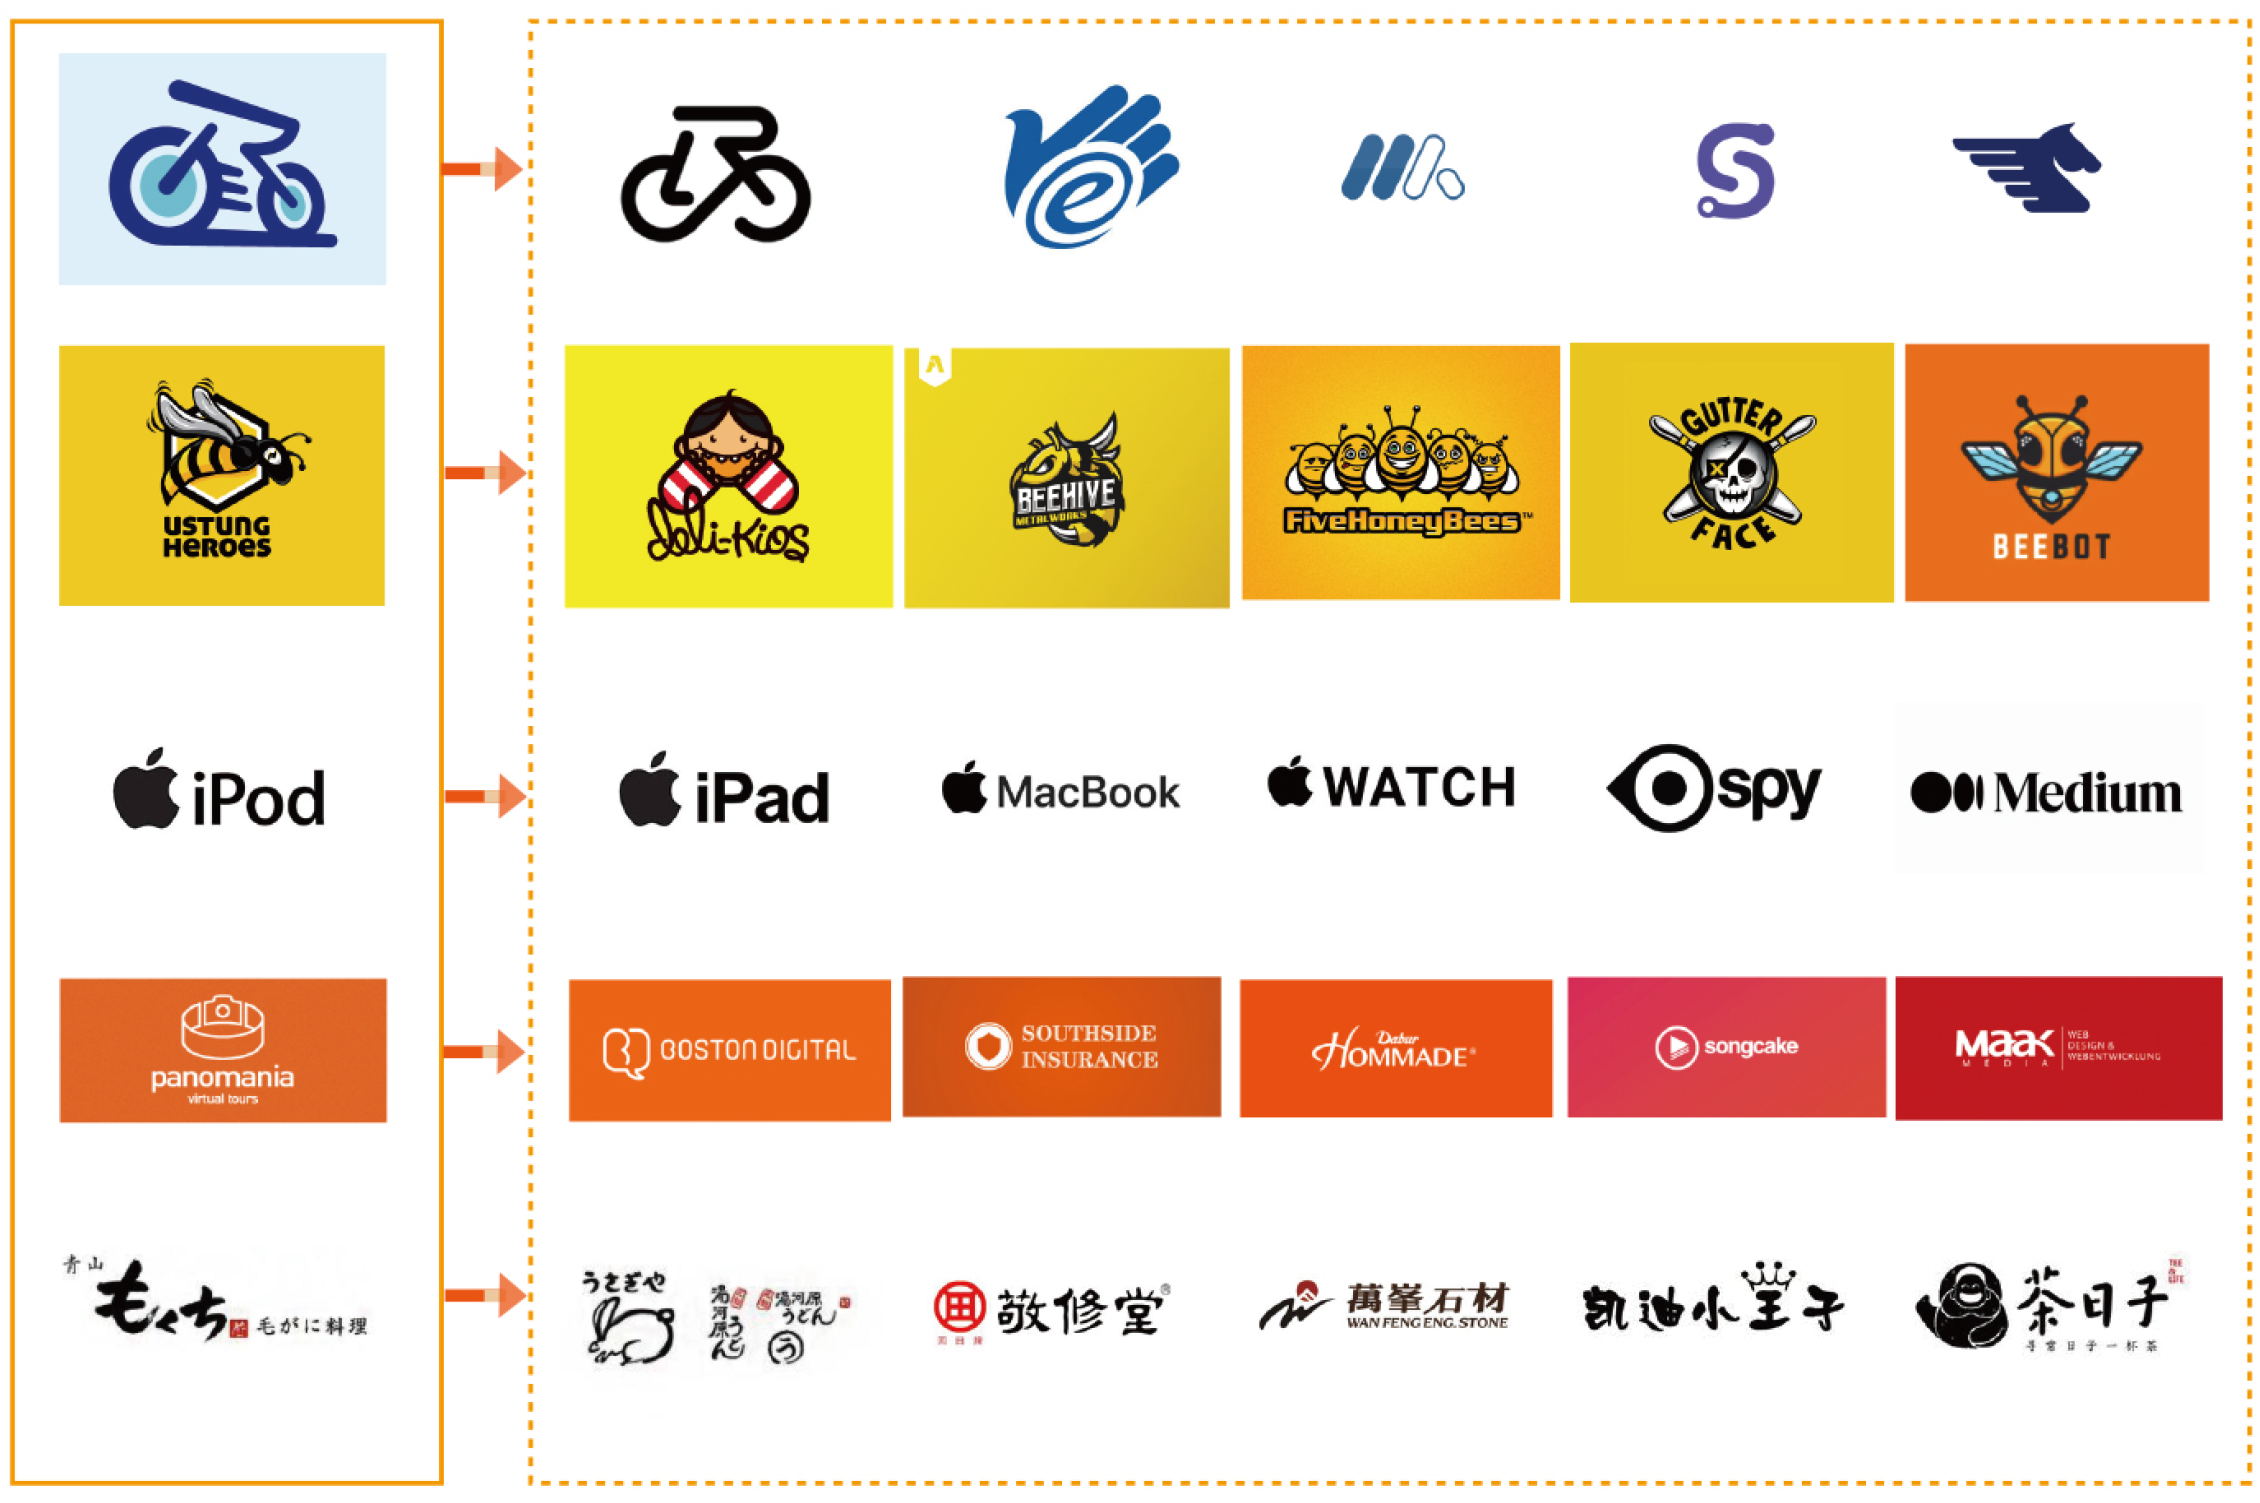
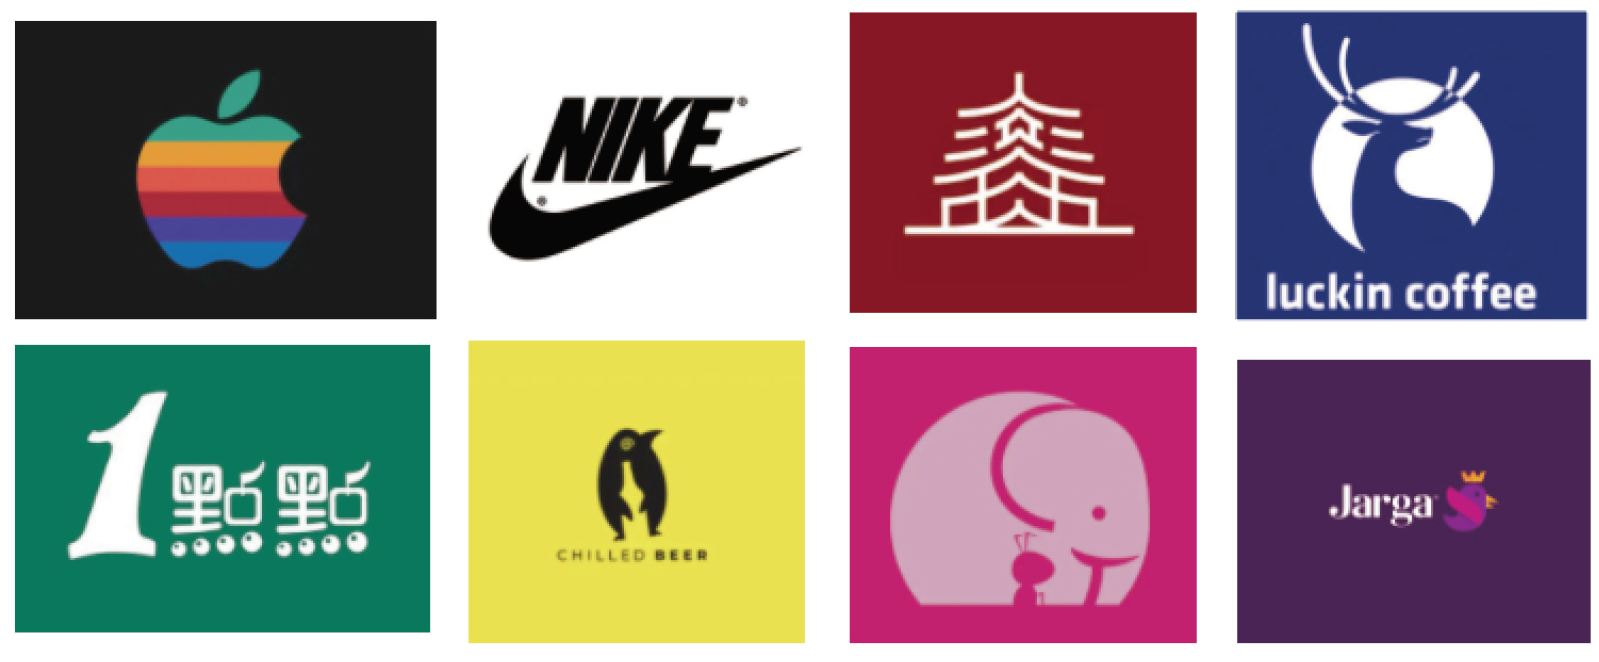
Figure 6 shows part of the logo data in the JN-Logo dataset.


