Article

Selective Regulatory Effects of Lactobacillus Plantarum Fermented Milk: Enhancing the Growth of Staphylococcus Epidermidis and Inhibiting Staphylococcus aureus and Escherichia coli

1
Key Laboratory of Synthetic and Biological Colloids, Ministry of Education, School of Chemical and Material Engineering, Jiangnan University, Wuxi 214122, China
2
Hangzhou Island Xingqing Biotechnology Co., Ltd., Hangzhou 310023, China
*
Authors to whom correspondence should be addressed.
Cosmetics 2025, 12(5), 232; https://doi.org/10.3390/cosmetics12050232
Submission received: 11 September 2025 / Revised: 14 October 2025 / Accepted: 15 October 2025 / Published: 17 October 2025
(This article belongs to the Special Issue Functional Molecules as Novel Cosmetic Ingredients)

Abstract

To address the limitation of traditional broad-spectrum antimicrobial agents in compromising skin microbiota homeostasis, this study developed Lactobacillus plantarum fermented milk (FM) as an innovative strategy for selectively regulating microbial communities to restore skin microbiota balance. FM was produced through protease hydrolysis in combination with L. plantarum fermentation. Selective antibacterial properties were evaluated via monoculture experiments (Escherichia coli, Staphylococcus aureus, and Staphylococcus epidermidis) and pathogen–commensal co-culture systems. It was found that FM can selectively inhibit pathogens (E. coli and S. aureus) and promote the growth of commensal bacteria (S. epidermidis) in monoculture, and can reduce the growth and competitiveness of E. coli and S. aureus while relatively increasing the colony count of S. epidermidis in the co-culture system. Metabolomic profiling was further performed to identify metabolic alterations induced by FM. It was found that FM can activate the pyruvate metabolic node, significantly enhancing the metabolic fluxes of lactic acid, citric acid, and short-chain fatty acids, which triggered the acid stress response of pathogenic bacteria while consuming a considerable amount of energy, attenuating their reproductive capacity without impacting the growth of commensal bacteria. Overall, FM showed selective antimicrobial activity against pathogens (E. coli, and S. aureus) and preservation of commensal S. epidermidis, offering a foundational reference for the development of postbiotics aimed at maintaining cutaneous microbial homeostasis.

Graphical Abstract

1. Introduction

As the largest organ of the human body, the skin carries a dynamic ecosystem composed of millions of microorganisms (bacteria, fungi, and viruses, etc.) [1]. This complex community is made up of both resident and transient bacteria: the former, such as Staphylococcus epidermidis, maintain skin homeostasis through nutrient supply, metabolic regulation, and immune modulation [2,3]; the latter, such as Escherichia coli and Staphylococcus aureus, are pathogenic bacteria that can breach the physical barrier and innate immune response of the skin when the barrier is compromised, causing infection [4,5]. Under normal conditions, resident and transient bacteria in the skin maintain a dynamic equilibrium within a specific range, which is crucial for skin health [6]. However, if the skin microbiota is imbalanced, the barrier function of the skin will be compromised, the resistance will be weakened, which may result in the excessive proliferation of pathogenic bacteria and a decrease in commensal bacteria, thereby causing skin diseases such as acne and atopic dermatitis [7,8]. Therefore, maintaining the dynamic balance of the skin microbiota is essential for skin health [9].
Currently, natural broad-spectrum antibacterial active substances such as usnic acid and limonene are widely used in the field of cosmetics and pharmaceuticals [10,11]. Despite their efficacy in inhibiting pathogenic bacteria, their lack of selectivity and long-term use may lead to dysbiosis of the skin microbiota, eventually resulting in skin issues [12]. This contradiction prompts the research to shift to more selective microbial regulation strategies, which aim to target the inhibition of pathogenic bacteria while maintaining the homeostasis of commensal bacteria, thus achieving the dynamic balance of the skin microecology. In recent years, microecological regulation technologies based on prebiotics, probiotics, postbiotics, and their filtrates have gradually emerged, which can reduce the damage to the microbial community and thus have become a research hotspot in the cosmetic industry [13,14]. However, the existing strategies mostly focus on the inhibitory effect of a single strain and lack systematic analysis of the metabolic regulatory networks in the complex interactions of the microbial community.
Previous research has reported that the peptides and organic acids produced by Lactobacillus plantarum during the fermentation of milk exhibit inhibitory effects on pathogenic bacteria [15]. However, their influence on the overall microbial community, especially on the resident bacteria such as S. epidermidis, has not been examined. In this study, a co-culture system of pathogenic bacteria and symbiotic bacteria was constructed to explore the effects of L. plantarum fermented milk (FM) on the bacterial community. Its regulatory mechanism on microbial proportions was further revealed through metabolomics. This research not only breaks through the traditional single-strain research paradigm, but also provides a new theoretical dimension for the development of microecological balance-based skin care products based on metabolic regulation.

2. Materials and Methods

2.1. Materials

L. plantarum (CCTCC No: M20232264) was collected by the China Center for Type Culture Collection. E. coli (ATCC 8099) and S. aureus (ATCC 6538) were purchased from Guangdong Huankai Microbial Technology Co., Ltd. (Guangzhou, China). S. epidermidis (BNCC 102555) was obtained from China National Research Institute of Food and Fermentation Industries Co., Ltd. (Beijing, China). Skim milk was bought from Saputo Lotion Co., Ltd. (Shanghai, China). Protease was supplied by Xiasheng (Beijing) Biotechnology Development Co., Ltd. (Beijing, China). The medium de Man-Rogosa-Sharpe (MRS) broth, mannitol high-salt agar, and eosin methylene blue agar were provided by Qingdao Haibo Biotechnology Co., Ltd. (Qingdao, China). Glucose, yeast extract, sodium chloride (NaCl), beef extract, peptone, and sodium hydroxide (NaOH) were supplied by Sinopharm Chemical Reagent Co., Ltd. (Shanghai, China). Methanol, acetonitrile, ammonium hydroxide, and 2-propanol were obtained from CNW Technologies GmbH (Dusseldorf, Germany). Ammonium acetate and acetic acid were bought from Sigma-aldrich, Inc. (St. Louis, MO, USA).

2.2. Preparation of Milk Enzymatic Solution (PM) and Fermentation Solution (FM)

PM and FM were prepared following the method we studied earlier [15]. The brief preparation process was using a membrane separation device (SA-UF-QS1812, Sepp Biotechnology Engineering, Shanghai, China) to remove lactose from skimmed milk. Subsequently, 0.5 wt% proteolytic enzyme was mixed with the milk, and the hydrolyzation was conducted for 3.5 h in a water bath. Afterwards, the pH of the enzymatic hydrolysate was adjusted to 5.5, and glucose (2 wt%), yeast extract (0.5 wt%), and L. plantarum seeds (5 vol%) were added to the solution. The fermentation process was maintained for 12 h with the pH controlled at 5.5 ± 0.2 throughout the procedure. The enzymatic hydrolysate and the fermented liquid were centrifuged at 10,000 rpm for 10 min, and filtered using a 0.22 μm membrane. After freeze-drying, the samples were produced and named PM and FM, respectively.

2.3. Effects of PM and FM on the Growth of Bacteria in Monoculture

In this study, to determine whether the fermentation operation is necessary and whether it is a key factor influencing bacteria growth, enzymatic hydrolysis and unfer-mented milk—PM, were used as blank controls.
E. coli, S. aureus, and S. epidermidis were inoculated into the Nutrient Broth (NB) medium for 12 h with shaking at 200 rpm at 37 °C. Afterwards, the bacterial concentration was adjusted to 1 × 10⁶ CFU/mL using the sterile NB medium. One hundred microliters of the diluted bacterial solution and 100 μL of samples (200 mg/mL) dissolved in NB medium were dropped into each well of a sterile 96-well plate, and the final concentration of FM or FM in the medium is 100 mg/mL. Furthermore, the experimental setup included the sample blank group with 100 μL of the NB medium and 100 μL of sample, the negative control group with 100 μL of bacterial solution and 100 μL of the NB medium, and the negative control blank group with 200 μL of the NB medium alone. Following the addition, the mixtures were gently shaken to ensure homogeneous mixing. Lastly, the plate was stored in the incubator with a constant temperature (37 °C) for 24 h and the optical density at a wavelength of 600 nm (OD600) of each well was determined using a microplate reader (SpectraMax M2, Molecular Devices, Sunnyvale, CA, USA).
The bacterial viability was calculated using the formula as follows:
Bacterial   Survival   Rate %   =   ( OD SA   OD SB ) / ( OD NC     OD NB )   ×   100 %
The ODSA, ODSB, ODNC, and ODNB denoted the OD600 of the sample group, the sample blank group, the negative control group, and the negative control blank group, respectively.

2.4. Effects of PM and FM on the Growth of Bacteria in Co-Culture

Co-culture of S. epidermidis and E. coli (EC_SE): S. epidermidis and E. coli, separately grown in NB medium at 37 °C overnight, were centrifuged at 3500 rpm for 5 min, after which the collection was resuspended in a sterile NB medium to achieve bacterial concentrations of 107 CFU/mL and 108 CFU/mL, respectively. Afterwards, S. epidermidis, E. coli, and 300 mg/mL of PM or FM were added to the shaker tube at a volume ratio of 1:1:1 and mixed well, the schematic diagram of which was shown in Figure 1A. The final concentration of FM or FM in the growth medium is 100 mg/mL, the pH of the mixture is 6.0. After incubated for different times (e.g., 0, 6, 12, and 24 h) at 37 °C, colony counts were obtained using the dilution spread plate method. The colony number of E. coli was enumerated using eosin methylene blue agar, while mannitol high-salt agar was utilized for S. epidermidis. Plates were incubated at 37 °C for 24 h and then colonies were counted. The control group consisted of the bacterial co-culture system with an equal volume of NB medium used to replace both the PM and FM.
Co-culture of S. epidermidis and S. aureus (SA_SE): Given the closely related characteristics of S. aureus and S. epidermidis, it was challenging to identify a suitable selective medium that could differentiate between these two species. Consequently, the transwell inserts (polycarbonate films with pore diameter of 0.4 μm) designed for 6-well plates were selected to establish a co-culture system, allowing for the passage of metabolites in the absence of any physical interaction [16]. The schematic of the co-culture system was presented in Figure 1B. In the upper chamber, a 0.5 mL mixture of S. epidermidis (108 CFU/mL) and samples (100 mg/mL) was added. Concurrently, 1.5 mL of a mixture of S. aureus (107 CFU/mL) and samples (100 mg/mL), was placed into the lower chamber. The well plate was incubated at 37 °C with gentle shaking to enhance the diffusion of metabolites between the two chambers, and the final concentration of FM or FM in the growth medium is 100 mg/mL, the pH of the mixture is 6.0. At 0, 6, 12, and 24 h, the liquid from both the upper and lower chambers was collected, sequentially diluted, and then plated onto mannitol high-salt agar to assess bacterial growth. For the control group, the sterile NB medium was used in place of the sample, with all other conditions remaining consistent with the experimental group.

2.5. Metabolomic Analysis

2.5.1. Extraction of Metabolites

For analysis of metabolites, co-cultures of EC_SE or SA_SE treated with 1 mL of samples or NB medium were centrifuged at 1000× g for 10 min at 4 °C. Five hundred microliters of the supernatant were taken into a centrifuge tube and quenched in liquid nitrogen, and the quenched samples were kept at −80 °C [17]. The metabolite extraction procedure followed a reported method with minor modifications [18]. One hundred microliters of sample were taken, and mixed with extraction solution (methanol:acetonitrile = 1:1 (v/v), 400 μL). After sonication for 10 min and standing for 1 h at −40 °C, the mixture was subsequently centrifuged at 12,000 rpm for 15 min under 4 °C. Lastly, the supernatant was carefully collected, filtered by a 0.22 μm membrane, and transferred into the liquid-phase flask for further analysis.

2.5.2. Liquid Chromatography-Tandem Mass Spectrometry (LC-MS/MS) Analysis

LC-MS/MS analysis was conducted using an Ultra-High Performance Liquid Chromatography (UHPLC, Vanquish, Thermo Fisher Scientific, Waltham, MA, USA) with a liquid chromatography column (Waters ACQUITY UPLC BEH Amide, 2.1 mm × 50 mm, 1.7 μm, Milford, MA, USA) coupled to Orbitrap Exploris 120 mass spectrometer (Orbitrap MS, Thermo Fisher Scientific, Waltham, MA, USA). The mobile phase included two components: component A was an aqueous solution containing ammonium acetate and ammonia hydroxide, and component B was acetonitrile. The temperature of the auto-sampler was adjusted to 4 °C and the injection volume was set to 2 μL.
The Orbitrap Exploris 120 mass spectrometer was employed to demonstrate its capacity to obtain tandem mass spectrometry spectra through information-dependent acquisition (IDA) within the acquisition software (Xcalibur, Thermo Fisher Scientific, Waltham, MA, USA). The resolution of full MS and MS/MS were 60,000 and 15,000, respectively. The spray voltage was 3.8 kV for positive ionization or −3.4 kV for negative ionization.

2.5.3. Data Preprocessing and Annotation

Raw data was converted to mzXML format by Proteo Wizard (V3.0.24054, ProteoWizard, Palo Alto, CA, USA). Then, a peak detection, extraction, alignment, and integration process was performed via an in-house R program based on the XCMS package (V4.2.2, Bioconductor, Seattle, WA, USA). Finally, metabolite identification was conducted with R (V4.3.3, R Foundation for Statistical Computing, Vienna, Austria) and BiotreeDB (V3.0, Biotree, Shanghai, China).

2.5.4. Metabolite Analysis

The data were logarithmically transformed and unit variance formatted by SIMCA (V18.0.1, Sartorius Stedim Data Analytics, Umeå, Sweden), then analyzed by Orthogonal Projections to Latent Structures-Discriminant Analysis (OPLS-DA) to assess group differences based on the first principal component. Model reliability was validated through 7-fold cross-validation (assessing R2Y and Q2) and permutation tests.
Differential metabolites were determined using two criteria: p < 0.05 and VIP > 1 from OPLS-DA. The ratio of metabolite levels between the two groups was defined to Fold Change, and a volcano plot of differential metabolites was generated with log2Fold Change on the x-axis and −log10p-Value on the y-axis.
These metabolites were mapped to the KEGG and PubChem databases to obtain their matching information. The metabolic pathway analysis was then performed by searching the pathway database of the corresponding species.

2.6. Statistical Analysis

All results were expressed as the average values ± standard deviations from three separate experiments. One-way ANOVA within Origin 2021b (OriginLab, MA, USA) software was applied to handle the results, followed by Bonferroni post hoc tests to assess the differences among groups. Statistical significance was attributed to values where p < 0.05. Furthermore, Origin 2021b software was employed to graphically represent the outcomes.

3. Results and Discussion

3.1. Effects of PM and FM on the Growth of Bacteria in Monoculture

In this study, S. aureus was selected as the representative Gram-positive skin pathogen, S. epidermidis as the representative Gram-positive skin commensal, and E. coli—although rarely encountered on skin—as a well-characterized Gram-negative reference strain to enable standardized benchmarking against existing antimicrobial data. The bacterial survival rates of S. epidermidis, E. coli, and S. aureus after incubation with PM or FM were presented in Figure 2. In monoculture conditions, PM exhibited a growth-promoting effect on all three bacterial species. Conversely, FM demonstrated proliferative effects only on S. epidermidis while significantly inhibiting the growth of E. coli and S. aureus (p < 0.05). The finding suggested that FM had the potential to selectively inhibit pathogenic bacteria when co-cultured with skin commensal and pathogenic bacteria.

3.2. Effects of PM and FM on the Growth of Bacteria in Co-Culture

3.2.1. E. coli and S. epidermidis in Co-Culture (EC_SE)

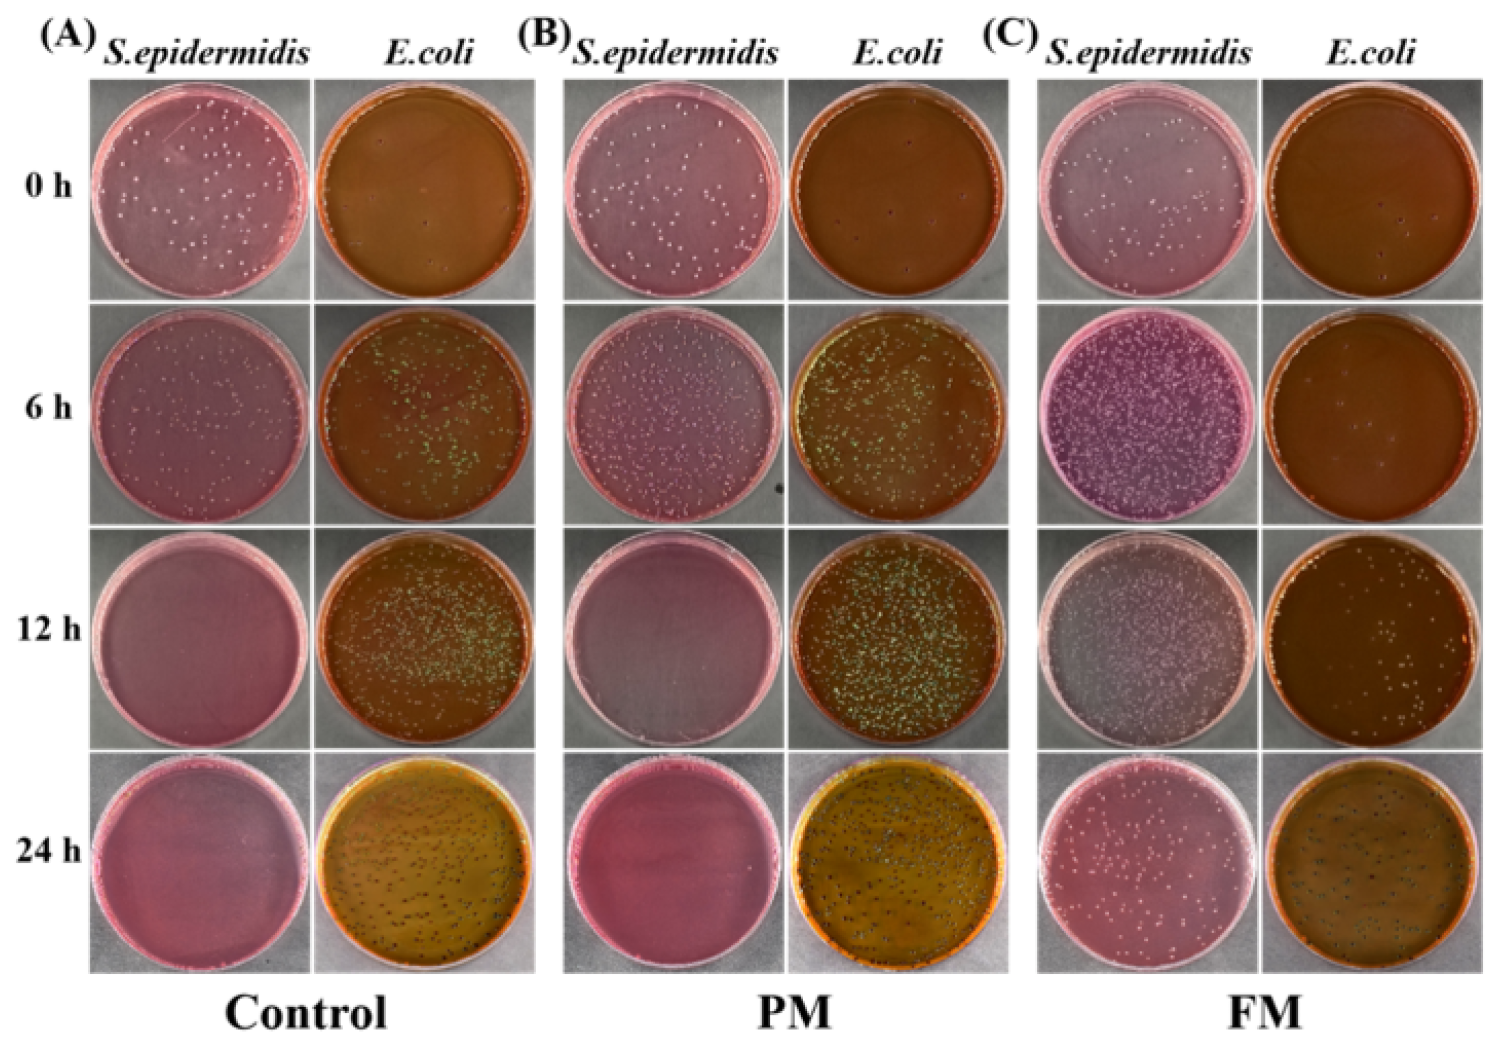
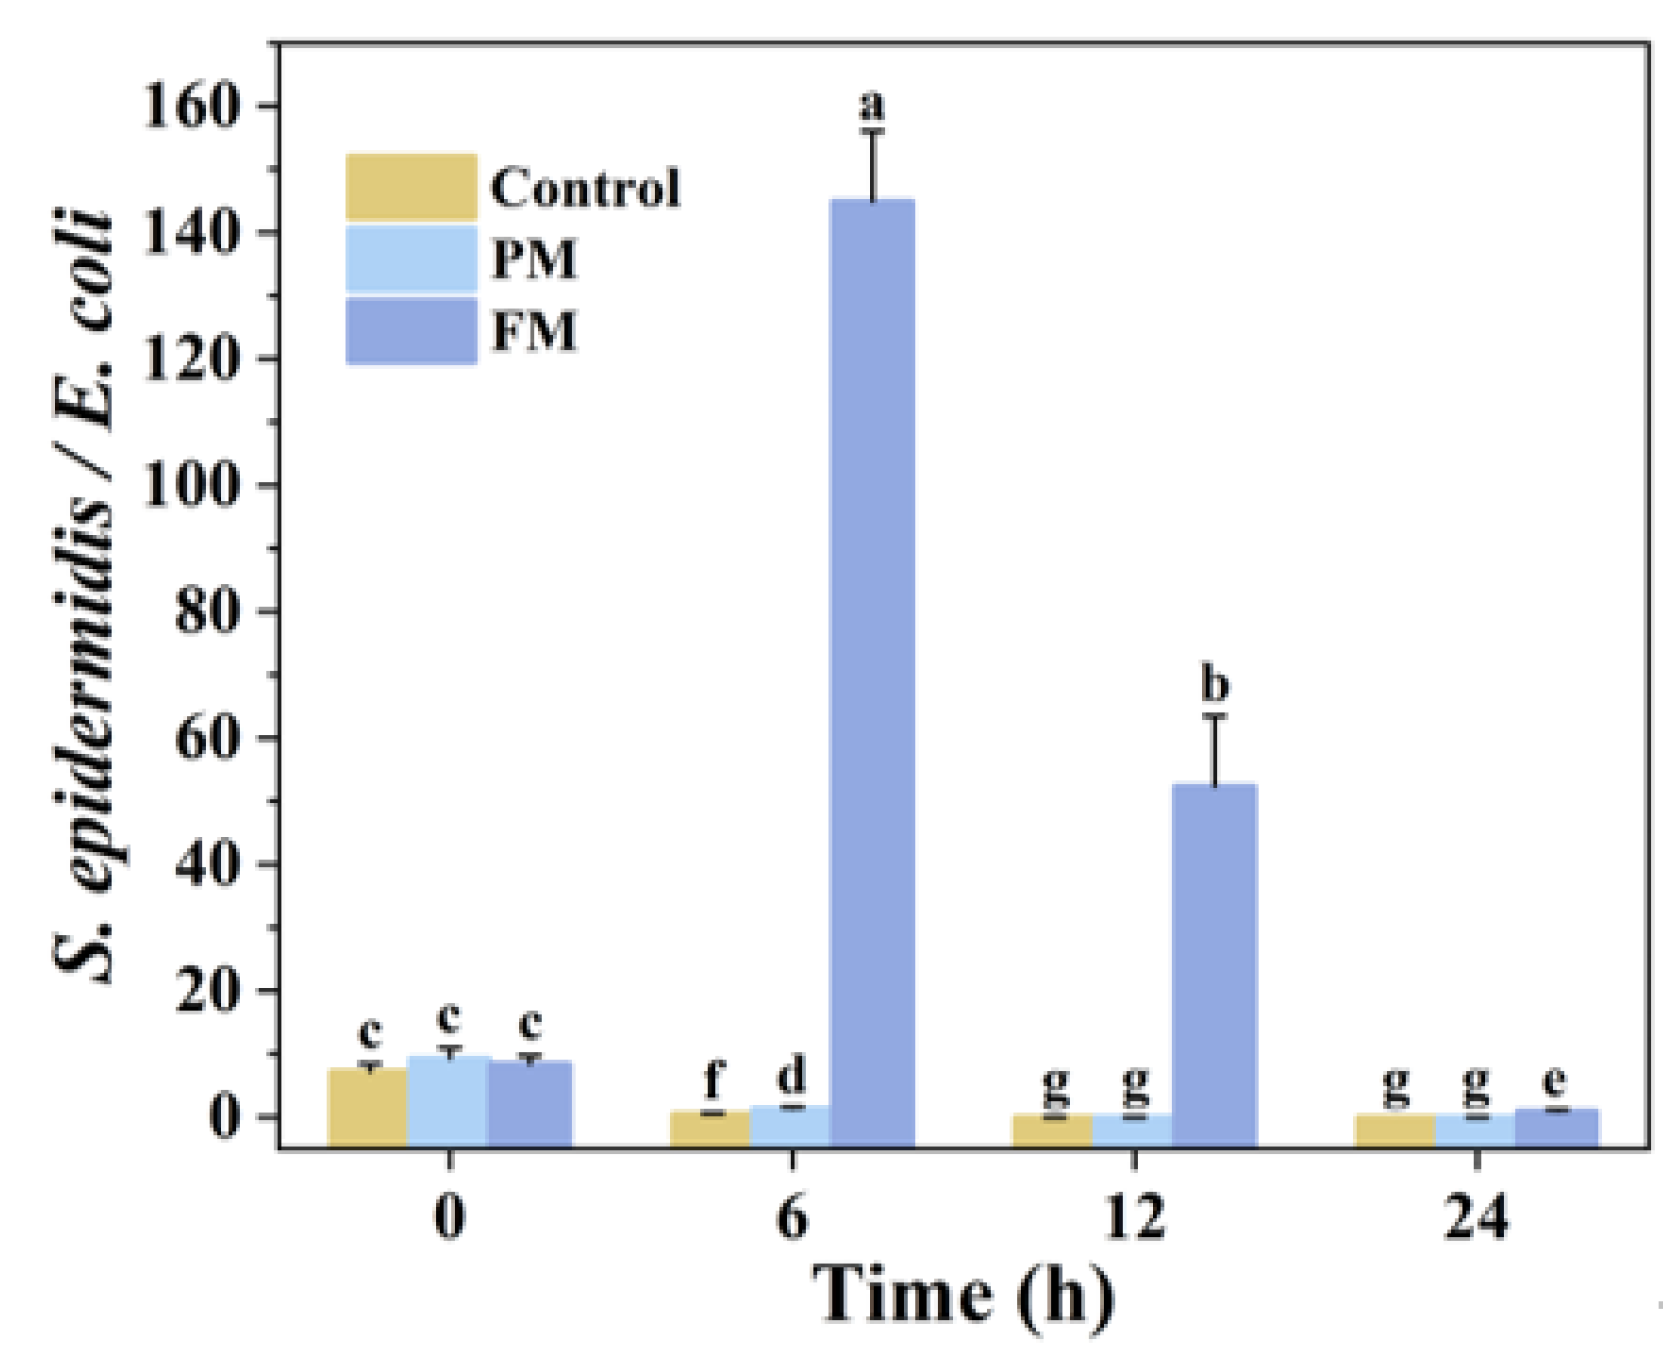
Figure 3 depicted the variations in colony counts of E. coli and S. epidermidis when co-cultured with the samples for 0, 6, 12, and 24 h. With the prolongation of incubation time, the quantity of S. epidermidis decreased while that of E. coli increased in the control and PM groups, which corresponds to previous literature [19]. Nevertheless, after the addition of FM, this situation was reversed. The number of S. epidermidis rose rapidly and the colony count of E. coli was suppressed. The corresponding time courses of viable cell counts under different co-culture conditions were displayed in Figure S1A. Figure 4 showed the ratio of colony counts of S. epidermidis to E. coli, indicate that this ratio gradually decreased over time in both the control and PM group. This suggests that E. coli became the dominant strain in the co-culture system. However, the ratio in the FM group was significantly higher than that in the control group at the same incubation time, demonstrating that the addition of FM could modify the microbiota ratio and relatively increase the colony count of the skin commensal (S. epidermidis). This phenomenon was most pronounced when the co-incubation time was 6 h and 12 h. In combination with Figure 3C and Figure S1A, where compared with the EC_SE co-culture group treated with FM at 12 h, the colony-forming units of S. epidermidis decreased after 24 h of co-culture, it could be inferred that the depletion of nutrients in the medium at 24 h led S. epidermidis to enter the decline phase, thereby reducing the colony count.

3.2.2. S. aureus and S. epidermidis in Co-Culture (SA_SE)

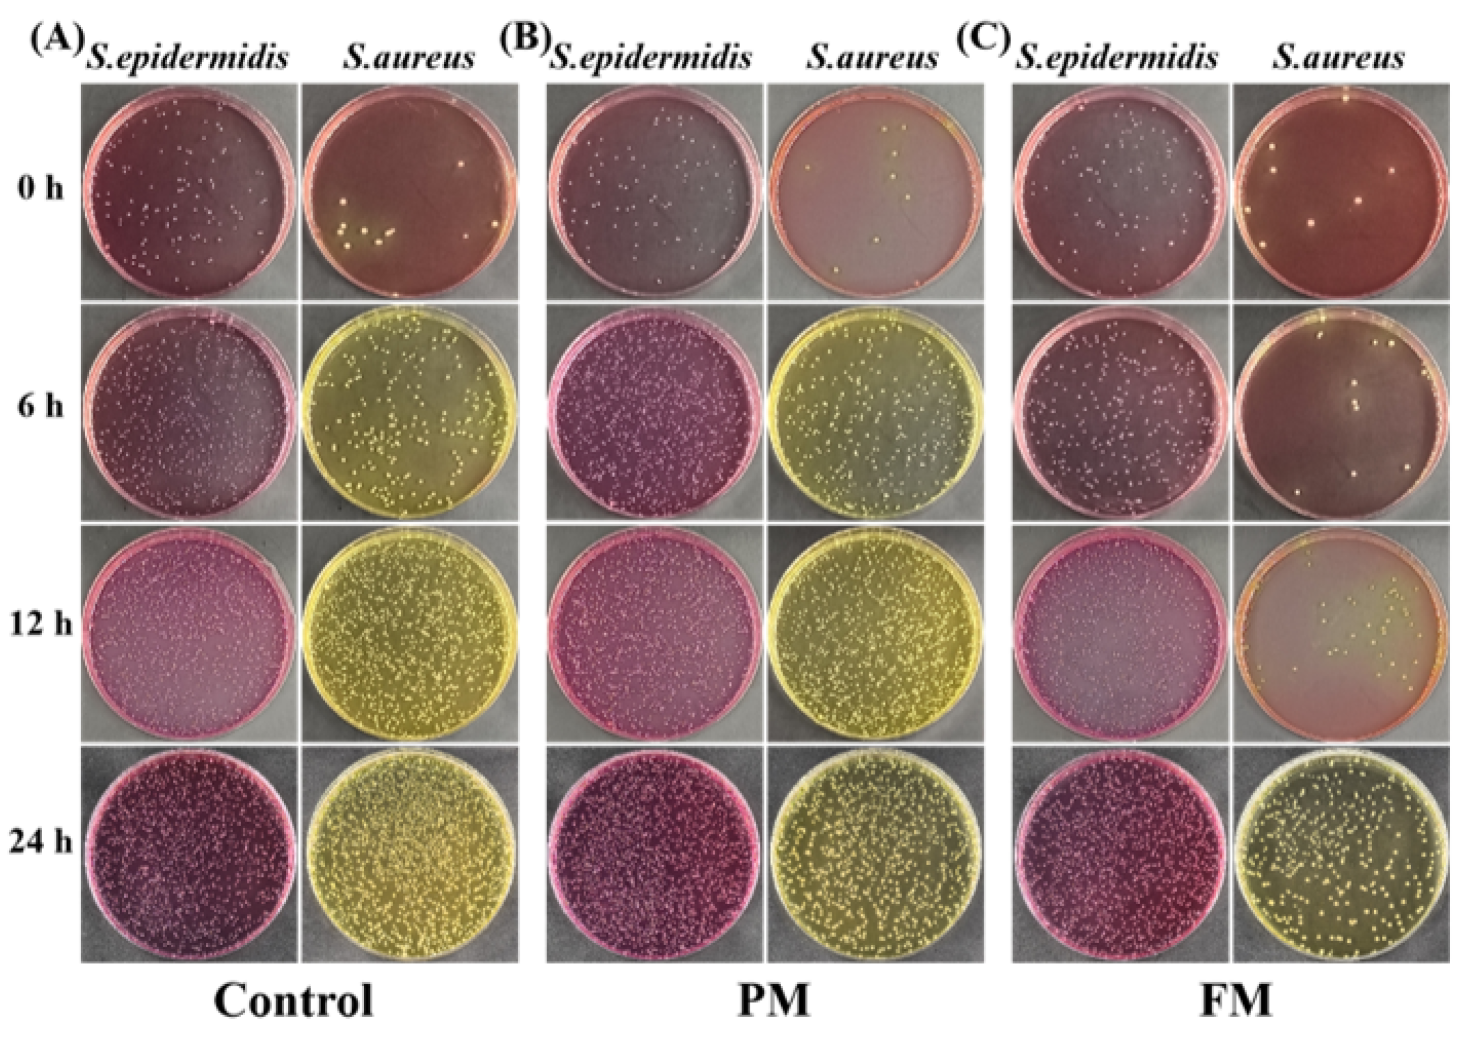
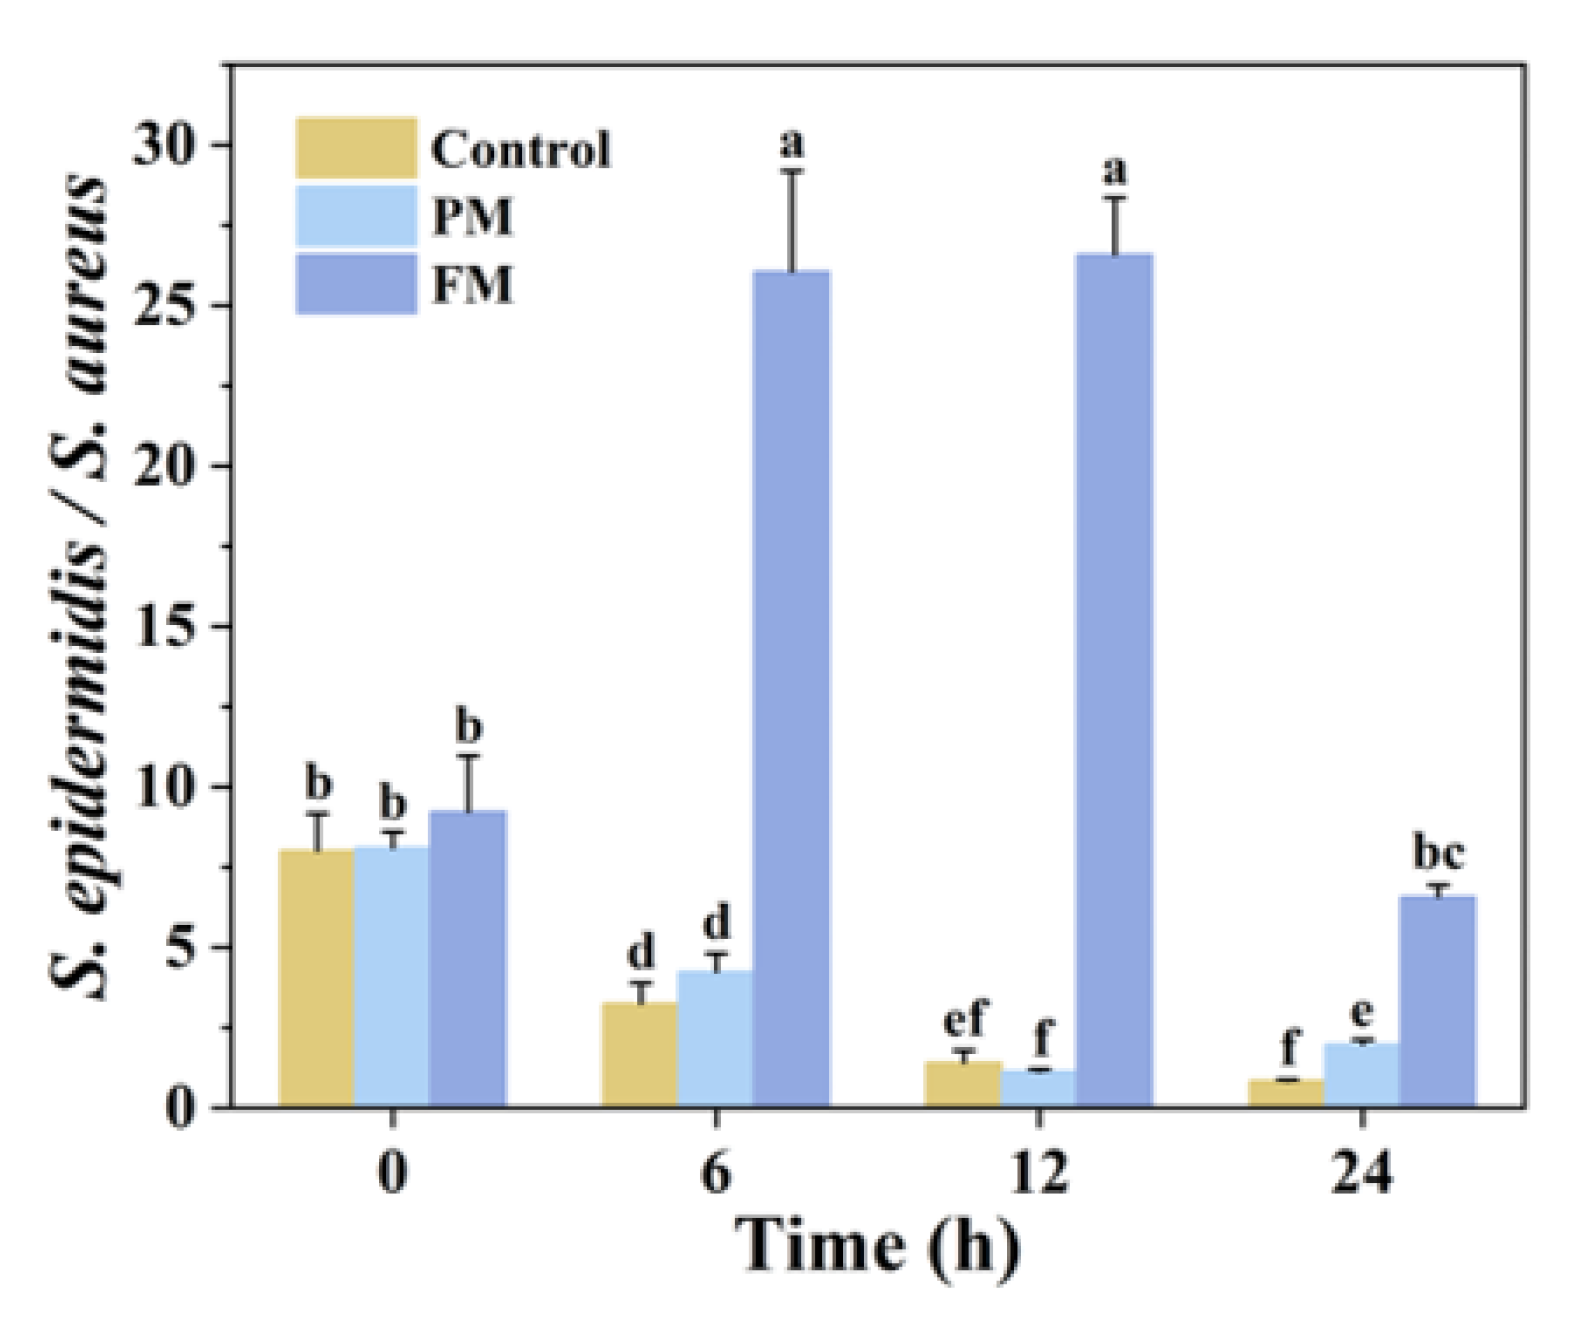
Figure 5 presented the colony count changes of S. aureus and S. epidermidis co-cultured with samples for 0, 6, 12, and 24 h. As incubation time increased, the two strains exhibited a synergistic growth pattern in the control group, and the addition of PM further promoted their growth. However, after the addition of FM, the growth of S. epidermidis was slightly inhibited at 6 h, and no significant difference at 12 h and 24 h in comparison with the control group. In contrast, the growth of S. aureus was markedly inhibited. The corresponding time courses of viable cell counts under different co-culture conditions were displayed in Figure S1B. The ratio of colony counts of S. epidermidis and S. aureus in the control and PM group decreased over time was displayed in Figure 6. It indicated higher viability of S. aureus than S. epidermidis in co-culture. Conversely, the ratio of the FM group was significantly higher than that of the control group, suggesting that FM could selectively inhibit the growth of S. aureus without affecting the viability of S. epidermidis. Similarly, this effect was most pronounced at 6 h and 12 h of co-incubation. As shown in Figure 5C and Figure S1B, the colony-forming units of S. aureus in the FM group at 24 h were markedly higher than at 12 h, implied the weak ability of FM to modulate the microbial ratio at 24 h, which might be that the harmful bacterium S. aureus gradually adapted to the stress in the co-culture environment [20]. Through evolution or by activation of tolerance mechanisms, it overcame the inhibitory effect of FM.

3.3. Identification of Differential Metabolites in the Co-Culture Group

Metabolomics, as a powerful system biology tool, can fully reveal the changes of metabolites in organisms and reflect the overall metabolic state of biological systems [21]. To verify FM achieves selective microbiota balance via metabolic regulation, this study used metabolomics to focus on core metabolites directly related to bacterial survival and acid stress adaptation (Amino acids: glutamate, alanine, β-alanine; Organic acids: lactic acid and citric acid; Short-chain fatty acids (SCFAs): propionic acid, butyric acid, caproic acid, etc.) and analyze their variations in 12 h co-culture systems.
Metabolic differences between NB medium– and FM-treated co-cultures were interrogated using the OPLS-DA model. Scores plots demonstrated discrete clustering of all biological replicates along the first predictive component, with no overlap between the control (NB medium) and FM-exposed groups, supporting a medium-dependent metabolic shift (Figure S2A,B). Model quality metrics for EC_SE_Control vs. EC_SE_FM yielded R2Y = 1.00 and Q2 = 0.995, whereas SA_SE_Control vs. SA_SE_FM yielded R2Y = 1.00 and Q2 = 0.997 (Table S1), values that approach the theoretical maximum and indicate excellent explanatory and predictive power. Permutation tests generated R2Y/Q2 intercepts of 0.96/−0.41 and 0.93/−0.39 for the two models (Figure S3); the markedly negative Q2 intercepts, together with R2Y intercepts < 1.0, confirm model stability and the absence of overfitting or spurious discrimination. Furthermore, volcano plots (VIP > 1, p < 0.05) identified 2775 and 2814 differential metabolites in EC_SE and SA_SE, respectively, with ~94% up-regulated, evidencing a pronounced metabolic stress response to FM (Figure S2C,D).
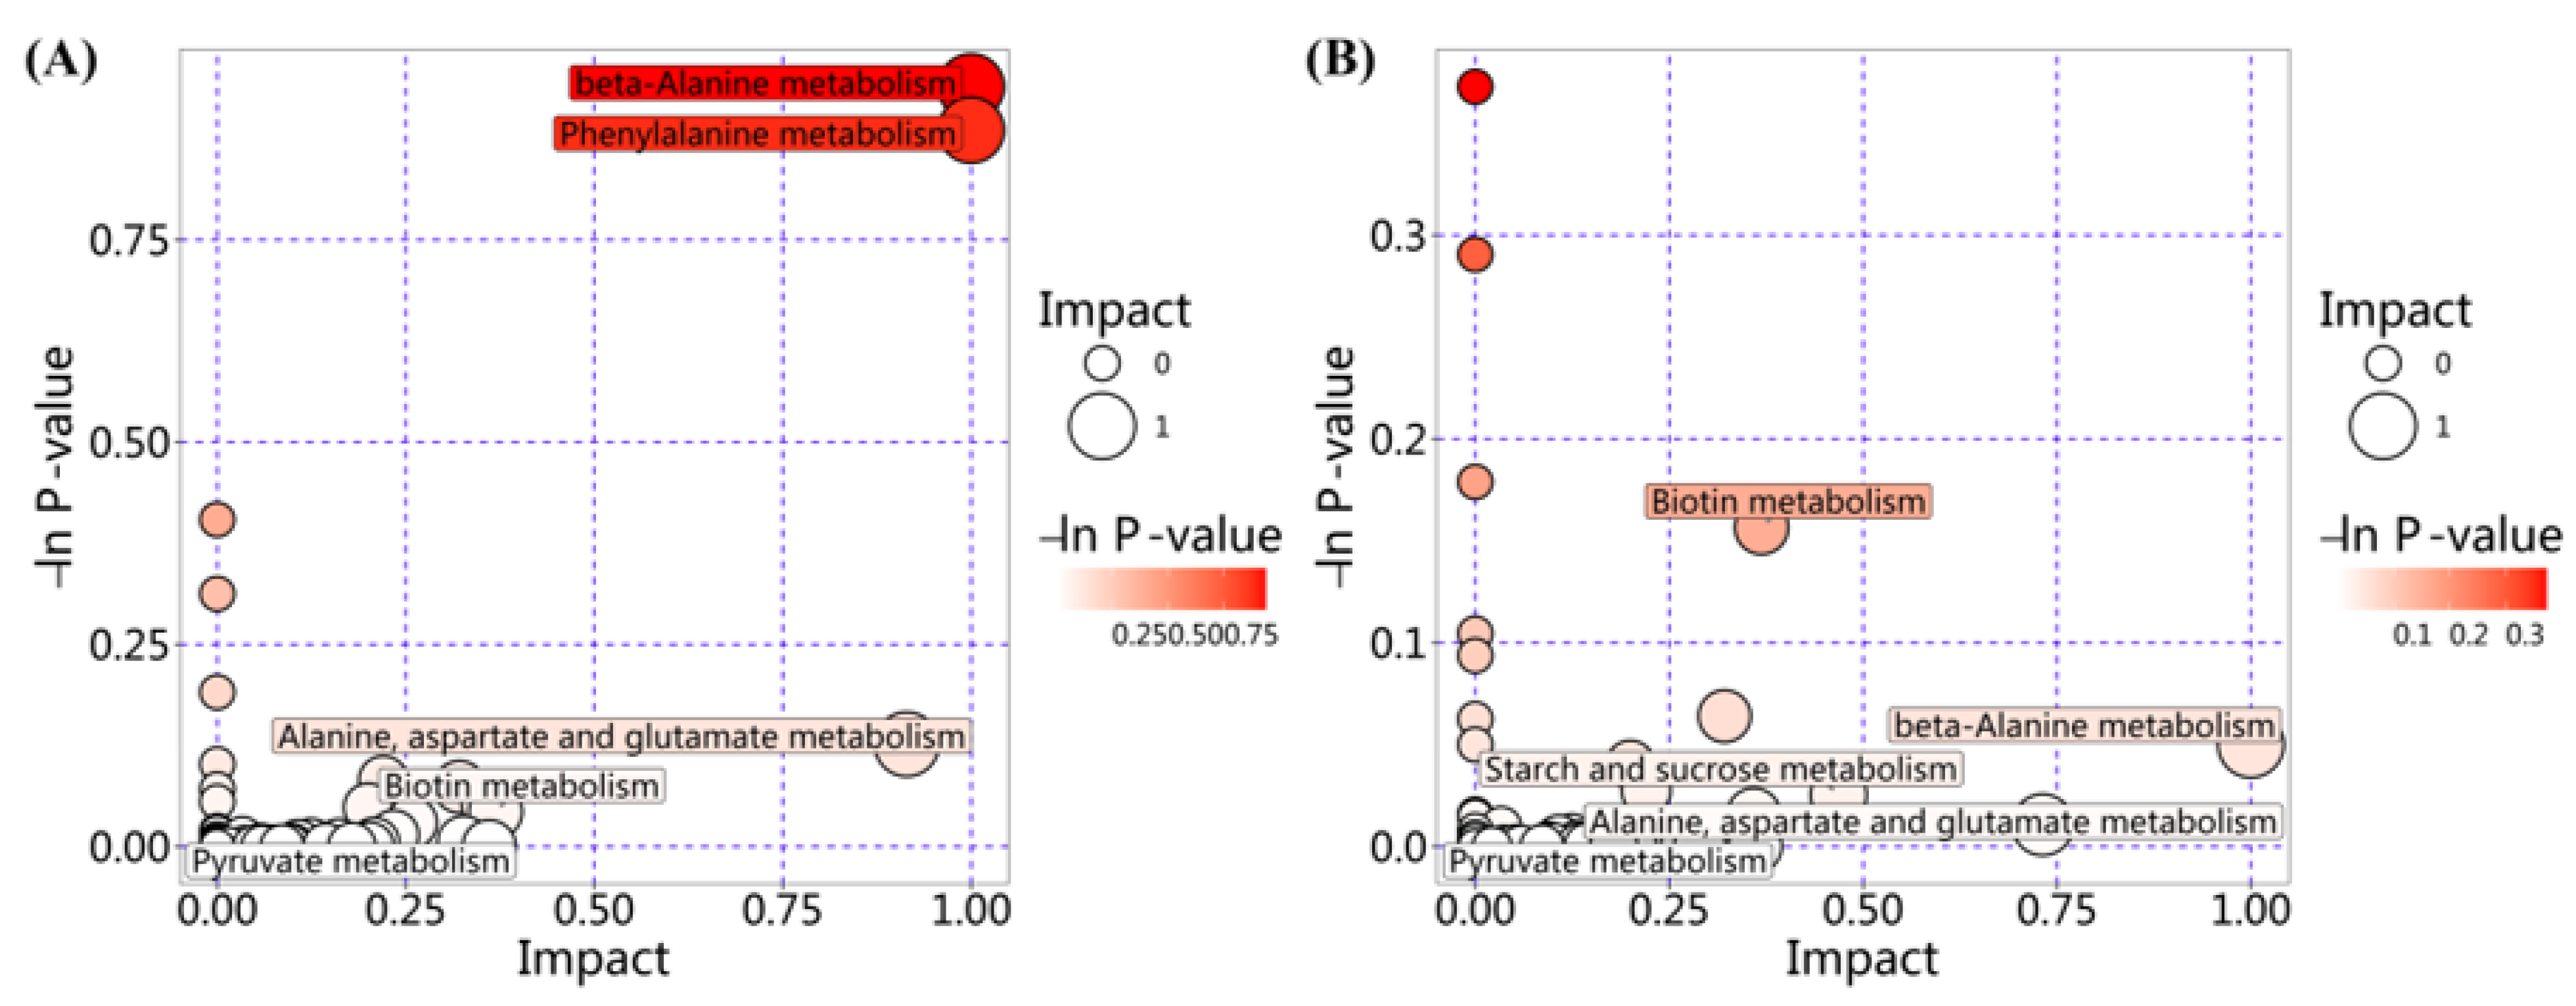
To better understand the differences in metabolites in the co-culture group, pathway enrichment analysis was performed on the differential metabolites. With p < 0.05 as the significance criterion, the higher the pathway impact value, the greater the impact of the pathway on the bacterial metabolites. As shown in Figure 7A, the top 5 significantly affected differential metabolic pathways in the EC_SE group were β-alanine metabolism, phenylalanine metabolism, alanine, aspartate and glutamate metabolism, biotin metabolism, and pyruvate metabolism. They mainly affected the amino acid metabolism and energy metabolism of bacteria [22,23]. As shown in Figure 7B, the top 5 significantly affected differential metabolic pathways in the SA_SE group were biotin metabolism, β-alanine metabolism, starch and sucrose metabolism, alanine, aspartate and glutamate metabolism, and pyruvate metabolism. In summary, FM mainly improved the competitiveness of S. epidermidis in co-culture by affecting the amino acid metabolism and energy metabolism homeostasis of the co-culture strains.

3.4. Metabolic Network Analysis of Co-Culture Groups

3.4.1. Metabolic Network Analysis for Group EC_SE_Control vs. EC_SE_FM

Mapping the KEGG IDs of differentially expressed metabolites onto metabolic signaling pathways enables the construction of networks associated with bacterial carbohydrate, amino acid metabolism, and energy generation, through which the regulatory ability of FM on the metabolic network of co-cultured bacteria can be understood [22].
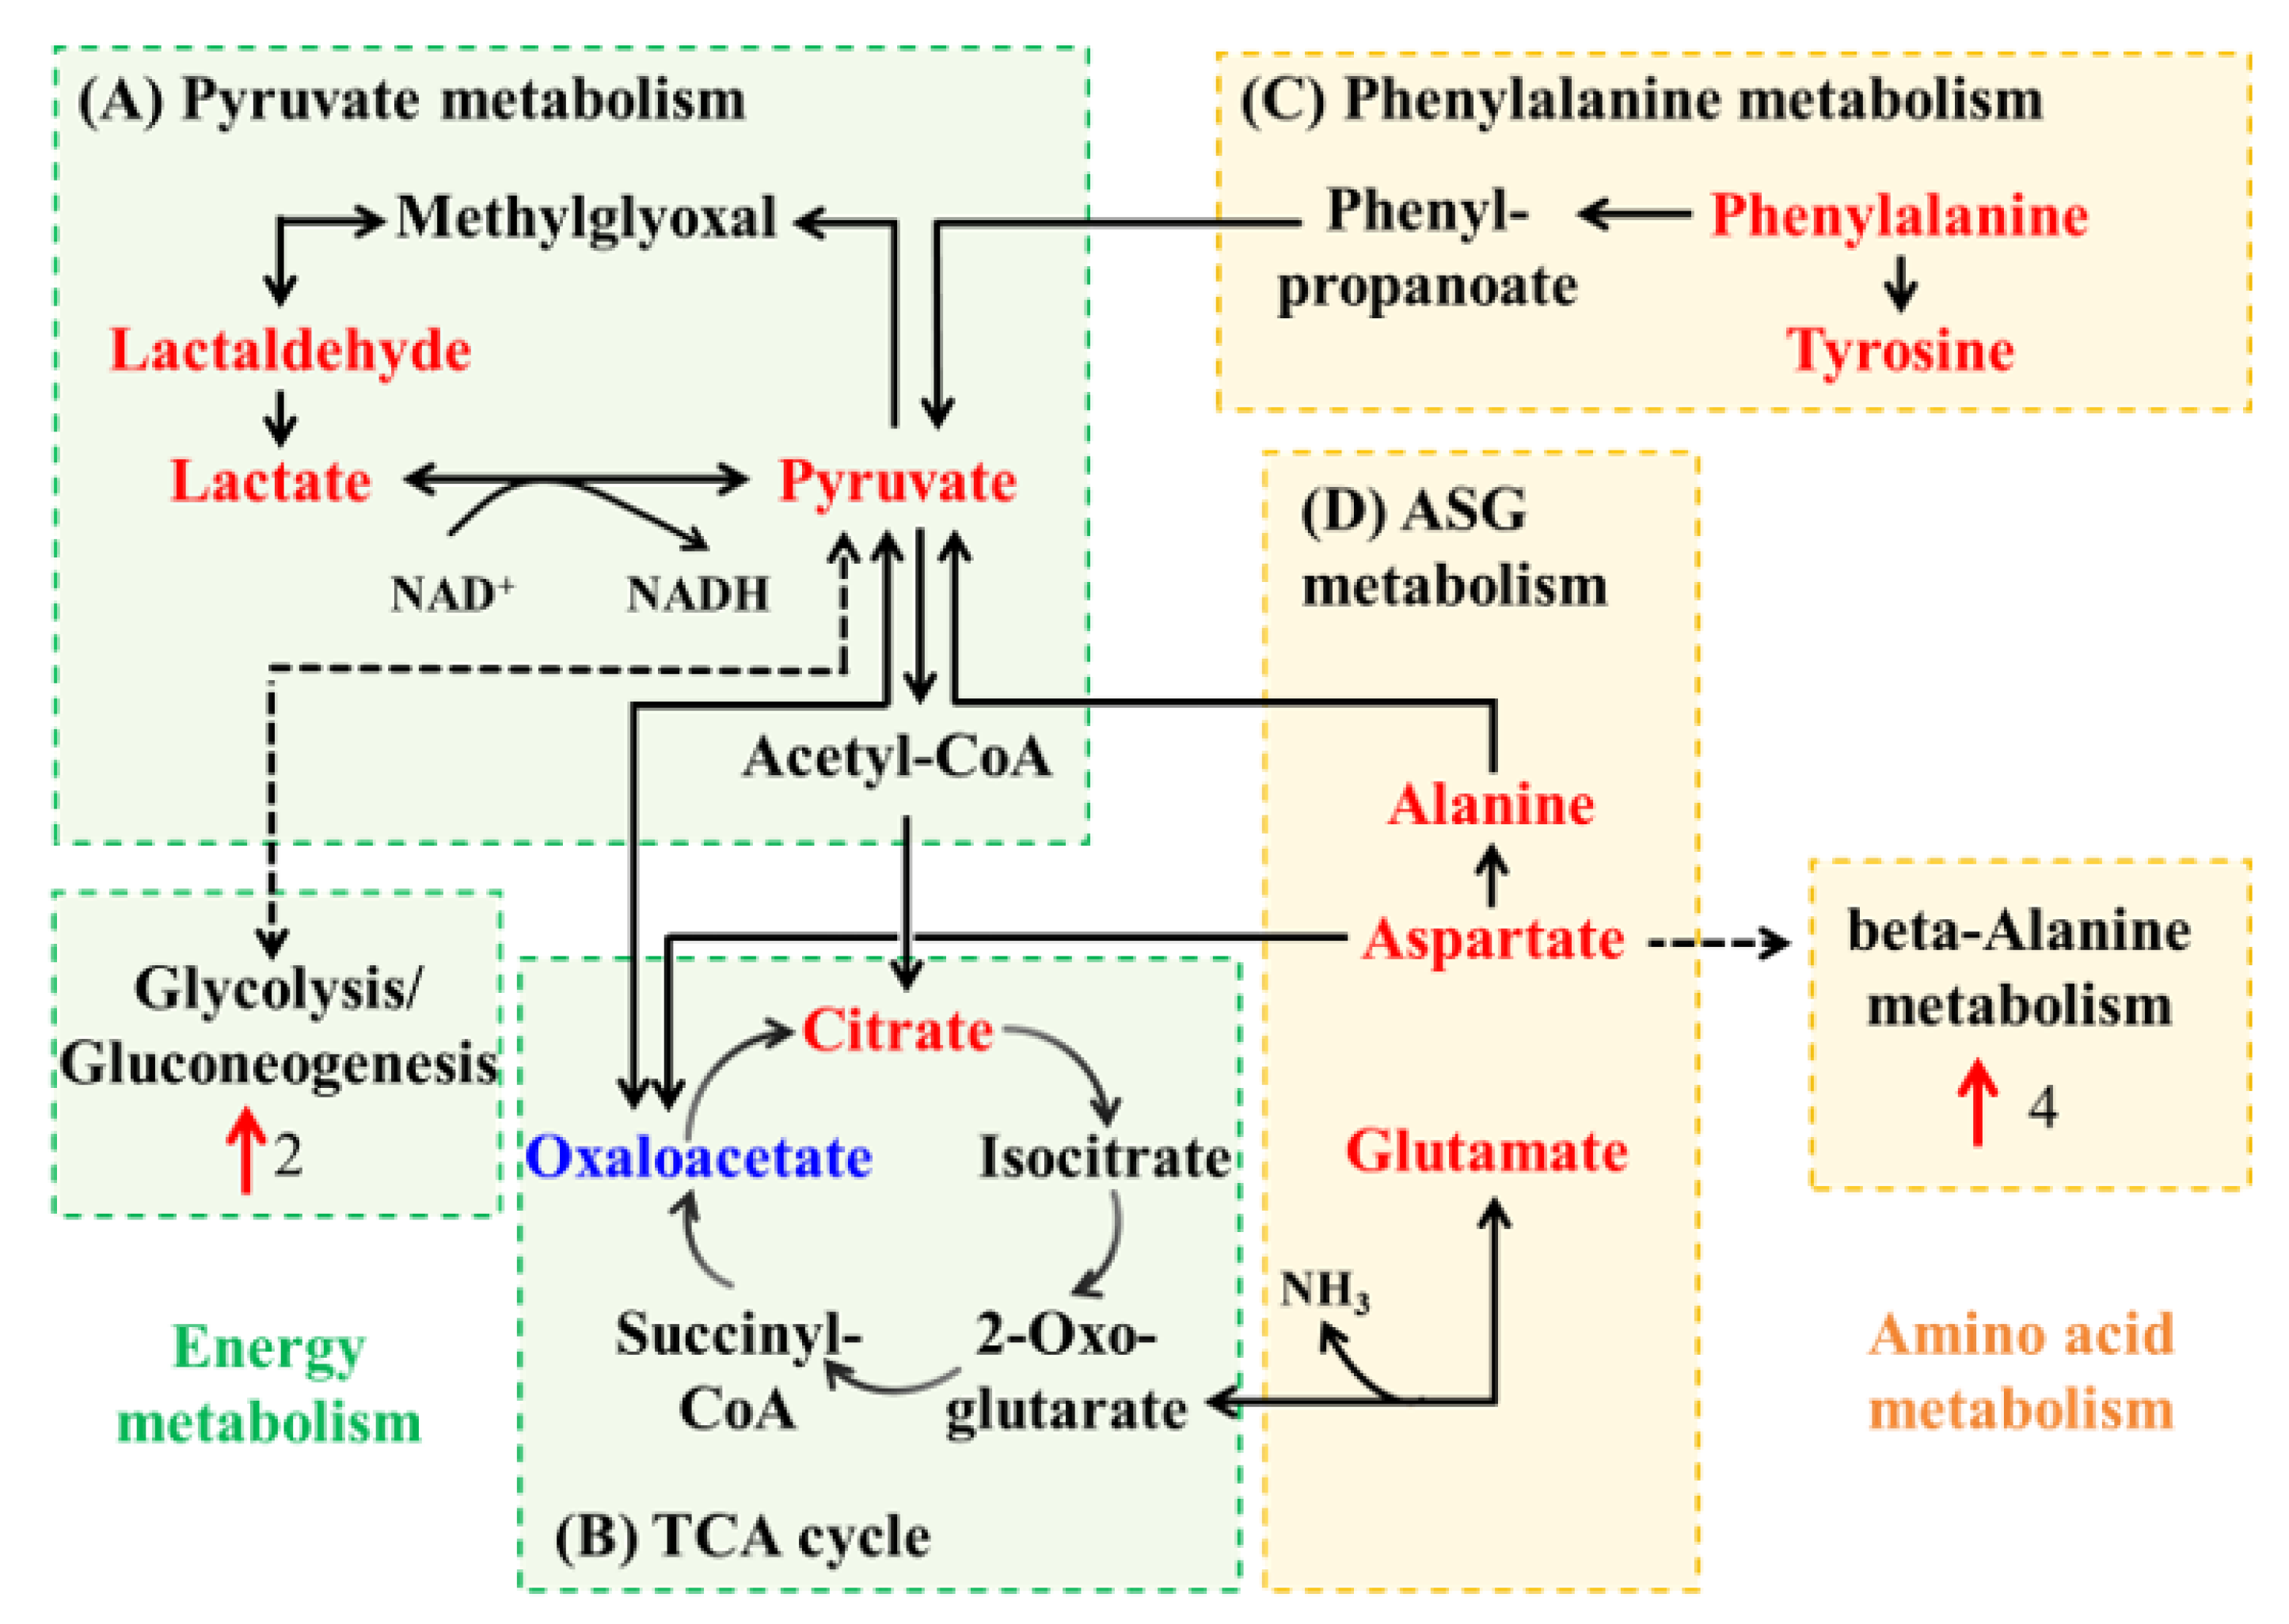
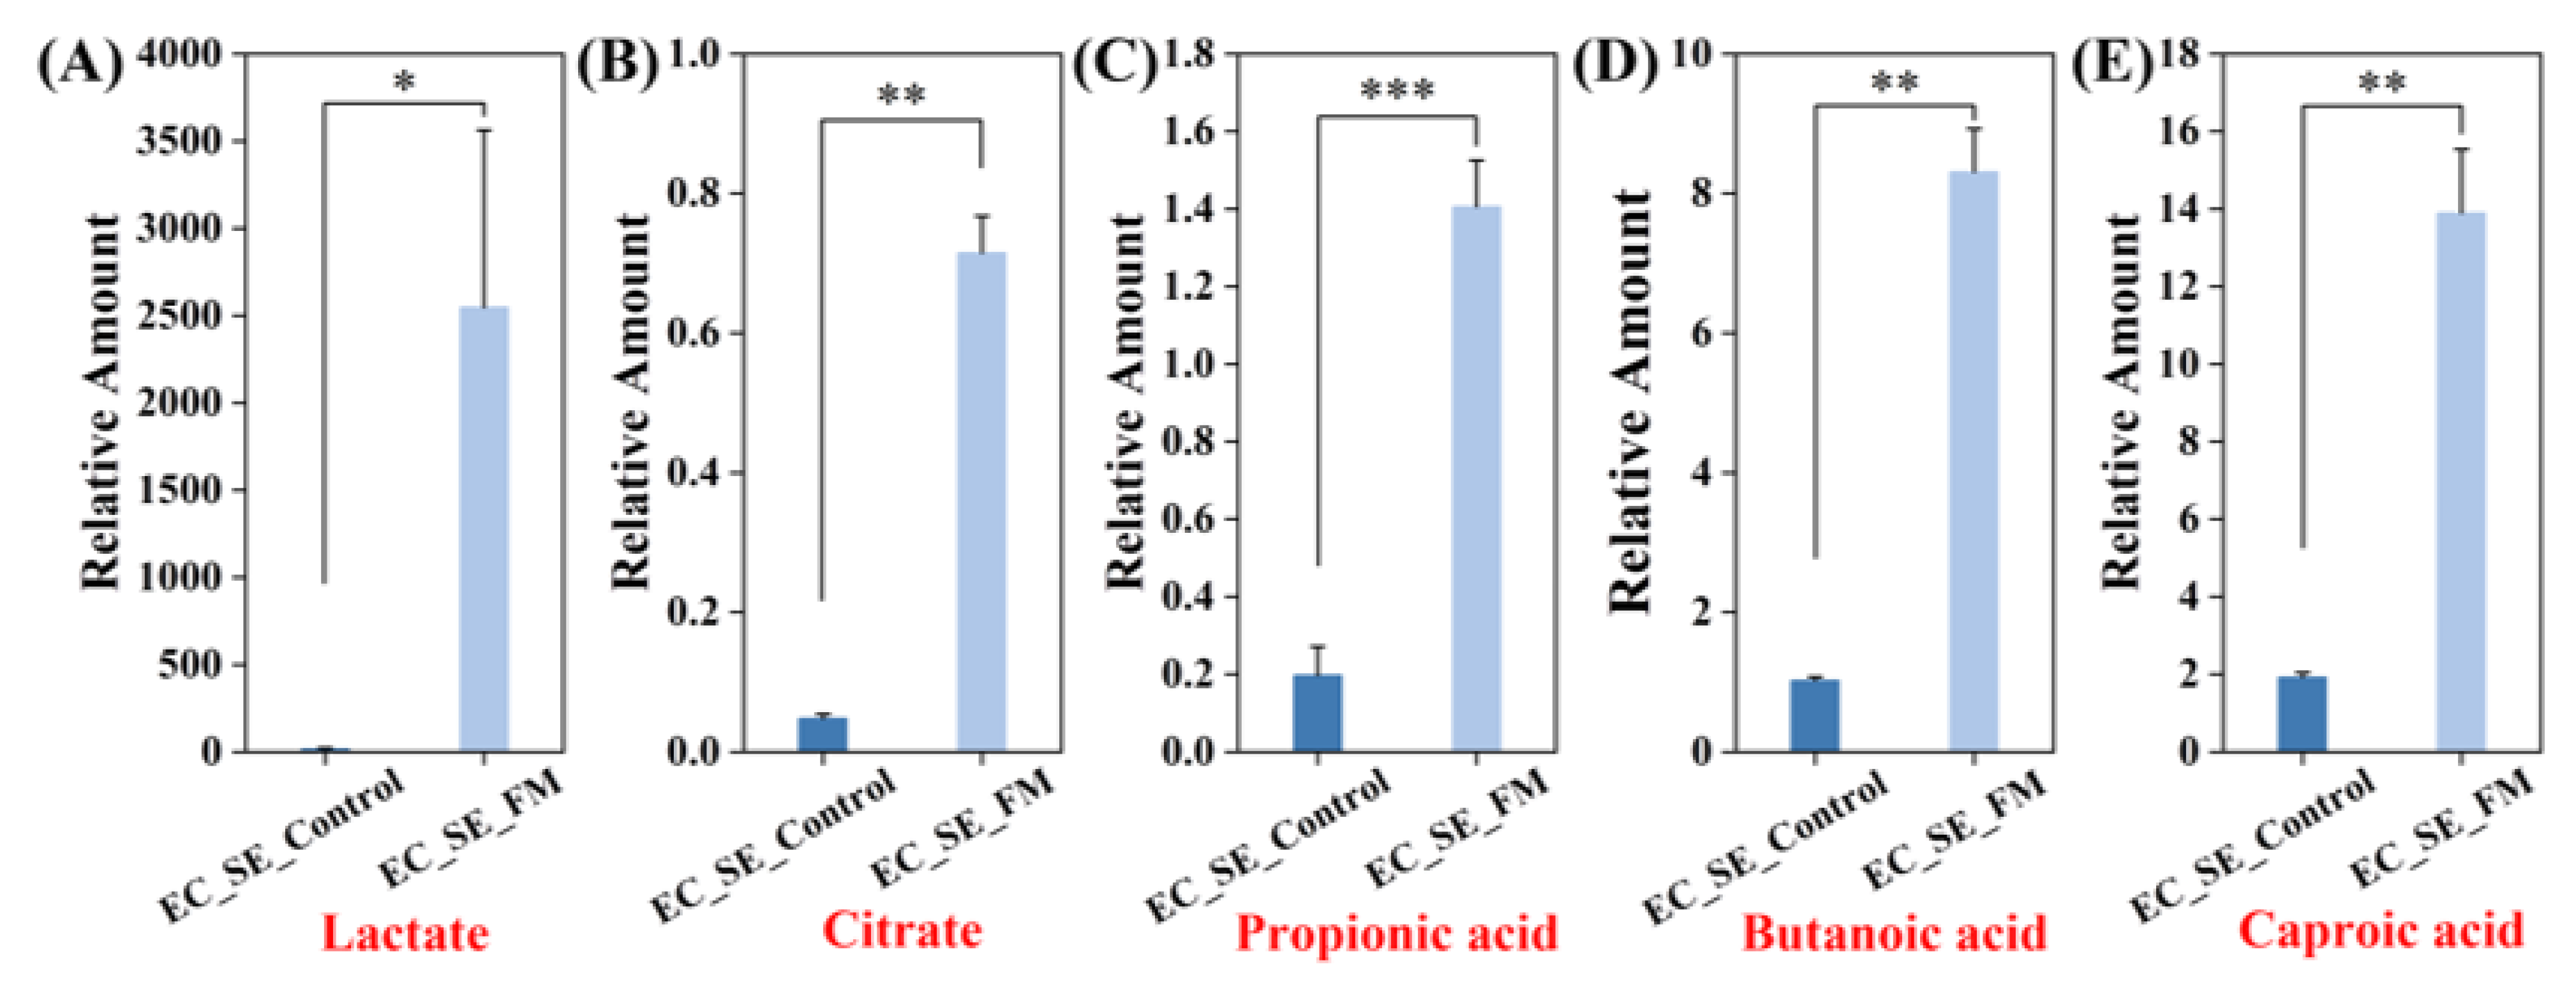
As shown in Figure 8, in the EC_SE co-culture group, the addition of FM upregulated four metabolic pathways: glycolysis conversion of glucose into pyruvate, lactate oxidation to pyruvate, and the conversion of alanine and phenylalanine to pyruvate. These pathways all lead to pyruvate accumulation, a key intermediate in the metabolic network crucial for bacterial growth and division [24]. Pyruvate can be oxidized to acetyl-CoA and then to citrate to enter the TCA cycle. In the metabolism of S. epidermidis, pyruvate can be converted into SCFAs via specific enzymes [25]. As shown in Figure 9, the levels of lactic acid, citric acid, and SCFAs were significantly upregulated in the co-culture group, which indicated that FM increased pyruvate content in the EC_SE co-culture group, thereby enhancing organic acid metabolism. Previous studies demonstrated that S. epidermidis was insensitive to organic acids like citric, lactic and butyric acids [26,27]. It primarily maintains pH homeostasis by increasing glutamate metabolism flux: the amino group of glutamate binds protons to act as a buffer, and glutamate undergoes enzymatic deamination to generate 2-oxoglutarate and release NH3, neutralizing protons in acidic environments to ensure normal growth [28,29]. However, the organic acids produced by bacterial metabolism could inhibit E. coli growth by penetrating the cell membrane and lowering intracellular pH, which could damage enzyme activity, proteins, DNA, and the outer membrane. Moreover, citric acid could chelate cell wall ions, potentially preventing nutrient absorption and causing damage or death, especially in Gram-negative bacteria [30].

3.4.2. Metabolic Network Analysis for Group SA_SE_Control vs. SA_SE_FM

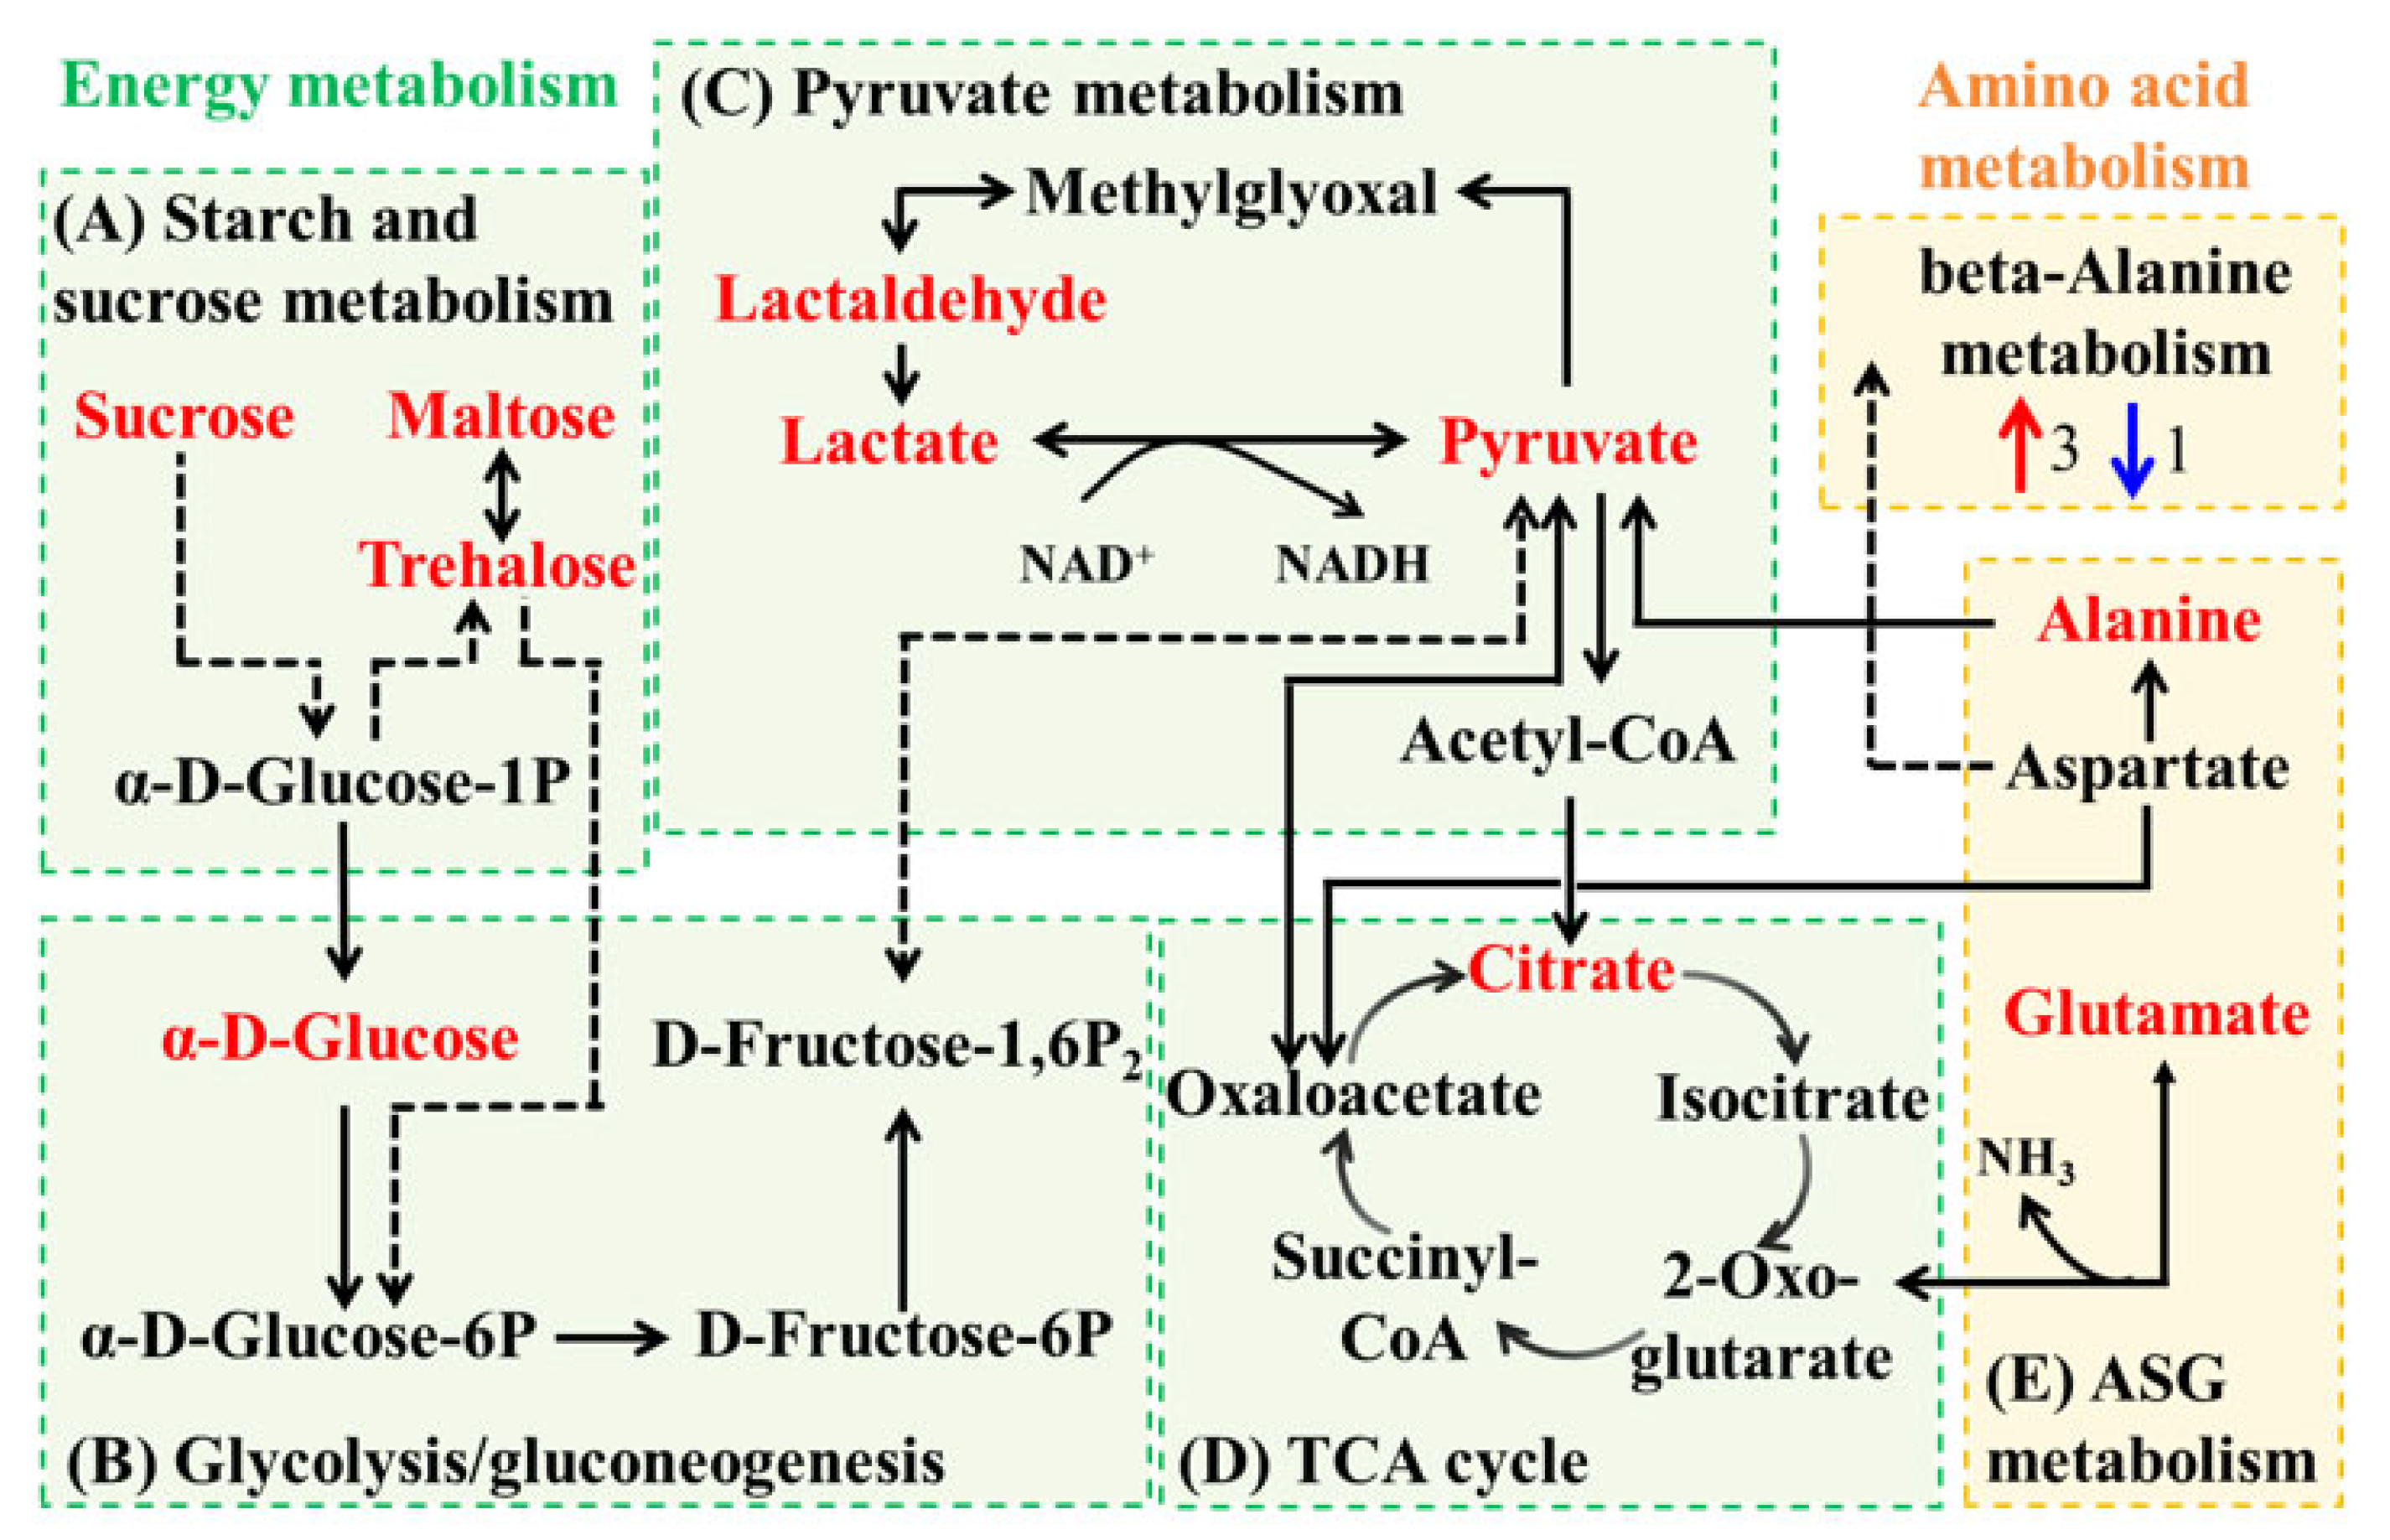
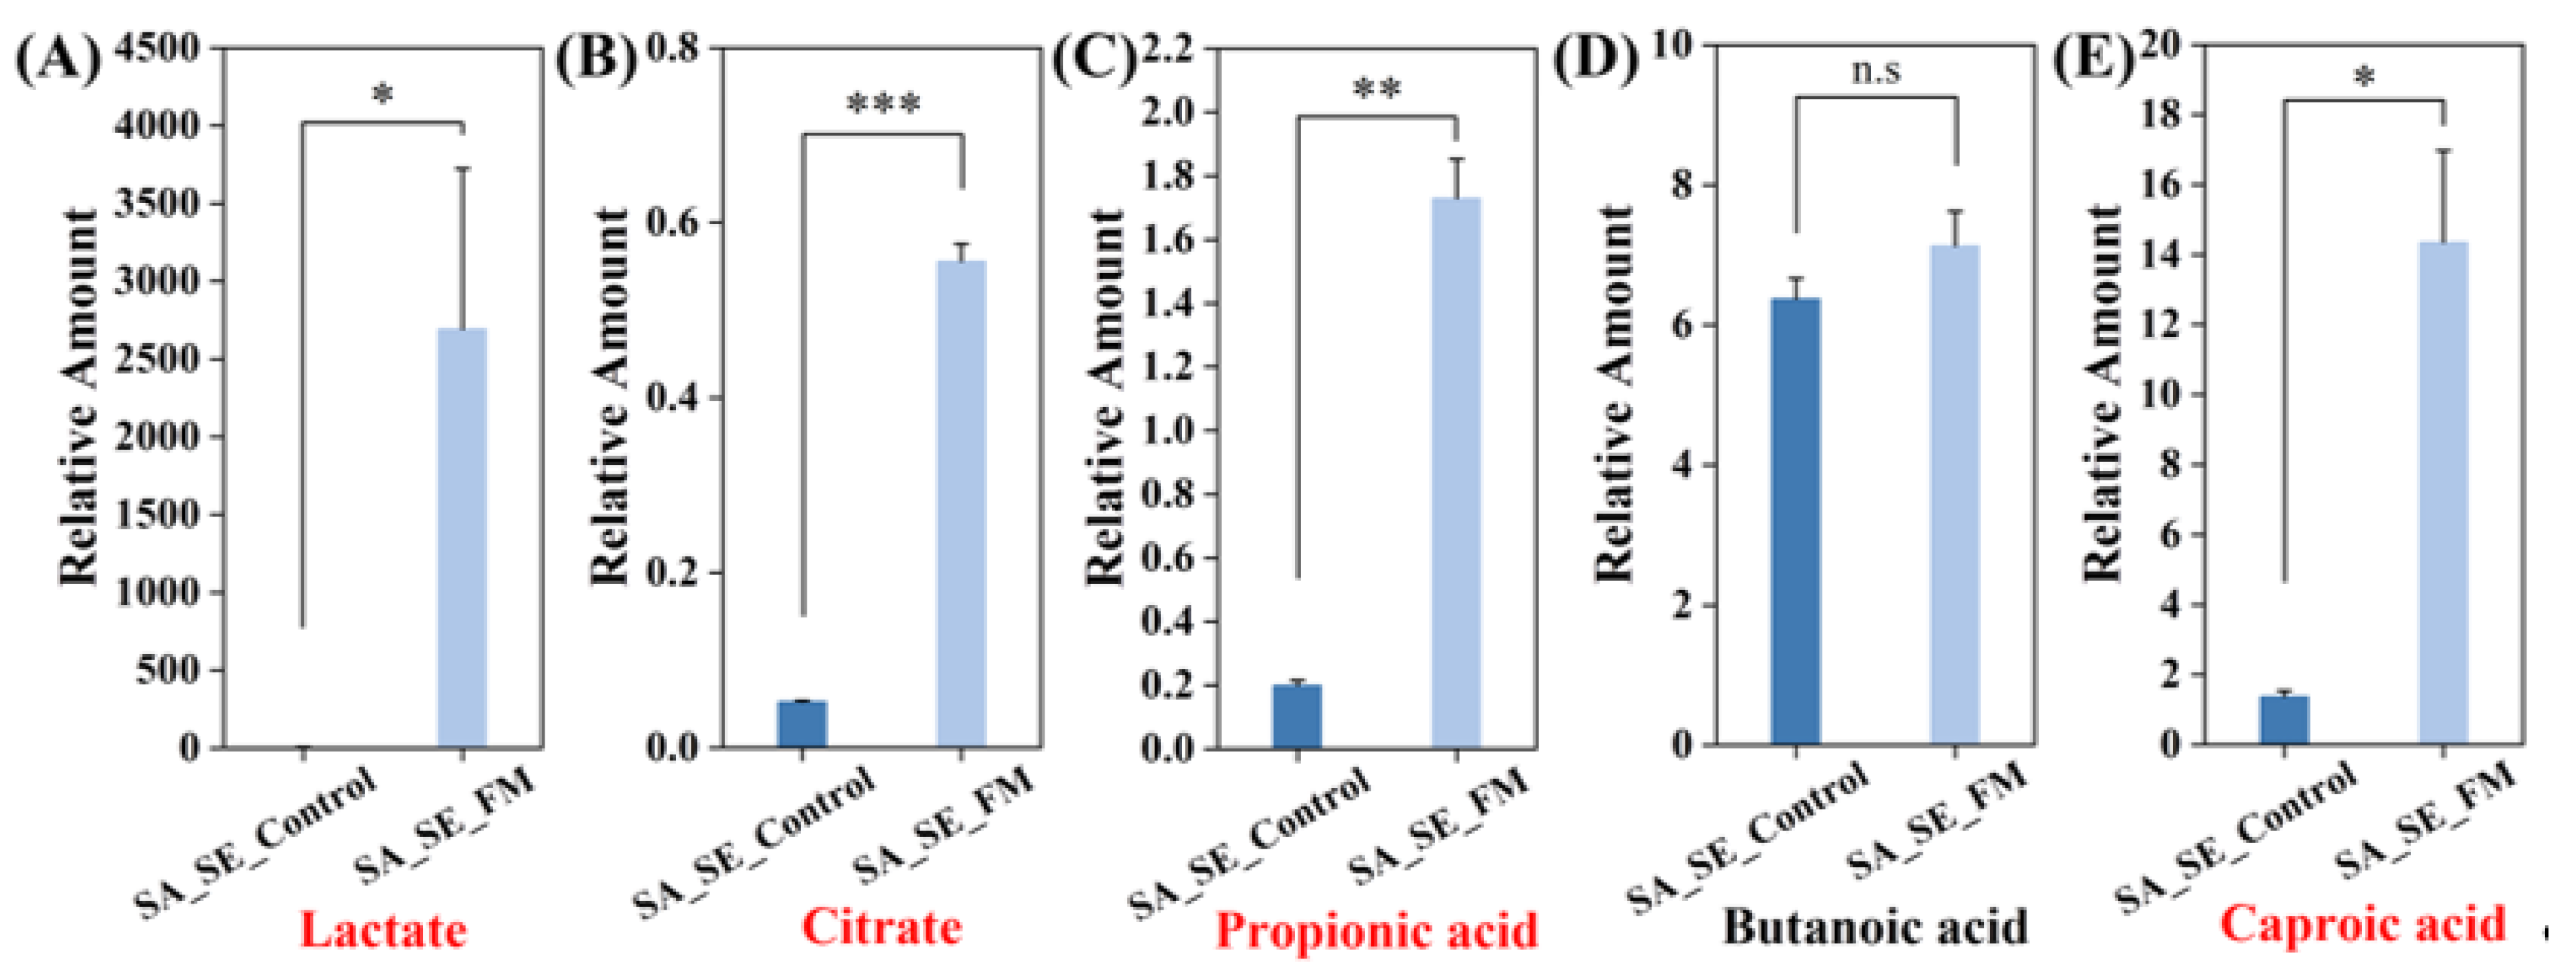
The metabolic network analysis of the SA_SE group revealed that FM treatment upregulates starch, sucrose, and pyruvate metabolism in the co-cultured bacteria’s energy metabolism pathway (Figure 10). The upregulation of pyruvate metabolism in turn increased citric acid metabolism in the TCA cycle, while also promoting lactic acid and SCFAs accumulation (Figure 11). The enhanced glutamate metabolism indicated that S. epidermidis had the ability to maintain cellular homeostasis under acidic conditions using glutamate. In contrast, S. aureus was highly sensitive to weak organic acids such as lactic and acetic acid, which were non-charged, lipophilic, and could permeate lipid bilayers, release protons intracellularly, thereby triggering cytoplasmic acidification and disrupting the proton gradient [31].
When subjected to acidic conditions, both E. coli and S. aureus initiate acid stress responses, including consumption of proton, generation of ammonium ion, and synthesis of neutral acetylated enzymes. While these mechanisms help them survive in acidic environments, they consume substantial energy at the same time, thus significantly limiting their reproduction [31,32]. The differences in metabolic regulations enabled FM to selectively inhibit harmful bacteria growth by modulating organic acid metabolism levels in co-cultures, maintaining symbiotic bacteria activity, and ultimately reconfiguring the bacterial community ratio in the EC_SE and SA_SE co-culture systems.

4. Conclusions

To sum up, this study discovered that in the monoculture of E. coli, S. aureus, or S. epidermidis, FM exhibited a promoting effect on the growth of S. epidermidis, while showing a significant inhibitory effect on E. coli and S. aureus. Conversely, PM promoted the growth of all three strains. In the co-culture systems of EC_SE group and SA_SE group, the addition of FM could selectively inhibit the growth of harmful bacteria, thereby achieving the goal of regulating the proportion of the bacterial flora and relatively increasing the colony count of the symbiotic bacterium S. epidermidis, while PM did not have this effect. Metabolomic analysis indicated that FM enhanced the survival advantage of S. epidermidis by regulating the metabolic network of the bacterial flora. Specifically, the addition of FM enhanced the pyruvate metabolic flux in the co-culture group, thereby significantly increasing the conversion of pyruvate to lactate, citrate, and SCFAs. Symbiotic bacteria maintained intracellular homeostasis through metabolic adaptability, while pathogenic bacteria were compelled to activate high-energy-consuming acid stress responses due to the disruption of transmembrane proton gradients mediated by organic acids, ultimately leading to the diminished reproductive capacity thanks to the imbalance of energy competition. This study used only three representative strains to illustrate the effect of FM on microbial balance. Given the immense diversity of the human skin microbiota and the complex interactions among its members, these findings cannot be extrapolated to the entire skin microbiota. Assessments on human skin or in animal models may more accurately reflect the regulatory effects of FM, and such work will be included in future studies. Nevertheless, despite inherent limitations, this metabolic-interaction-based regulatory approach provides a reference for the development of postbiotics aimed at maintaining skin microbiota homeostasis. Future work will report results from a broader range of skin strains and will include animal experiments.

Supplementary Materials

The following supporting information can be downloaded at: https://www.mdpi.com/article/10.3390/cosmetics12050232/s1, Table S1: Parameter table of OPLS-DA model; Figure S1: (A) Viable cell counts of SE (line) and EC (dot line) and (B) Viable cell counts of SE (line) and SA (dot line) vs. time for different co-culture conditions (Control, PM, and FM); Figure S2: Metabolite analysis of (A, C) EC_SE group treated with NB medium or FM for 12 h, and (B, D) SA_SE group treated with NB medium or FM for 12 h. (A, B) Scatter plot of OPLS-DA model, (C, D) Volcano map for differential metabolite screening; Figure S3: Permutation plot test of OPLS-DA model for (A) group EC_SE_Control vs. EC_SE_FM, and (B) group SA_SE_Control vs. SA_SE_FM.

Author Contributions

Conceptualization, Y.S., Y.D. and N.L.; methodology, Y.W., Z.R. and Y.S.; validation, Z.R.; formal analysis, Y.W. and B.Z.; investigation, Y.W., B.Z. and Y.S.; data curation, Y.W. and Z.R.; writing—original draft preparation, Y.W.; writing—review and editing, Y.S., B.Z., S.W. and N.L.; supervision, Y.S., C.Y. and N.L.; funding acquisition, Y.S.; resources, S.W. and N.L.; project administration, B.Z. All authors have read and agreed to the published version of the manuscript.

Funding

This work was supported by National Natural Science Foundation of China (No.51903108), China Postdoctoral Science Foundation (No. 2020M671333), “Dual Initiative Project” of Jiangsu Province.

Institutional Review Board Statement

Not applicable.

Informed Consent Statement

Not applicable.

Data Availability Statement

The data presented in this study are available upon request from the corresponding authors.

Conflicts of Interest

Shasha Wang, Yun Ding, and Nan Liu the authors are employees of Hangzhou Island Xingqing Biotechnology Co., Ltd. The remain authors declare that the research was conducted in the absence of any commercial or financial relationships that could be construed as a potential conflict of interest. The funders had no role in the design of the study; in the collection, analyses or interpretation of data; in the writing of the manuscript; or in the decision to publish the results.

References

  1. Skowron, K.; Bauza-Kaszewska, J.; Kraszewska, Z.; Wiktorczyk-Kapischke, N.; Grudlewska-Buda, K.; Kwiecińska-Piróg, J.; Wałecka-Zacharska, E.; Radtke, L.; Gospodarek-Komkowska, E. Human skin microbiome: Impact of intrinsic and extrinsic factors on skin microbiota. Microorganisms 2021, 9, 543. [Google Scholar] [CrossRef]
  2. Belkaid, Y.; Tamoutounour, S. The influence of skin microorganisms on cutaneous immunity. Nat. Rev. Immunol. 2016, 16, 353–366. [Google Scholar] [CrossRef]
  3. Leonel, C.; Sena, I.F.G.; Silva, W.N.; Prazeres, P.H.D.M.; Fernandes, G.R.; Mancha Agresti, P.M.; Drumond, M.M.; Mintz, A.; Azevedo, V.A.C.; Birbrair, A. Staphylococcus epidermidis role in the skin microenvironment. J. Cell Mol. Med. 2019, 23, 5949–5955. [Google Scholar] [CrossRef]
  4. Williams, M.R.; Gallo, R.L. Evidence that human skin microbiome dysbiosis promotes atopic dermatitis. J. Investig. Dermatol. 2017, 137, 2460–2461. [Google Scholar] [CrossRef] [PubMed]
  5. Wu, Z.; Wu, Y.; Fischer, J.; Bartels, J.; Schröder, J.M.; Meyer-Hoffert, U. Skin-derived SPINK9 kills Escherichia coli. J. Investig. Dermatol. 2019, 139, 1135–1142. [Google Scholar] [CrossRef]
  6. Harris-Tryon, T.A.; Grice, E.A. Microbiota and maintenance of skin barrier function. Science 2022, 376, 940–945. [Google Scholar] [CrossRef] [PubMed]
  7. Byrd, A.L.; Belkaid, Y.; Segre, J.A. The human skin microbiome. Nat. Rev. Microbiol. 2018, 16, 143–155. [Google Scholar] [CrossRef]
  8. Yang, Y.; Qu, L.; Mijakovic, I.; Wei, Y. Advances in the human skin microbiota and its roles in cutaneous diseases. Microb. Cell Factories 2022, 21, 176–190. [Google Scholar] [CrossRef]
  9. Boxberger, M.; Cenizo, V.; Cassir, N.; La Scola, B. Challenges in exploring and manipulating the human skin microbiome. Microbiome 2021, 9, 125. [Google Scholar] [CrossRef]
  10. Ruddell, S.A.; Mostert, D.; Sieber, S.A. Target identification of usnic acid in bacterial and human cells. RSC Chem. Biol. 2024, 5, 617–621. [Google Scholar] [CrossRef] [PubMed]
  11. Valookolaei, F.S.G.; Sazegar, H.; Rouhi, L. Limonene encapsulated alginate/collagen as antibiofilm drug against Acinetobacter baumannii. BMC Biotechnol. 2024, 24, 86–101. [Google Scholar] [CrossRef]
  12. Zhang, W.; Wang, X.; Zhao, L.; Gu, Y.; Chen, Y.; Liu, N.; An, L.; Lu, Y.; Cui, S. Effect of leave-on cosmetic antimicrobial preservatives on healthy skin resident Staphylococcus epidermidis. J. Cosmet. Dermatol. 2023, 22, 2115–2121. [Google Scholar]
  13. De Almeida, C.V.; Antiga, E.; Lulli, M. Oral and topical probiotics and postbiotics in skincare and dermatological therapy: A concise review. Microorganisms 2023, 11, 1420–1437. [Google Scholar] [CrossRef]
  14. Han, J.H.; Kim, H.S. Skin deep: The potential of microbiome cosmetics. J. Microbiol. 2024, 62, 181–199. [Google Scholar] [CrossRef]
  15. Wang, Y.; Zhao, B.; Ding, Y.; Liu, N.; Yang, C.; Sun, Y. Improved anti-oxidant and anti-bacterial capacities of skim milk fermented by Lactobacillus plantarum. Molecules 2024, 29, 3800–3813. [Google Scholar] [CrossRef] [PubMed]
  16. Rajapitamahuni, S.; Lyou, E.S.; Kang, B.R.; Lee, T.K. Microbial interaction-induced siderophore dynamics lead to phenotypic differentiation of Staphylococcus aureus. Front. Cell Infect. Microbiol. 2023, 13, 1277176–1277185. [Google Scholar] [CrossRef] [PubMed]
  17. Pinu, F.; Villas-Boas, S.; Aggio, R. Analysis of intracellular metabolites from microorganisms: Quenching and extraction protocols. Metabolites 2017, 7, 53–72. [Google Scholar] [CrossRef] [PubMed]
  18. Jin, H.; Ma, H.; Gan, N.; Wang, H.; Li, Y.; Wang, L.; Song, L. Non-targeted metabolomic profiling of filamentous cyanobacteria aphanizomenon flos-aquae exposed to a concentrated culture filtrate of Microcystis aeruginosa. Harmful Algae 2022, 11, 102170–102178. [Google Scholar] [CrossRef]
  19. Ohn, H.; Mizuno, T.; Miyoshi, S. Inhibitory effects of Escherichia coli on the formation and development of Staphylococcus epidermidis biofilm. Biocontrol. Sci. 2021, 26, 113–118. [Google Scholar] [CrossRef]
  20. Kline, K.A.; Costa, F.G.; Horswill, A.R. Overcoming pH defenses on the skin to establish infections. PLoS Pathog. 2022, 18, e1010512. [Google Scholar]
  21. Wang, Q.Z.; Wu, C.Y.; Chen, T.; Chen, X.; Zhao, X.M. Integrating metabolomics into a systems biology framework to exploit metabolic complexity: Strategies and applications in microorganisms. Appl. Microbiol. Biotechnol. 2006, 70, 151–161. [Google Scholar] [CrossRef] [PubMed]
  22. Yang, X.; Lai, J.L.; Li, J.; Zhang, Y.; Luo, X.G.; Han, M.W.; Zhu, Y.B.; Zhao, S.P. Biodegradation and physiological response mechanism of Bacillus aryabhattai to cyclotetramethylenete-tranitramine (HMX) contamination. J. Environ. Manag. 2021, 288, 112247–112256. [Google Scholar] [CrossRef]
  23. Wu, R.T.; Chen, J.Y.; Liu, S.; Niu, S.H.; Liao, X.D.; Xing, S.C. Cyclic AMP and biofilms reveal the synergistic proliferation strategy of Pseudomonas aeruginosa and Escherichia coli under the costimulation of high concentrations of microplastics and enrofloxacin. Sci. Total Environ. 2022, 838, 156740–156750. [Google Scholar]
  24. Hao, H.; Zhang, X.; Chen, S.; Lan, S.; Li, Z.; Liu, S.; Yan, X.; Gao, P.; Chu, Y. Comparative untargeted and targeted metabonomics reveal discriminations in metabolite profiles between Mycoplasma capricolum subsp. capripneumoniae and Mycoplasma capricolum subsp. capricolum. Front. Microbiol. 2023, 14, 1294055–1294067. [Google Scholar] [CrossRef]
  25. Negari, I.P.; Keshari, S.; Huang, C.M. Probiotic activity of Staphylococcus epidermidis induces collagen Type I production through FFaR2/p-ERK signaling. Int. J. Mol. Sci. 2021, 22, 1414–1427. [Google Scholar] [CrossRef]
  26. Hwang, J.; Thompson, A.; Jaros, J.; Blackcloud, P.; Hsiao, J.; Shi, V.Y. Updated understanding of Staphylococcus aureus in atopic dermatitis: From virulence factors to commensals and clonal complexes. Exp. Dermatol. 2021, 30, 1532–1545. [Google Scholar] [CrossRef] [PubMed]
  27. Salgaonkar, N.; Kadamkode, V.; Kumaran, S.; Mallemala, P.; Christy, E.; Appavoo, S.; Majumdar, A.; Mitra, R.; Dasgupta, A. Glycerol fermentation by skin bacteria generates lactic acid and upregulates the expression levels of genes associated with the skin barrier function. Exp. Dermatol. 2022, 31, 1364–1372. [Google Scholar] [CrossRef]
  28. Krulwich, T.A.; Sachs, G.; Padan, E. Molecular aspects of bacterial pH sensing and homeostasis. Nat. Rev. Microbiol. 2011, 9, 330–343. [Google Scholar] [CrossRef]
  29. Sfriso, R.; Egert, M.; Gempeler, M.; Voegeli, R.; Campiche, R. Revealing the secret life of skin-with the microbiome you never walk alone. Int. J. Cosmet. Sci. 2019, 42, 116–126. [Google Scholar]
  30. Su, L.C.; Xie, Z.; Zhang, Y.; Nguyen, K.T.; Yang, J. Study on the antimicrobial properties of citrate-based biodegradable polymers. Front. Bioeng. Biotechnol. 2014, 2, 23–31. [Google Scholar] [CrossRef]
  31. Loi, V.V.; Busche, T.; Kuropka, B.; Müller, S.; Methling, K.; Lalk, M.; Kalinowski, J.; Antelmann, H. Staphylococcus aureus adapts to the immunometabolite itaconic acid by inducing acid and oxidative stress responses including S-bacillithiolations and S-itaconations. Free Radic. Biol. Med. 2023, 208, 859–876. [Google Scholar] [CrossRef] [PubMed]
  32. Lund, P.A.; Biase, D.D.; Liran, O.; Scheler, O.; Mira, N.P.; Cetecioglu, Z.; Fernández, E.N.; Bover-Cid, S.; Hall, R.; Sauer, M.; et al. Understanding how microorganisms respond to acid pH is central to their control and successful exploitation. Front. Microbiol. 2020, 11, 556140–556147. [Google Scholar] [CrossRef] [PubMed]
Figure 1. Schematic diagram of fermented milk (FM) with (A) S. epidermidis and E. coli co-culture (EC_SE) group, and (B) S. epidermidis and S. aureus co-culture (SA_SE) group.
Cosmetics 12 00232 g001
Figure 2. The bacterial survival rate of S. epidermidis, E. coli, and S. aureus after incubation with 100 mg/mL of PM or FM for 24 h. Different lowercase letters denote significant differences (p < 0.05) in the bacterial survival rates of the three strains following treatment with PM or FM (n = 3).
Cosmetics 12 00232 g002
Figure 3. Spread plate method to observe the total plate count of S. epidermidis and E. coli grown for 0, 6, 12, and 24 h in (A) NB medium without samples, (B) NB medium involving 100 mg/mL of PM, (C) NB medium involving 100 mg/mL of FM. The plates illustrated the outcomes of plating 100 μL of bacterial solution which had been diluted 105 times (n = 3).
Cosmetics 12 00232 g003
Figure 4. In co-culture, the ratio of the bacterial count of S. epidermidis to E. coli, as a function of time. Different letters (a–g) represent significant differences between groups (p < 0.05).
Cosmetics 12 00232 g004
Figure 5. Spread plate method to observe the total plate count of S. epidermidis and S. aureus grown for 0, 6, 12, and 24 h in (A) NB medium without samples, (B) NB medium involving 100 mg/mL of PM, (C) NB medium involving 100 mg/mL of FM. The plates illustrated the outcomes of plating 100 μL of bacterial solution which had been diluted 105 times (n = 3).
Cosmetics 12 00232 g005
Figure 6. In co-culture, the ratio of the bacterial count of S. epidermidis to S. aureus as a function of time. Different letters (a–f) represent significant differences between groups (p < 0.05).
Cosmetics 12 00232 g006
Figure 7. (A) Differential metabolite pathway analysis diagram. (A) EC_SE_Control vs. EC_SE_FM, (B) SA_SE_Control vs. SA_SE_FM.
Cosmetics 12 00232 g007
Figure 8. Network analysis of energy metabolism and amino acid metabolism in EC_SE group exposed to FM. (A) Pyruvate metabolism, (B) Tricarboxylic acid (TCA) cycle, (C) Phenylalanine metabolism, and (D) Alanine, aspartate and glutamate (ASG) metabolism. Red corresponds the upregulation of differentially expressed metabolites and blue corresponds the downregulation of differentially expressed metabolites. Green boxes indicate energy metabolic pathways (including pyruvate metabolism, TCA cycle and glycolysis) and yellow boxes indicate amino acid metabolic pathways (including phenylalanine metabolism and ASG metabolism).
Cosmetics 12 00232 g008
Figure 9. Relative contents of (A) lactate, (B) citrate, (C) propionic acid, (D) butanoic acid, and (E) caproic acid metabolites in EC_SE_Control vs. EC_SE_FM groups (n = 3). *, ** and *** mean p < 0.05, p < 0.01 and p < 0.001, respectively. The red-highlighted terms (lactate, citrate, propionic acid, butanoic acid and caproic acid) exhibit significant differences across samples.
Cosmetics 12 00232 g009
Figure 10. Network analysis of energy metabolism and amino acid metabolism in the SA_SE group exposed to FM. (A) Starch and sucrose metabolism, (B) Glycolysis/gluconeogenesis, (C) Pyruvate metabolism, (D) TCA cycle, and (E) ASG metabolism. Red corresponds the upregulation of differentially expressed metabolites and blue corresponds the downregulation of differentially expressed metabolites. Green boxes indicate energy metabolic pathways (including starch and sucrose metabolism, pyruvate metabolism, TCA cycle and glycolysis) and yellow boxes indicate amino acid metabolic pathways (including beta-alanine metabolism and ASG metabolism).
Cosmetics 12 00232 g010
Figure 11. Relative contents of (A) lactate, (B) citrate, (C) propionic acid, (D) butanoic acid, and (E) caproic acid metabolites in SA_SE_Control vs. SA_SE_FM groups (n = 3). n.s indicates no significance; *, ** and *** mean p < 0.05, p < 0.01 and p < 0.001, respectively. The red-highlighted terms (lactate, citrate, propionic acid, and caproic acid) exhibit significant differences across samples, whereas the black-highlighted term (butanoic acid) shows no significant difference between samples.
Cosmetics 12 00232 g011
Disclaimer/Publisher’s Note: The statements, opinions and data contained in all publications are solely those of the individual author(s) and contributor(s) and not of MDPI and/or the editor(s). MDPI and/or the editor(s) disclaim responsibility for any injury to people or property resulting from any ideas, methods, instructions or products referred to in the content.