Article

Historical Analysis and Prediction of the Magnitude and Scale of Natural Disasters Globally

by
Julia Buszta
1,
Katarzyna Wójcik
1,
Celso Augusto Guimarães Santos
2,
Krystian Kozioł
1 and
Kamil Maciuk
1,*
1
Department of Integrated Geodesy and Cartography, AGH University of Science and Technology, 30349 Krakow, Poland
2
Department of Civil and Environmental Engineering, Federal University of Paraíba, João Pessoa 58051-900, Brazil
*
Author to whom correspondence should be addressed.
Resources 2023, 12(9), 106; https://doi.org/10.3390/resources12090106
Submission received: 11 May 2023 / Revised: 14 August 2023 / Accepted: 16 August 2023 / Published: 5 September 2023

Abstract

:
The aim of this study was to conduct a geospatial analysis of natural disasters occurring worldwide between 1960 and 2018. A total of 9962 disasters were considered, covering 39,953 locations. These phenomena were analysed in terms of frequency and number to determine changes over time and predict future trends. The data included information such as location and year of occurrence. The following natural disasters were included in the analyses: droughts, earthquakes, extreme temperatures, floods, landslides, earth mass movements, storms, and volcanic activity. The analyses were carried out across three dimensions: by continent, by number of disasters in relation to population, and in relation to the area of the continents concerned. An additional objective was to visualise the distribution of disasters by affected countries. This aspect shows the incidence of disasters by year during the period under study, with a 20-year forecast for the coming years.

Graphical Abstract

1. Introduction

The subject of this paper is a geospatial analysis of natural disasters occurring around the world over the years 1960–2018. Generally, these disasters are caused by natural phenomena, but there are also some to which human activity has contributed [1]. Many of them cannot be predicted and occur unexpectedly, while others can be detected in advance. Regardless, each of these events is a tragedy for the affected community, with consequences not only in material losses but also threats to human health and life. Depending on the severity of the phenomenon, the impacts can vary widely. These phenomena have always been studied in terms of causes, impacts, trends, and counteraction measures [2,3]. Before the increase in human activity on Earth, many geophysical events (earthquakes, volcanic activity, landslides, etc.) impacted only flora and fauna, and such events are termed natural disasters [4]. Currently, a great deal of research is considering the impact of human activity on the risk of natural disasters [5]. This research has revealed that human impact is becoming more evident [6] and leads to many consequences, such as human and animal relocation, a gender gap, dislocations of economic activity, and many others [7,8]. Research has also dealt with the magnitude, number, and frequencies of natural disasters’ occurrences [9,10]. Assessments have been made of global exposure and vulnerability, spatial distribution, and damages connected with climate change. Natural disasters have been the subject of research in many different scientific fields, primarily earth sciences, sociology [11,12,13,14,15], economics [16,17,18,19] but also psychology and health [20,21,22]. The methods adopted in this paper are wide-ranging geostatistical methods, typically used in mapping, GIS, or geography applications [23,24,25].
In the present study, the authors analysed the long-term incidence of natural disasters in terms of frequency and number, in order to determine their changes over time and space, as well as future trends. Similar research in this area has been conducted, but not over such a long period, and primarily covering the impact on the affected people [26] or disaster risk parameters.
The main objectives of this paper are:
  • Determining the areas (countries, continents) most affected by the analysed phenomena;
  • Calculating the impact on human life, based on the number of affected citizens;
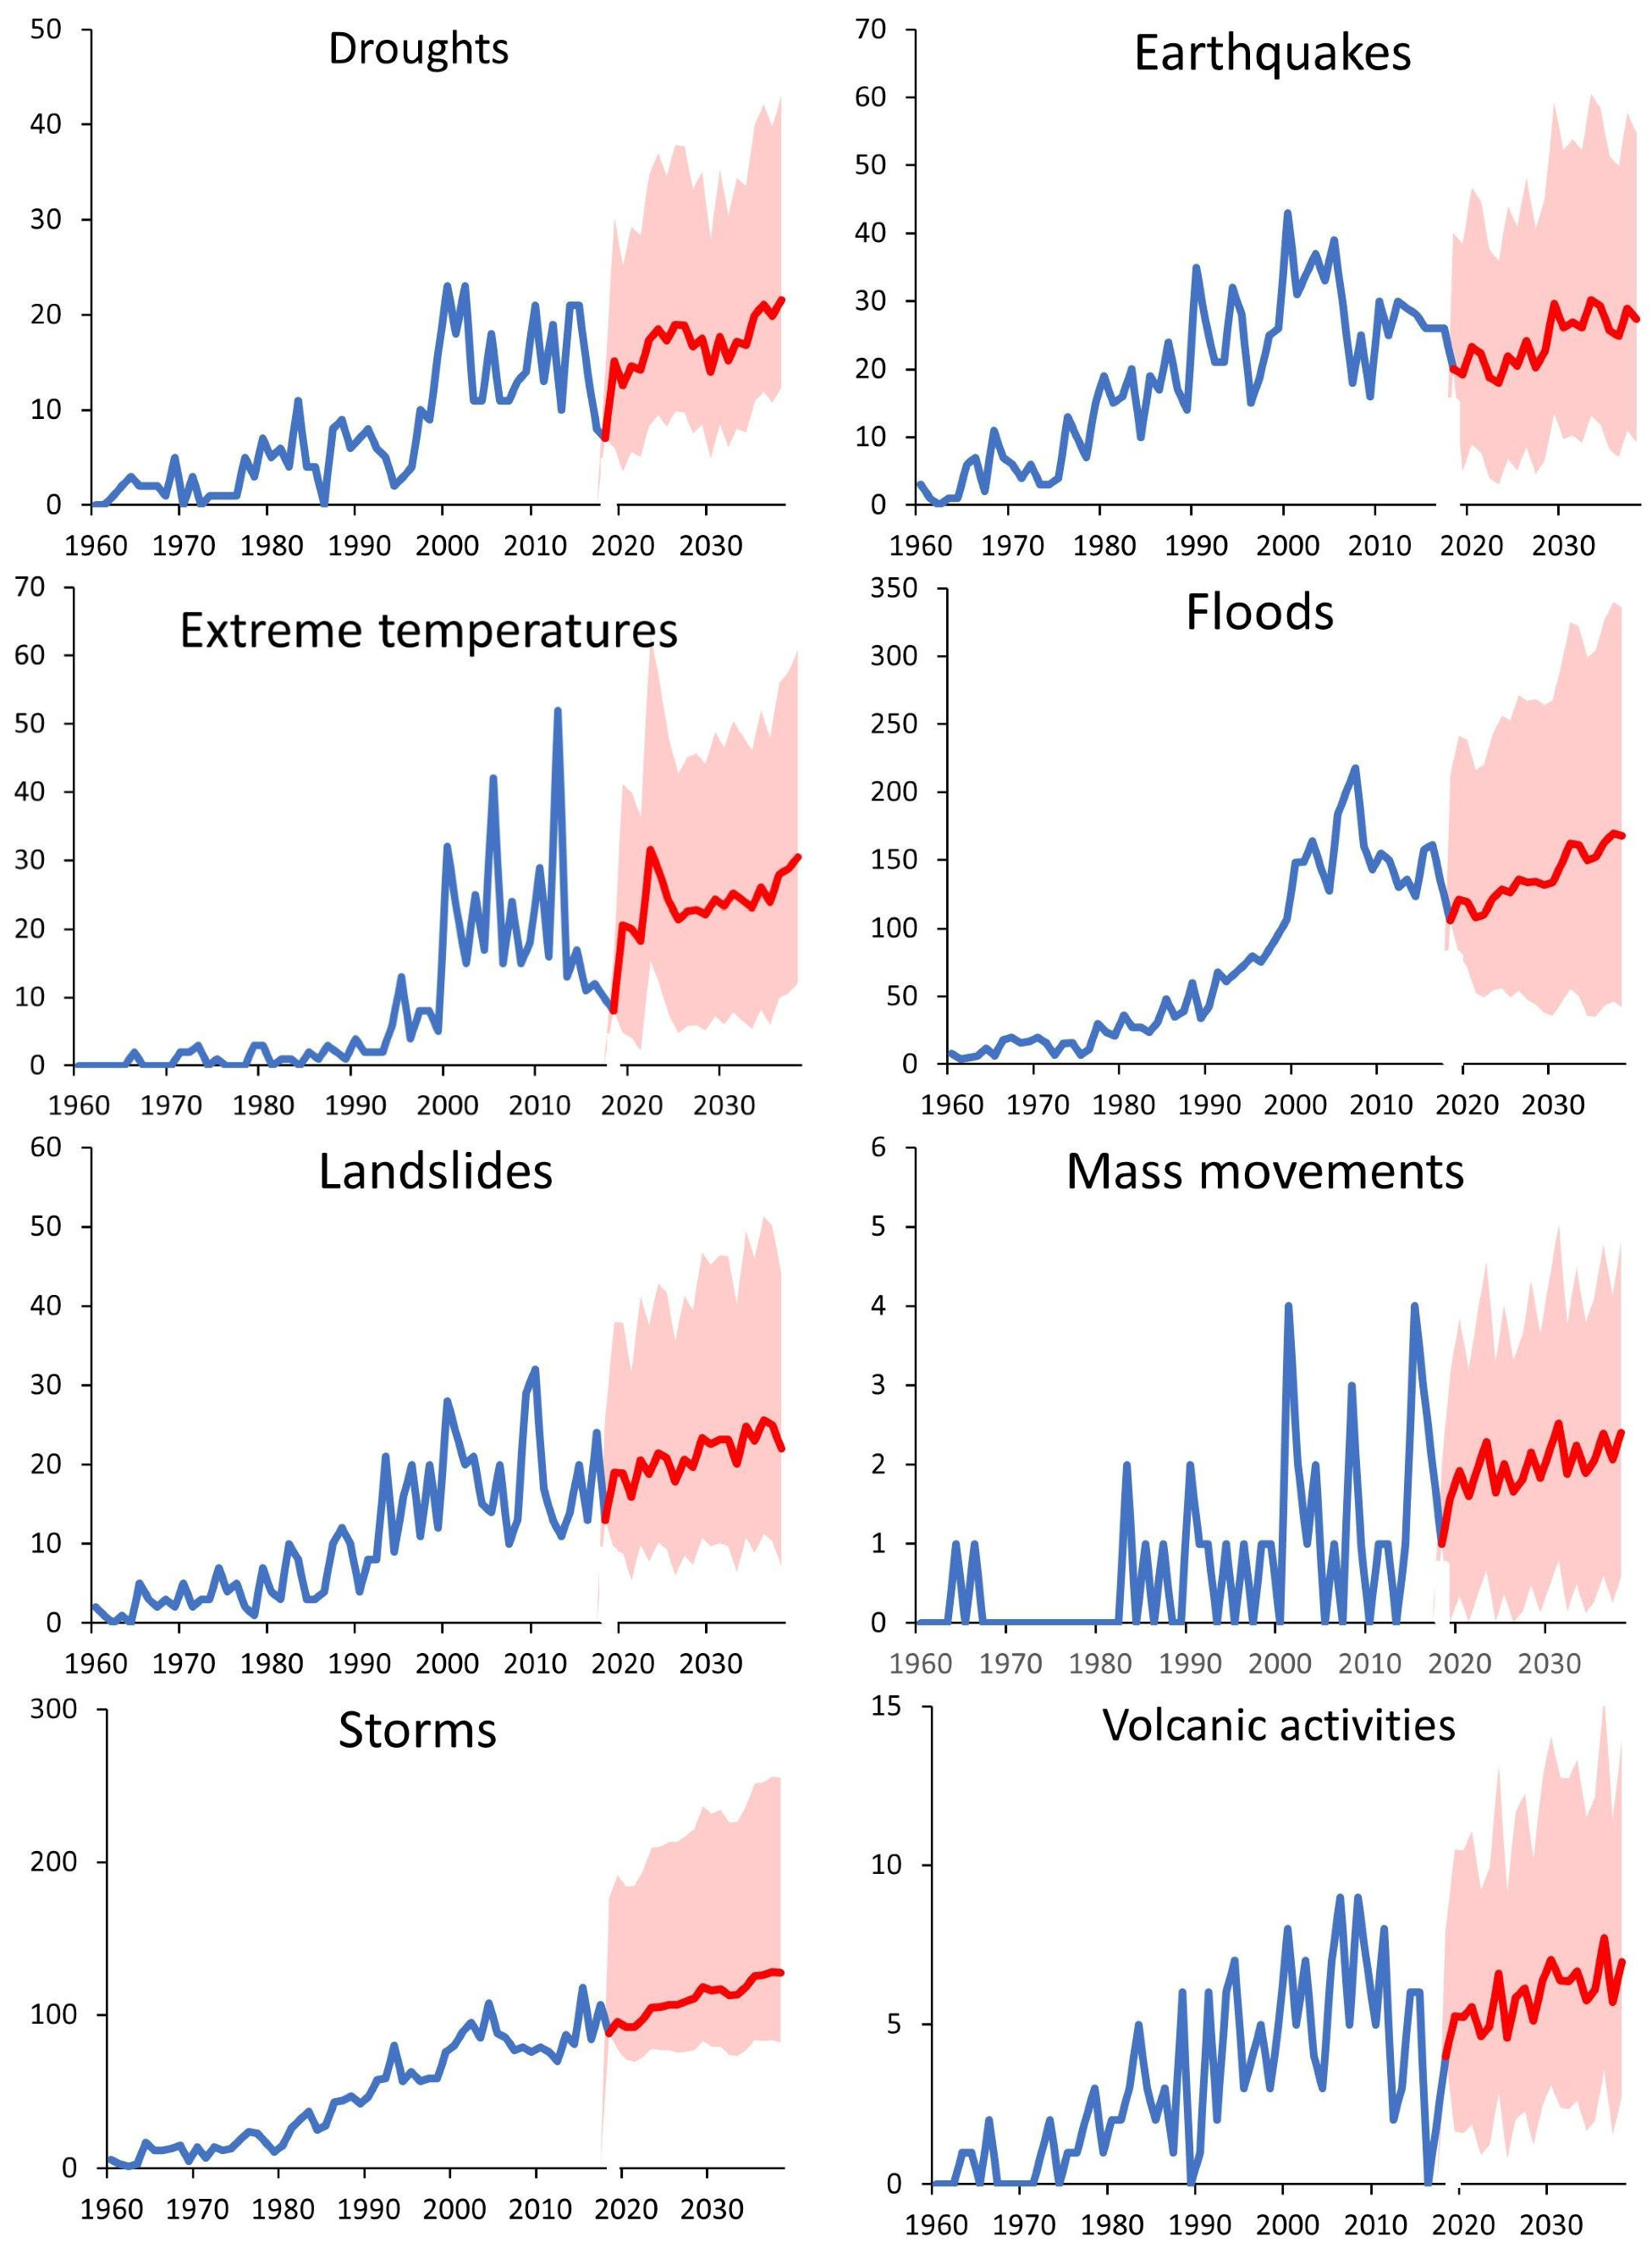
  • Predicting the future trends and the magnitude of natural disasters.
This work is divided into five parts. The first part includes an introduction to the study, which explains its purpose and defines the general concept of disaster. The second part describes the data used for the project and characterises the sources from which they were obtained. Part three involves data analysis. The data are visualised in the form of maps and the numerical data are presented using tables and graphs. Part four summarises the results of the study and draws conclusions from the analyses. Part five includes the bibliography used in this study.

2. Methods

The data for this analysis were obtained through the website of the Socioeconomic Data and Applications Center (SEDAC) [27], which is supervised by NASA’s Earth Science Data Systems (ESDS) program. It provides full and free access to Earth science data from the United States’ NASA—the National Aeronautics and Space Administration. SEDAC collects data from a variety of sources, including satellites, weather stations, and radar and instruments installed on the ground. These data are then processed and organised to enable their use for subsequent analysis [28]. They are used to produce maps that show the distribution and consequences of natural disasters. In addition, SEDAC develops models and tools to help predict the development of disasters and their aftermath. It is worth noting that SEDAC also collaborates with other scientific institutions.
The Geocoded Disasters (GDIS) and Emergency Events Database (EM-DAT) datasets, while widely recognised for their extensive records, have inherent limitations. We acknowledged these limitations in our approach, ensuring the results and interpretations of our study were anchored within the scope and accuracy of these datasets. The GDIS dataset, the foundation of this work, encapsulates global information on natural disasters from 1960 to 2018, as recorded in the Emergency Events Database (EM-DAT) [27]. It is imperative to note that while catastrophic events have shaped human history, only those transpiring post the 1960s have been captured and scrutinised in the analysed database.
Natural disasters, primarily arising from Earth’s natural processes, can precipitate catastrophic consequences for communities, manifesting in casualties, injuries, and infrastructural damage. As highlighted by SEDAC, the last few decades witnessed diverse natural disasters worldwide, with fluctuations in their intensity and recurrence. Our focus in this study spanned across droughts, earthquakes, temperature extremes, floods, landslides, mass earth movements, storms, and volcanic activity. The collated data incorporated essential details, notably the geographical location and the year of each event. These data, while distinctively classifying disasters pertaining to first-, second-, and even third-tier administrative regions, resulted in an exhaustive compilation of close to 40,000 records. Given the dynamic nature of the EM-DAT, which periodically updates both contemporary and past events, the dataset showcases various event identifier formats. A pivotal note to consider is that our analysis remains tethered exclusively to the geocoded data (GDIS) that align with EM-DAT’s predefined criteria. By EM-DAT’s standards, a natural disaster gains recognition when one or more of the subsequent criteria are met:
  • Death toll: Minimum of 10 casualties.
  • Affected individuals: At least 100 people affected, injured, or rendered homeless.
  • International requisition: A nation’s proclamation of an emergency state and/or a solicitation for international assistance.
In this study, the data were sorted such that a unique disaster number was assigned to the country where the event occurred. From this selection, 9962 unique disasters in 39,953 locations worldwide were identified. For phenomena that occurred in areas of countries that have changed over the years, they were assigned to the countries currently occupying those locations. In addition, the continents on which the respective countries are located were added to each record. Software such as Excel and QGIS Desktop 3.16.4 were used to compile the data. Firstly, the raw data were analysed in terms of their quality. Then, the data were filtered based on the classification of natural disasters by individual countries and continents, as well as by years. Subsequently, the data incorporated changes in administration that have occurred since 1960, such as country mergers or splits, in order to standardise the data to the present state. Next, publicly available data on continents, countries, and population numbers were obtained and added to the existing database. Finally, the gathered data were imported into the QGIS Desktop 3.16.4 software.

3. Results

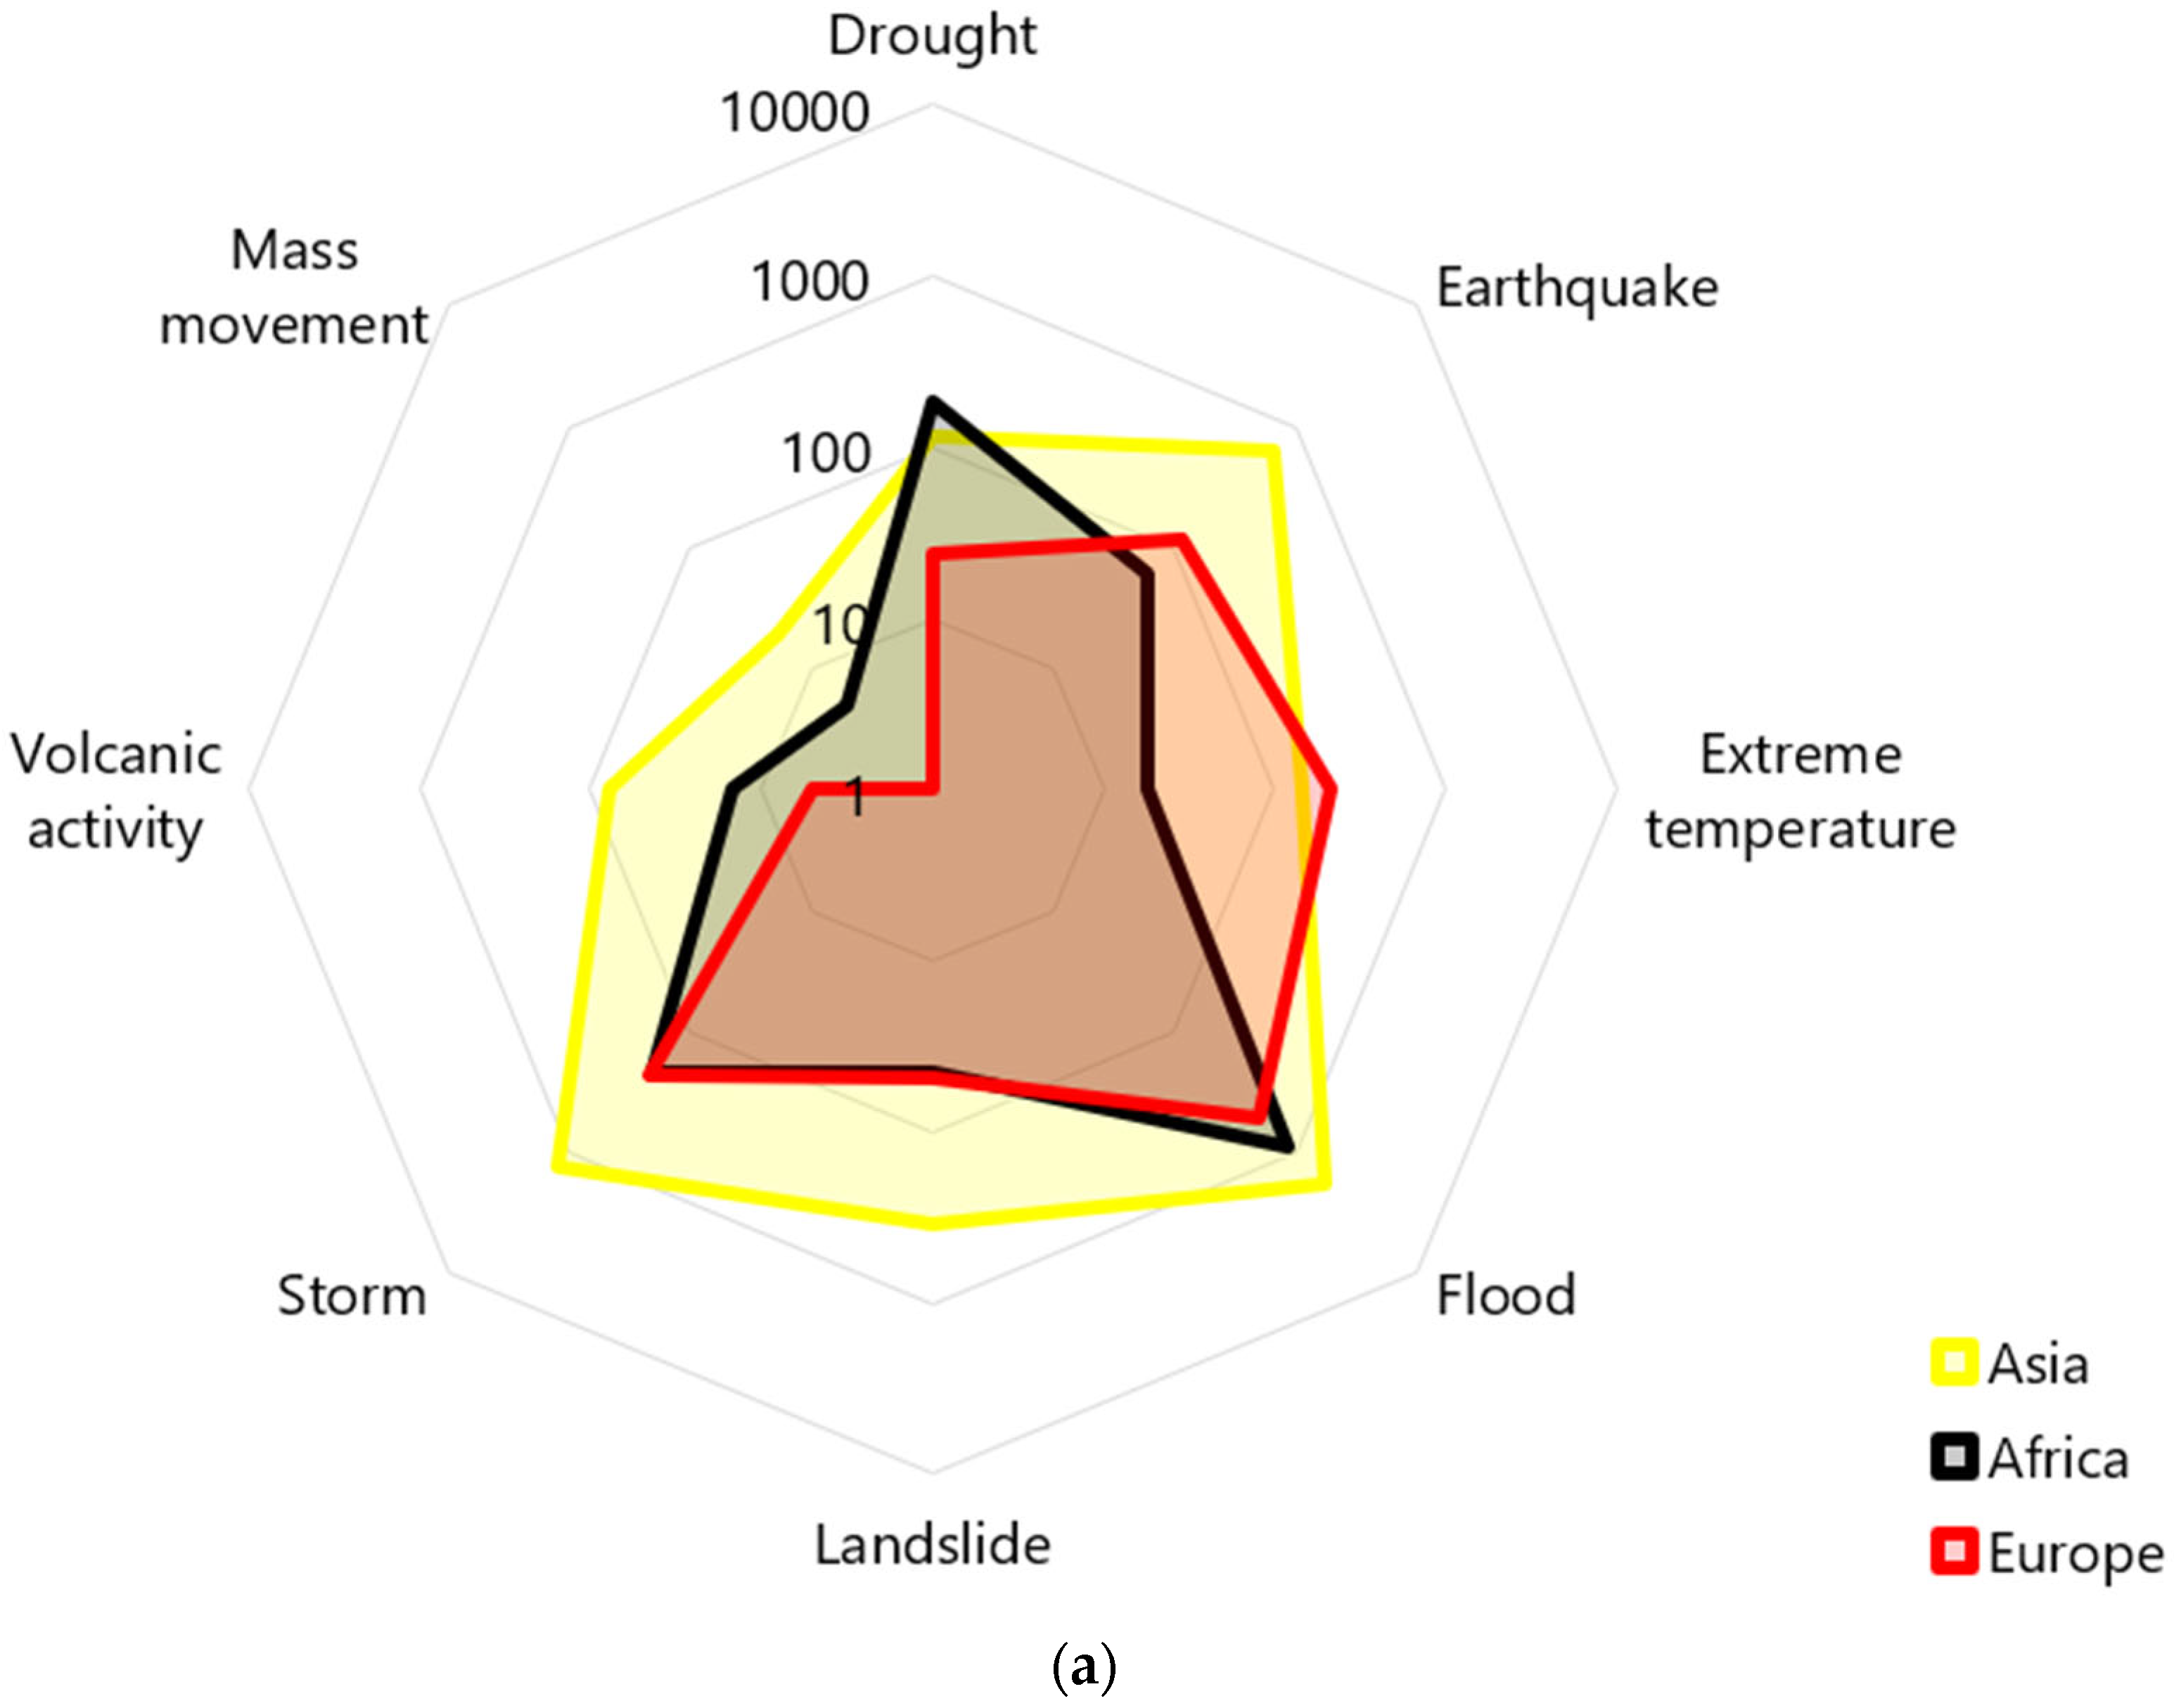
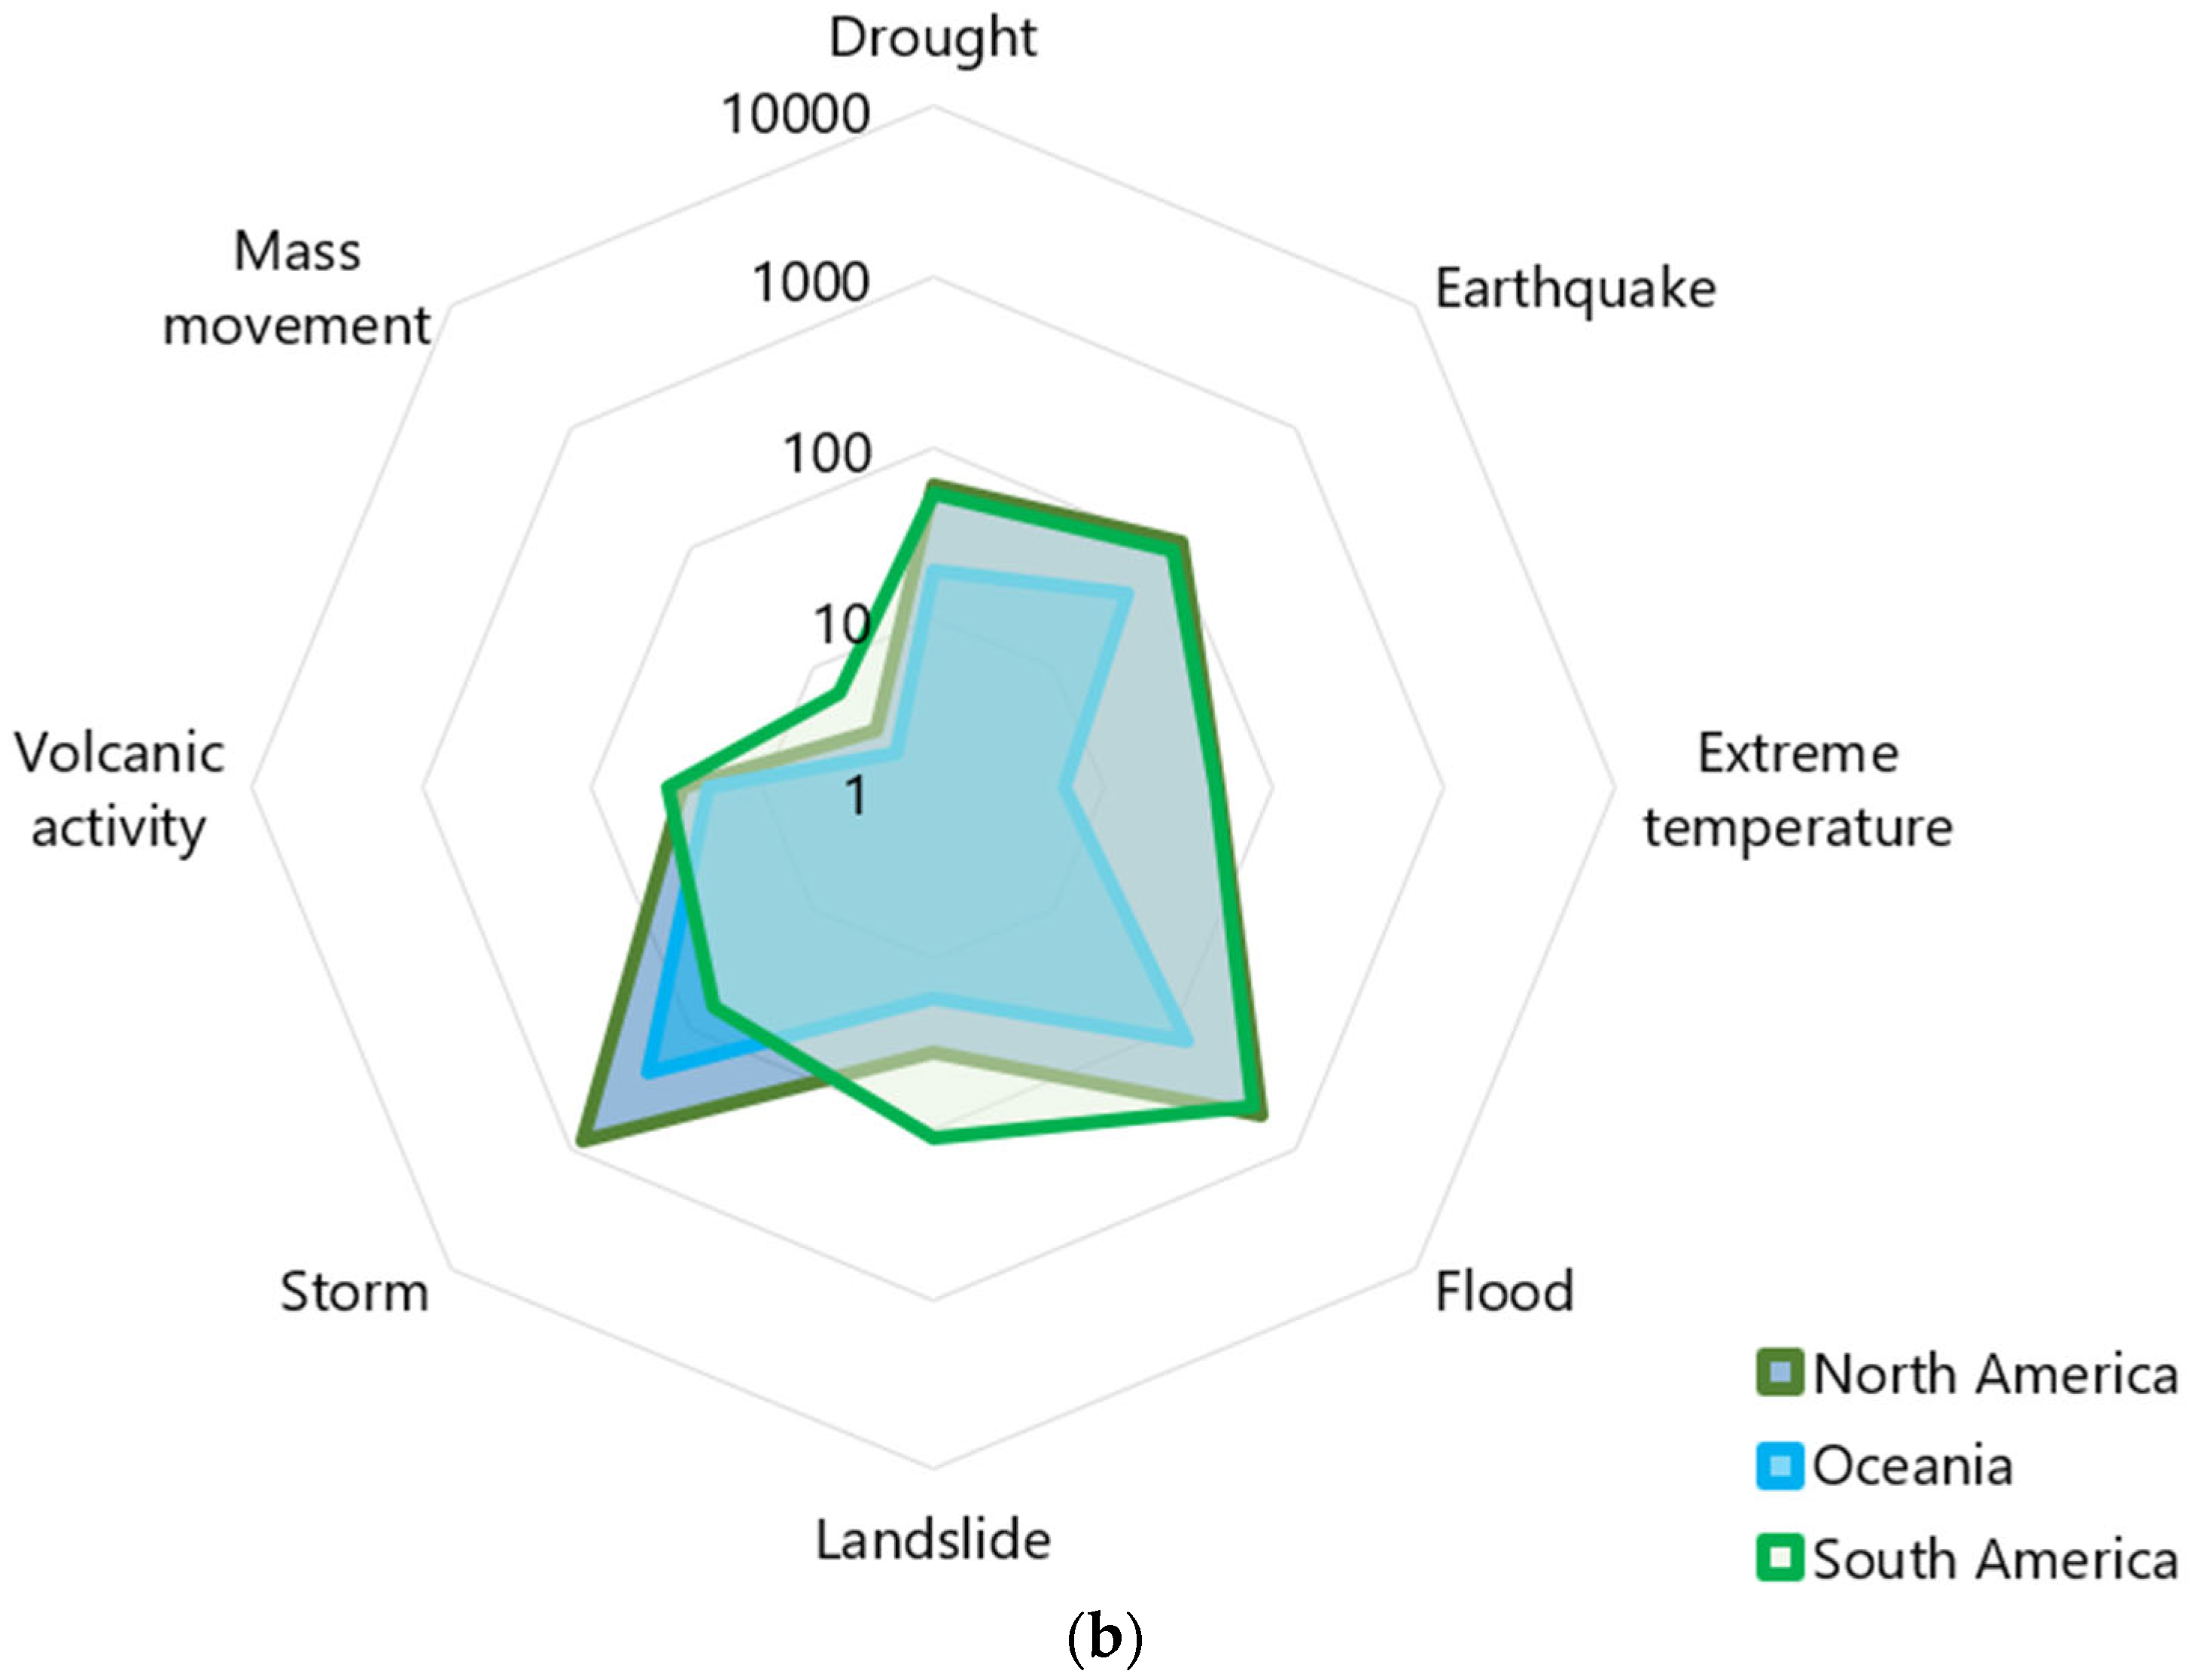
3.1. Disasters by Continent

The initial study focused on the number of natural disasters recorded between 1960 and 2018, in terms of their distribution across different continents (Figure 1). Asia emerged as the most affected, with a total of 4427 incidents; the primary events in this region were floods and storms. In contrast, North America, ranking the second highest in disaster frequency, predominantly experienced storms and floods, accompanied by a noticeable number of landslides. Africa reported a count of 1427 natural disasters. It is crucial to highlight that while storms and floods were recurrent phenomena across continents, this is not indicative of a causative relationship. It is observed, however, that in some regions, severe storms accompanied by intense rainfall can potentially lead to flooding.
In general, larger and more densely populated regions tend to experience more natural disasters than smaller or less populated areas. (Table 1).
Subsequent analyses examined the distribution of natural disasters relative to each continent’s population. Data on the population inhabiting specific areas during the first and last years of the study period were sourced [29], and subsequently averaged to derive more consistent results. This calculation yielded the number of disasters per person (Table 1). In this analysis, Australia and Oceania were notable outliers, largely due to their comparatively smaller populations, resulting in over 15 disasters per 1 million people. Contrarily, Asia, despite being the epicentre of the highest total number of disasters—nearly half of the global tally—had its vast population dilute the impact, leading to a mere one disaster per 1 million people. For the final metric, the ratio of disasters was adjusted against 1 million km2 of a continent’s expanse (Table 1). Data pertaining to the surface area of each continent were referenced [30]. Europe, the most compact continent at 10.2 million km2, bore the brunt of the highest frequency of disasters, 11.21 per 1 million km2. Conversely, Asia, the most expansive at 44.6 million km2, and leading in absolute disaster counts (4427), had a reduced ratio of 9.93 disasters per 1 million km2 (9.93). Both South America (4.85) and Africa (4.69) lingered at the bottom, each registering fewer than five disasters per 1 million km2.

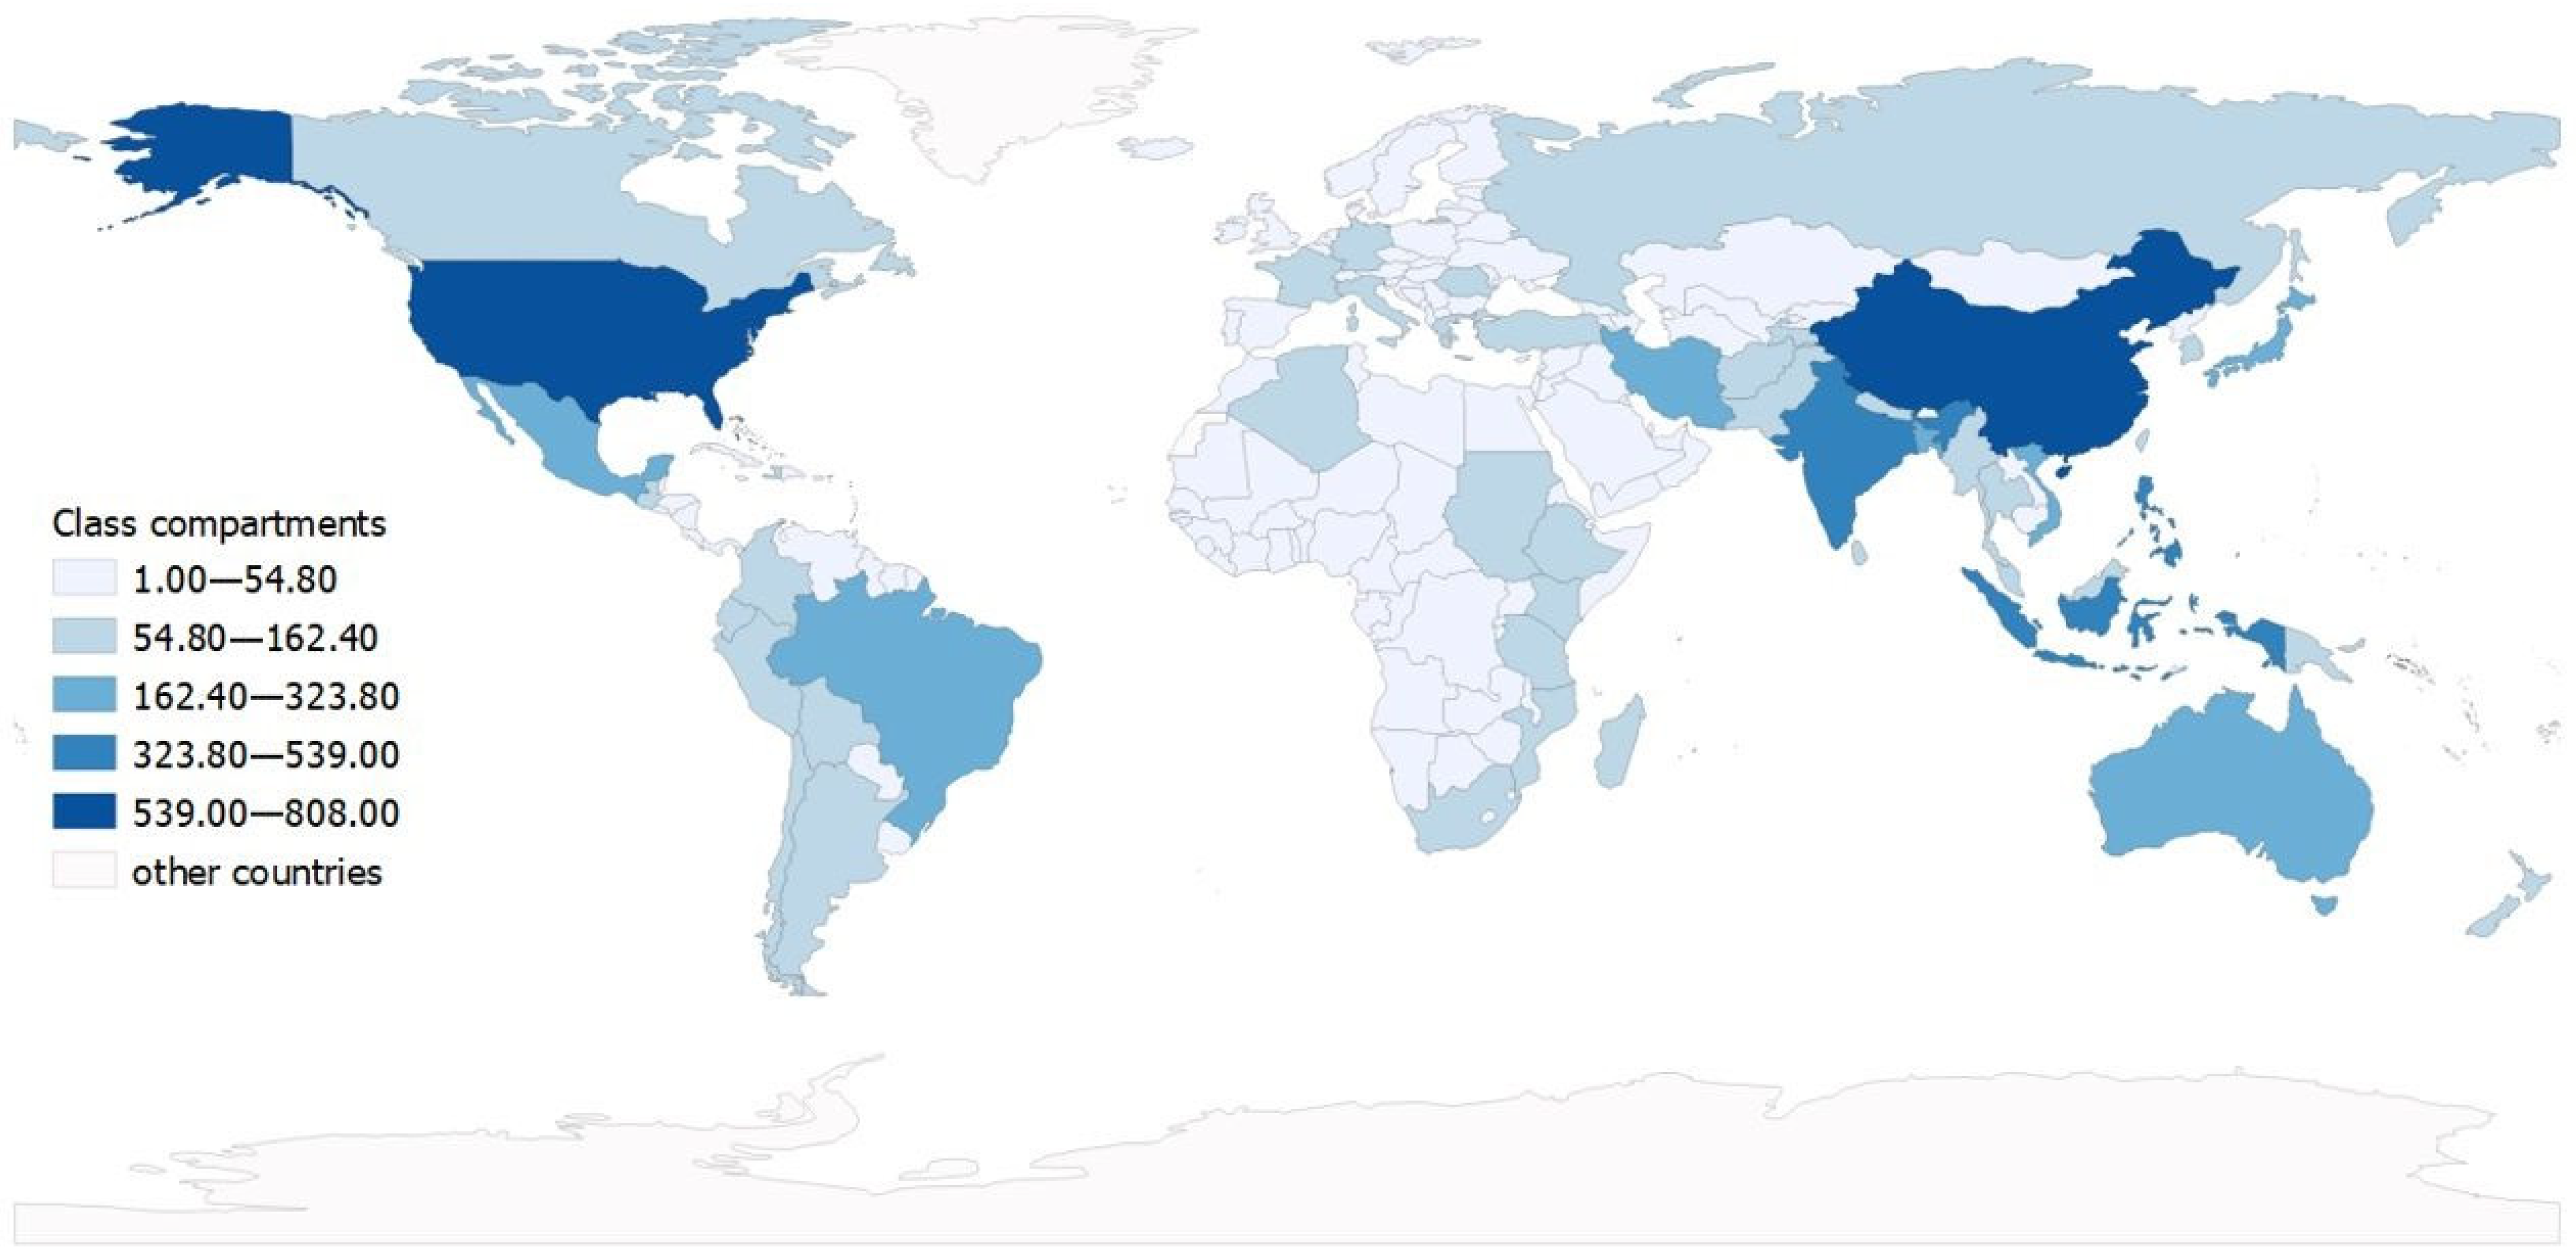
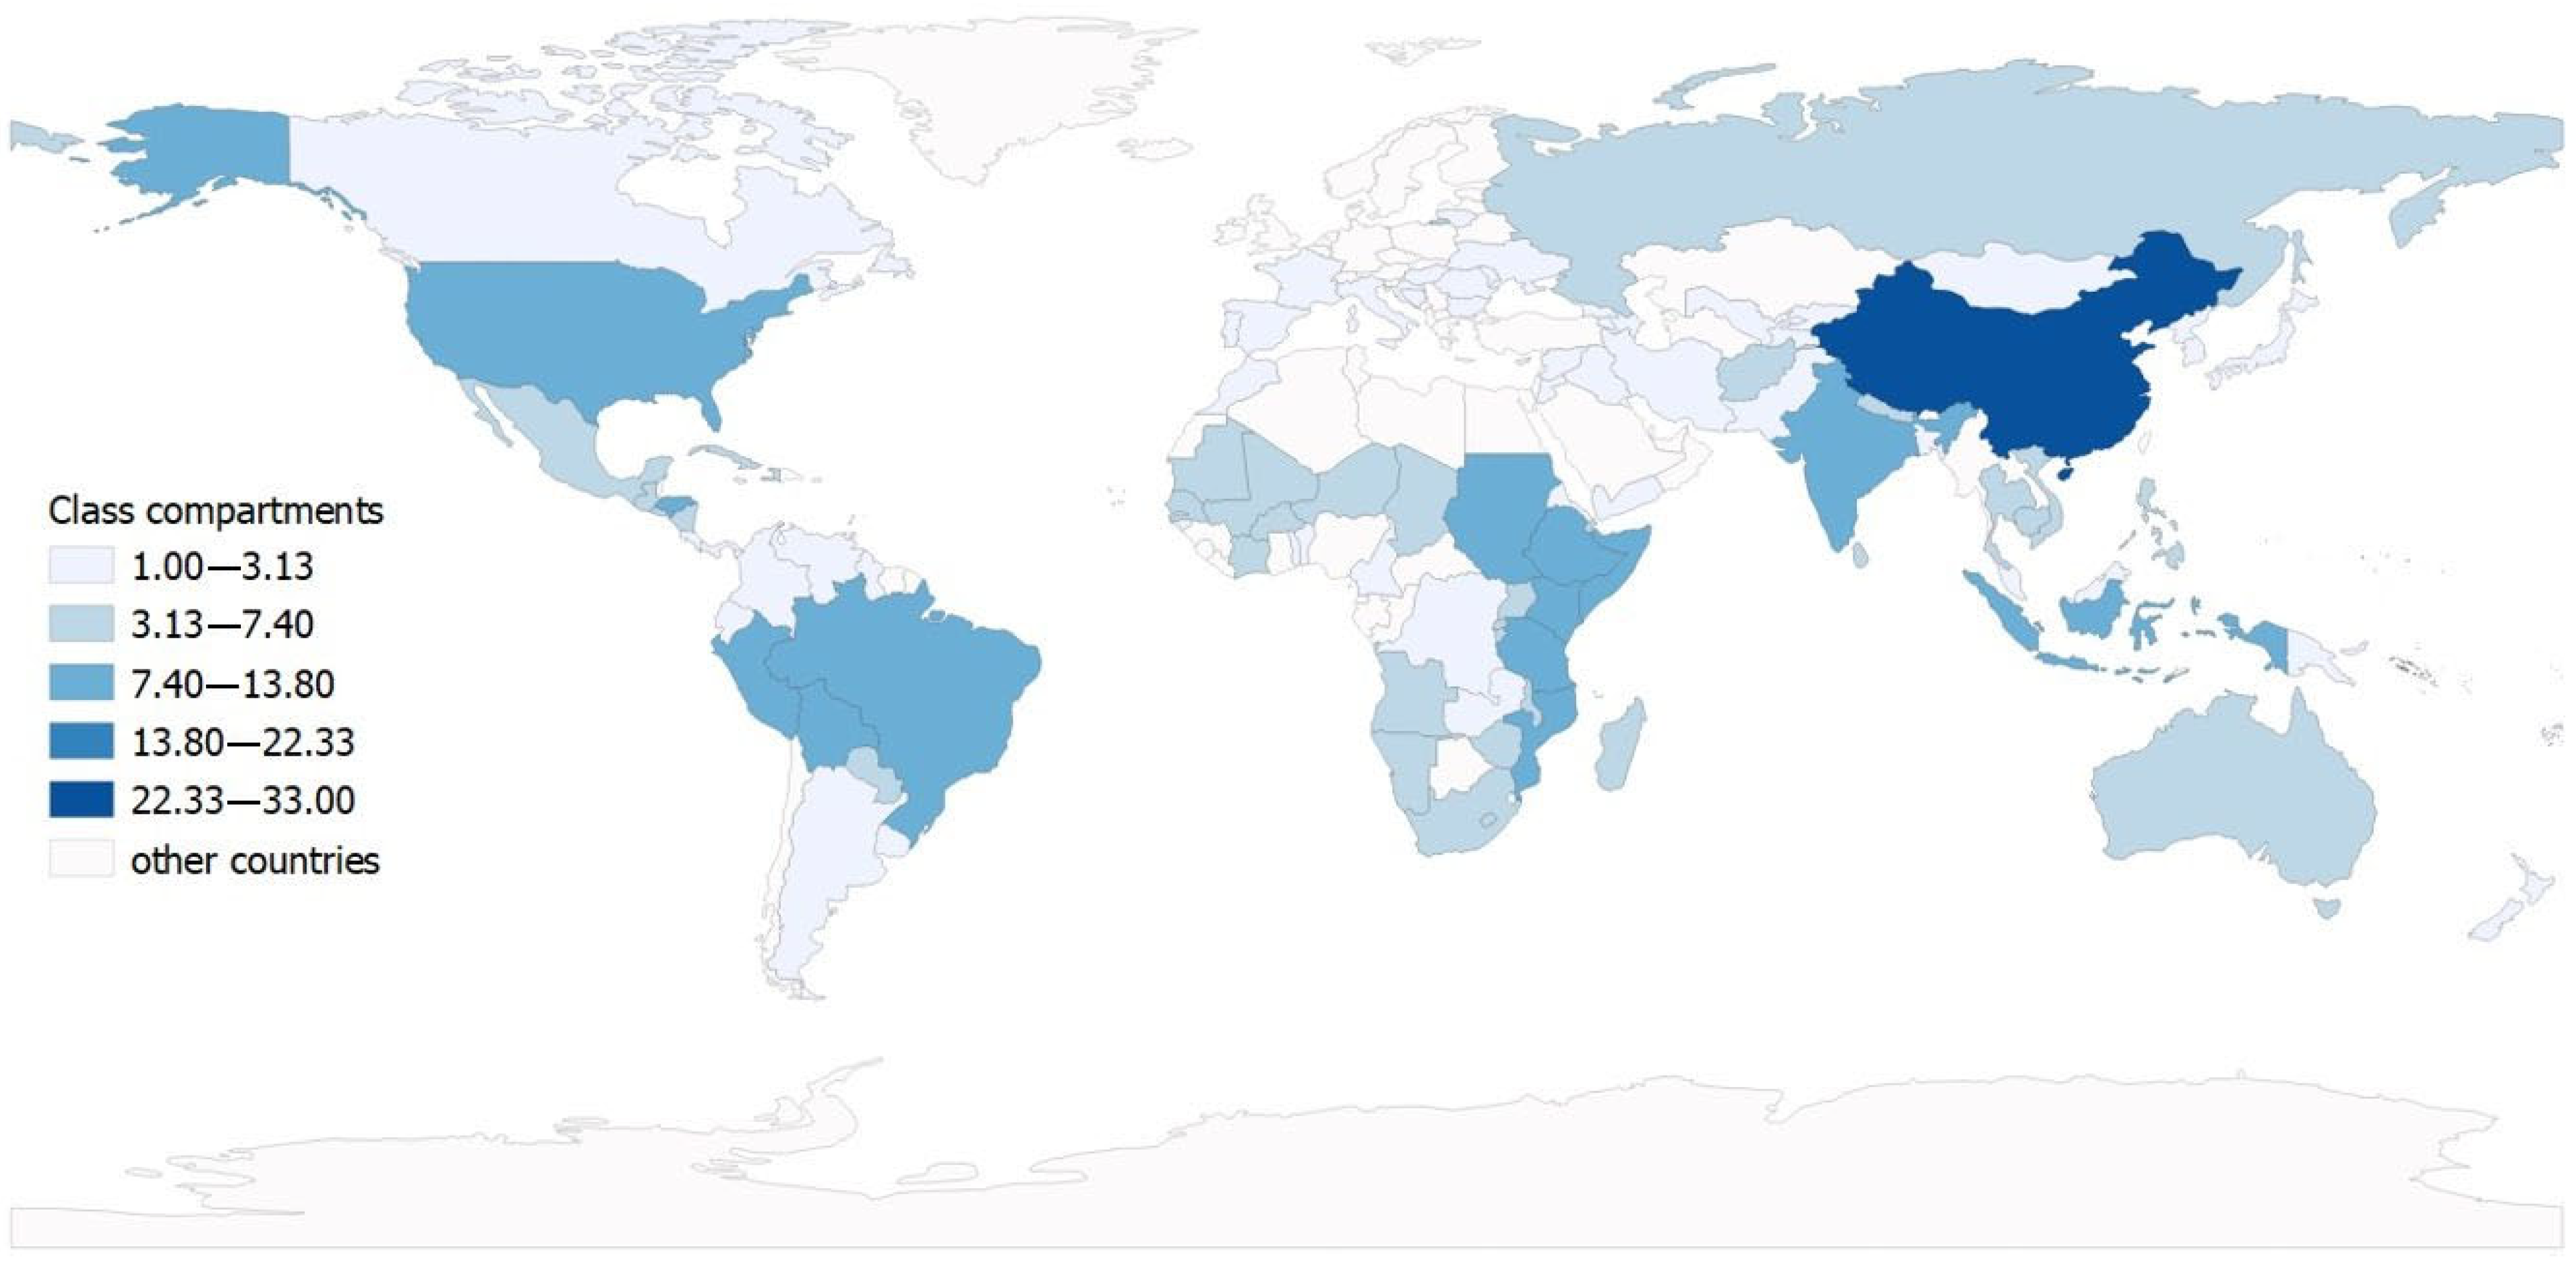
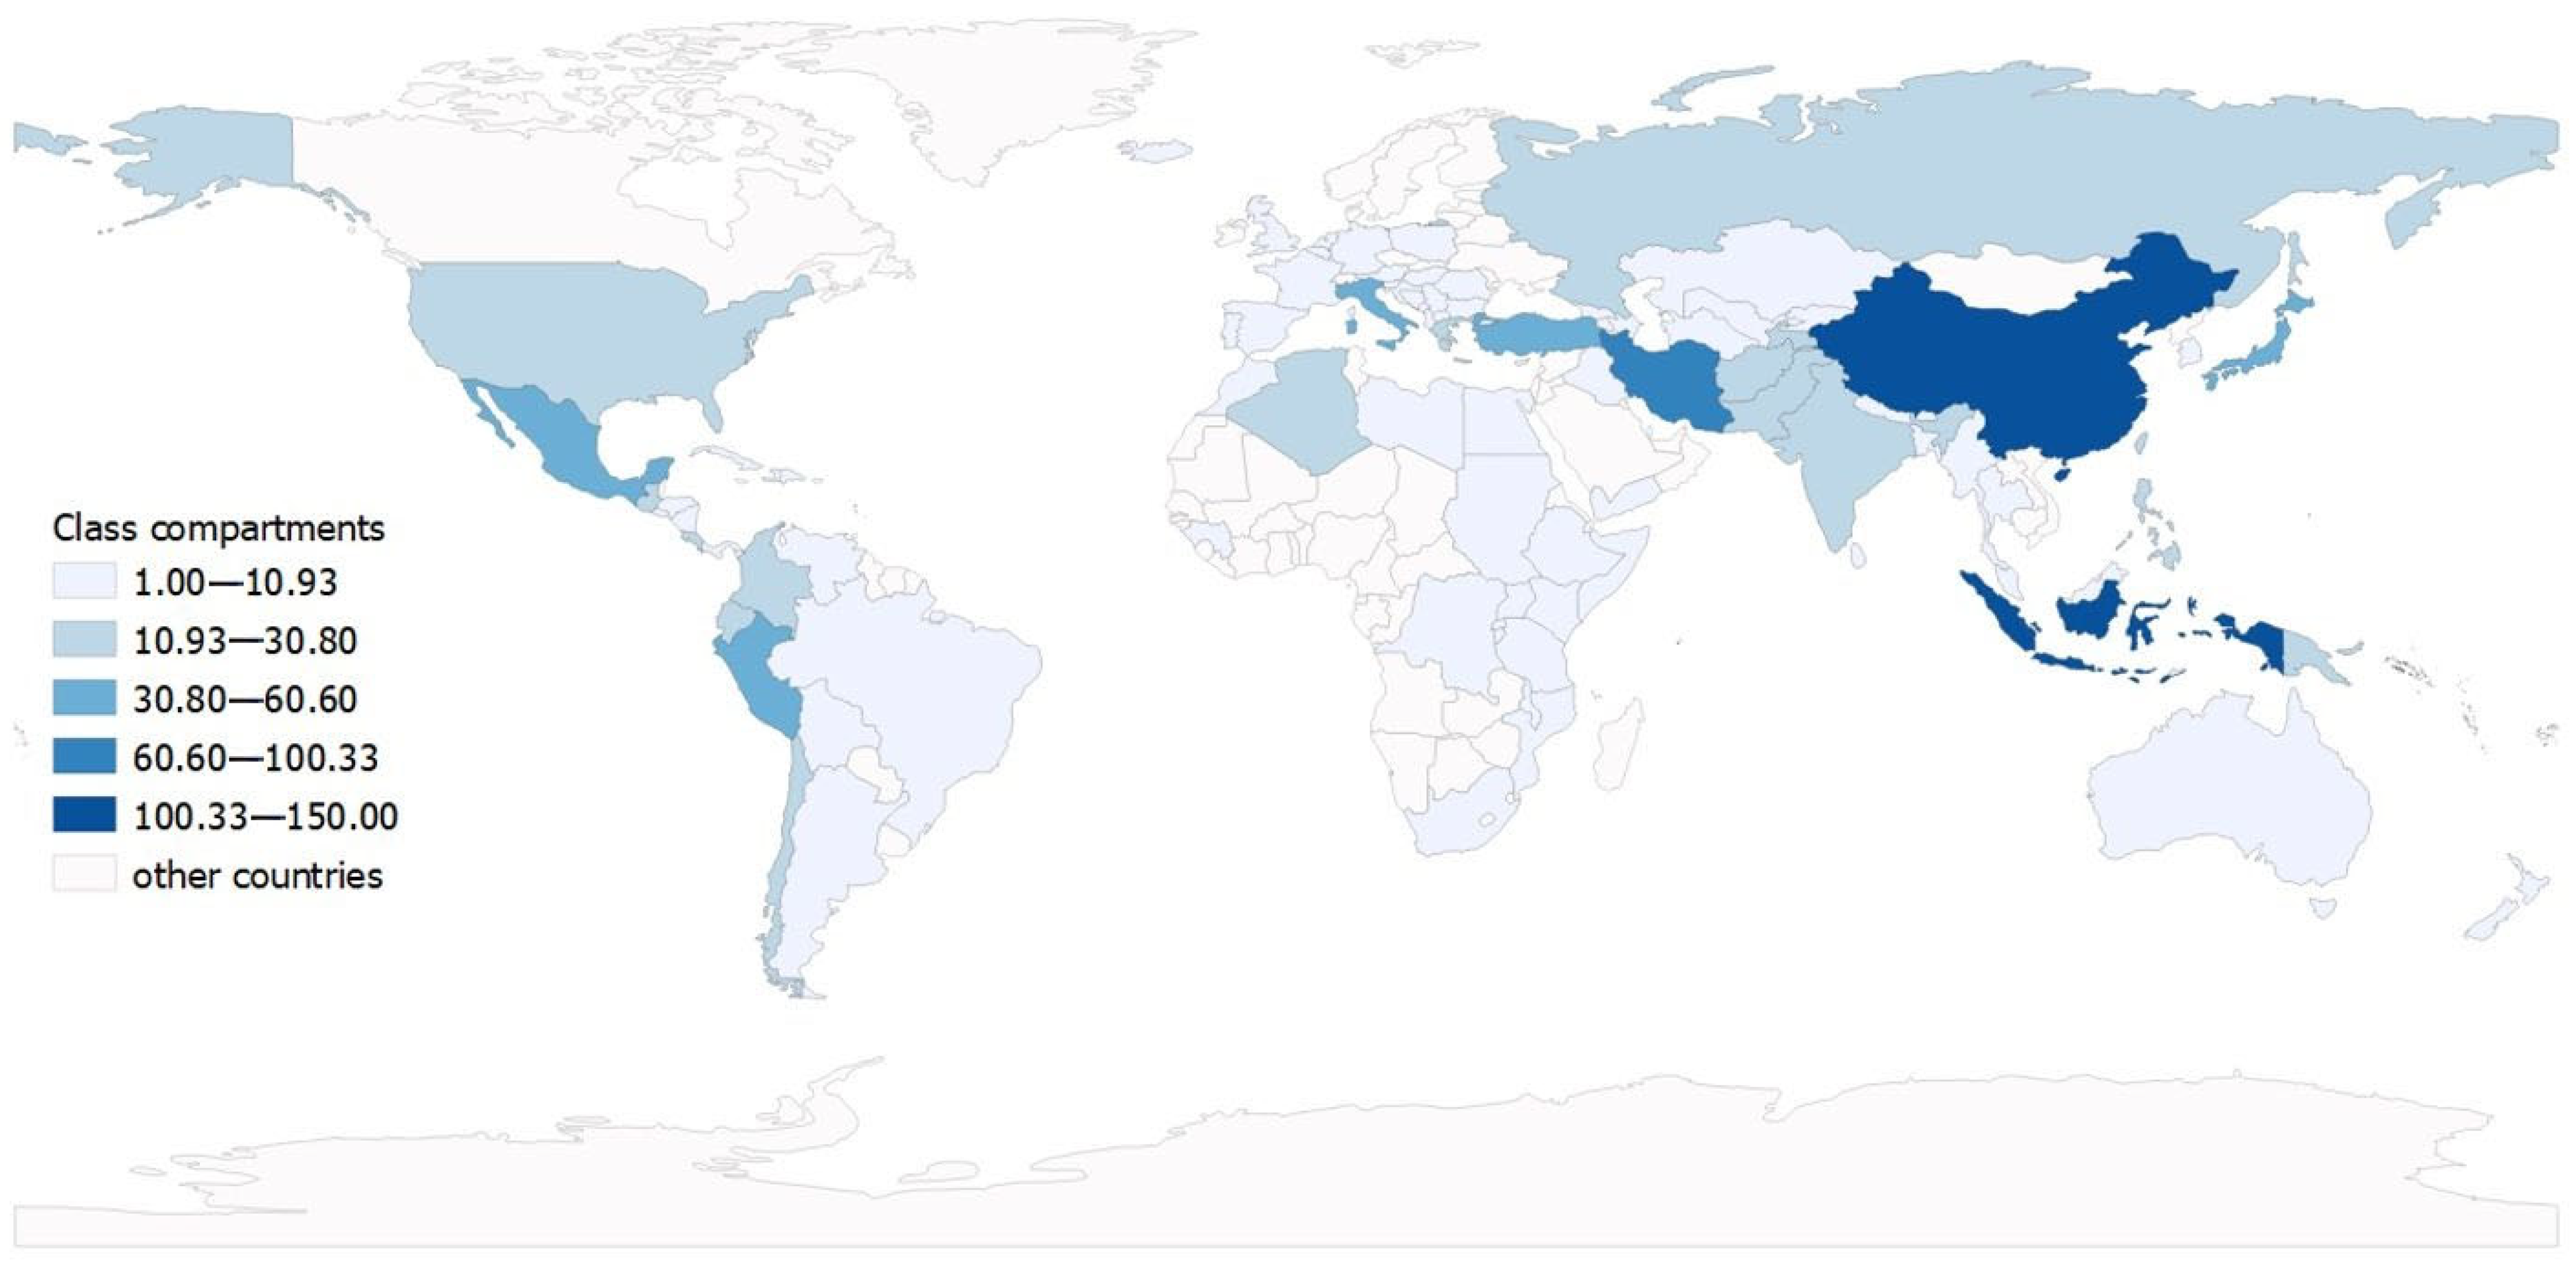
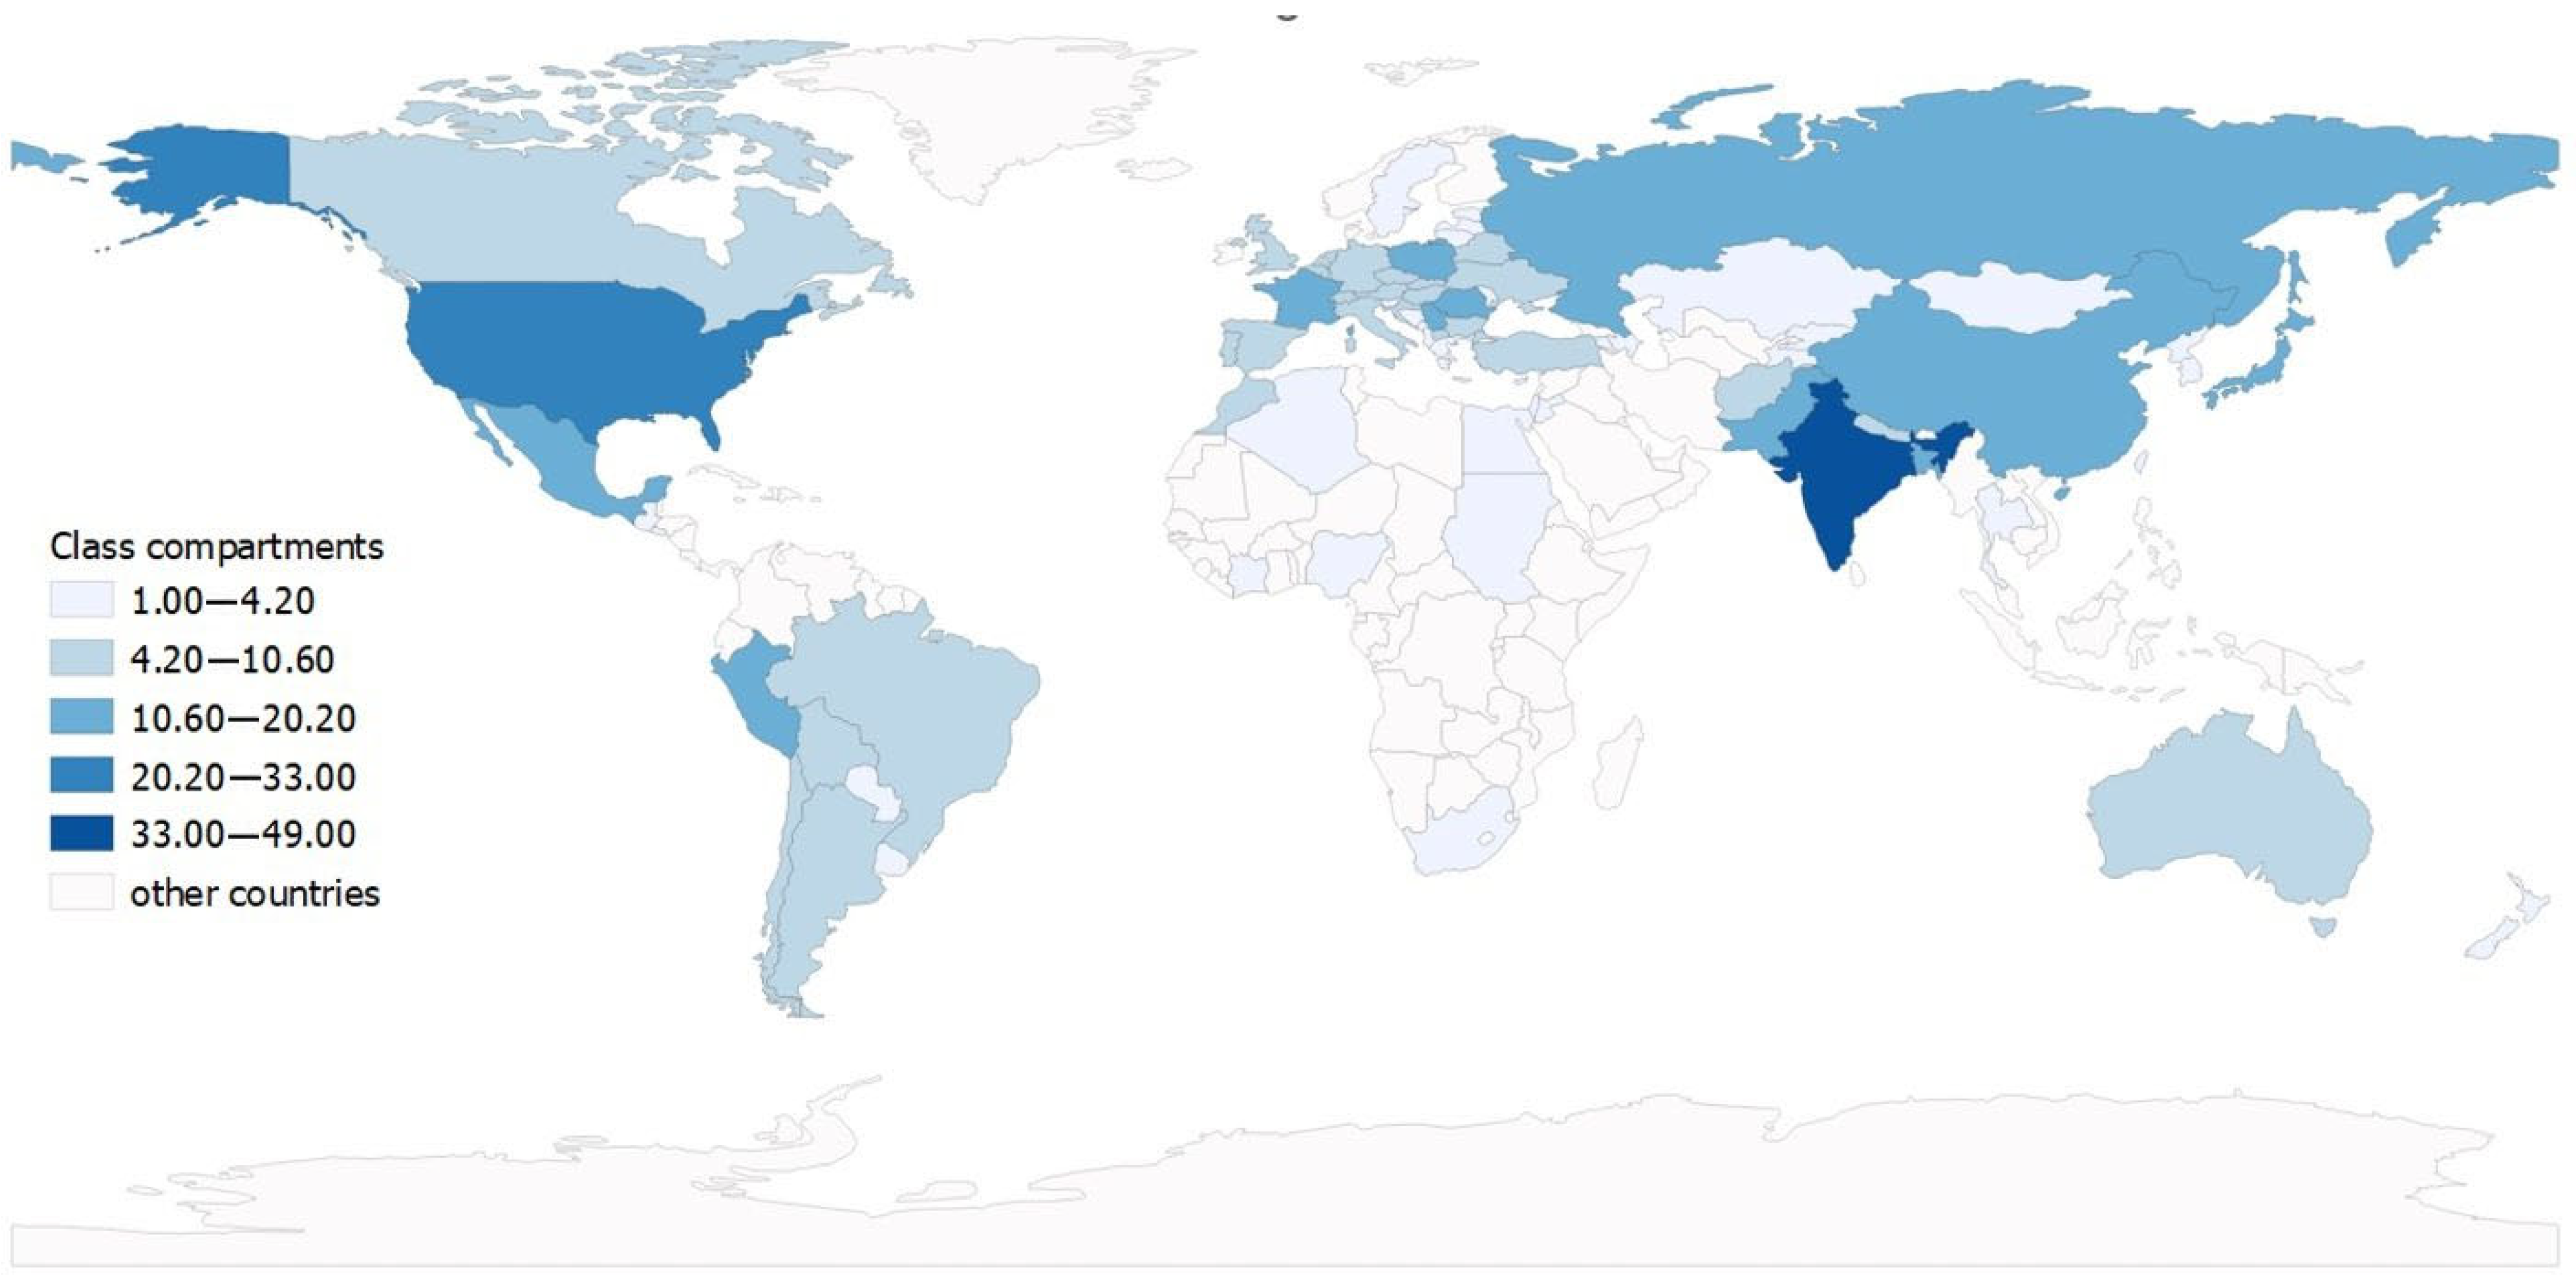
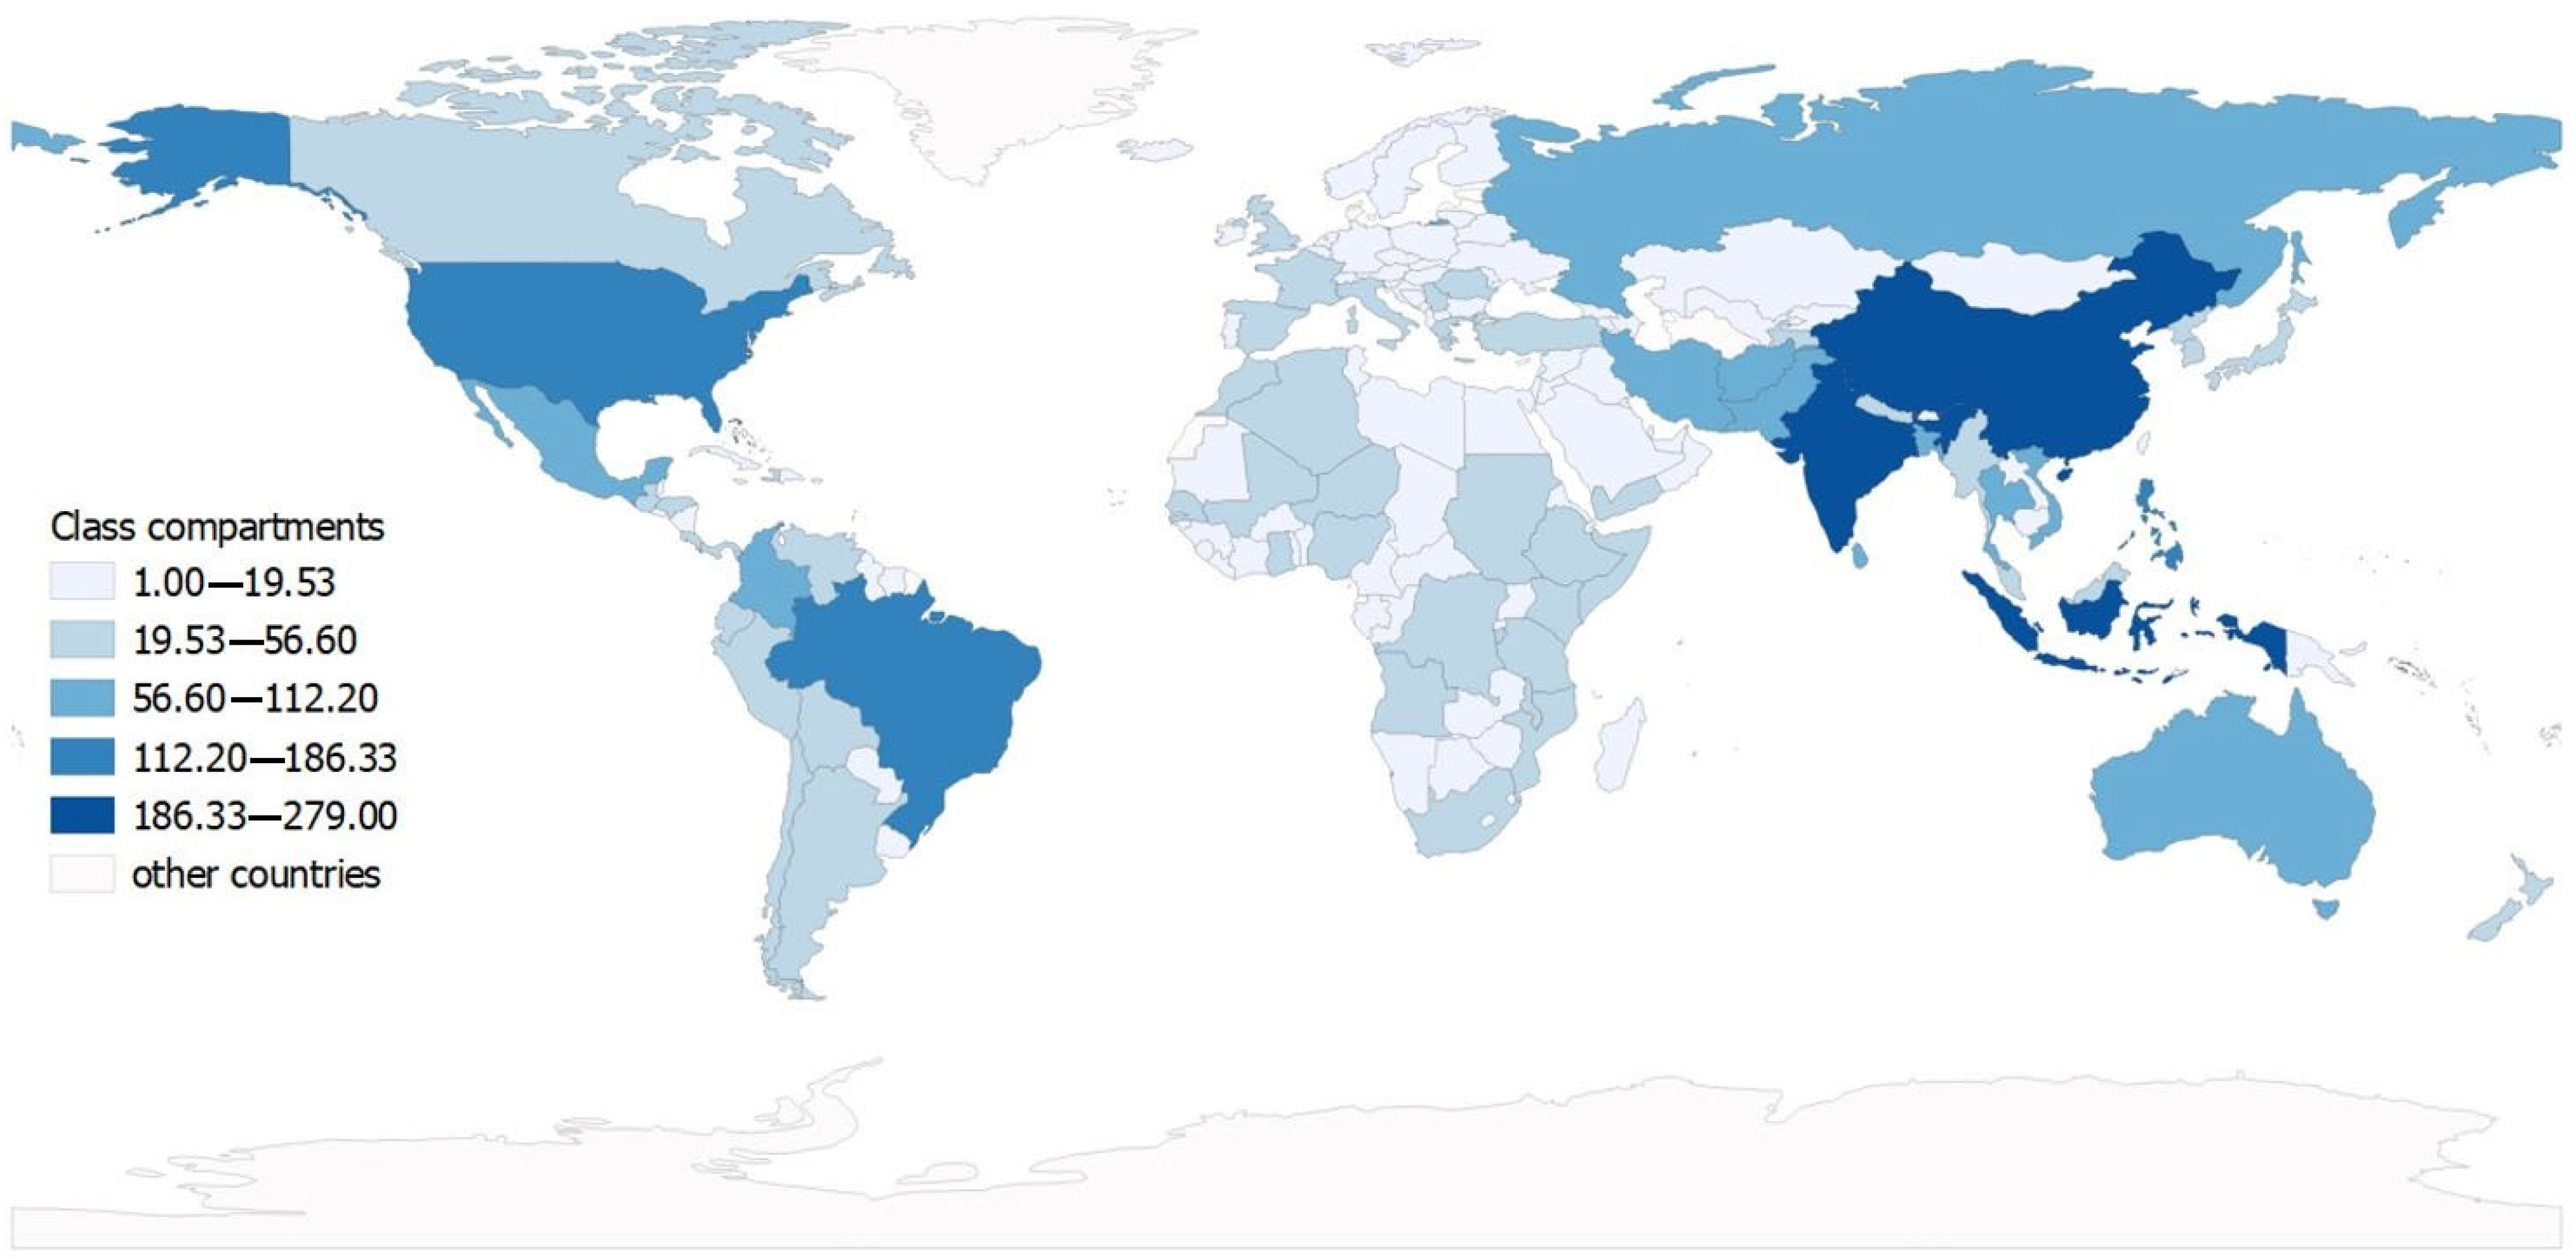
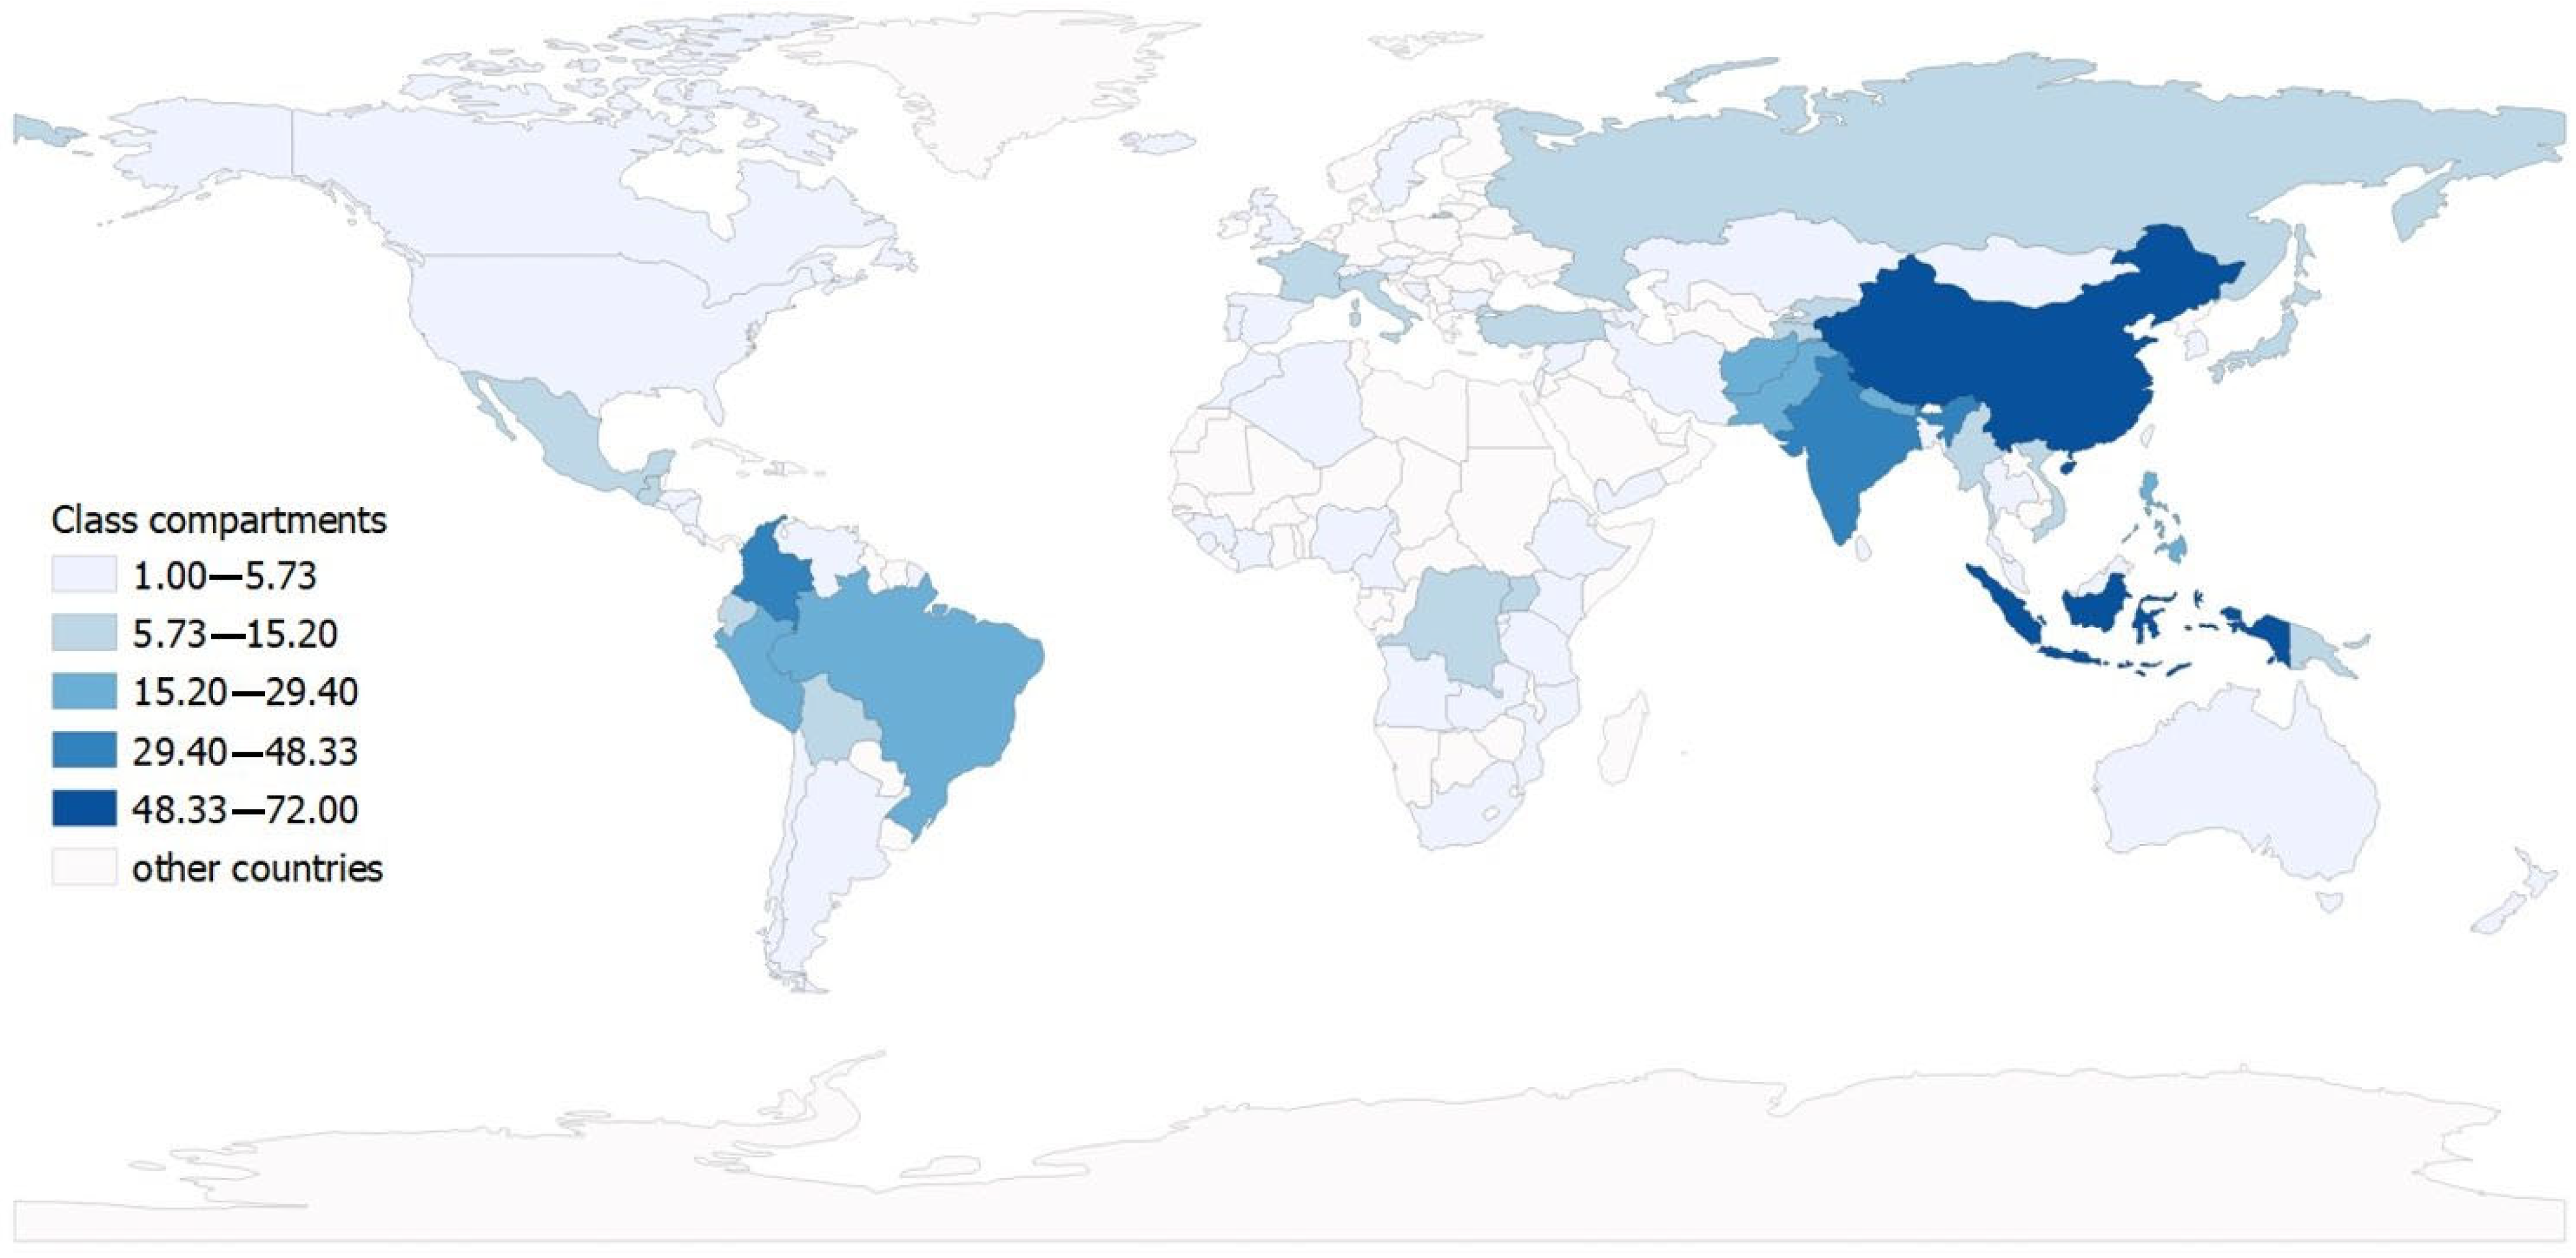
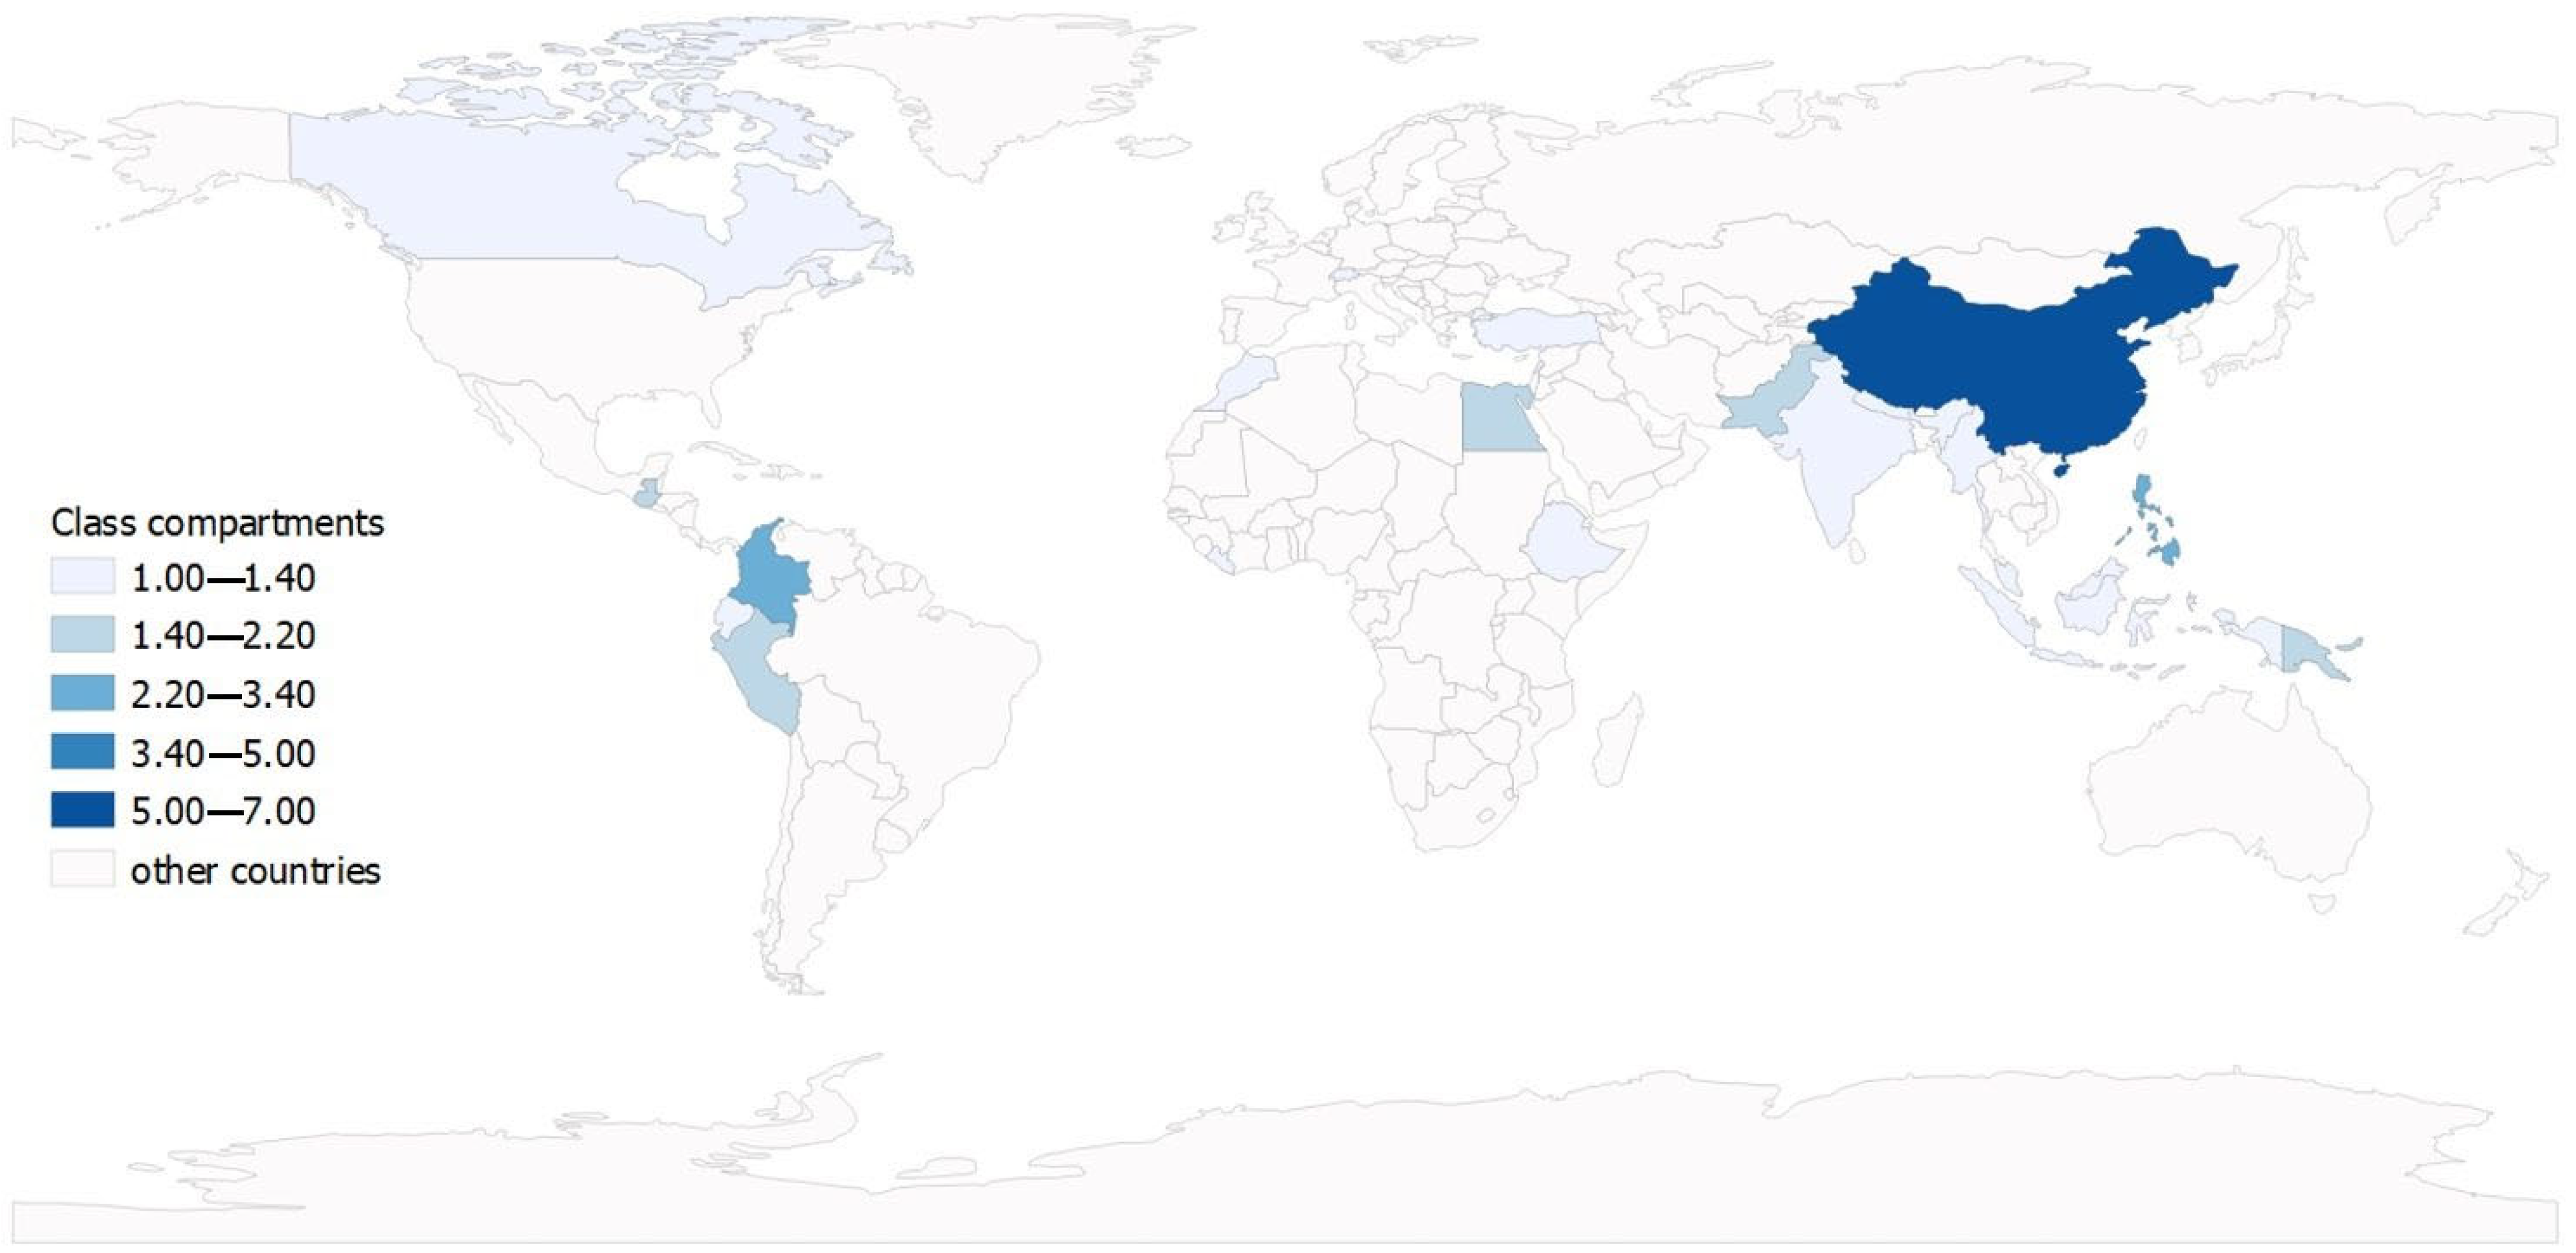
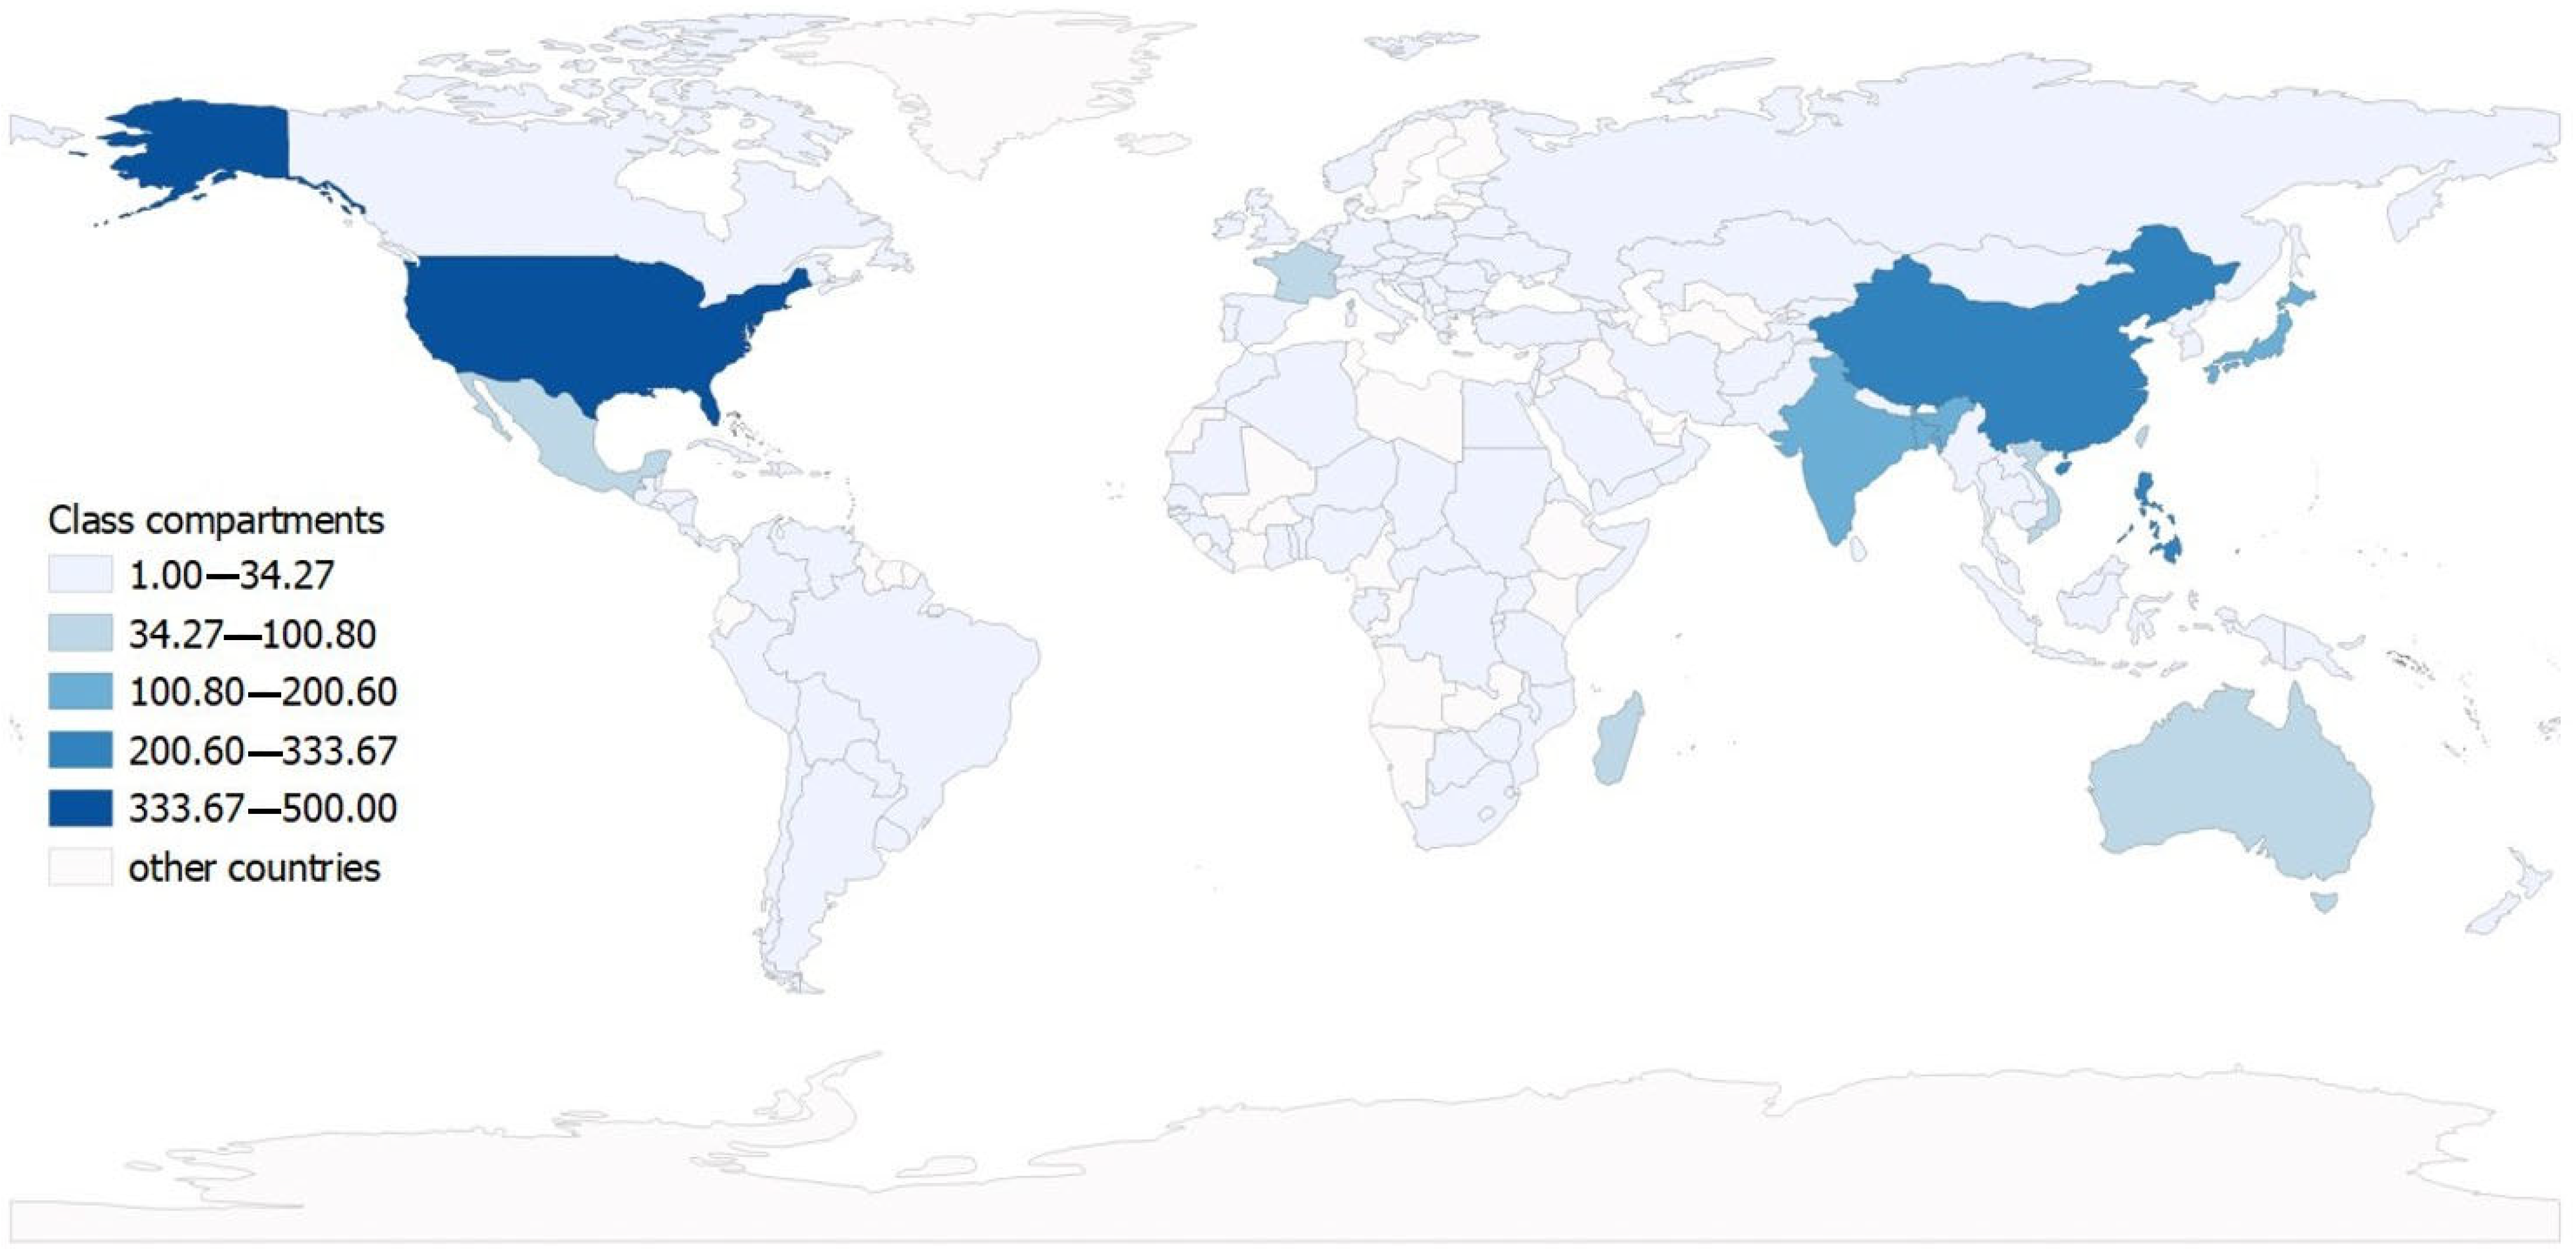
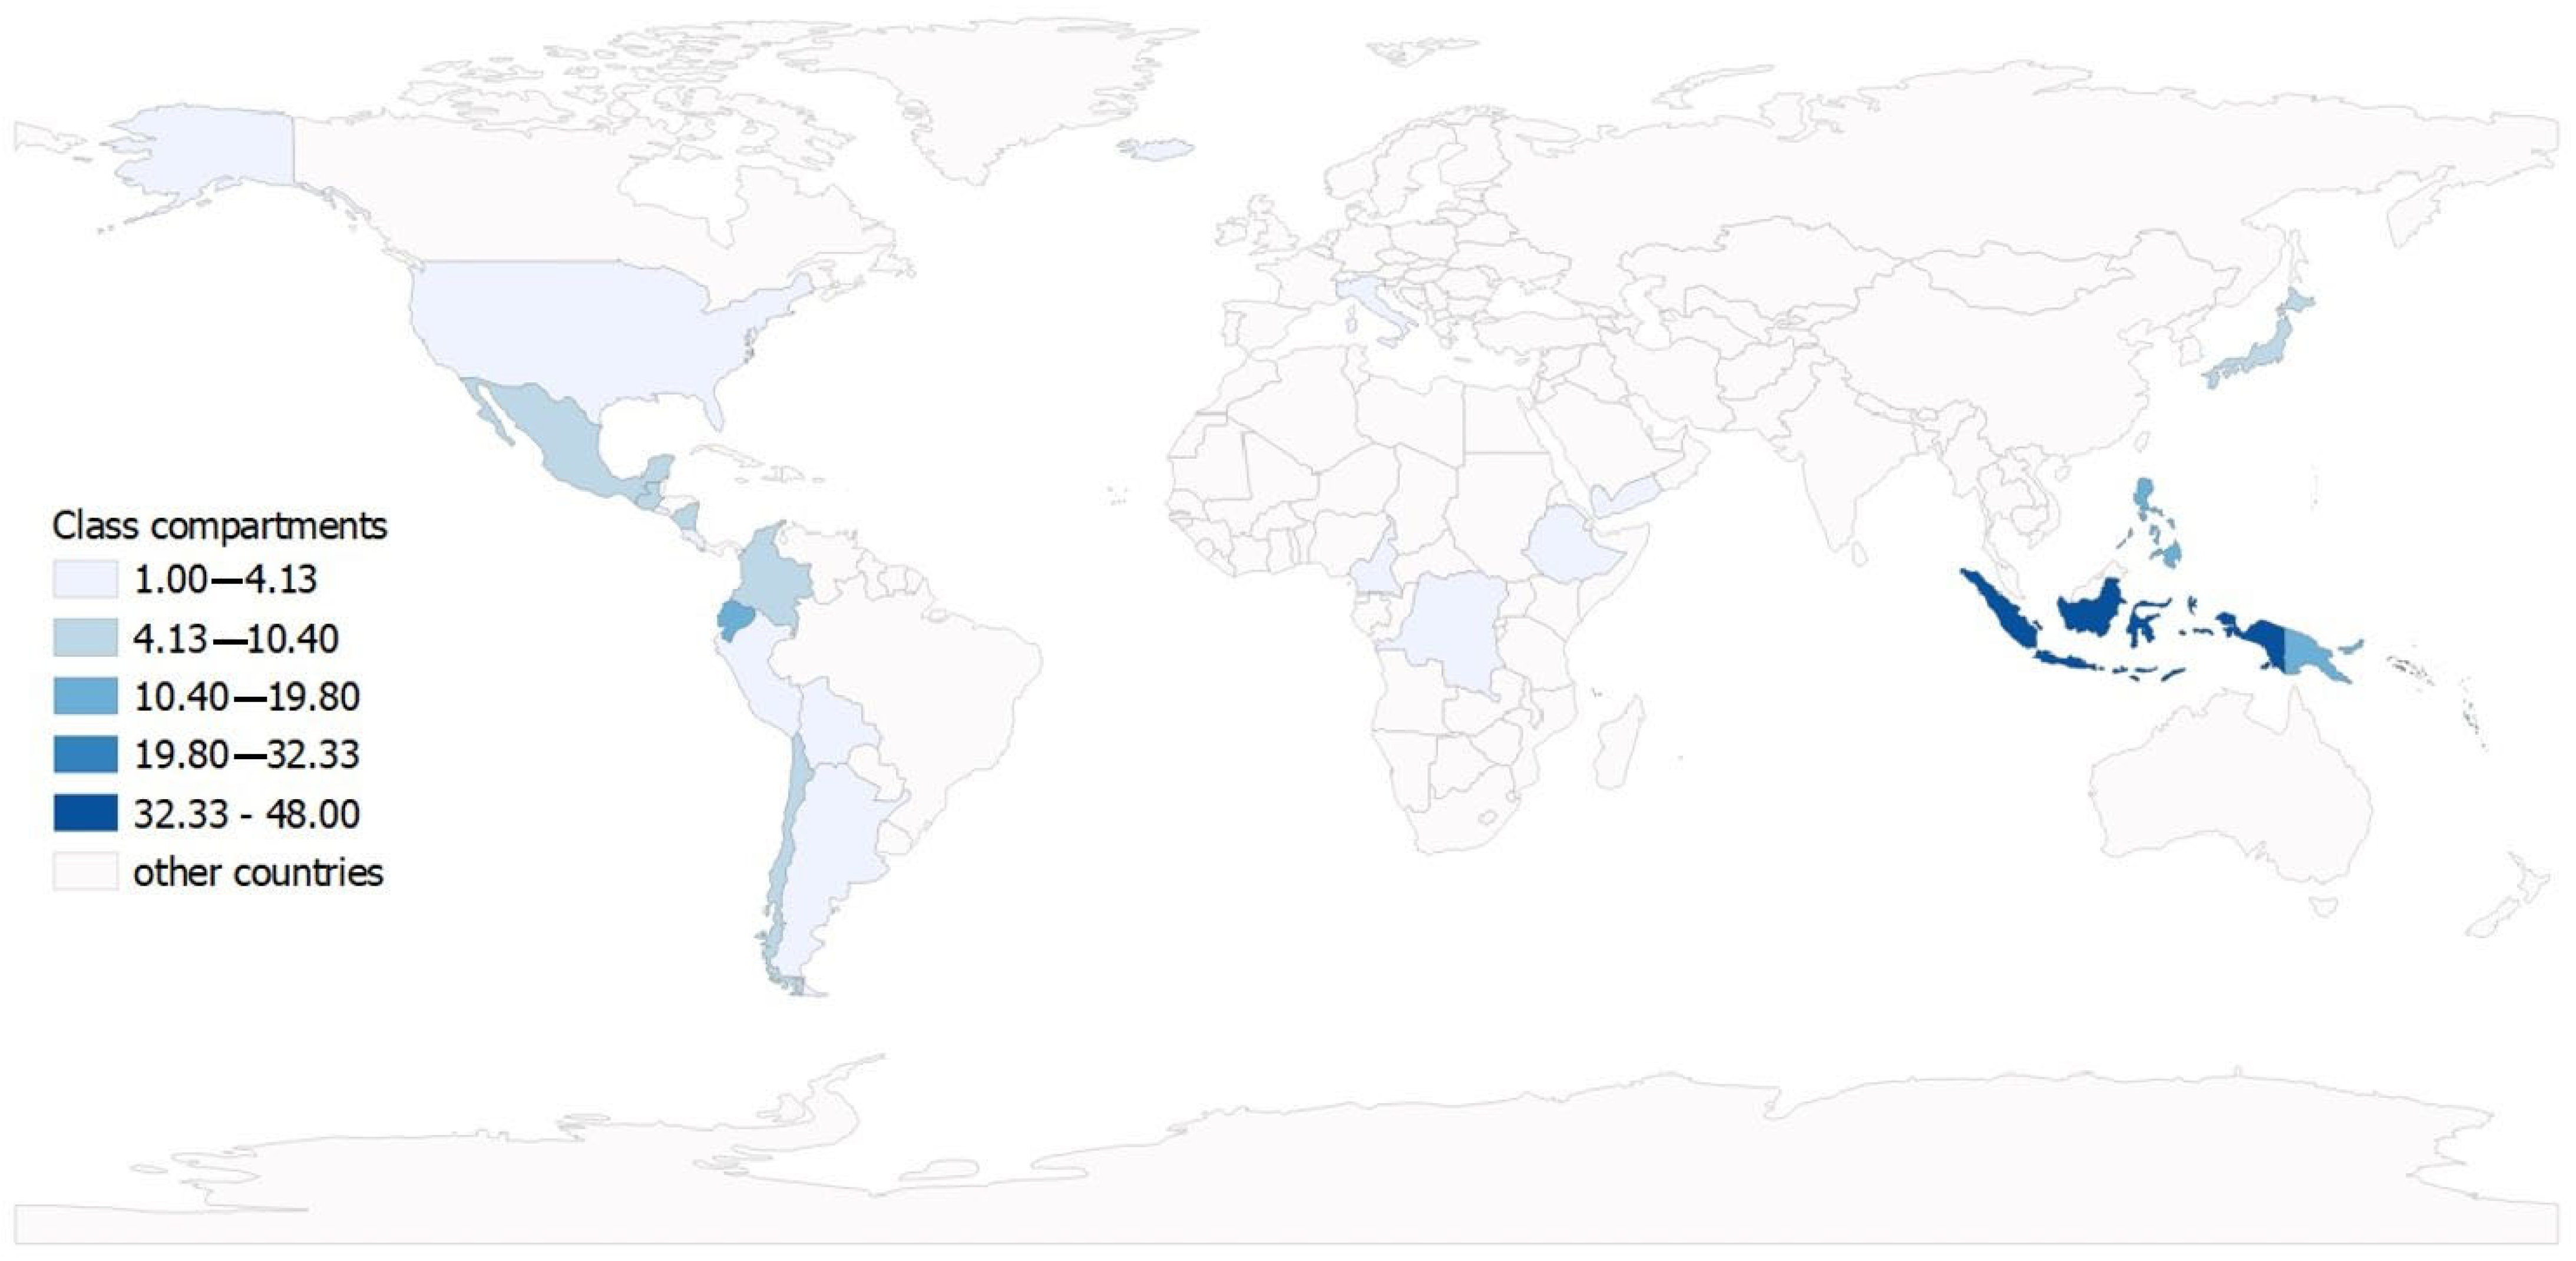
3.2. Disasters by Country

Analyses of natural disasters were conducted in terms of their occurrence in each country; 200 countries were affected at least once during the analysed period by at least one natural disaster. Figure 2 presents the results of this analysis on a cartodiagram in a five-class interval, using the arithmetic progression method [31]. This method involves increasing successive classes by a fixed value, initially based on the constant C (Equation (1)), which is used in the arithmetic sequence method
C = x n x 1 1 k x j
where:
  • x 1 —smallest expression of the characteristic for the primary field
  • x n —largest expression of the characteristic for the primary field
  • x j —division class
  • k —number of classes.
The boundary for each class is then determined in turn:
G j = D j + x j C
where G j   and   D j are the upper and lower limits of a given class, respectively. Using these calculations, the class ranges were visualised on a map with a colour scale taken from the ColorBrewer website [32] using shades of blue.
Of the 200 countries where disasters occurred, the 10 most affected were examined (Table 2). Collectively, these account for approximately 40% of all natural disasters in the studied period. China and the United States lead, with India in third place. Moreover, the last column shows the number of events per capita (in mln), and in China and India, a single phenomenon affects the biggest number of citizens.
In a similar manner, analyses were carried out separately for each disaster. The results were also presented using cartographic visualisations with a five-class range. Additionally, the tables below summarise the countries most affected by each phenomenon.
Drought, a prolonged period of dryness, can occur when there is a shortage of precipitation, such as rain or snow, for an extended period. This can significantly impact natural systems and human communities, leading to a lack of water for plants, animals, and people. Drought can have serious consequences for both natural and human systems. In natural systems, it can lead to loss of vegetation as plants die due to water scarcity. Drought can be a particularly challenging natural disaster to manage, given its potential to last for extended periods and have long-lasting effects.
Based on the analyses carried out, it can be seen that, overall, the greatest number of droughts occur in Africa, followed by Asia and then North and South America. It is worth mentioning that drought is primarily found in circumpolar countries and those with access to large bodies of water such as oceans. An example of such a country is Australia, which systematically faces increasingly longer periods of drought. It should also be noted that the incidence of this type of natural disaster was insignificant at the beginning of the period under consideration but began to increase towards the end of the last millennium. The years 2000 and 2002 saw the highest number of droughts, with 25 occurrences in those years, and a forecast of the phenomenon under study for the next 20 years also indicates an upward trend. On the other hand, over the analysed time period, the highest number of droughts occurred in China (Figure 3).
An earthquake is a natural disaster that occurs when the Earth’s crust experiences sudden and violent shaking movements. Earthquakes can range in magnitude from very small tremors, barely noticeable, to massive events that can cause widespread destruction and loss of life. They are caused by the movement of tectonic plates: the Earth’s crust is composed of several large plates that are constantly moving and shifting. When these plates collide or rub against each other, this movement can generate an enormous amount of energy, released in the form of an earthquake. There are several types of earthquakes, including shallow earthquakes (occurring at depths of less than 70 km), deep earthquakes (occurring at depths greater than 300 km), and intraplate earthquakes, which occur within the plates. Shallow earthquakes are the most common, while intraplate earthquakes are the least common. Earthquake intensity is measured using the Richter scale, a logarithmic scale that quantifies the energy released by an earthquake. This scale ranges from 1 to 10, with higher numbers indicating greater intensity. In general terms, earthquakes represent a powerful and destructive force of nature with significant impact on communities worldwide.
The continent that far surpasses others in terms of earthquake occurrences is Asia. Over the years analysed, Asia recorded the highest number of earthquake occurrences, particularly in its southern region (Figure 4). Within this data, 150 occurrences were recorded in China, 106 in Indonesia, and 99 in Iran. From the start of the period under study, the incidence of earthquakes increased steadily until 2003 and 2004 when it reached its highest values. In subsequent years, a slight decrease was observed, while the forecast for the next 20 years shows a slightly increasing trend.
Temperature extremes are usually short-lived phenomena that include both extremely high and extremely low temperatures. Extreme heat can be particularly dangerous as it can lead to heat stroke, dehydration, and other serious health problems. It also increases the risk of wildfires, as dry conditions and high temperatures can create ideal conditions for fires to start and spread. Furthermore, extreme heat can result in crop failure and other economic disruptions by making it difficult for plants and animals to survive in such conditions. Extreme cold can also pose a serious threat to human health by causing hypothermia, frostbite, and other cold-related injuries. It can also negatively impact the environment by damaging crops and wildlife habitats. In summary, extreme temperatures can have serious environmental consequences.
Based on the research conducted, it appears that the continent recording the highest number of extreme temperatures is Europe. Despite this, the countries most affected by this disaster are not on this continent (Figure 5). Among these, India leads the way, experiencing almost double the number of events compared to the United States, which is in second place. The highest number of temperature spikes was recorded in 2012, and the trend indicates that further spikes will occur, as illustrated in the forecast.
A flood is a natural disaster that occurs when an area is inundated with water, often due to heavy rainfall or the overflowing of a river or other body of water. Floods can range from small, localised events affecting a few homes, to vast disasters impacting entire regions. Types of floods include flash floods, river floods, and coastal floods. Flash floods are sudden and typically result from intense rainfall over a brief period of time. River floods happen when a river overflows its banks, often due to heavy rainfall or melting snow. Coastal floods occur when the level of the ocean or other bodies of water exceeds their normal levels, often resulting from a storm or high tide. Several factors contribute to flood risk, including the area’s topography, the presence of natural barriers such as dikes or dams, and the volume and intensity of rainfall. Human activities like urbanisation and alteration of natural landscapes can also heighten flood risk. Flooding, a devastating and perilous natural disaster, can significantly impact human communities.
Asia is the continent most affected by flooding, with as many as 1790 occurrences recorded during the period analysed. Flooding is a disaster that occurs in almost all countries across the globe (Figure 6). However, the most affected areas include China with 265 floods, followed by India with 251, and Indonesia, which experienced 192 floods. The global incidence of floods is steadily increasing, and the year with the highest recorded number of floods was 2006. The forecast for the next 20 years indicates a significant upward trend of this phenomenon.
A landslide is a natural disaster that occurs when a slope or surface collapses, often due to erosion or the movement of soil or rock. Landslides can range from small events to massive disasters, posing significant threats to human safety by damaging buildings and infrastructure. Moreover, they can adversely impact the environment by causing erosion and loss of natural habitats. Several factors contribute to landslide risk, including the geology and topography of the area, the presence of natural hazards such as earthquakes or volcanic activity, and human activities like logging, mining, and urbanisation. Additionally, extreme weather events such as heavy rainfall or snowmelt can exacerbate landslide risk. In summary, landslides are destructive and dangerous natural disasters with significant impacts on communities.
Based on our analyses, Asia far surpasses other continents in terms of landslide occurrences, with 348 recorded events. Among these, 69 were reported in China. It is worth noting that landslides are also common in South American countries (Figure 7). The incidence of this type of phenomenon has consistently risen; from 1990, when four landslides were recorded, their number has steadily increased, peaking at 30 in 2010.
Mass movements are a type of natural disaster that occurs when a large mass of soil, rock, or other material moves down a slope due to gravity. They can range from small landslides to massive events. There are several types of mass movements, including landslides, rockfalls, and debris flows. Landslides, the most common type of mass movement, occur when a slope collapses, often due to erosion or the movement of soil or rock. Rockfalls happen when rocks or boulders break away from a cliff or slope and fall to the ground below. Debris flows, a type of landslide, occurs when a mixture of water, rock, and soil flows down a slope, often at high velocity. Factors influencing the risk of mass movements include the geology and topography of the area, natural hazards like earthquakes or volcanic activity, and human impact. Certain weather phenomena, such as heavy rainfall or melting snow, can also intensify mass movements. Mass movements are devastating and dangerous natural disasters that significantly impact communities.
Compared to other disasters, this phenomenon is the least frequent, with occurrences reported in only 21 countries over the analysed period (Figure 8). The continent with the most recorded mass movements is Asia, reporting a total of 19 phenomena, 7 of which occurred in China. The number of mass movements fluctuates between 0 and 3 per year, showing no discernible upward trend.
A thunderstorm is a meteorological phenomenon characterised by strong winds, heavy rain or snow, and often accompanied by lightning and thunder. Thunderstorms, which vary in size and intensity, are formed by the collision of warm and cold air masses, resulting in the formation of convective clouds. These clouds undergo an atmospheric discharge, manifesting as lightning and subsequently causing thunder. Various types of thunderstorms include standard thunderstorms, blizzards, tornadoes, and hurricanes. Thunderstorms, as the name suggests, are characterised by lightning and thunder, often producing heavy rain or hail and potentially causing high winds and flash floods. These storms are common worldwide and can occur at any time of the year. Blizzards are marked by strong winds and heavy snowfall and can be incredibly hazardous. Tornadoes are storms marked by a strong, swirling column of air that touches the ground, while hurricanes are characterised by heavy rain and strong winds. They are most common in the Atlantic Ocean and can have a devastating impact on coastal communities. The United States, located in North America, has recorded the highest number of these phenomena at 500. Despite this, the highest number of storm occurrences was recorded in Asia, particularly in its south-eastern region, where several countries were significantly impacted by these elements (Figure 9). During the analysed period, storm occurrences have consistently increased, with the most significant increase recorded in 2017 with a total of 108 events. This trend is projected to continue upwards over the next 20 years.
Volcanic activity encompasses a series of processes through which magma, or lava, is released from deep within the Earth’s crust to the surface through the volcano’s central opening (crater) and fissures. The released lava can range from thick and slow-moving to thin and fast-moving. Upon reaching the surface, it can cause a variety of impacts, including the emission of ash, gases, and lava flows. Volcanoes form when magma from deep within the Earth’s crust rises to the surface. Different types of volcanoes include stratovolcanoes, shield volcanoes, and cinder cones. Stratovolcanoes, or complex volcanoes, are tall and cone-shaped with steep slopes. These are usually formed by explosive eruptions of viscous magma, making them among the most dangerous types of volcanoes. Shield volcanoes, on the other hand, are much wider and flatter, and formed by eruptions of low viscosity magma. Cinder cones are small, steep volcanoes formed by the eruption of ash, cinders, and other volcanic debris.
Asia is the continent most affected by volcanic activity. During the years included in the analysis, 77 instances of volcanic activities were recorded, 48 of which occurred in Indonesia. This high frequency is because the country houses around 400 volcanoes, 100 of which are still active. This is followed by the Philippines and countries in the western part of South America (Figure 10).
The highest volcanic activity was recorded in 2006 with 12 volcanic eruptions. Given that some of the volcanoes are still active, forecasts predict a steady increase in activity.

3.3. Trends and Perspectives

The disasters analysed in this paper primarily result from natural phenomena, most of which are unpredictable and can occur abruptly. Their frequency varies depending on their location. Each of the disasters has been analysed in terms of the number of occurrences over time. To forecast the future occurrences, we employed a 4th-degree polynomial regression model. The rationale for using a polynomial regression, specifically of the 4th degree, was based on the observed trend in the data that could not be captured efficiently using linear or simpler polynomial regressions. The 4th-degree polynomial provided the best fit to our data, as evidenced by improved R-squared values and reduced residuals. The predictions have been made for the next 20 years using this model with a 95% confidence interval (Figure 11). It is worth noting that the most significant increase in the majority of individual phenomena occurred at the beginning of the 21st century. Meanwhile, the total number of catastrophic events began to stabilise at around 300–350 disasters per year. This stabilisation likely stems from technological advancements allowing phenomena to be more closely studied and monitored, resulting in better access to information. Confidence intervals do not exhibit as much stability as the forecasts. For most disasters, they have uneven upper and lower limits. A significant proportion of them are characterised by the upper confidence interval being substantially higher than the lower one, with the exception of extreme temperatures, where the trend is reversed. The lowest value of the lower confidence limit deviates considerably from the others, reaching nearly −60. The only consistency is found in the case of mass movements, where the distances from the forecast to the upper and lower confidence intervals are equal. All forecasts maintain a high probability of occurrence in subsequent years.

4. Discussion

The aim of this study was to perform a geospatial analysis of natural disasters over the period from 1960 to 2018. For this purpose, 9962 disasters spanning 39,953 locations (i.e., administrative units within countries) were analysed. We examined the long-term occurrence of disasters and provided forecasts for their potential occurrence over the next 20 years. Initially, the focus was on the number of individual phenomena occurring on different continents. Subsequent analyses concentrated on smaller areas, i.e., specific countries. We evaluated the data in terms of the occurrence within each country, selecting the 10 most affected by natural disasters. This was followed by an assessment of individual phenomena, analysed based on the number of events taking place in the countries. The three most affected regions were also highlighted in tables. Furthermore, the number of disasters was evaluated considering the basic data of the continents, i.e., population and area. The final analysis examined the years in which the disasters occurred. Separate charts were created for each phenomenon, showing the distribution of disasters by year. Forecasts for the next 20 years were also generated, which generally indicated an increase in all cases.
As a result, it emerged that Asia was the most disaster-affected region, with a notable correlation between the area and population size and the number of disasters. However, it is improbable that the phenomena impacted the entire region evenly. The majority of these events affected the south-eastern part of the continent, particularly China, which was impacted by all the analysed disasters to varying degrees. Similarly, India, the Philippines, and Indonesia were heavily affected. The United States also ranked high on the list. There were distinct differences in the types of natural disasters prevalent in various parts of the world, as evidenced by the countries mentioned above. Four out of five of these countries are located in the same region of the world, whereas the USA is situated in a different hemisphere. This underlines that a region’s geographical location greatly influences disaster occurrences, making countries in South-East Asia more susceptible to natural disasters. This is likely due to the convergence of tectonic plates in this area, causing frequent seismic activity potentially leading to natural disasters. Climate also plays a significant role in disaster occurrence. The United States, for instance, has the highest number of storms globally due to its diverse climate. Warm, humid conditions in certain regions, in combination with cold, heavy air from mountainous areas, create potent storm clouds. Generally, the frequency of natural disasters in a region depends on multiple factors, including its size and population, as well as the most common natural hazards present.
The forecasted trends, while rooted in historical data, undeniably reflect the increasing influence of climate change on the frequency and severity of natural phenomena. Climate change is anticipated to elevate the risk of extreme weather events such as hurricanes, floods, droughts, and storms, which are projected to become more frequent and intense in various parts of the world. The anticipated rise in global temperatures is expected to amplify the frequency and intensity of temperature-related disasters like heatwaves, forest fires, and droughts. Additionally, melting glaciers and rising sea levels, driven by escalating temperatures, heighten the risk of coastal flooding. As urbanisation and population density continue to surge, the potential losses from these exacerbated natural disasters also increase, particularly as more individuals and infrastructures find themselves in areas of vulnerability. It is pivotal to understand that while our forecasts are informed by past trends, the imprint of climate change, even in recent past data, cannot be ignored. In response to these heightened risks brought about by climate change combined with population growth and urbanisation, effective adaptation strategies are paramount. The future landscape of infrastructure, urban planning, building systems, and risk management must evolve to minimise the repercussions of these natural disasters. As global awareness about sustainable development and environmental protection intensifies, we anticipate future policies to prioritise measures that not only mitigate the impacts of climate change but also bolster ecosystem resilience, thus reducing the risk of natural disasters.

5. Conclusions

Natural disasters such as earthquakes, floods, hurricanes, fires, and droughts have significant impacts on both people and the environment. Among their primary effects is the loss of human life; individuals can be injured or killed by falling buildings, avalanches, floods, and other disaster-related incidents. Immediate threats to life also arise from lack of access to essential needs such as food, drinking water, and medical care in the aftermath of a disaster. Moreover, man-made infrastructure—including roads, bridges, power lines, buildings, and other facilities—are often destroyed. Such damage disrupts the normal functioning of communities, hindering access to humanitarian assistance and reconstruction efforts. Along with infrastructural destruction, natural disasters often result in substantial property loss. People frequently lose their homes, farms, vehicles, and other possessions, leading to immense personal hardship and economic instability for individuals and communities alike.
Natural disasters also cause environmental pollution. For example, floods or earthquakes can lead to the leakage of chemicals, damage to sewage disposal infrastructure, and destruction of hazardous substance storage facilities, contaminating ground and surface water. Fires contribute to poor air quality by emitting large quantities of smoke and dust.
The health effects of natural disasters on both humans and wildlife are manifold, ranging from physical injuries such as fractures, cuts, or burns, to health problems like water-borne diseases, epidemics, malnutrition, and mental illnesses related to stress and trauma. Long-term natural disasters can also trigger increased homelessness and migration, often resulting in the mass displacement of people who lose their homes and living environment. Many become homeless or seek shelter in refugee camps, leading to numerous social and humanitarian issues, including a lack of access to basic services, and increased risk of violence and exploitation.
From an economic standpoint, natural disasters cause loss of agricultural production, job losses, and necessitate reconstruction efforts requiring significant financial investment. These factors contribute to economic decline in the affected areas, posing challenges to reconstruction and socio-economic development.

Author Contributions

Conceptualization, J.B., K.W. and K.M.; methodology, J.B., K.W. and K.M.; software, J.B., K.W. and K.M.; validation, J.B., K.W. and K.M.; formal analysis, J.B., K.W. and K.M.; investigation, J.B., K.W. and K.M.; resources, J.B., K.W. and K.M.; data curation, J.B., K.W. and K.M.; writing—original draft preparation, J.B., K.W., C.A.G.S., K.K. and K.M.; writing—review and editing, J.B., K.W., C.A.G.S., K.K. and K.M.; visualization, J.B., K.W. and K.M.; supervision, J.B., K.W., C.A.G.S., K.K. and K.M.; project administration, K.M.; funding acquisition, K.M. J.B. 30%, K.W. 30%, C.A.G.S. 5%, K.K. 10%, K.M. 25%. All authors have read and agreed to the published version of the manuscript.

Funding

This research was funded by statutory research at AGH University of Science and Technology 16.16.150.545.

Data Availability Statement

Not applicable.

Conflicts of Interest

The authors declare no conflict of interest.

References

  1. Gray, C.L.; Mueller, V. Natural disasters and population mobility in Bangladesh. Proc. Natl. Acad. Sci. USA 2012, 109, 6000–6005. [Google Scholar] [CrossRef]
  2. Ogden, F.L.; Raj Pradhan, N.; Downer, C.W.; Zahner, J.A. Relative importance of impervious area, drainage density, width function, and subsurface storm drainage on flood runoff from an urbanized catchment. Water Resour. Res. 2011, 47, 1–12. [Google Scholar] [CrossRef]
  3. Okazumi, T.; Nakasu, T. Lessons learned from two unprecedented disasters in 2011—Great East Japan Earthquake and Tsunami in Japan and Chao Phraya River flood in Thailand. Int. J. Disaster Risk Reduct. 2015, 13, 200–206. [Google Scholar] [CrossRef]
  4. Alcántara-Ayala, I. Geomorphology, natural hazards, vulnerability and prevention of natural disasters in developing countries. Geomorphology 2002, 47, 107–124. [Google Scholar] [CrossRef]
  5. Van Aalst, M.K. The impacts of climate change on the risk of natural disasters. Disasters 2006, 30, 5–18. [Google Scholar] [CrossRef]
  6. Gill, J.C.; Malamud, B.D. Anthropogenic processes, natural hazards, and interactions in a multi-hazard framework. Earth-Sci. Rev. 2017, 166, 246–269. [Google Scholar] [CrossRef]
  7. Naulin, J.P.; Payrastre, O.; Gaume, E. Spatially distributed flood forecasting in flash flood prone areas: Application to road network supervision in Southern France. J. Hydrol. 2013, 486, 88–99. [Google Scholar] [CrossRef]
  8. Mazdiyasni, O.; AghaKouchak, A. Natural Disasters Are Prejudiced against Disadvantaged and Vulnerable Populations: The Lack of Publicly Available Health-Related Data Hinders Research at the Cusp of the Global Climate Crisis. GeoHealth 2020, 4, e2019GH000219. [Google Scholar] [CrossRef]
  9. Bubeck, P.; Botzen, W.J.W.; Aerts, J.C.J.H. A Review of Risk Perceptions and Other Factors that Influence Flood Mitigation Behavior. Risk Anal. 2012, 32, 1481–1495. [Google Scholar] [CrossRef]
  10. Welle, T.; Depietri, Y.; Angignard, M.; Birkmann, J.; Renaud, F.; Greiving, S. Vulnerability Assessment to Heat Waves, Floods, and Earthquakes Using the MOVE Framework: Test Case Cologne, Germany; Elsevier Inc.: Amsterdam, The Netherlands, 2014; ISBN 9780124105485. [Google Scholar]
  11. Drabek, T.E.; McEntire, D.A. Emergent phenomena and the sociology of disaster: Lessons, trends and opportunities from the research literature. Disaster Prev. Manag. Int. J. 2003, 12, 97–112. [Google Scholar] [CrossRef]
  12. Adger, W.N. Social capital, collective action, and adaptation to climate change. Econ. Geogr. 2003, 79, 387–404. [Google Scholar] [CrossRef]
  13. Grothmann, T.; Reusswig, F. People at risk of flooding: Why some residents take precautionary action while others do not. Nat. Hazards 2006, 38, 101–120. [Google Scholar] [CrossRef]
  14. Kandelaki, N.; Iordanishvili, I.; Ujma, A.; Iremashvili, I.; Iordanishvili, K.; Kupreishvili, S.; Shurghaia, V.; Natroshvili, G. Impact of Natural Disasters on Water Resources in Georgia Caused by Global Warming. Arch. Hydroeng. Environ. Mech. 2019, 66, 15–26. [Google Scholar] [CrossRef]
  15. Rosselló, J.; Becken, S.; Santana-Gallego, M. The effects of natural disasters on international tourism: A global analysis. Tour. Manag. 2020, 79, 104080. [Google Scholar] [CrossRef] [PubMed]
  16. Skidmore, M.; Toya, H. Do natural disasters promote long-run growth? Econ. Inq. 2002, 40, 664–687. [Google Scholar] [CrossRef]
  17. Schmidt-Thomé, P.; Greiving, S.; Kallio, H.; Fleischhauer, M.; Jarva, J. Economic risk maps of floods and earthquakes for European regions. Quat. Int. 2006, 150, 103–112. [Google Scholar] [CrossRef]
  18. Neumayer, E.; Barthel, F. Normalizing economic loss from natural disasters: A global analysis. Glob. Environ. Chang. 2011, 21, 13–24. [Google Scholar] [CrossRef]
  19. Abbas Khan, K.; Zaman, K.; Shoukry, A.M.; Sharkawy, A.; Gani, S.; Sasmoko; Ahmad, J.; Khan, A.; Hishan, S.S. Natural disasters and economic losses: Controlling external migration, energy and environmental resources, water demand, and financial development for global prosperity. Environ. Sci. Pollut. Res. 2019, 26, 14287–14299. [Google Scholar] [CrossRef] [PubMed]
  20. Nafzis, F. and Shahwar, K. Universal health coverage—There is more to it than meets the eye. J. Fam. Med. Prim. Care 2017, 6, 169–170. [Google Scholar] [CrossRef]
  21. Finnigan, G.A. The natural environment as a disaster hazard: The growing global health threat. Disaster Prev. Manag. Int. J. 2019, 28, 724–737. [Google Scholar] [CrossRef]
  22. Mishra, A.; Bruno, E.; Zilberman, D. Compound natural and human disasters: Managing drought and COVID-19 to sustain global agriculture and food sectors. Sci. Total Environ. 2021, 754, 142210. [Google Scholar] [CrossRef] [PubMed]
  23. Chwedczuk, K.; Cienkosz, D.; Apollo, M.; Borowski, L.; Lewinska, P.; Guimarães Santos, C.A.; Eborka, K.; Kulshreshtha, S.; Romero-Andrade, R.; Sedeek, A.; et al. Challenges related to the determination of altitudes of mountain peaks presented on cartographic sources. Geod. Vestn. 2022, 66, 49–59. [Google Scholar] [CrossRef]
  24. Banasik, P.; Borowski, Ł. Georeferencing the Cadastral Map of the Krakow Region. Cartogr. J. 2021, 58, 329–340. [Google Scholar] [CrossRef]
  25. Apollo, M.; Mostowska, J.; Maciuk, K.; Wengel, Y.; Jones, T.E.; Cheer, J.M. Peak-bagging and cartographic misrepresentations: A call to correction. Curr. Issues Tour. 2021, 24, 1970–1975. [Google Scholar] [CrossRef]
  26. Neumayer, E.; Plümper, T. The gendered nature of natural disasters: The impact of catastrophic events on the gender gap in life Expectancy, 1981–2002. Ann. Assoc. Am. Geogr. 2007, 97, 551–566. [Google Scholar] [CrossRef]
  27. Rosvold, E.L.; Buhaug, H. GDIS, a global dataset of geocoded disaster locations. Sci. Data 2021, 8, 61. [Google Scholar] [CrossRef] [PubMed]
  28. SEDAC about Us|SEDAC. Available online: https://sedac.ciesin.columbia.edu/about (accessed on 13 July 2023).
  29. United Nations. World Population Prospects 2022. 2022. Available online: www.un.org/development/desa/pd/ (accessed on 13 July 2023).
  30. Central Intelligence Agency. The World Factbook; Central Intelligence Agency: Washington, DC, USA, 2023. Available online: https://www.cia.gov/the-world-factbook/ (accessed on 5 May 2023).
  31. Pieniążek, M.; Szejgiec, B.; Zych, M.; Ajdyn, A.; Nowakowska, G. Graficzna Prezentacja Danych Statystycznych. Report, Warsaw. 2014. Available online: https://stat.gov.pl/gfx/portalinformacyjny/userfiles/_public/wspolpraca_rozwojowa/graficzna_prezentacja_danych_stat.pdf (accessed on 1 August 2023).
  32. ColorBrewer: Color Advice for Maps. Available online: https://colorbrewer2.org/#type=sequential&scheme=BuGn&n=3 (accessed on 13 July 2023).
Figure 1. Number of disasters, distribution by continent (a) Asia, Africa, Europe and (b) North America, Oceania, South America.
Resources 12 00106 g001aResources 12 00106 g001b
Figure 2. Distribution of all disasters by country.
Resources 12 00106 g002
Figure 3. Distribution of droughts by country.
Resources 12 00106 g003
Figure 4. Distribution of earthquakes by country.
Resources 12 00106 g004
Figure 5. Distribution of extreme temperatures by country.
Resources 12 00106 g005
Figure 6. Distribution of floods by country.
Resources 12 00106 g006
Figure 7. Distribution of landslides by country.
Resources 12 00106 g007
Figure 8. Distribution of mass movements by country.
Resources 12 00106 g008
Figure 9. Distribution of storms by country.
Resources 12 00106 g009
Figure 10. Distribution of volcanic activities by country.
Resources 12 00106 g010
Figure 11. Disasters charts from 1960–2018 (navy blue) with forecasts (red) for the next 20 years.
Resources 12 00106 g011
Table 1. Distribution of natural disasters by continent: number of disasters per million people and per 1000 km2.
ContinentPopulation
[million]
Area
[million km2]
Total Number of Disasters
Africa837.530.41427
Asia3199.044.64427
Europe675.010.21143
North America400.524.21634
Oceania30.07.7468
South America327.017.8863
Table 2. Countries most affected by natural disasters.
No.CountryQuantities% of TotalEvents per Capita [mln]
1China8088.111.75
2United States of America7377.400.45
3India5365.382.63
4Philippines4804.820.24
5Indonesia4254.270.64
6Bangladesh2222.230.76
7Mexico2092.100.61
8Japan2072.080.61
9Iran1831.840.48
10Brazil1801.811.19
TOTAL398740.04%
Disclaimer/Publisher’s Note: The statements, opinions and data contained in all publications are solely those of the individual author(s) and contributor(s) and not of MDPI and/or the editor(s). MDPI and/or the editor(s) disclaim responsibility for any injury to people or property resulting from any ideas, methods, instructions or products referred to in the content.

