Abstract
The agricultural products trade network is essentially a complex adaptive system formed by nonlinear interactions between countries. Based on the complex system theory, this study reveals the dynamic self-organization law of the RCEP regional agricultural products trade network by using the panel data of RCEP agricultural products export trade from 2000 to 2023, combining social network analysis (SNA) and the temporal exponential random graph model (TERGM). The results show the following: (1) The RCEP agricultural products trade network presents a “core-edge” hierarchical structure, with China as the core hub to drive regional resource integration and ASEAN countries developing into secondary core nodes to deepen collaborative dependence. (2) The “China-ASEAN-Japan-Korea “riangle trade structure is formed under the RCEP framework, and the network has the characteristics of a “small world”. The leading mode of South–South trade promotes the regional economic order to shift from the traditional vertical division of labor to multiple coordination. (3) The evolution of trade network system is driven by multiple factors: endogenous reciprocity and network expansion are the core structural driving forces; synergistic optimization of supply and demand matching between economic and financial development to promote system upgrading; geographical proximity and cultural convergence effectively reduce transaction costs and enhance system connectivity, but geographical distance is still the key system constraint that restricts the integration of marginal countries. This study provides a systematic and scientific analytical framework for understanding the resilience mechanism and structural evolution of regional agricultural trade networks under global shocks.
1. Introduction
Under the impact of deep restructuring of global supply chains, intensified geopolitical games, and frequent extreme weather, the multilateral agricultural governance system under the framework of the World Trade Organization (WTO) tends to be out of order, and the pattern of international agricultural trade accelerates to evolve in the direction of “fragmentation, theme camp and chain regionalization” [1]. At the same time, under the spread of an anti-globalization trend, trade protection measures such as import quotas, tariff barriers, and technical barriers aggravate the rupture of the global industrial supply chain and disrupt the international economic order of the agricultural products market. Deepening regional cooperation has become a key path for developing countries to cope with the challenges of weakening the functionality of the multilateral trading system and restructuring rules, and to enhance economic security resilience and collective bargaining capacity. Among them, the RCEP region has become the key research object by virtue of its highly active agricultural trade network. Since the 1990s, the region has formed a regional value chain of “Asian Factory”. ASEAN, as a trade hub, has established a “10 + 1” free trade network with China, Japan, and South Korea. Since the launch of RCEP negotiations in 2012, the dependence on trade in intermediate products and agricultural products among member countries has continued to increase, and the density of intra-regional agricultural trade networks has increased significantly, making it one of the most active regions in global agricultural trade. As a complex adaptive system, what internal laws and key mechanisms drive the dynamic evolution of the RCEP regional agricultural products trade network? In particular, how can the topology and evolution path of the network be influenced to support the optimization of regional agricultural value chains and the construction of food security communities?
The global agricultural trade network has typical complex system characteristics, and its evolution is driven by nonlinear interaction between nodes (countries), hierarchical feedback, and external environmental disturbance. By integrating the comparative advantages of geographical location, technical ability, and resource endowment, it realizes complementary connection, promotes regional economic integration and the optimal allocation of resources, and ensures the resilience of global grain supply chain through diversified connection, thus becoming the “stabilizer” and “growth pole” of the international trade system [2,3,4]. Structurally, it follows a core-periphery hierarchical pattern, with hub countries like China, the United States, and Brazil dominating the core due to their significant trade volumes, resource control, and market influence [5,6,7]. However, regional networks have evolved beyond a unipolar dominance model, as RCEP member states have facilitated a core diffusion effect by enhancing free trade agreements, transitioning from a China-centric single-core structure to a multi-centric collaborative network. Concurrently, the Belt and Road Initiative has established four major trade clusters based on functional complementarity, advancing from loose connections to modular collaboration [8]. Certain networks show small-world properties with high clustering and short path lengths, enhancing system stability with redundant connections while preserving trade efficiency. Structural diversity in the global agricultural product trade system indicates a dynamic equilibrium between stability and adaptability through varied pathways.
With the deepening of globalization and regional economic cooperation, agricultural trade network research has gradually become the focus of agricultural economics and complex systems science. Early academic circles mainly relied on social network analysis (SNA) and static indicators to describe trade associations [9,10,11] such as Ma (2016) to analyze node centrality [12,13,14], but such methods are difficult to capture dynamic evolution and non-linear interaction due to dependence on cross-section data. Recent research has turned to dynamic mechanism analysis, gradually introducing spatial metrology model, quadratic assignment procedure (QAP), temporal exponential random graph model (TERGM), and other methods [15]. For example, Chen Yiwen (2019) deconstructs the transition of “One Belt and One Road” trade network through a spatial framework [16], Li (2022) and Deng (2024) quantify the dynamic effect of FTA by QAP, marking the transformation from methodology to mechanism deconstruction [17,18]. The research focusing on the RCEP region has made phased progress [19,20]. Based on static network analysis, Xu (2024) and Peng (2024) revealed the “core-edge” structure and China single-core characteristics of the RCEP agricultural products trade network [21,22]; Huang (2023) used the TERGM model to confirm the key driving role of endogenous mechanisms such as the reciprocal effect and multiple connectivity effect on network evolution [23]. However, existing studies have significant limitations. Most of the results are limited to static analysis methods, which fail to analyze the dynamic response of the network structure after RCEP takes effect. The conclusion that China’s core position evolves slowly forms tension with the potential acceleration after the agreement comes into effect. For dynamic studies such as Huang (2023), due to the data ending in 2021, there is no empirical observation on the institutional impact during the formally effective period of RCEP [23]. In addition, the widely used QAP models have not fully quantified the independent and synergistic contributions of endogenous structural effects and exogenous factors, and have inherent defects in resolving temporal dependence. These deficiencies restrict the deep understanding of the inherent logic of the evolution of RCEP agricultural trade network [15,24].
In summary, significant progress has been made in existing research in the area of agricultural trade networks. The marginal contributions of this study are mainly reflected in the following: (1) Different from the binary analysis paradigm of the traditional trade research, an analytical framework integrating network structure, dynamic evolution, and driving mechanism is constructed to reveal the multi-level collaborative characteristics of the RCEP agricultural trade network. By explaining the interaction between the endogenous reciprocity mechanism and the exogenous institutional arrangement, this paper expands the cognition of adaptability between institutions and structures in regional economic integration theory. (2) The temporal stochastic exponential graph model (TERGM) is adopted to improve the temporal dependence processing ability of the traditional QAP model in dynamic network analysis. Through the construction of dynamic directional weighted networks, the evolution of the overall network structure and the interaction characteristics of local nodes are analyzed synchronously. (3) Identify the evolution path of a “dual-core drive” network in RCEP region and verify the growth effect of the China-ASEAN reciprocal structure. And quantitative mechanism results provide a new basis for regional agricultural value chain optimization.
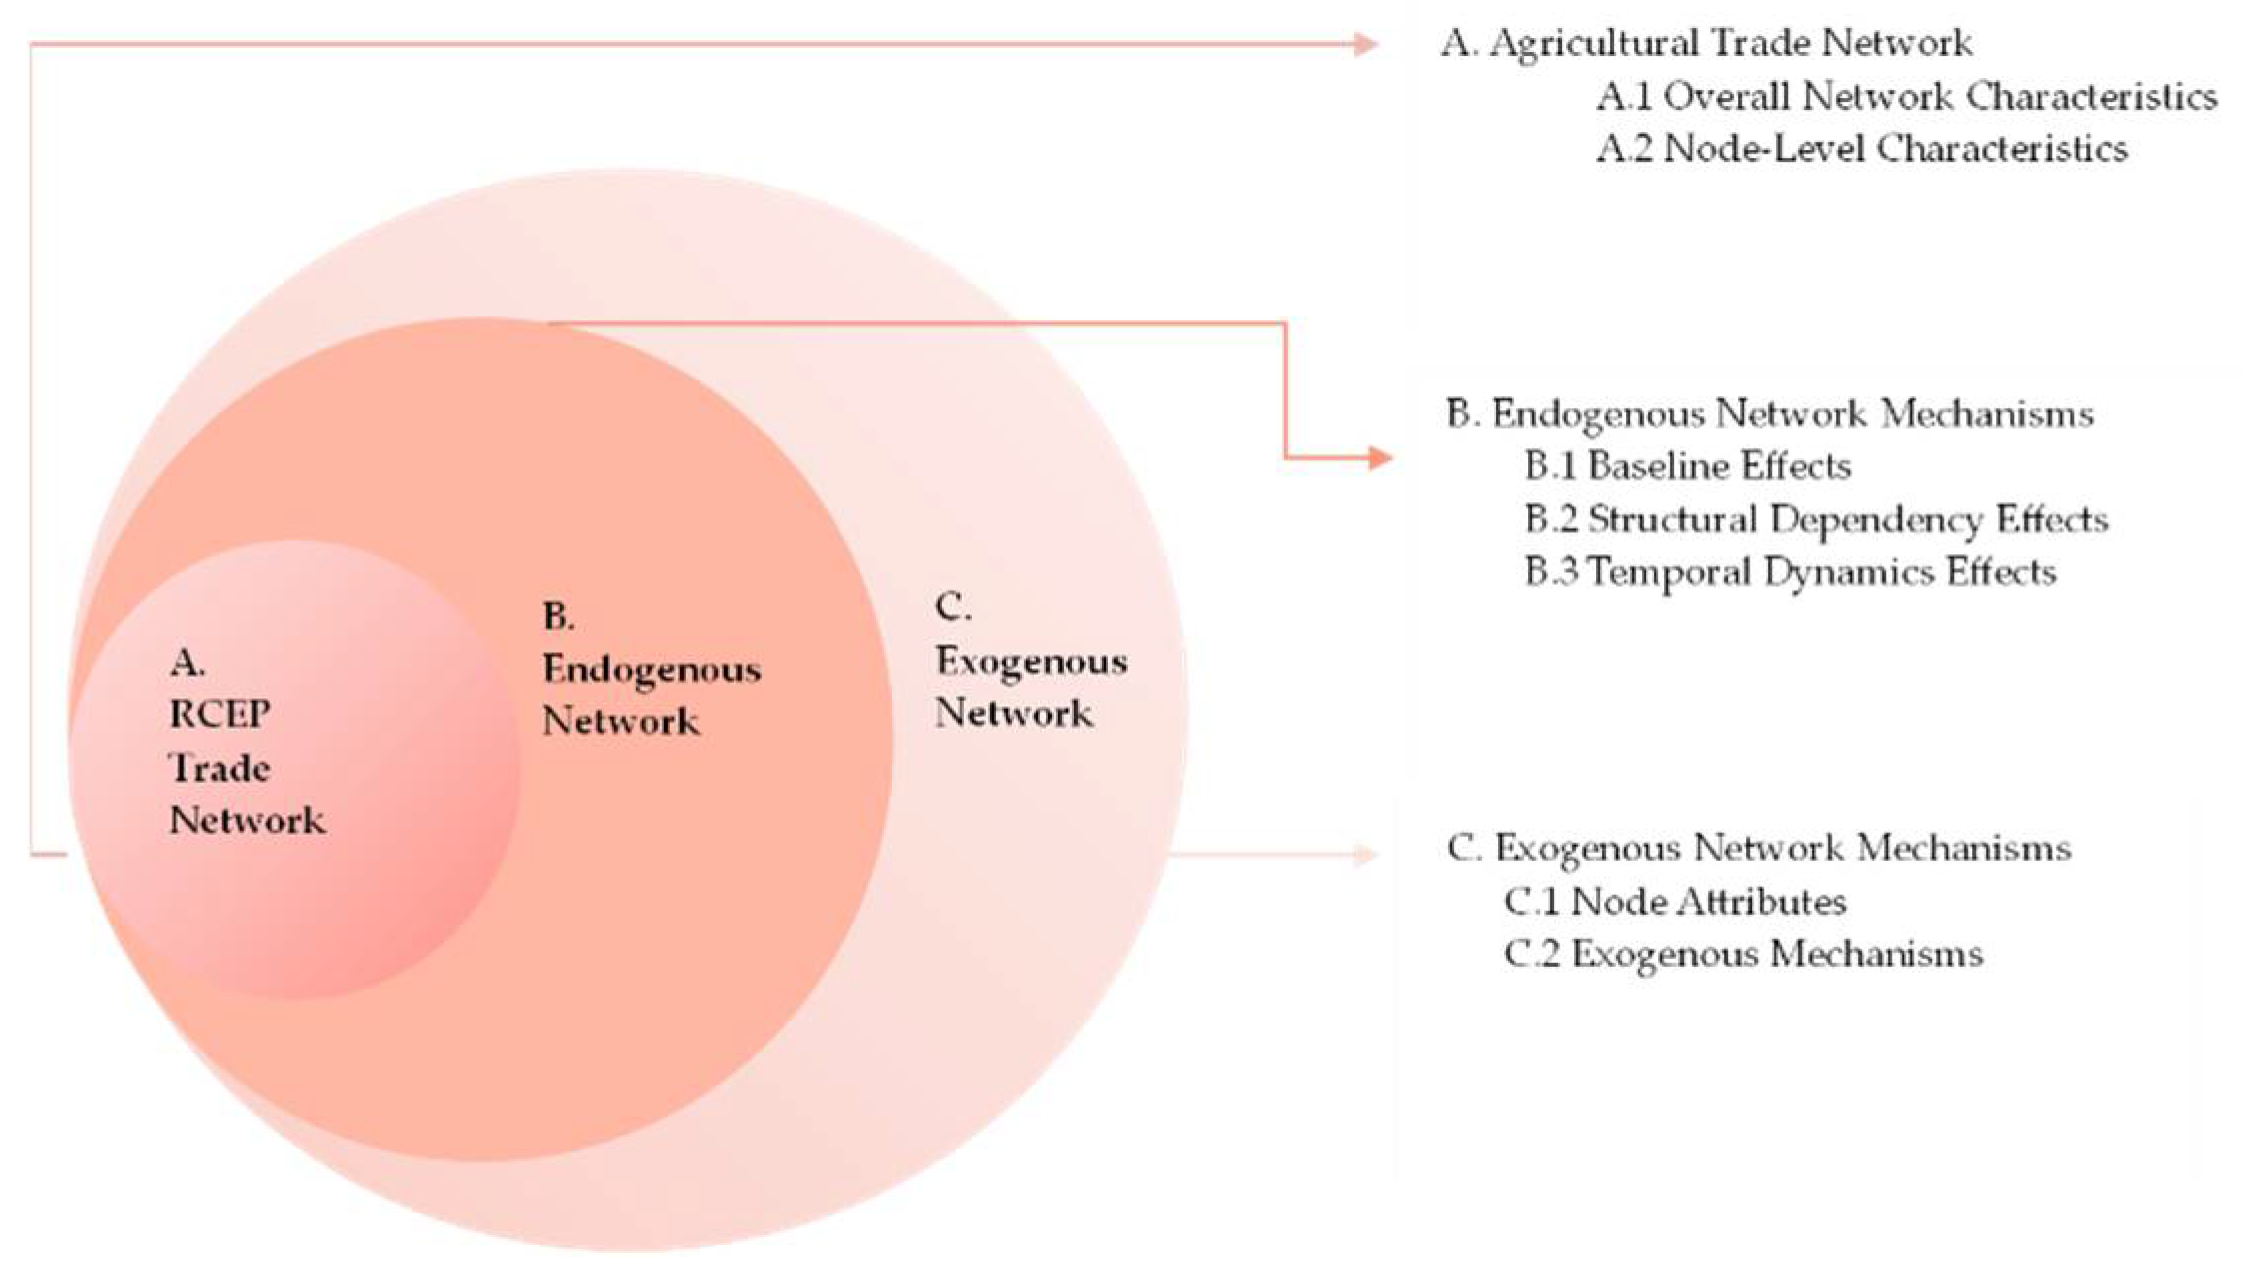
The Conceptual Framework
To clearly present the research framework and ensure textual coherence, Figure 1 provides a visual representation of the study’s core conceptual model.

Figure 1.
Conceptual model framework.
This paper constructs a conceptual model framework to analyze the dynamic evolution mechanism of the RCEP agricultural trade network. The framework integrates three core dimensions: structural characteristics of trade networks (type A), endogenous networks (type B), and exogenous environments (type C) [25].
The topological structure of the class A network constitutes the basic carrier of system evolution, and the overall characteristics of the network (A.1) include characteristics that describe the overall shape and connectivity of the network, such as network density, average path length, average clustering coefficient, etc. These indicators jointly describe whether the network has the ‘small world’ characteristic and affect the overall ‘elasticity’ of the network. Network node characteristics (A.2) describe the power distribution of nodes, such as point degree centrality, proximity centrality, and intermediate centrality, where high middle degree nodes can be regarded as ‘super nodes’ that drive the evolution of the network.
Type B endogenous network features as core evolutionary dynamics, which comprise the following: Edge existence and reciprocity of fundamental effects (B.1), spontaneous formation and bidirectional reinforcement of modeling relations; transitivity, closure, convergence, and expansion of structure-dependent effects (B.2), revealing the inherent logic of network self-organization, such as transitivity driving triangle closure, convergence reflecting the attraction of core nodes (super nodes), and affecting the ‘elasticity’ of the network; time covariation and dynamic dependence of time dynamic effects (B.3), capturing the temporal dependence and path dependence of the structure.
Type C exogenous network features place the system in an RCEP regional scenario. The economic development level, investment freedom, and financial freedom of node attribute variables (C.1) jointly shape the trade competitiveness, ability, and attraction of countries; the geographical distance, institutional distance, and language proximity of exogenous network covariates (C.2) reconstruct network relations by affecting transaction costs and coordination difficulties, such as geographical distance increases costs and language proximity reduces barriers [26], thus affecting the relative competitiveness of countries in trade networks [15].
They simultaneously capture the synergistic effects of endogenous structure dependencies (type B) and exogenous environmental variables (type C) on network structure (type A). It avoids the separation of structure, power, and environment, and clarifies that the evolution of the RCEP agricultural trade network is a dynamic equilibrium process of continuous interaction between endogenous self-organizing logic and exogenous institutional geographical environment.
2. Research Methods and Data Sources
2.1. Network Analysis Indicators
This study utilized social network analysis to investigate the spatio-temporal evolution of agricultural product export trade within the RCEP countries. A weighted directed network G = (V, E, W) was established based on the agricultural product export trade data among the 15 RCEP member countries, with V representing individual countries, E denoting the export trade relationships between countries, and W quantifying trade intensity by export volume [27]. To assess the network’s connectivity and hierarchical structure, the overall network density, average path length, and network diameter were analyzed. Trade clustering tendencies and two-way trade dependencies were examined through the average clustering coefficient and reciprocity, while network efficiency and hierarchy characterized resource allocation efficiency and power concentration levels. Furthermore, at the node level, core trading countries and hub nodes were identified by degree centrality, proximity centrality, and betweenness centrality to analyze each country’s strategic position within the network [28,29,30]. Detailed calculation formulas and indicator explanations can be found in Table 1.

Table 1.
Description of social network analysis indicators.
2.2. Temporal Exponential Random Graph Model (TERGM)
Based on exponential family distribution and Markov chain modeling framework, the temporal exponential random graph model (TERGM) reveals the evolution mechanism of complex systems by characterizing the sequence dependence of dynamic networks [31]. Compared with static network analysis, the TERGM’s core breakthrough lies in its dynamic interaction modeling ability, which systematically deconstructs the hierarchical adaptation logic of the trade system by jointly estimating the synergy between endogenous structural effects and exogenous covariates of the network [32]. This study applies TERGMs to explore the dynamics of RCEP agricultural trade network, and its applicability stems from: TERGMs accurately capture the temporal evolution law of RCEP trade network by virtue of its Markov dependence characteristics; synchronously quantifies the interaction effect of market spontaneous force and institutional coordination by separating endogenous self-organizing parameters from exogenous environmental parameters; and generates dynamic trajectories close to reality by combining parameter estimation, dynamic simulation and model verification processes, so as to improve the dynamic interpretation and prediction ability of complex network evolution logic [33]. The model was constructed as follows:
where and represent the agricultural product trade relationship network at periods t + 1 and t, respectively; they are normalized constants with a probability between 0 and 1. represent the parameters to be estimated, where ~ and ~ denote the parameters corresponding to the variable attributes of the exporter and importer, respectively. Edges represent the quantity of directed edges in the trade network, akin to the constants in traditional regression models. Mutual, gwesp, gwdsp, gwodegree, and gwidegre represent endogenous network structural variables; timecov and memory represent temporal dynamic variables; geography, distance, regimen, and language represent exogenous covariates; GDP, iff, and ff represent node attribute variables. To improve model interpretability, Table 2 details the theoretical basis, expected sign, and temporal attributes of each parameter.
Table 2.
Descriptive analysis of TERGM model variables.
2.3. Variable Declaration
2.3.1. Explained Variables
Agricultural product trade network structure. Drawing on established methodological practices, this study sets USD 10 million as the baseline threshold based on empirical data distribution characteristics. This value accounts for 95.2% of total agricultural trade volume among RCEP members during the sample period, effectively preserving core trading relationships while filtering minor transactional noise. Setting agricultural product export value exceeding USD 10 million as 1, otherwise 0, constructing a binary network composed of 0–1 variables for agricultural product trade among RCEP member countries.
2.3.2. Explanatory Variables
(1) Basic network characteristics. Edges (edges) represent the scale and complexity of the network, reflecting the total level of trade links between member states; reciprocity (mutual) measures the proportion of two-way trade relations, reflecting the symmetry and stability of the network [15]. (2) Network structure effect. Closeness (gwesp) captures the tendency of triangular relationship formation and reflects the clustering characteristics of the network; transitivity (gwdsp) describes the path extension probability and reveals the discovery mechanism of trade opportunities; expansibility (gwodegree) describes the node out-degree distribution and reflects the outward expansion ability of trade relations; convergence (gwidegree) reflects the node in-degree distribution and represents the attraction to trade flows. (3) Time dynamic effect. Time covariation (timecov) captures linear and nonlinear time trends in network evolution and analyzes the time variability of variable influence; dynamic dependence (memory) controls the path dependence of the previous network on the current structure and identifies emerging trade opportunities. (4) Attribute variables. Economic scale (GDP), the economic aggregate of exporting and importing countries, respectively, characterizes supply capacity and market demand [34]; investment freedom (iff) reflects the openness of investment environment and affects transnational capital flows [35]; financial freedom (ff) measures the efficiency and openness of financial markets, and is related to trade payment and financing convenience. (5) Exogenous network covariates. Geographical proximity (geography), border or not, enhances regional trade facilitation [36]; geographical distance (distance), the actual distance between capitals, characterizes transport costs and trade resistance [37]; institutional distance (regimen), bilateral institutional differences, affects compatibility of trading rules [38]; language proximity (language), official language similarity, reduces communication costs and cultural barriers [39].
2.4. Data Sources and Processing
This study amalgamates global norms and industry benchmarks to delineate the statistical parameters of agricultural products. Considering the substantial variations in international statistical criteria, the research adopts the framework of the Uruguay Round Agreement on Agriculture. It incorporates the fundamental categories of Chapters 1–24 and the associated products of Chapters 40–41, 43–47, and 50–53, utilizing HS6-digit export data for agricultural products. Consequently, a classification system is formulated for primary agricultural products encompassing agriculture, forestry, animal husbandry, and fishery. This study utilizes social network analysis and employs UCINET 6, ArcGIS 10.7, and R 4.4.2 software to develop the RCEP agricultural product trade network model spanning from 2000 to 2023. The model considers 15 member countries as nodes, evaluates node connections based on bilateral export volume, examines network structure via modularization, and studies trade pattern temporal and spatial evolution using GIS technology.
Agricultural trade volume comes from the UN Comtrade; economic scale comes from the World Bank; geographical proximity, geographical distance, and linguistic proximity come from the CEPII database; institutional distance comes from the World Governance Index; investment freedom and financial freedom come from the American Heritage Foundation. In the data integration process, the core bilateral trade flow data remain intact, fundamentally ensuring the unbiased nature of the network topology calculation. Linear interpolation was used to deal with the trace missing values in node attribute data. The interpolated attribute variables are introduced as node attribute variables only, and do not participate in the construction and calculation of the network structure itself, thus ensuring that the core indicators of the network are completely derived from the actual observation data.
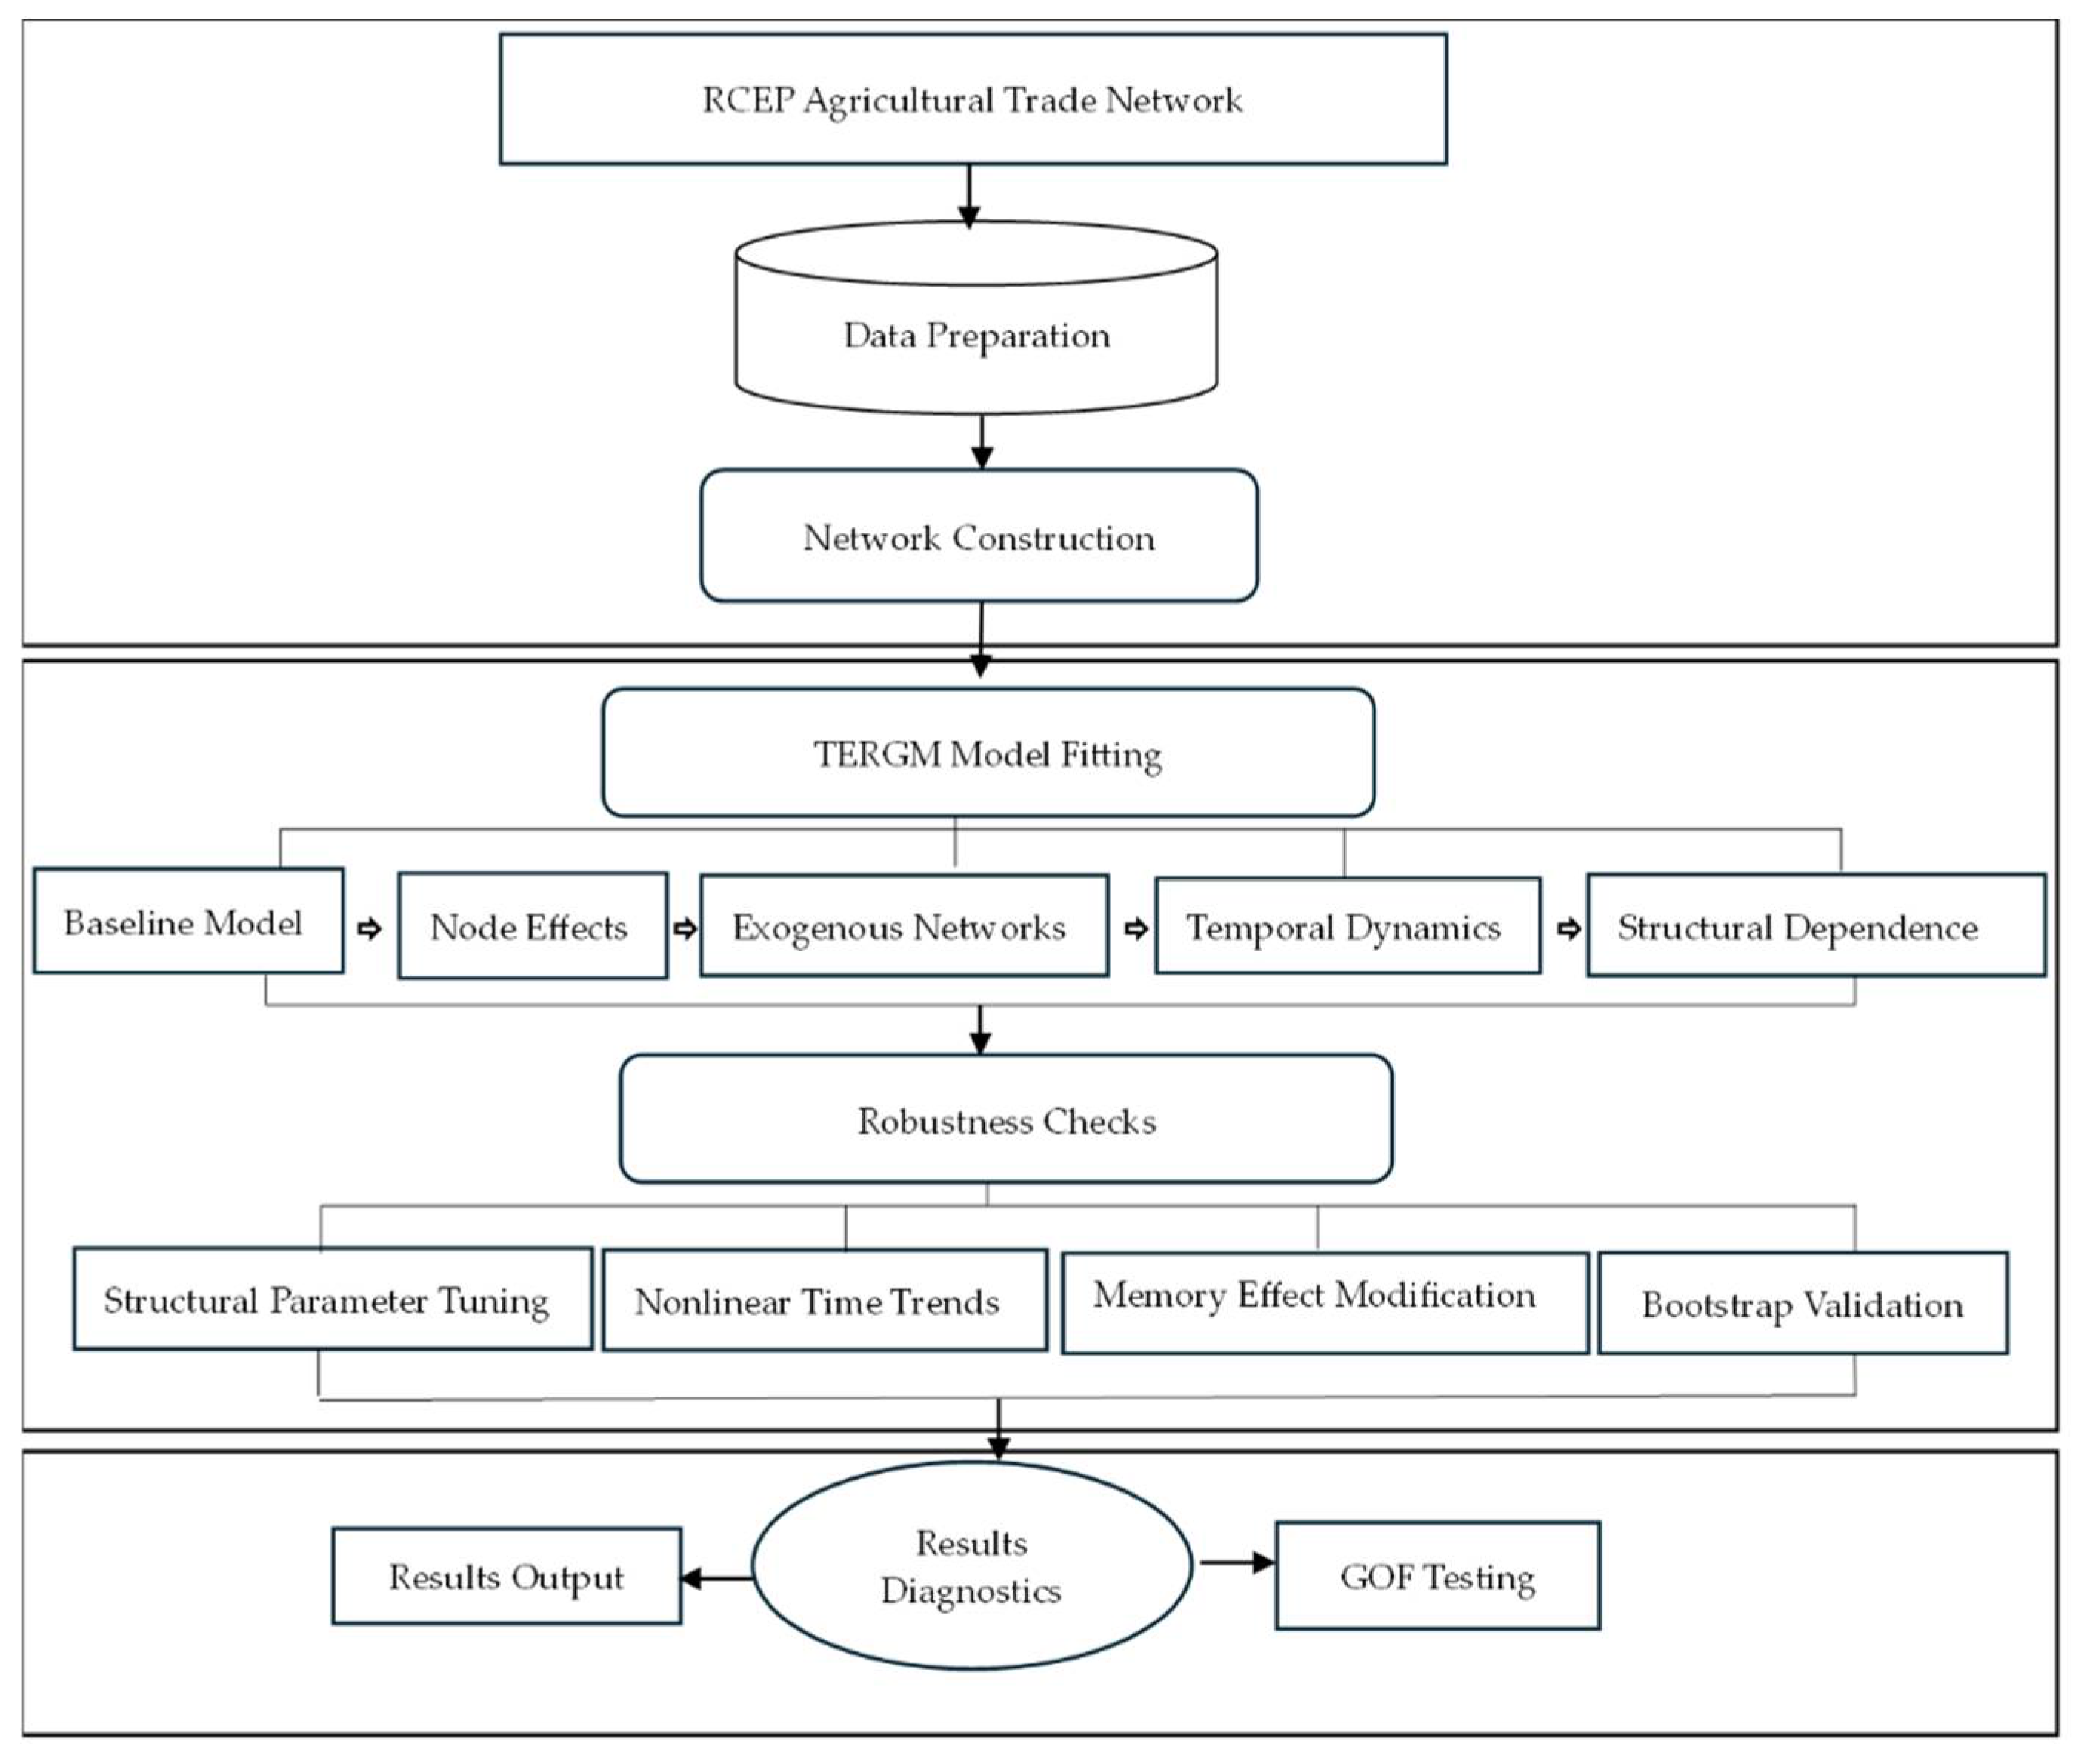
2.5. Systematic Scientific Methodology Framework and Research Flow
This study constructs a systematic scientific methodology framework, and its research process design strictly follows the complex system analysis paradigm (as shown in Figure 2), completely covering the logical chain of “data foundation, structure analysis, mechanism identification and conclusion verification”. Firstly, based on multi-source heterogeneous data fusion technology, integrating authoritative data sources such as the United Nations trade database, World Bank, and CEPII, the agricultural trade data of RCEP member countries from 2000 to 2023 are standardized and spatially processed, and a directed weighted network with countries as nodes and bilateral exports as weight sets is constructed to ensure the unbiased characterization of network topology. Secondly, social network analysis is used to deconstruct the dynamic topological attributes of the network: global indicators such as network density, clustering coefficient, and path length are calculated by UCINET to reveal the network characteristics, and node level indicators such as point degree centrality and intermediate centrality are combined to identify core hubs and edge nodes, and visual evolution analysis of trade spatial pattern is realized by ArcGIS. Furthermore, the TERGM model is used as the core analysis tool to distinguish endogenous structural effects, exogenous covariates, and independent and cooperative driving forces of node attributes through a hierarchical progressive modeling strategy, and to simultaneously quantify the interaction between the network self-organizing logic and institutional environment. Finally, the endogenetic bias is controlled by the multidimensional robustness test and temporal isolation design, and the statistical reproducibility of the model to network structure dynamics is verified based on a goodness-of-fit test.
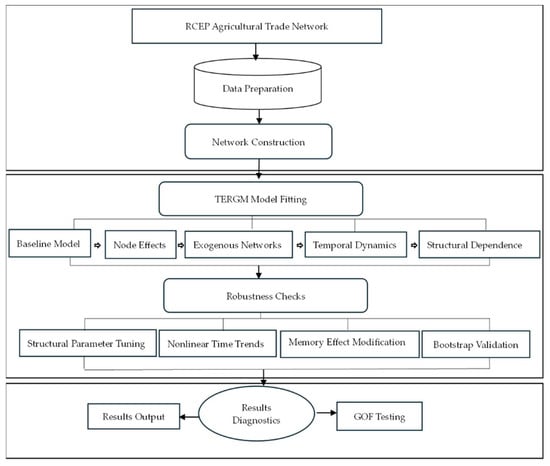
Figure 2.
Flow chart of research on evolution of agricultural trade network in RCEP countries.
3. Analysis of Trade Network Results
3.1. Time Series Feature Analysis
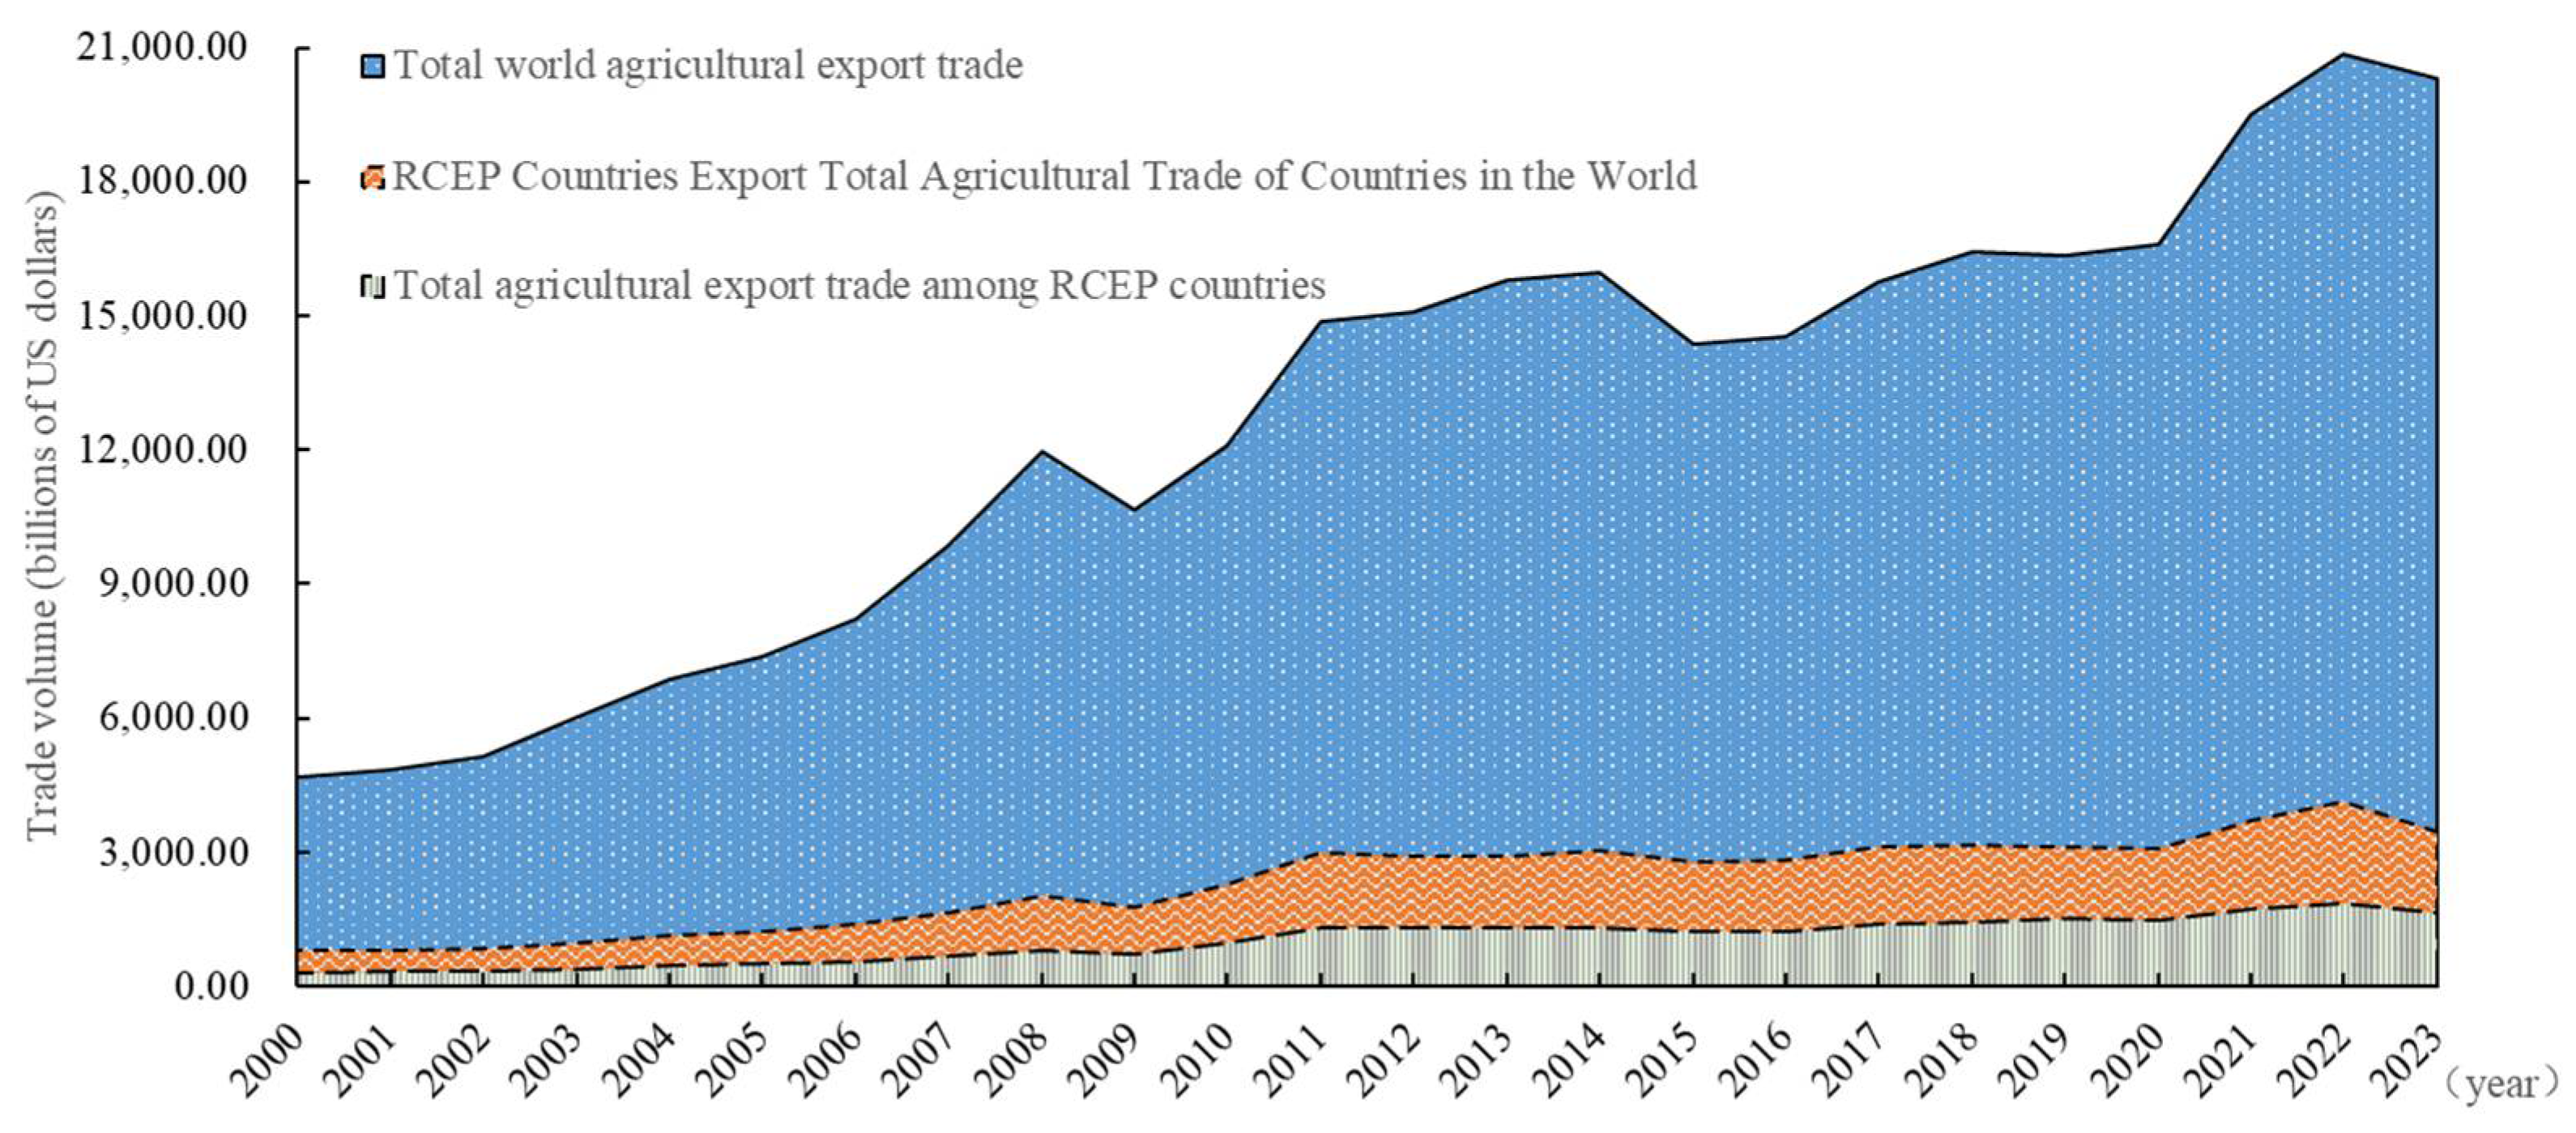
As shown in Figure 3, the total agricultural product exports of RCEP countries increased from USD 78.637 billion in 2000 to USD 414.120 billion in 2022, with an average annual growth rate of 7.1% higher than that of 6.5% of the total global agricultural product export trade, and its global share increased from 16.8% to 20.3%, highlighting the dynamic strengthening of regional comparative advantage under trade agglomeration effect. At the same time, the average annual growth rate of RCEP interregional agricultural product trade is 8.2%, exceeding its growth rate of global exports, and the dependence degree of internal trade rises from 39.8% to 46.8%, indicating that the RCEP regional agreement effectively promotes supply chain coordination and trade facilitation. The decline in overall agricultural product export trade in 2023 may be related to geo-economic uncertainty.

Figure 3.
Analysis chart of global proportion of agricultural products exports of RCEP member countries. Data source: UN Comtrade.
3.2. Analysis of the Whole Characteristics of Networks
In order to reveal the structural characteristics, functional attributes and dynamics of agricultural products trade network in RCEP region from different dimensions, and understand the information flow, resource allocation, stability, and evolution law of the network, this study uses UCINET 6 software to carry out quantitative analysis from node characteristic indicators such as network density, average path length, network diameter, average clustering coefficient, network hierarchy, network relationship number, network efficiency, and reciprocity. See Table 3 for the results.
Table 3.
Descriptive statistical characteristics of agricultural products trade network in RCEP countries.
(1) “Small-world” network compaction and network robustness. The network density increased gradually from 0.5762 in 2000 to 0.7524 in 2020. Although it decreased to 0.619 in 2023, it remained relatively high, indicating the growing intraregional trade connections. The number of network relationships rose from 121 to 158, illustrating the ongoing deepening and expansion of regional trade ties. Network efficiency declined from 0.8381 in 2015 to 0.6762 in 2023, primarily due to the rise in redundant paths, which notably enhanced network robustness. In addition, the average path length is shortened from 1.214 to 1.156, and the network diameter is stable at 2, which further verifies the “small world” attribute of the trade network and shows that it has the efficiency and robustness of complex systems.
(2) Regional economic integration and strengthening of “core-periphery” characteristics. The average clustering coefficient of the agricultural trade network increased gradually from 0.826 in 2000 to 0.873 in 2020, illustrating the “small-world” characteristics of the regional trade network. The significant decrease in the clustering coefficient in 2023 suggests a shift in the trade network structure from being highly localized to a more globally integrated one. This transformation may have been influenced by the optimization of regional trade regulations and adjustments in the supply chain following the implementation of the Regional Comprehensive Economic Partnership (RCEP). Additionally, the network hierarchy rose from 0.598 to 0.659, indicating a strengthening of the “core-edge” structure within the trade network. With its resource allocation ability and trade radiation effect, the core countries continue to dominate the evolution direction of the whole network, while the marginal countries show increasing dependence, making the hierarchical division of labor system of the whole trade network increasingly clear, reflecting the hierarchical system characteristics of resource allocation.
(3) Reciprocity deepens a two-way dependence pattern that is stable. The reciprocity of agricultural product export trade within the RCEP has generally exhibited a consistent upward trend. Despite a notable decrease in 2023 to 0.7385, the long-term trajectory has consistently remained at a high level above 0.7. This trend signifies the establishment of significant interdependence within the current agricultural product trade system in the RCEP region, where trade interactions among nations demonstrate a clear bilateral reliance pattern. This reciprocal trade dynamic showcases robust resilience, indicating that short-term market fluctuations or policy adjustments are unlikely to fundamentally disrupt the existing cooperative equilibrium among nations [40]. On the contrary, this two-way dependence provides an institutional guarantee for the stable development of agricultural trade and helps countries to jointly cope with possible market risks and uncertainties.
3.3. Dynamic Network Analysis
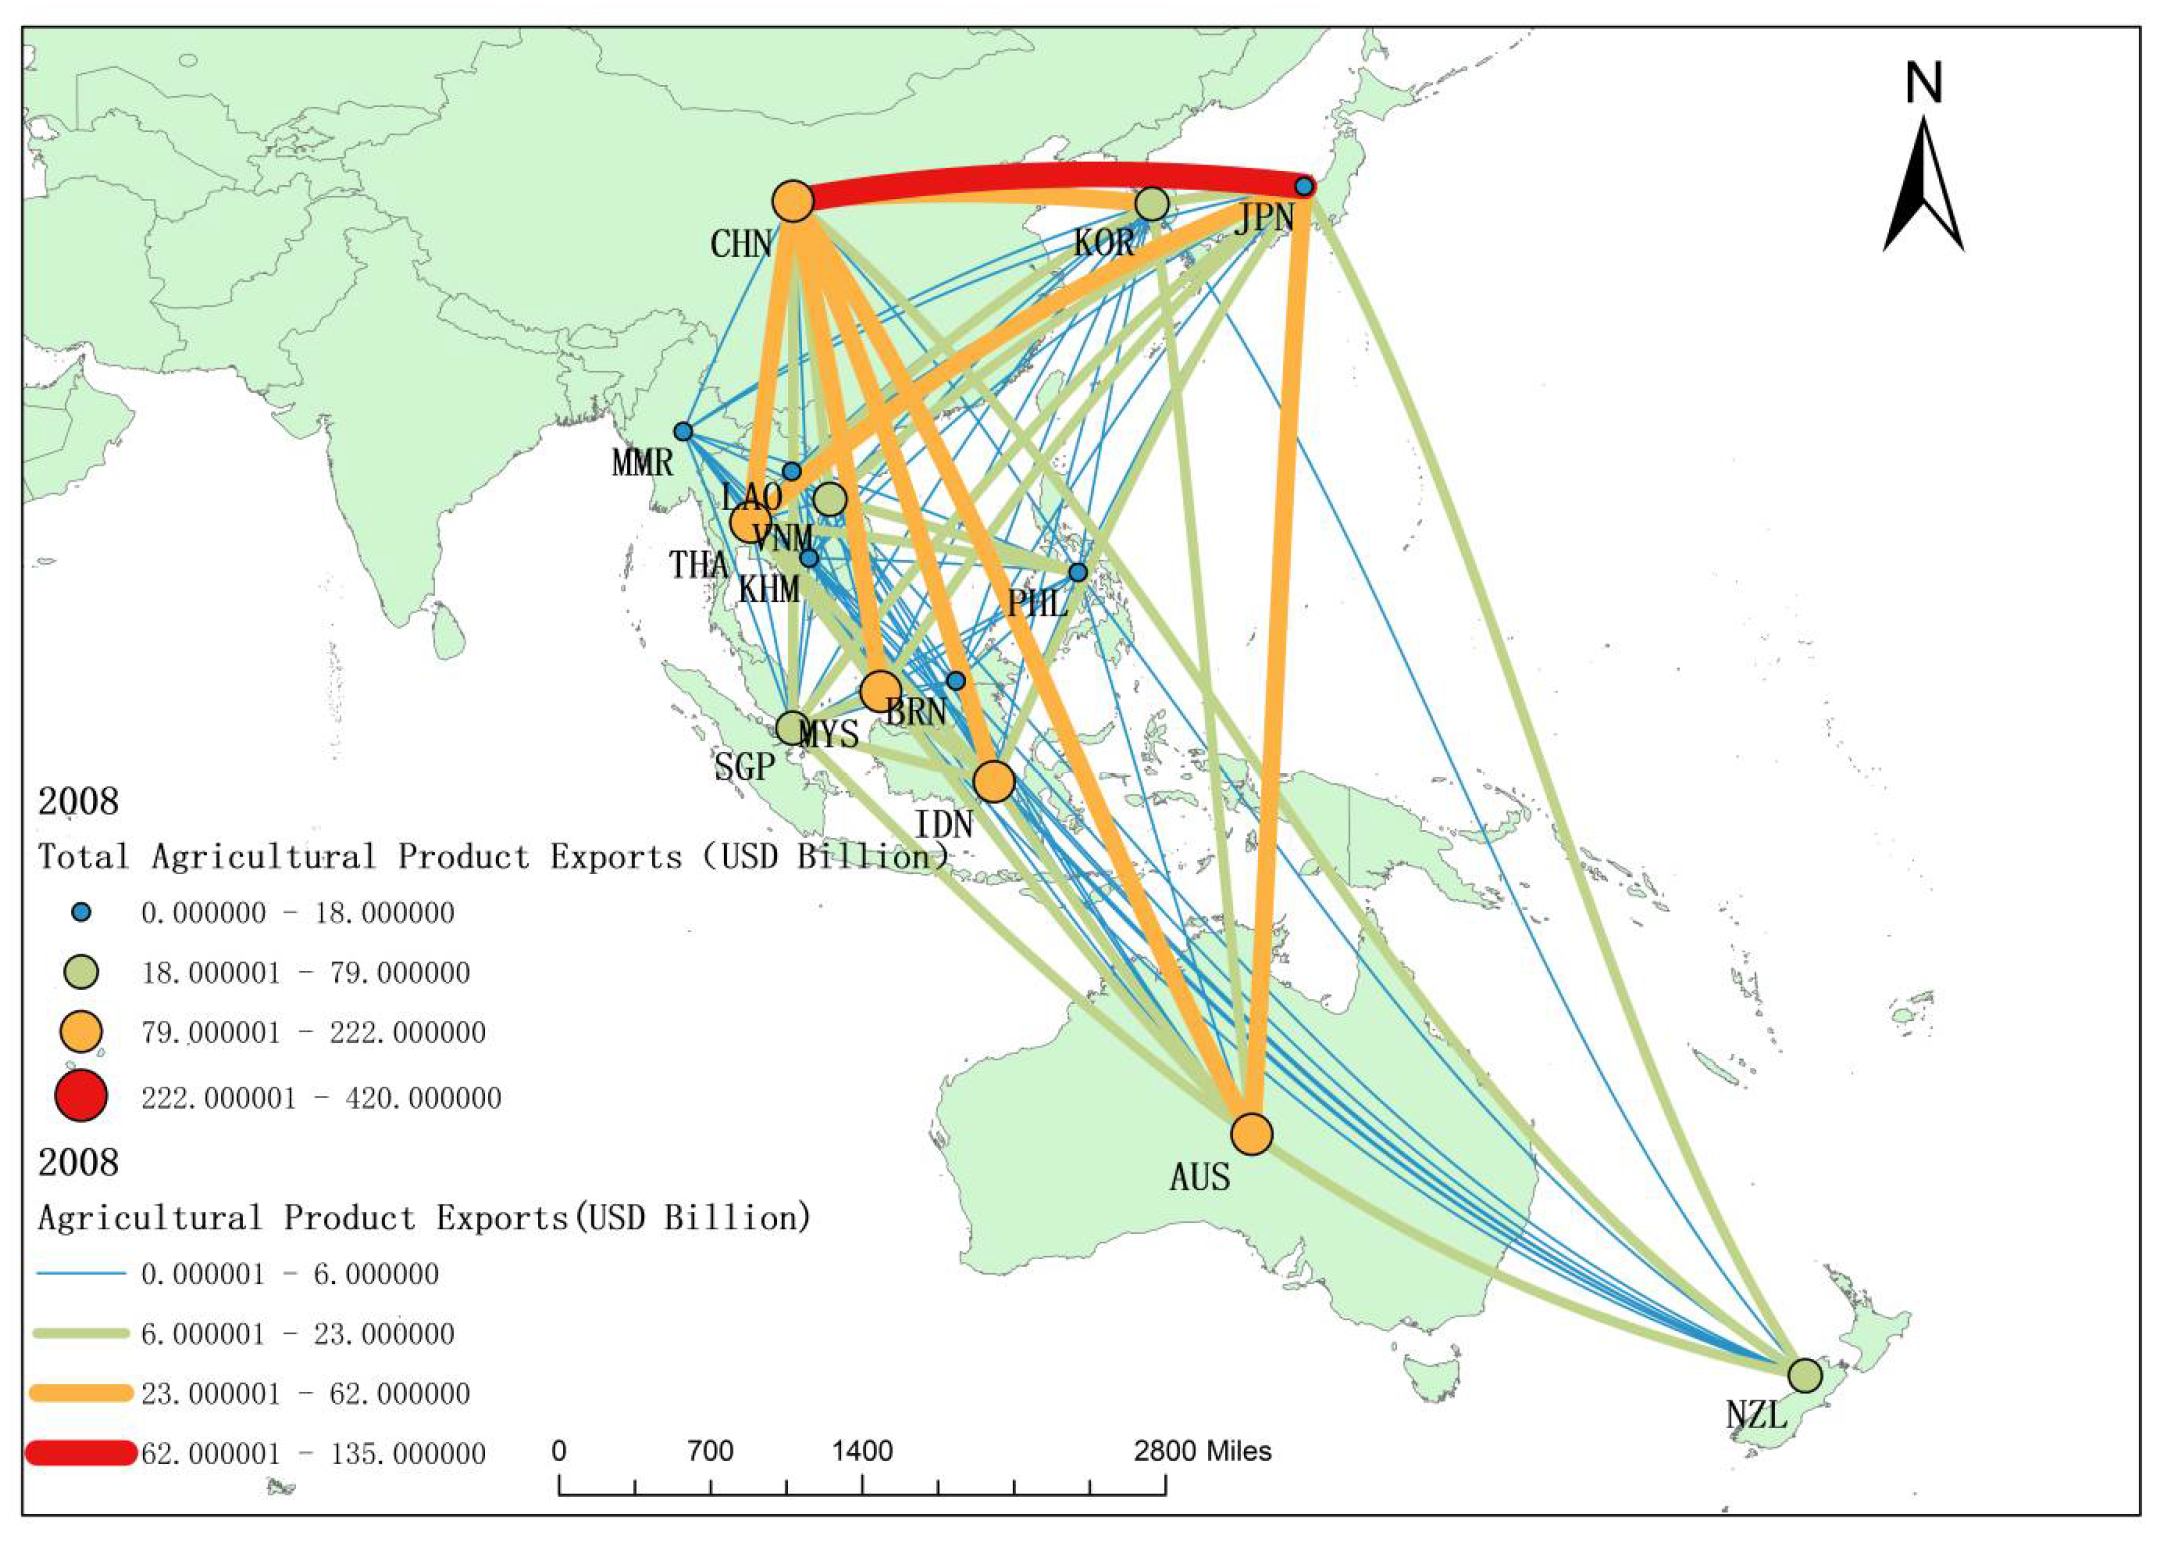
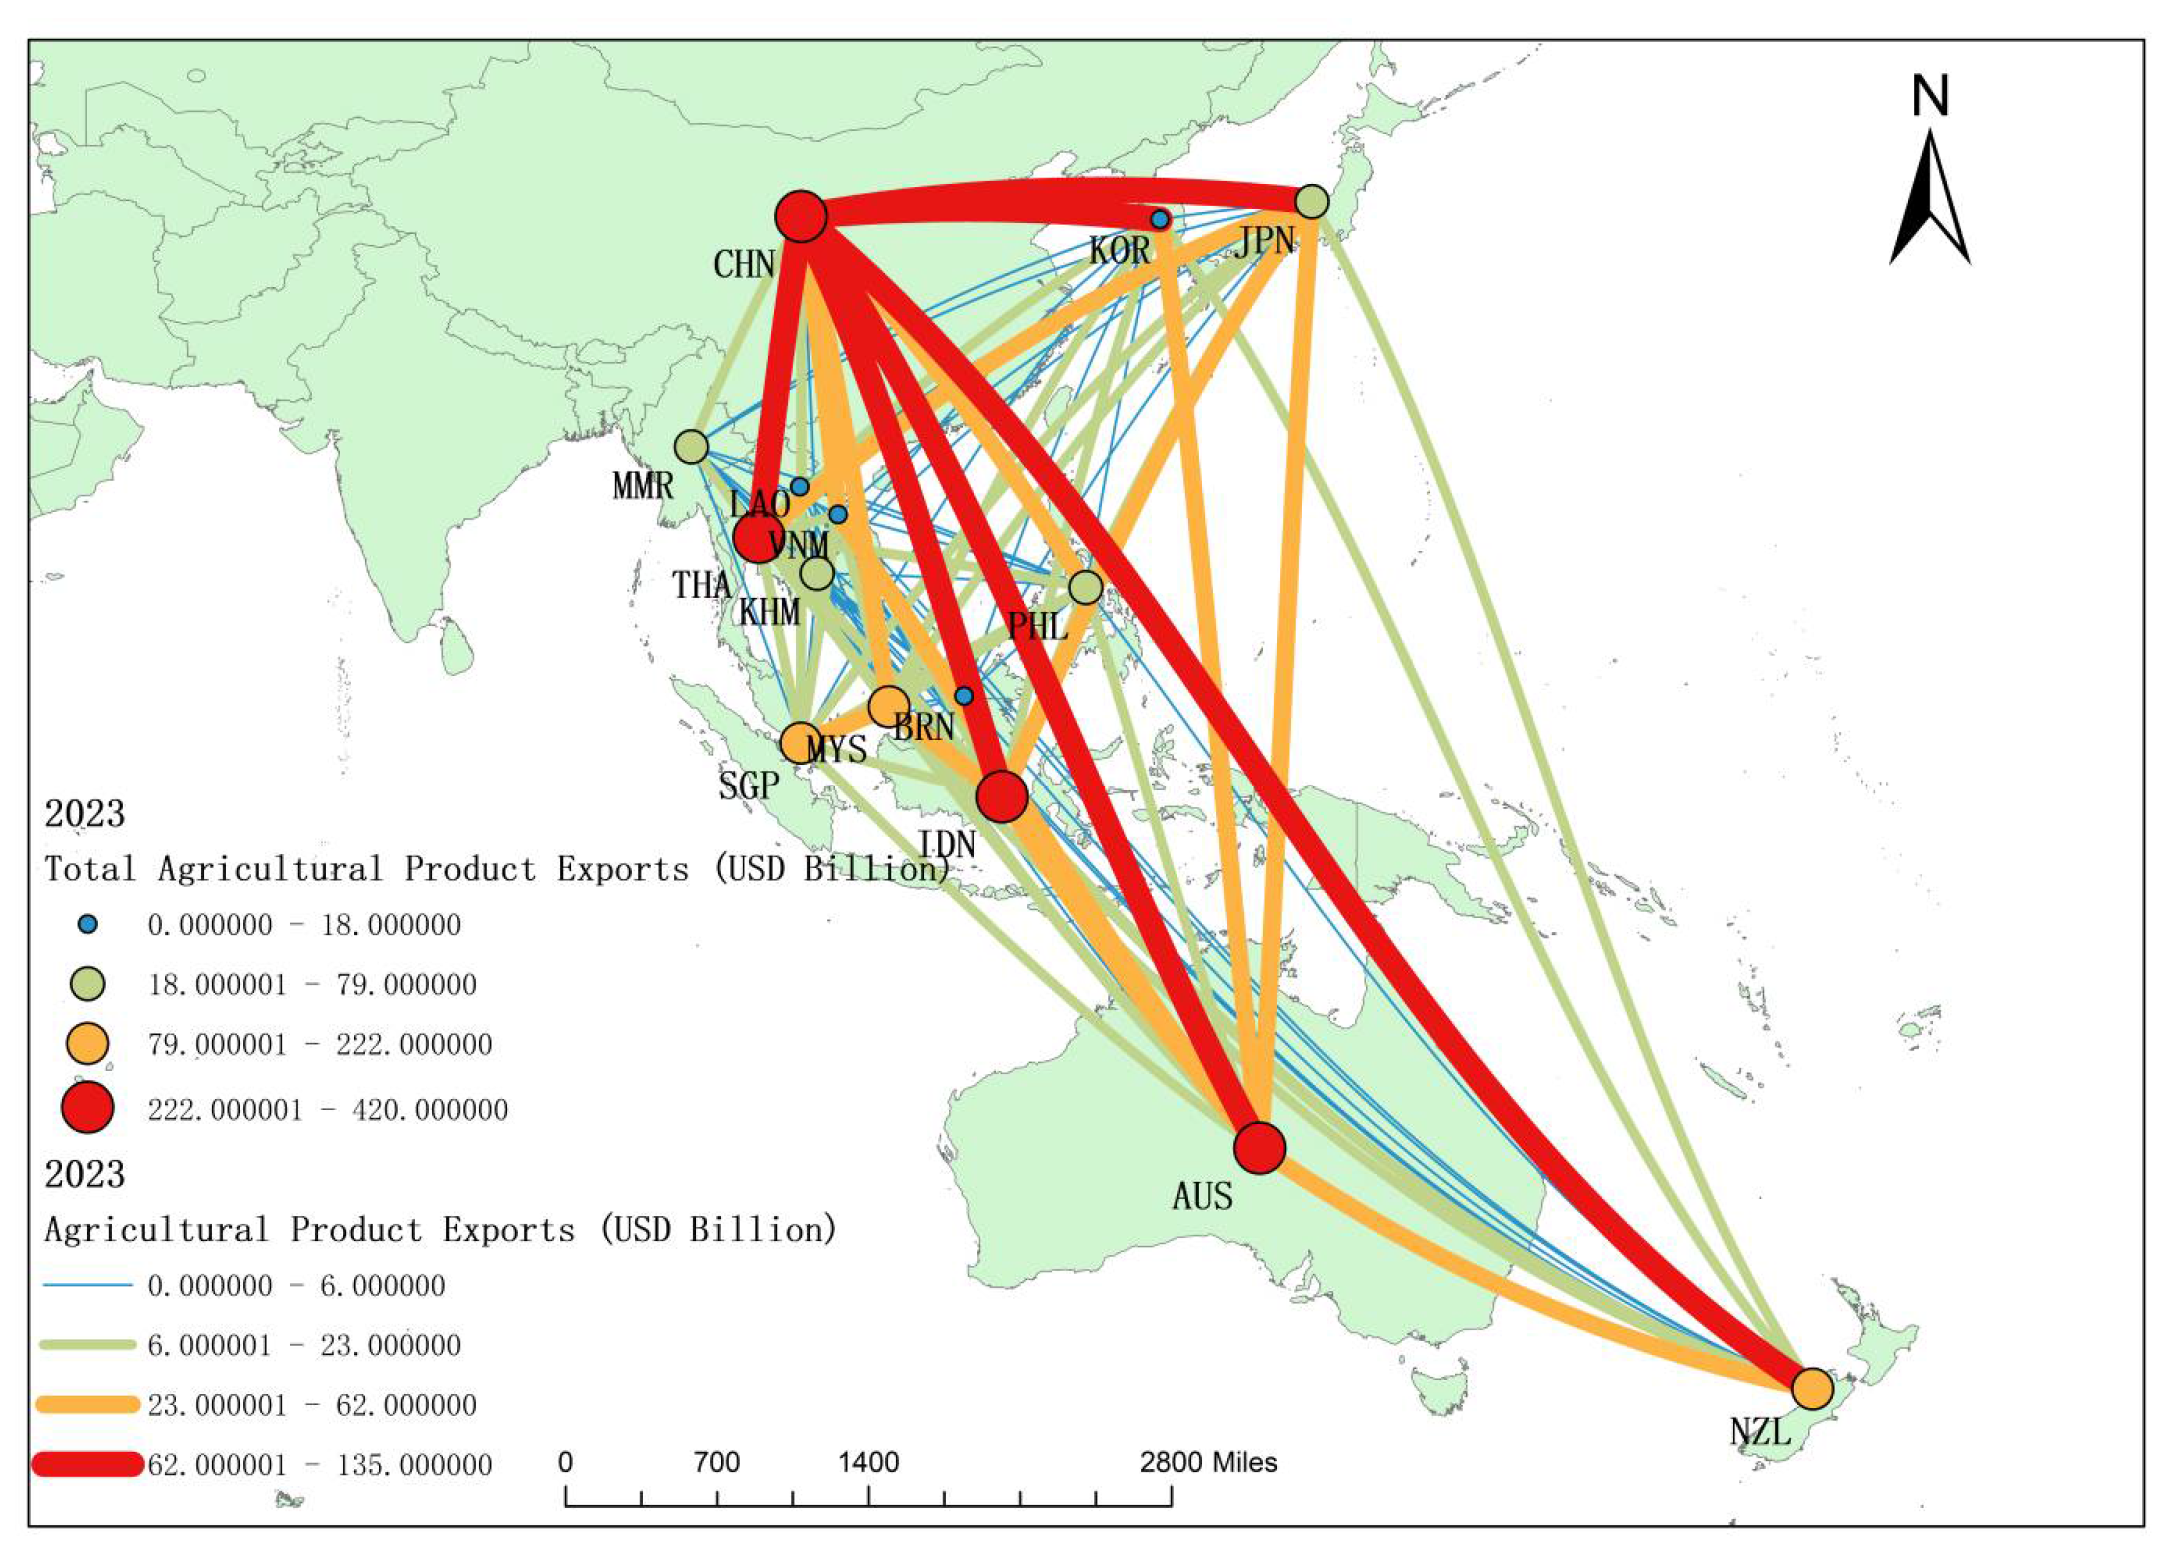
Using ArcGIS 10.7 visualization technology, we generated weighted flow maps of RCEP agricultural product trade for the years 2000, 2008, 2016, and 2023, presented in Figure 4, Figure 5, Figure 6 and Figure 7 respectively. From 2000 to 2023, the total agricultural product exports in the RCEP region increased from USD 38 billion to USD 175 billion, with a significant annual growth rate. Among them, China and Thailand have the most prominent growth, from USD 9.12 billion and USD 5.47 billion to USD 41.66 billion and USD 32.31 billion, respectively, an increase of 4.6 times and 5.9 times. At the same time, exports from ASEAN countries increased, reflecting a shift in the regional economic center of gravity towards Southeast Asia. The accelerated growth of exports after 2016 may be closely related to the RCEP negotiation process, and the trade liberalization policy has significantly reduced intra-regional trade barriers.
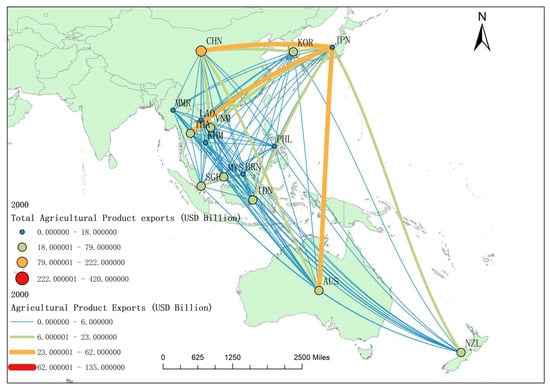
Figure 4.
Flow chart of RCEP national agricultural export trade network in 2000.

Figure 5.
Flow chart of RCEP national agricultural export trade network in 2008.
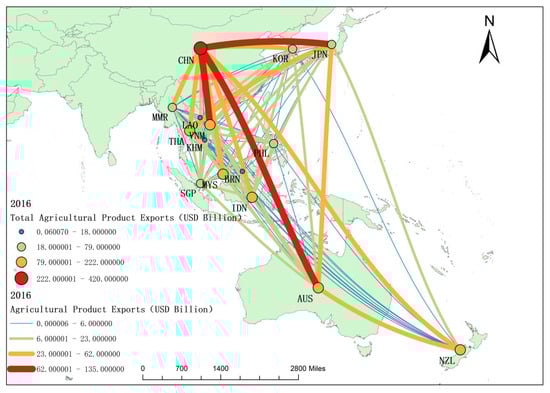
Figure 6.
Flow chart of RCEP national agricultural export trade network in 2016.
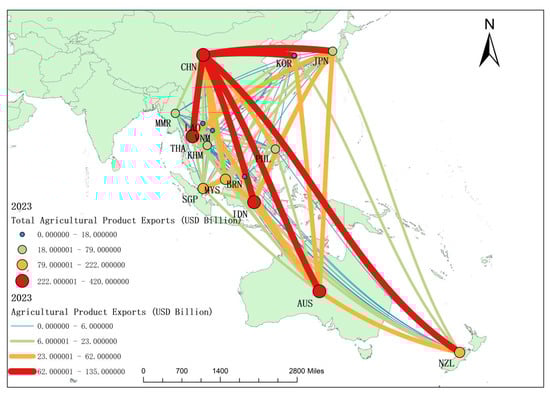
Figure 7.
Flow chart of RCEP national agricultural export trade network in 2023.
In terms of the pattern of core exporting countries, it can be seen from Figure 7 that in 2023, China’s agricultural exports amounted to USD 41.66 billion, becoming the largest exporter in the region, of which exports to ASEAN accounted for 40% of its total exports in the region. At the same time, the export volume of ASEAN countries has increased significantly, accounting for 47% in 2023, becoming a new engine of regional trade. However, Japan and South Korea’s dependence on Australia and New Zealand declined. In 2000, Japan and South Korea accounted for 29% of exports within Australia and New Zealand, and dropped to 23% in 2023. China replaced Japan and South Korea as Australia and New Zealand’s largest export markets. In addition, intra-ASEAN trade has increased. The two-way trade volume between Thailand and Malaysia and Indonesia–Malaysia will reach USD 2.21 billion and USD 2.32 billion, respectively, in 2023, and the South–South trade network will become closer.
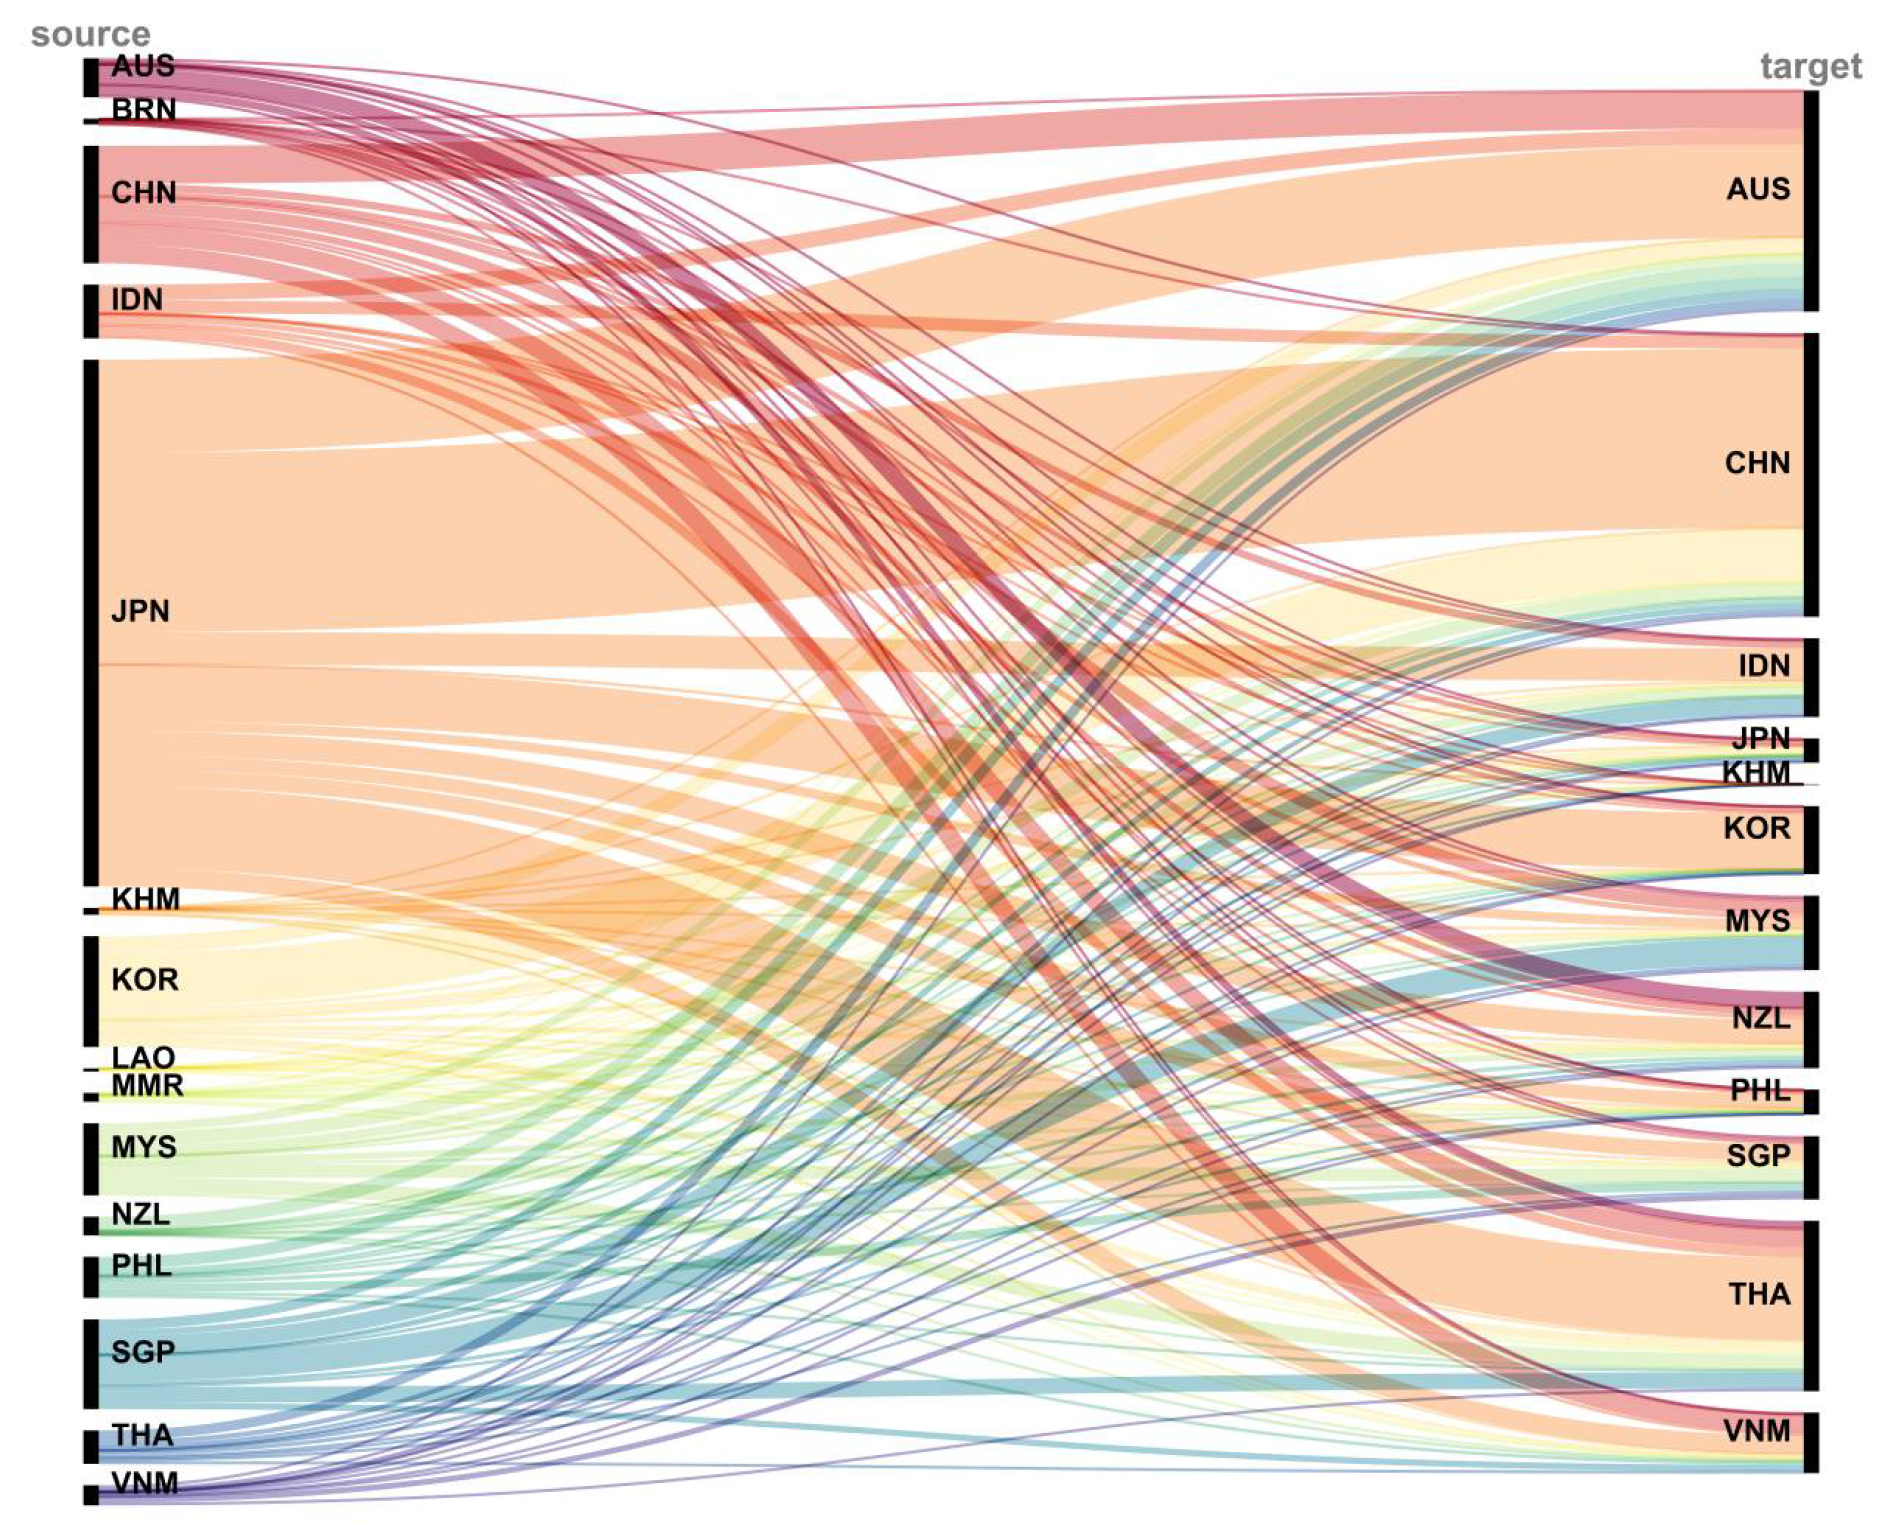
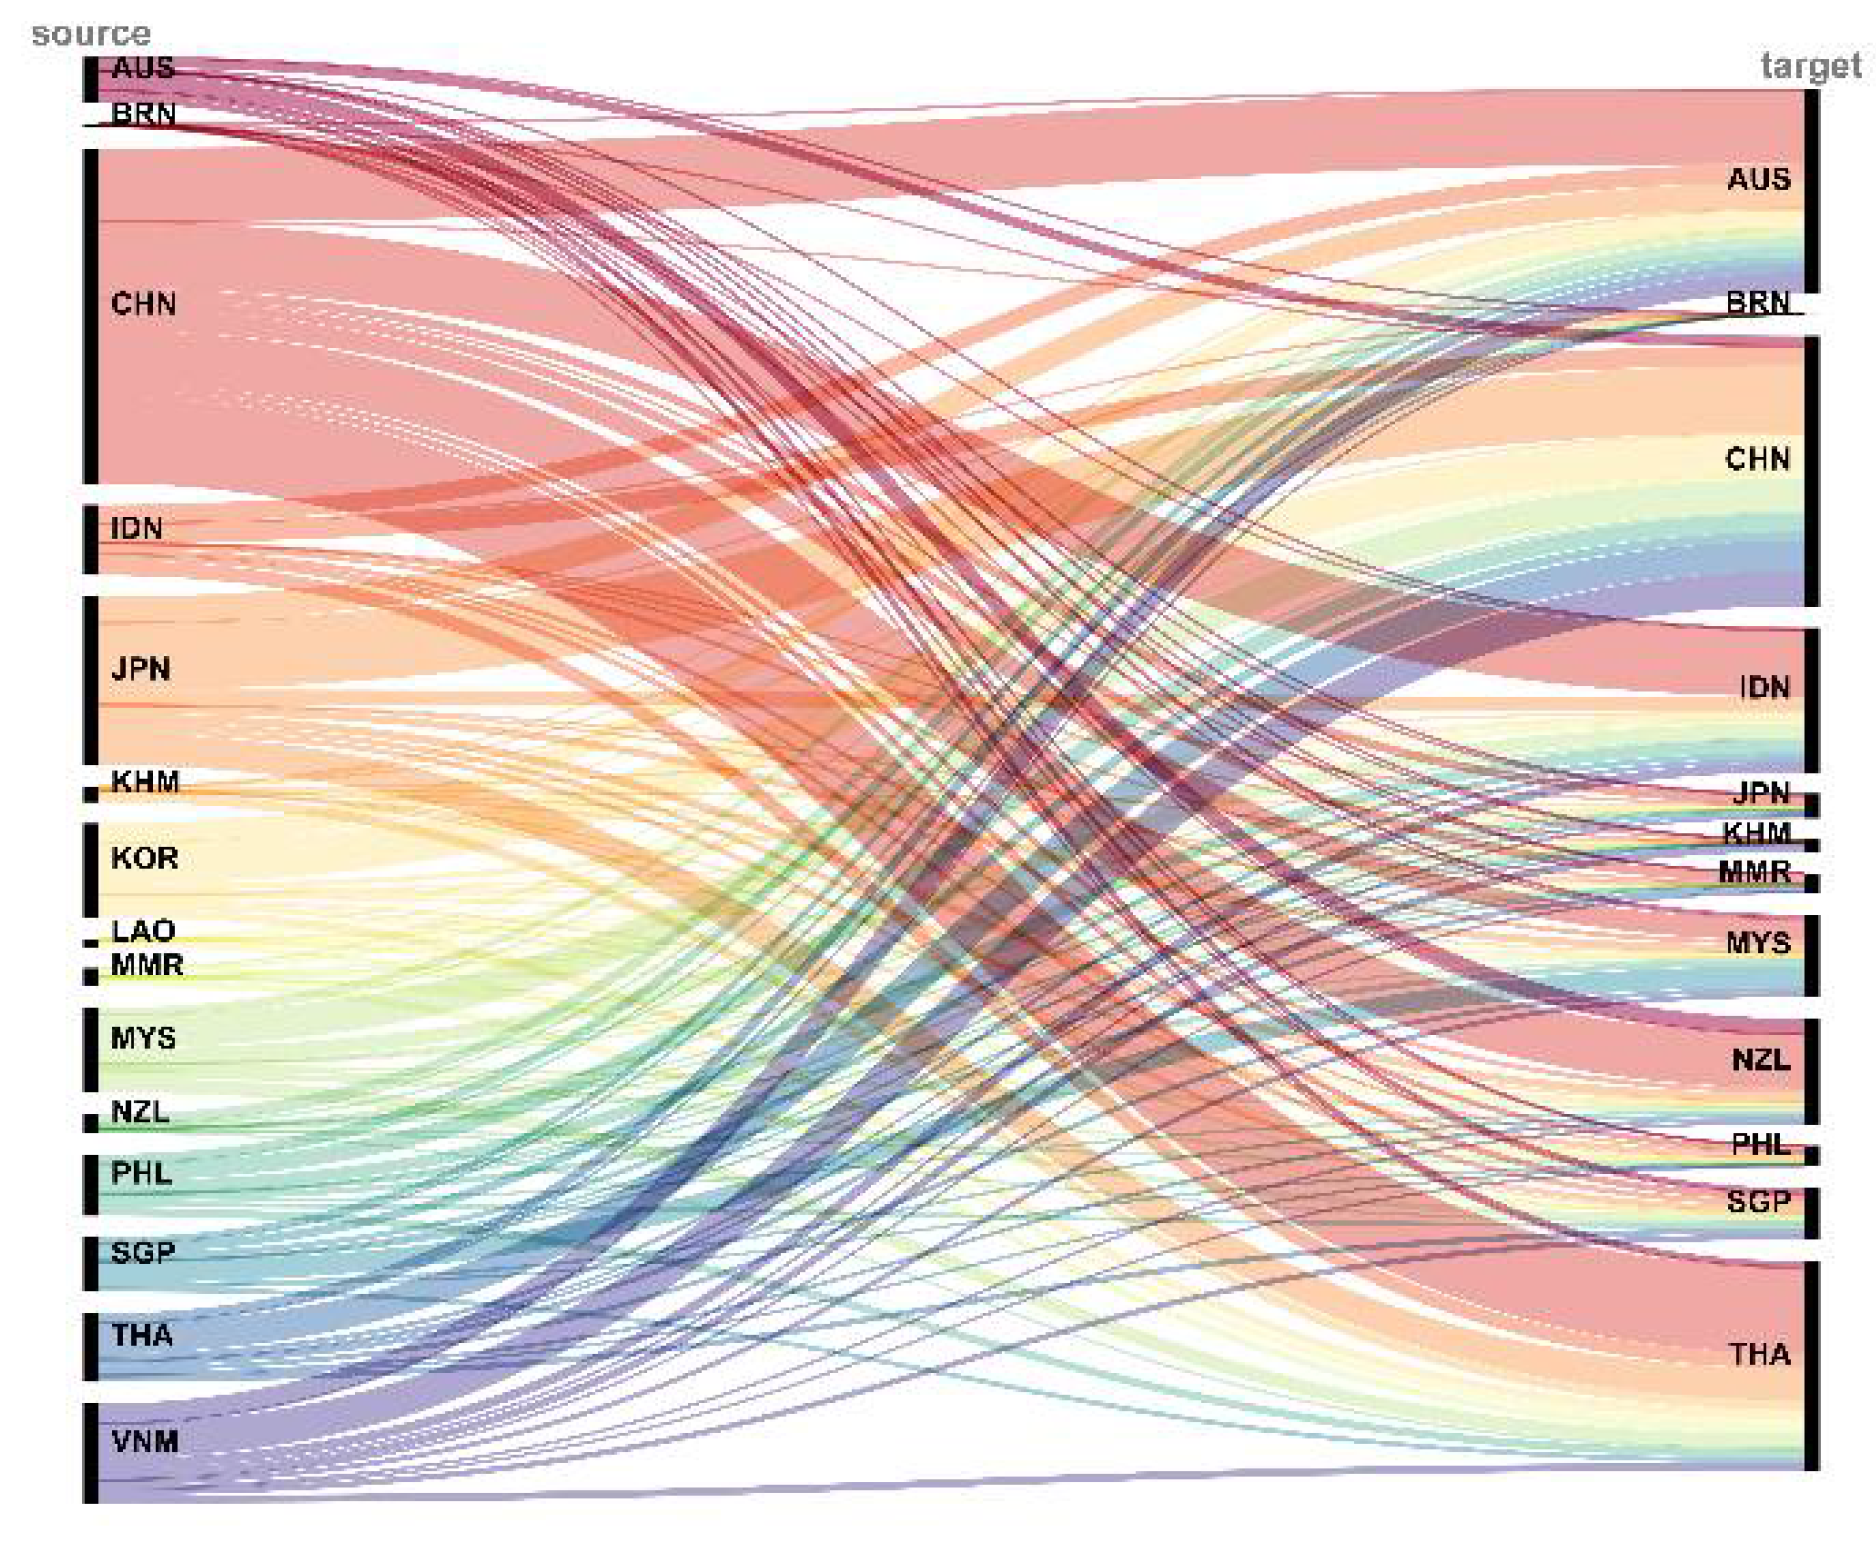
From Figure 8 and Figure 9, the structural evolution of the East Asian regional trade pattern from 2000 to 2023 can be intuitively found from the Sankey Diagram of the RCEP agricultural trade. The mapping of trade flow width to flow direction clearly shows that China has transformed from a “regional player” to a “super hub.” This is reflected in the significant expansion of its output stream width, which is visually dominant by 2023, in sharp contrast to its much narrower stream width than Japan and South Korea in 2000. At the same time, the growth of intra-ASEAN trade flow width visually presents the gradual formation of a “secondary core”.

Figure 8.
2000 RCEP Agricultural Trade Sankey Diagram. Note: Color coding consistent with figure below, each color represents a specific trading entity.
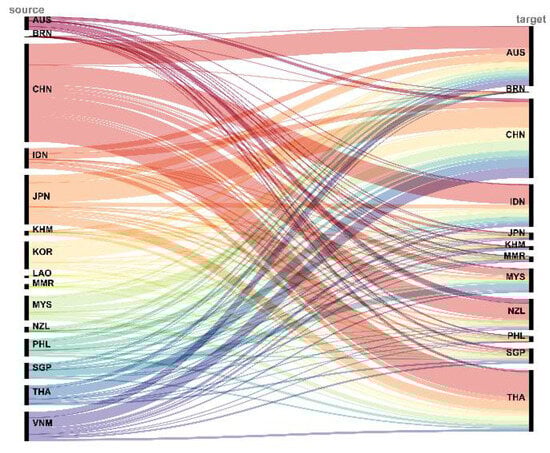
Figure 9.
2023 RCEP Agricultural Trade Sankey Diagram.
3.4. Network Centrality Analysis
In social network analysis, nodes are the basic units of the network, and their functions are defined not only by their own attributes but also by their topological positions and interaction patterns in the network. To analyze the structural position of RCEP countries in the agricultural trade network systematically. In this study, we comprehensively use point-degree centrality to quantify the direct trade influence of nodes; proximity centrality to reflect the proximity of nodes to other nodes; and intermediation centrality to measure the ability of nodes to act as intermediaries for information or resource transmission in the network. The status and role of RCEP countries in the agricultural trade network are comprehensively evaluated through three indicators. The results are shown in Table 4.
Table 4.
RCEP national agricultural products trade network centrality index ranks in the top five countries.
Degree centrality analysis clearly shows the dynamic evolution of the regional agricultural trade pattern. China has always occupied the first place in terms of the out-degree, highlighting its stable position as a core export hub in the region, indicating that it has established extensive and stable direct trade links with almost all countries in the region. At the same time, China’s in-degree has been on the rise since 2010 and surpassed Japan to rank first in 2015. This shift can be mainly attributed to the huge demand growth and openness of the domestic market, which has driven the significant expansion of the import scale. In contrast, Australia, a traditional exporter, fell from second place in 2000 to third place in 2023, while New Zealand fluctuated in the top five, reflecting the structural reshaping of the original trade flows by the rise of emerging export powers in the region, diluting its relative export influence. In this context, the status of ASEAN countries has been enhanced particularly significantly: Thailand’s export ranking has climbed from third to second, becoming the second largest export hub in the region, with the enhancement of its agricultural export competitiveness and active trade network expansion strategy playing a key role; Vietnam ranked among the top five for the first time in 2015, marking the rapid expansion of its export network and the increasingly prominent role of regional trade. These changes jointly confirm the dynamic adjustment of RCEP intra-regional trade patterns and the deepening of regional economic integration.
Proximity centrality analysis further reveals China’s pivotal position in regional trade networks. With dense direct and efficient indirect connections built by its huge economic volume and trade scale, China has been firmly in the first place since 2005, becoming the core hub of the network. Japan, on the other hand, was overtaken by China in 2010 due to its weakening relative advantage in economic aggregate and trade scale. It is noteworthy that ASEAN countries have improved synergistically on this indicator; Thailand has continued to rise since 2015, and Vietnam has entered the top five for the first time. This is mainly due to its superior geographical location, significant improvement of transportation, logistics, and information infrastructure in the superimposed region, which effectively plays an efficient transit function connecting Southeast Asia and external regions, thus shortening the average path length of the overall network.
Betweenness centrality analysis reinforces the key role of China in regional trade flows. Relying on its huge trade volume and central position of the network, China has always occupied the first place in betweenness centrality from 2000 to 2023, which not only consolidated its central position in the region, but also demonstrated its importance in the trade pattern. The functions of regional sub-center nodes are significantly differentiated. Thailand, relying on its unique location advantage connecting the Indochina Peninsula with other ASEAN members, has gradually grown into a “key bridge” in the region from the fourth place to the second place; Malaysia and Australia have been ranked in the top five for a long time, playing the “stable role” of Southeast Asia’s internal resource integration center and trans-Pacific trade transit station, respectively; Vietnam entered the top five of betweenness centrality for the first time in 2015, which benefited from its deep embedding in China and ASEAN markets, and a large number of trade flows needed to transit or be connected through it, indicating that its future function as a regional “bridge” has the potential to be further strengthened and is expected to promote the coordinated development of regional trade networks.
4. Analysis of Trade Network Impact Mechanism
4.1. Analysis of Empirical Results
Based on the agricultural product export trade relationship network data of longitudinal RCEP countries from 2000 to 2023, this study uses the TERGM program package in R language to carry out TERGM empirical analysis [41], and the results are shown in Table 5. In order to verify the reliability of the empirical results, the variance inflation factor (VIF) test was used to evaluate the robustness of the model. All variables met the threshold criterion of VIF < 10, effectively eliminating the potential multicollinearity interference between exogenous variables and node attributes. A hierarchical and progressive approach was adopted in model construction. First, a basic model 1 with edges (edges) and reciprocity (mutual) was established. Then, node attribute variables, exogenous network variables, time effect variables, dynamic dependent variables, and endogenous structural variables were included in order through the gradual expansion of model 2 to module 5. The staged modeling design system reveals the topological structure characteristics of the agricultural product export trade network in the RCEP region, and effectively distinguishes the interaction between endogenous dynamic mechanisms and exogenous driving factors in the evolution process of the network through the progressive introduction of variable combinations [42].
Table 5.
TERGM regression results of trade network.
Based on the regression result analysis from Model 1 to Model 5 (Table 5), the estimated coefficients of the directed edges (edges) show statistically significant negative effects in all models, indicating that the topological structure of the agricultural product trade network among RCEP countries has significant non-random characteristics, and the formation of their relationships is constrained by a specific selection mechanism. It further highlights the necessity of systematically analyzing the endogenous preferences and exogenous driving factors of the trade network. Reciprocity (mutual), as the essential topological feature of complex trade networks, is the equilibrium representation of the evolution of international economic and trade relations and the measurement benchmark for the sustainability of bilateral cooperation. Therefore, in this study, reciprocity was controlled in all models. The results showed that the reciprocity coefficients were significantly positive, indicating that agricultural product trade within the RCEP region has significant two-way interaction, that is, the formation of bilateral trade relations highly depends on the “mutual export” model [43]. This model reflects the inherent stability of the trade network within the region, and at the same time lays the foundation for regional cooperation, becoming an important driving force for deepening economic and trade relations among countries.
In the node attributes analysis, economic scale (GDP) becomes the structural core driving force to promote network expansion through a “supply-demand” two-way strengthening effect, while liberalization policy adjusts resource allocation efficiency through an asymmetric effect and affects network dynamic evolution. In the sender effect, economic development level (GDP) and financial freedom (ff) have positive effects on agricultural product export trade. Economic power is the core export hub by virtue of scale effect, and its production capacity and market radiation force are the main driving forces for the expansion of trade network; financial liberalization (ff) strengthens agricultural product export capacity by reducing transaction costs and risk premium, while excessive investment liberalization (iff) may weaken the effectiveness of agricultural protection policies and inhibit export competitiveness, reflecting the double-edged effect of liberalization policies at the export end. In the receiver effect, the consumption upgrading of high-income economies continues to drive import demand, forming the basis of network stability, but the policy freedom of importing countries has a limited effect on trade gravity, indicating that the rigid characteristics of agricultural demand dominate at the import end [44].
In exogenous network analysis, geographical distance (distance) has a strong negative effect on the formation and maintenance of trade relations, which confirms the cost constraint logic of the traditional trade gravity model. Transportation costs and timeliness loss significantly inhibit the establishment of long-distance trade relations, highlighting the high sensitivity of agricultural trade to logistics efficiency. In contrast, the positive effect of geographical proximity (geography) reveals the principle of “neighbor first” in regional supply chains, where spatially close countries can form more stable and efficient supply and demand networks by reducing trade uncertainty and sharing infrastructure. Language (language) homogeneity exhibits a high elasticity coefficient, which further indicates that cultural identity, as informal institutional capital, superlinearly promotes the expansion of trade networks by reducing information asymmetry and enhancing contract enforcement efficiency, further emphasizing the implicit value of cultural factors in regional trade, especially in the process of building trust and cooperation mechanisms. However, the impact of institutional distance (regimen) on trade relations is not significant, which may be because under the framework of RCEP, countries partially offset the obstacles of institutional differences to trade through cooperation and coordination, indicating that regional integration mechanisms can alleviate the negative impact of institutional heterogeneity on trade networks to a certain extent and provide institutional guarantees for the stable development of intra-regional trade [45].
Endogenous network analysis. The strong positive effect of network expansibility (gwodegree) indicates that trade relations show a continuous extensional growth, reflecting the accelerated embedding of emerging trade partners in the process of regional market integration. The significant negative parameters of time covariance (timecov) and dynamic network dependency (memory) imply that there is anti-coordinated path dependence in network evolution. On the one hand, the self-strengthening mechanism of trade relations is gradually weakened, and on the other hand, the inhibition of new connection formation by historical structure is continuously strengthened. The negative synergistic effect between convergence (gwidegree) and transitivity (gwesp) further indicates that the network evolution exhibits a ‘hierarchical multi-hub’ characteristic. Under this characteristic, RCEP regional agricultural trade relationships have gradually transitioned from a traditional central-agglomeration pattern toward multi-polar diffusion development within a ‘core-periphery’ structure. This transformation optimizes hierarchical division-of-labor efficiency and significantly enhances the robustness of the overall system. The significant negativity of closure (gwdsp) indicates a relative scarcity of cyclic closure structures within the trade network. This implies that relationship formation favors unidirectional extension or localized expansion over constructing stable closed configurations. This characteristic reveals an underlying trend wherein agricultural trade under the RCEP framework is transcending sub-regional barriers and transitioning toward a pan-regional integrated network.
4.2. Robust Test
In order to ensure the reliability, robustness, and credibility of the study results, this study assessed the adaptability of the model through a multi-dimensional sensitivity test system. See Table 6 for details. At the model structure level, after adjusting the network topology parameters of model 6, the significance and coefficient direction of the core variables did not fluctuate significantly, indicating that the network structure setting had limited influence on the results. When quadratic terms for the time covariate were introduced into Model 7, the regression coefficients for the primary variable remained stable, confirming the validity of the linear assumption for time effects over the range of available data. According to the dynamic characteristics of trade networks, Model 8 adjusts the network dynamic dependence parameters and finds that the estimation error of the historical dependence coefficient is always lower than the theoretical threshold, which verifies the robust characterization of the dynamic memory decay mechanism of Model 8. In addition, Model 9 replaced the traditional MCMC algorithm with Bootstrap resampling, and the fluctuation range of the standard deviation of the core variable was significantly lower than the significance threshold, eliminating systematic bias caused by the dependence of the estimation method. These four models confirm the statistical consistency of the benchmark model under different settings and strengthen the empirical basis and theoretical explanation of the evolution mechanism of the RCEP agricultural trade network.
Table 6.
Robust test of TERGM regression results.
4.3. Endogeneity Issues
Potential bidirectional causality may exist between trade network evolution and nodal economic attributes, constituting latent endogeneity issues. Specifically, on one hand, economic scale expansion can drive the formation and reinforcement of trade linkages by enhancing supply capacity and expanding market demand. On the other hand, deep embeddedness within trade networks may conversely exert feedback effects on economic growth through facilitating technology spillovers and optimizing resource allocation. Failure to effectively control such endogeneity would introduce bias into model estimation results.
To mitigate endogeneity bias arising from reverse causality, this study employs a temporal isolation design. Within the baseline temporal exponential random graph model (TERGM), all core economic attribute explanatory variables—including economic scale (GDP), investment freedom index (iff), and financial freedom index (ff)—are replaced with their one-period lagged (t − 1) observations. This methodological specification severs reverse causal pathways between contemporaneous trade networks and current economic variables, thereby ensuring that the economic attributes used as explanatory variables temporally precede the formation of the response variable.
Empirical results from Model 10 demonstrate that after incorporating lagged explanatory variables, both the sign direction and statistical significance levels of coefficient estimates remain fundamentally consistent with the original model using concurrent variables. This indicates robust evidence for the significant driving effect of economic scale on trade network formation observed in this study, substantially reducing the likelihood that reverse causality dominates our core findings. Consequently, the conclusions more strongly support the explanatory pathway wherein economic scale expansion acts as a structural driving factor for trade network evolution.
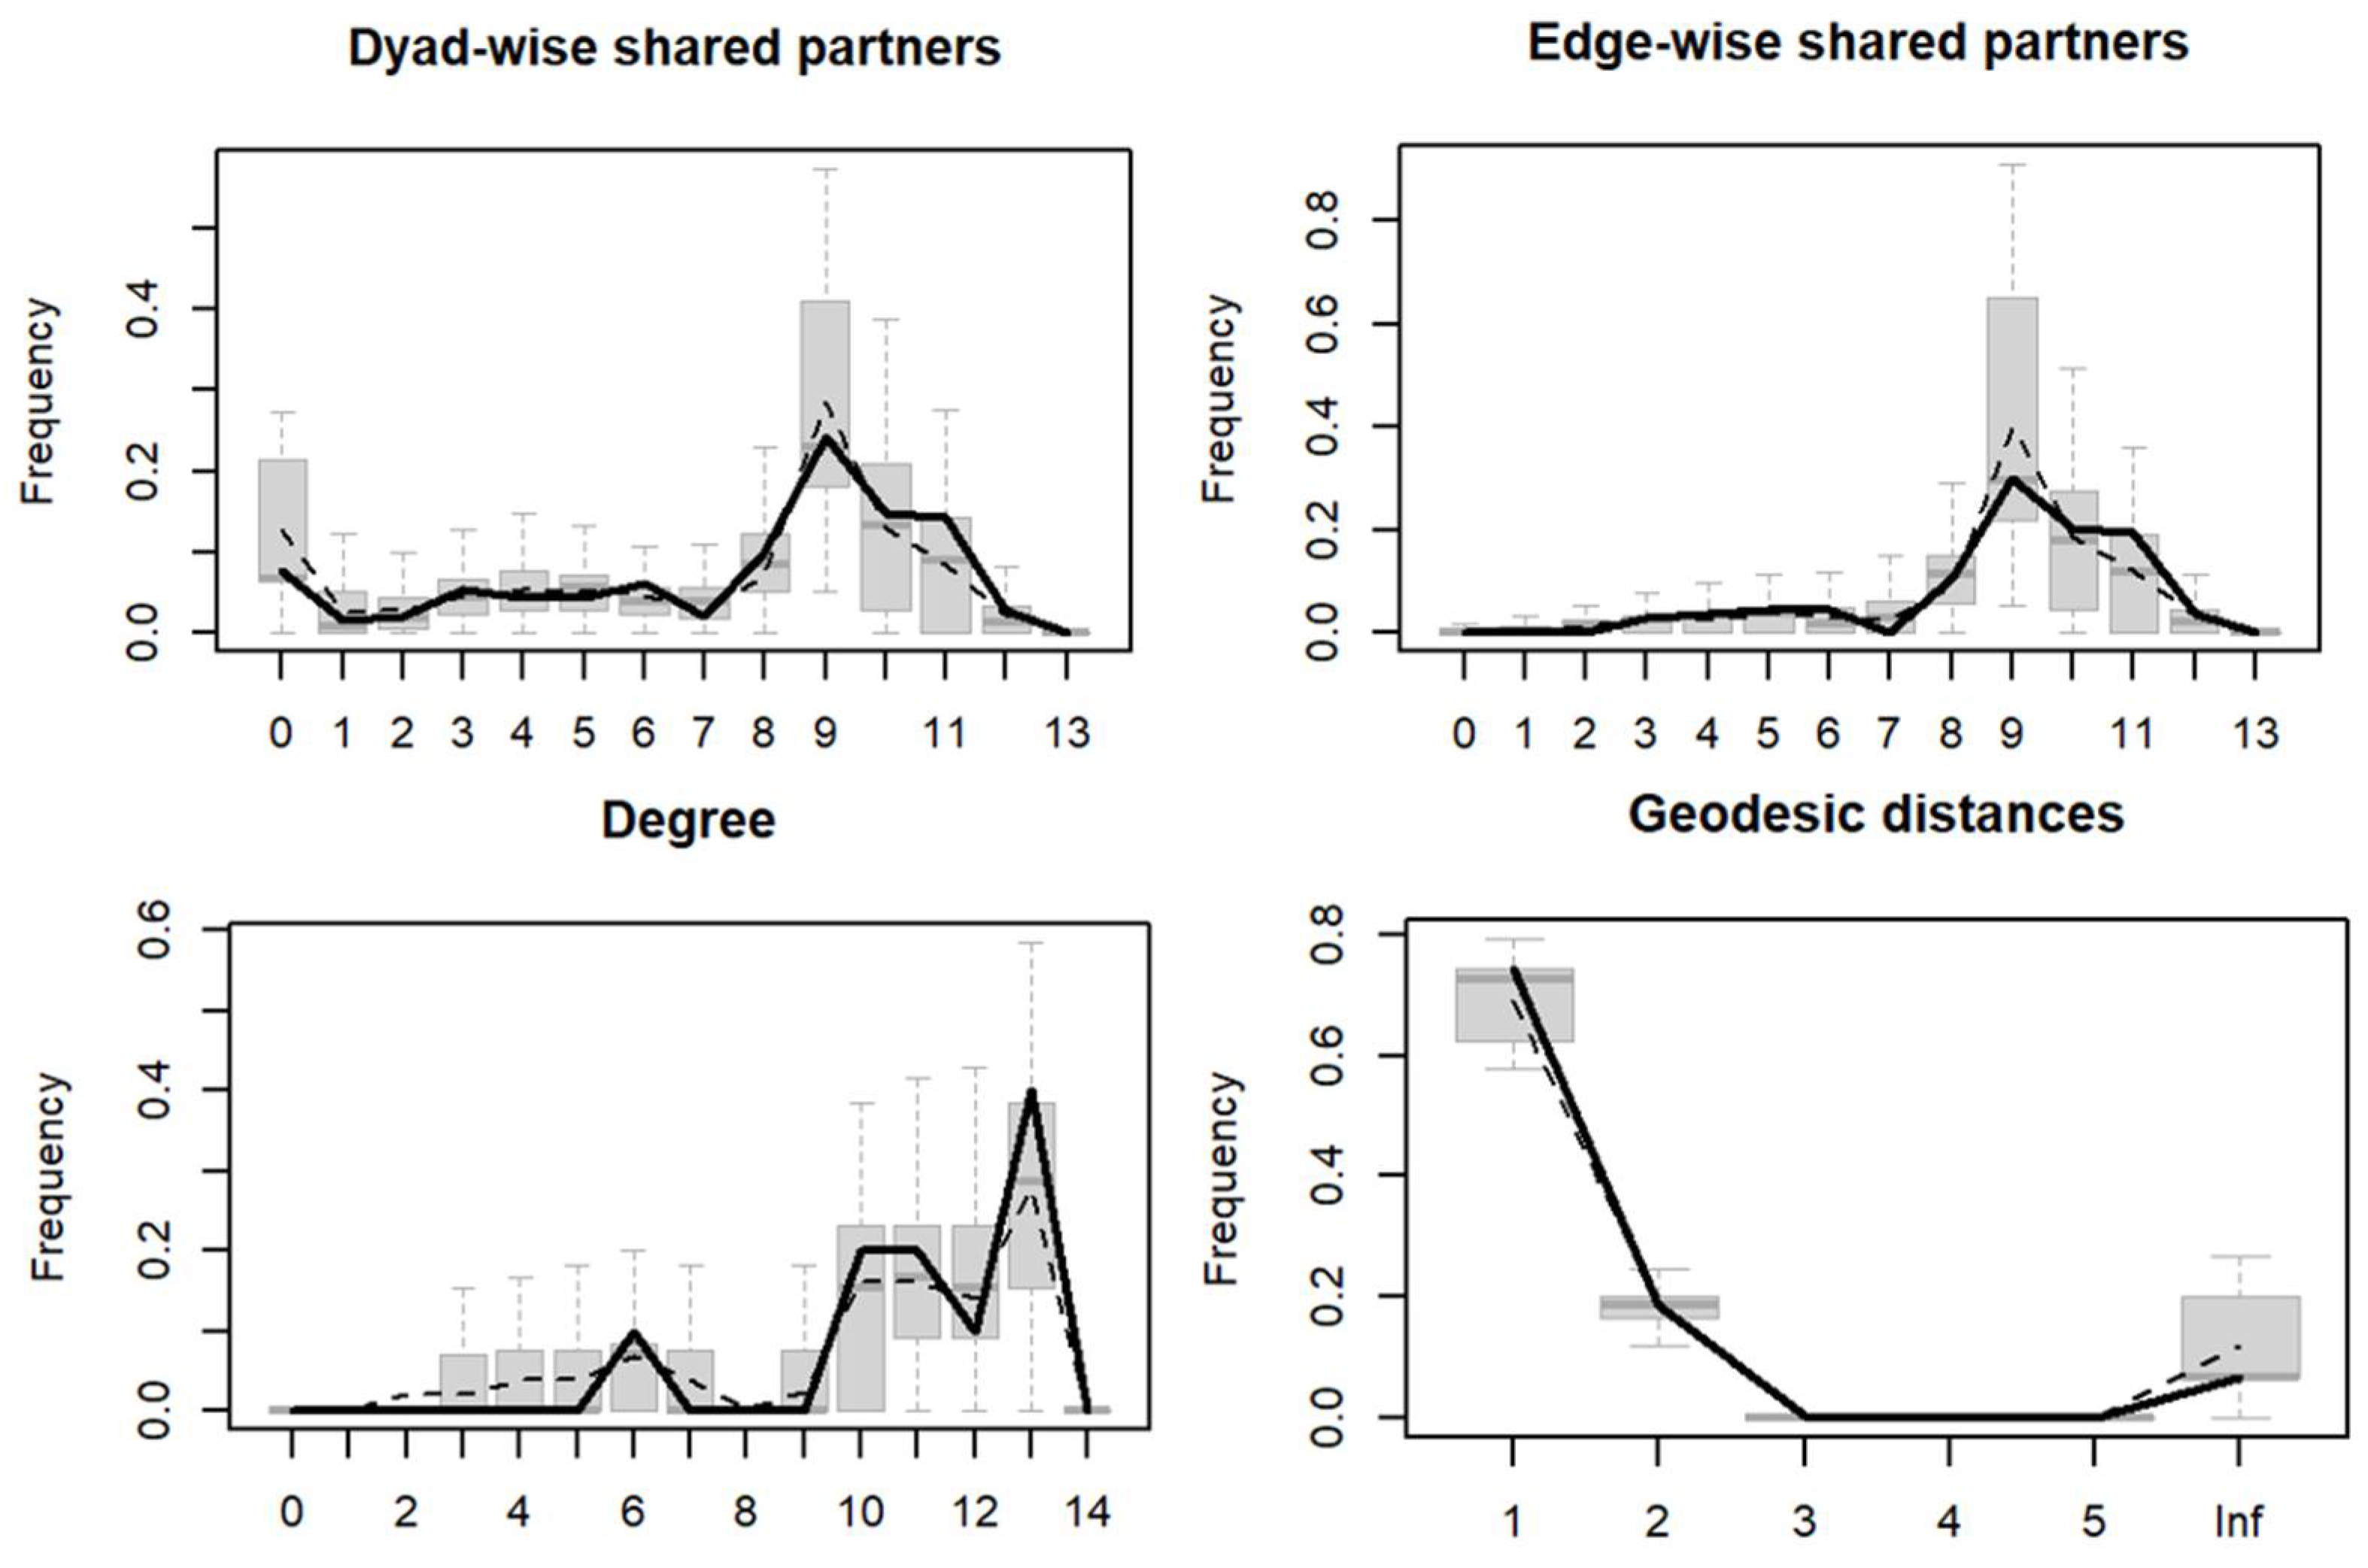
4.4. Test of Goodness of Fit
The core mechanism of TERGMs is to extend the traditional exponential family random graph model (ERGM) to time-series network scenarios. In order to verify the statistical fitness of the model, a goodness-of-fit test is performed to evaluate the model’s ability to reproduce the real network dynamics by comparing the structural characteristic distributions of the simulated network and the observed network. Random network samples were generated using the estimated parameters of Model 5 in Table 5, and multidimensional validation was performed based on four types of core network topology metrics: DSP, ESP, degree centrality, and geodesic distance. The distribution of features of the real network is represented by a solid black line, while the distribution of the simulated network is represented by a boxplot showing its 95% confidence interval [46]. As shown in Figure 10, among the four types of test indicators, the statistical values of the real network are completely within the confidence interval range of the simulation network. Among them, the distribution curves of DSP and ESP are highly coincident with the quantile box line of the simulated network, which indicates that the model accurately captures the local clustering characteristics of the network; the observed values of the node centrality distribution are consistent with the skewness characteristics of the simulated values, which verifies the ability of the model to describe the degree heterogeneity; the cumulative probability distribution curve of geodetic distance extends smoothly in the simulation interval, which proves that the model effectively reproduces the global connectivity mode of the network. The results show that the random network generated by TERGMs has no significant difference from the real network in microstructure and macroscopic topological properties, which fully proves that the model has excellent goodness of fit. The test results confirm the rationality of the TERGM model at the statistical level and provide a methodological guarantee for causal mechanism analysis.
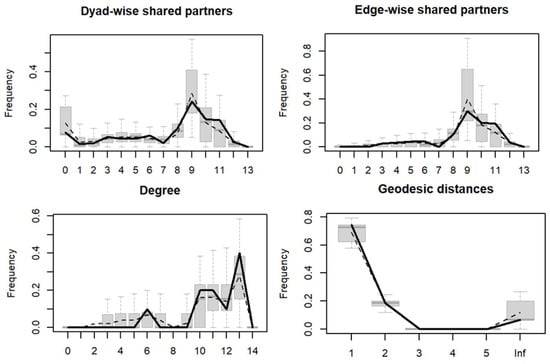
Figure 10.
Goodness-of-fit test. Note: Solid black line: Observed network distribution; Boxplot: Simulated network distribution (95% CI).
5. Discussion and Conclusions
5.1. Discussion
To deepen understanding of the RCEP agricultural trade network evolution mechanisms, this study adopts a complex systems perspective employing Temporal Exponential Random Graph Models (TERGMs) for dynamic modeling. Unlike prior studies relying on QAP or static ERGMs, TERGMs simultaneously quantify the independent contributions and interactions of endogenous structural effects and exogenous factors on network evolution. Using post-RCEP-implementation data, we systematically analyze the network’s dynamic responsiveness mechanisms. Empirical results confirm core tenets of the gravity model: geographic distance exhibits significant negative effects, while economic scale (GDP) shows positive effects. Crucially, TERGM-based dynamic network analysis transcends the gravity model’s fundamental limitation in static dyadic relationships by revealing endogenous evolutionary mechanisms, particularly relationship dependency and systematic spillover effects unobservable in traditional bilateral frameworks [47,48,49]. Dynamic modeling further demonstrates the following: (1) China’s emergence as a supernode and reinforcement of core-periphery structures validate new trade theory propositions regarding increasing returns to scale. (2) RCEP has catalyzed a China-ASEAN dual-core driving structure, challenging the previous consensus on China’s unilateral dominance. (3) Maintenance of small-world properties reveals topological characteristics balancing efficiency and resilience, extending new trade theory’s attention to such structural attributes. Through the TERGM methodology, this study not only verifies traditional gravity factors but systematically uncovers endogenous structural dynamics and exogenous environmental influences in trade network evolution. Findings both substantiate core arguments of gravity and new trade theories while revealing their limitations, thereby significantly advancing knowledge of agricultural trade network architectures.
5.2. Conclusions
The RCEP agricultural products trade network is reshaping the regional agricultural economic pattern, injecting new momentum into the agricultural development of member countries through institutional innovation and industrial coordination, and becoming an important force to promote the reform of the global agricultural governance system. Based on the RCEP agricultural export trade data from 2000 to 2023, this paper constructs a trade network by using a social network analysis method, and reveals the dynamic structure characteristics and driving factors of regional agricultural trade through temporal exponential random graph model (TERGM), aiming to provide theoretical support and practical path for optimizing supply chain resilience, deepening multilateral rule coordination and strengthening regional economic integration. The results show the following: (1) The dependence degree of agricultural export trade in the RCEP region has increased significantly, and the growth pole of agricultural products in the region has been initially formed. (2) In the network topology, the agricultural trade network scale gradually expanded, showing “small world” characteristics, showing high density, short path, and strong clustering, while having a significant “core-edge” structure and stable reciprocity. (3) In the cyberspace structure, agricultural export trade presents the characteristics of “China core, ASEAN rise”, forming a triangular network of “China-ASEAN-Japan and South Korea”, in which China becomes the largest hub. (4) The network exhibits a dual-core driving structure: China functions as a super node dominating global resource integration, while ASEAN constitutes a secondary hub. The elevated network hierarchy coefficient (0.659) reflects multipolar coordination rather than decentralization. (5) Regarding agricultural trade network driving mechanisms, for endogenous mechanisms, reciprocity significantly enhances systemic stability, while network expansibility facilitates the embedding of emerging trade partners. This multi-hub co-evolution substantiates complex systems’ adaptive evolution characteristics. For nodal factors, economic scale (GDP) acts as a propelling factor for network expansion. Economic development level and financial freedom (ff) promote exports, whereas consumer upgrading in high-income economies drives imports. For exogenous network effects, geographic distance exerts negative impacts, while geographic proximity and linguistic homogeneity demonstrate positive effects. Regional integration mechanisms mitigate trade-inhibiting institutional heterogeneity
6. Policy Recommendations
The dynamic evolution of RCEP agricultural trade networks manifests a hierarchical core-periphery structure, efficient small-world connectivity, and robust endogenous reciprocity mechanisms. These tripartite characteristics collectively delineate the optimal pathway for regional agricultural value chain optimization: differentiated governance with dynamic adaptive adjustments. Based on significant nodal functional divergence, this study proposes a three-tier coordinated governance framework:
Core Hubs should strengthen digital rulemaking and systemic resilience. As supernodes controlling critical trade corridors, core hub nations must establish blockchain-based cross-border agricultural traceability platforms to compress customs clearance times for sensitive commodities, directly counteracting geographic distance effects; implement dynamic grain import adjustment mechanisms triggering tariff modifications when international price volatility exceeds thresholds, concurrently establishing regional supply chain resilience funds; institutionalize digital quarantine standards to consolidate network reciprocity stability.
Secondary Hubs urgently require industrial synergy and green value transformation. Addressing structural hole imbalances from uneven ASEAN interdependence means constructing production capacity collaboration networks with Thailand-Vietnam-Indonesia as triangular nodes, adopting value-added enhanced rules of origin to strengthen closure; creating sustainability-origin labeling systems aligned with EU CBAM mechanisms, converting ecological capital into trade competitiveness; bridging digital divides via inclusion funds enabling SME access to regional e-commerce platforms.
Peripheral nations depend on infrastructure empowerment and institutional inclusivity to overcome geographic constraints. To mitigate distance rigidity, it is necessary to launch dedicated cold-chain routes on the China–Laos Railway, optimizing network connectivity; innovate mobile-enabled origin certification systems, reducing compliance costs, with parallel specialty product over-quota exemptions; establish regional climate insurance pools, interfacing with RCEP cooperation clauses to hedge production risks.
Author Contributions
Research design, S.D.; Data collection, S.D.; Model construction, S.D.; Results validation, S.D.; Data analysis, S.D.; Initial draft preparation, S.D.; Research framework design, L.W.; Final manuscript review and approval, L.W.; Literature review, Q.Z.; Data processing, Q.Z.; Visualization analysis, Q.Z.; Manuscript revision, Q.Z. All authors have read and agreed to the published version of the manuscript.
Funding
This research was funded by Shihezi University, “Central Asian Education and Humanistic Exchanges Research Center”, grant number (ZYJY2023001).
Data Availability Statement
Data are available upon request to the corresponding author.
Conflicts of Interest
The authors declare no conflicts of interest.
Abbreviations
The following abbreviations are used in this manuscript:
| RCEP | Regional Comprehensive Economic Partnership |
| SNA | Social network analysis |
| TERGM | Temporal exponential random graph model |
References
- Hopewell, K. Unravelling of the trade legal order: Enforcement, defection and the crisis of the WTO dispute settlement system. Int. Aff. 2025, 101, 1103–1117. [Google Scholar] [CrossRef]
- Zhang, T.; Yang, J. Factors influencing the global agricultural trade: A network analysis. Agric. Econ. 2023, 69, 343–357. [Google Scholar] [CrossRef]
- Qiang, W.; Niu, S.; Wang, X.; Zhang, C.; Liu, A.; Cheng, S. Evolution of the Global Agricultural Trade Network and Policy Implications for China. Sustainability 2020, 12, 192. [Google Scholar] [CrossRef]
- Yang, S.; Liang, X.; Lou, Z.; Tan, Y.; Ali, A. Analysing the consequences of Regional Comprehensive Economic Partnership on the agricultural economies of China, Australia and New Zealand. Agric. Econ. 2024, 70, 362–381. [Google Scholar] [CrossRef]
- Liu, Y.; Zhang, L.; Failler, P.; Wang, Z. The Dynamic Evolution of Agricultural Trade Network Structures and Its Influencing Factors: Evidence from Global Soybean Trade. Systems 2025, 13, 279. [Google Scholar] [CrossRef]
- Huan, S.; Liu, X. Network modeling and stability improvement of the water-energy-fertilizer-food nexus flows based on global agricultural trade. Sustain. Prod. Consum. 2023, 39, 480–494. [Google Scholar] [CrossRef]
- Ma, J.; Zhao, P.; Li, M.; Niu, J. The evolution of global soybean trade network pattern based on complex network. Appl. Econ. 2024, 56, 3133–3149. [Google Scholar] [CrossRef]
- Liu, C.; Xu, J.; Zhang, H. Competitiveness or Complementarity? A Dynamic Network Analysis of International Agri-Trade along the Belt and Road. Appl. Spat. Anal. Policy 2020, 13, 349–374. [Google Scholar] [CrossRef]
- Pathak, S.; Dilts, D.; Mahadevan, S. Investigating Population and Topological Evolution in a Complex Adaptive Supply Network. J. Supply Chain Manag. 2009, 45, 54–57. [Google Scholar] [CrossRef]
- An, H.; Zhong, W.; Chen, Y.; Li, H.; Gao, X. Features and evolution of international crude oil trade relationships: A trading-based network analysis. Energy 2014, 74, 254–259. [Google Scholar] [CrossRef]
- Xu, Y.; Zhang, P.; And Li, H. Dynamic Evolution of the Power Structure and Contracting State Status in the Regional Trade Agreement Network and Its Trade Feedback Effects. Emerg. Mark. Financ. Trade 2025, 61, 1684–1711. [Google Scholar] [CrossRef]
- Chen, W.; Zhang, J.; Yu, Z.; Zhao, X. Structure and evolution of global lead trade network: An industrial chain perspective. Resour. Policy 2024, 90, 104735. [Google Scholar] [CrossRef]
- Sartori, M.; Schiavo, S. Connected we stand: A network perspective on trade and global food security. Food Policy 2015, 57, 114–127. [Google Scholar] [CrossRef]
- Ma, S.; Ren, W.; Wu, G. The characteristics of a country’s agricultural trade network and its impact on the global value chain division-based on the perspective of social network analysis. Manag. World 2016, 60–72. [Google Scholar] [CrossRef]
- Zhang, S.; Chen, Z.; Chen, Y.; Yang, S. The Structure and Influencing Mechanisms of the Global Palm Oil Trade: A Complex Network Perspective. Sustainability 2025, 17, 3062. [Google Scholar] [CrossRef]
- Chen, Y.; Li, E. Spatial pattern and evolution mechanism of grain trade network in Belt and Road countries. Prog. Geogr. Sci. 2019, 38, 1643–1654. [Google Scholar] [CrossRef]
- Li, Y.; Li, Y.; Pan, A.; Pan, X.; Veglianti, E. The Network Structure Characteristics and Determinants of the Belt & Road Industrial Robot Trade. Emerg. Mark. Financ. Trade 2022, 58, 1491–1501. [Google Scholar]
- Deng, X.; Zhang, F.; Lin, S.; Qiu, W. Research on the Structural Characteristics and Influencing Factors of Digital Service Trade Networks in RCEP Member States. Sustainability 2024, 16, 10567. [Google Scholar] [CrossRef]
- Zhao, G.; Li, W.; Geng, Y.; Bleischwitz, R. Uncovering the features of global antimony resource trade network. Resour. Policy 2023, 85, 103815. [Google Scholar] [CrossRef]
- Xiao, J.; Xiong, C.; Deng, W.; Yu, G. Evolution Features and Robustness of Global Photovoltaic Trade Network. Sustainability 2022, 14, 14220. [Google Scholar] [CrossRef]
- Peng, H.; Wang, X.; Ma, S. Ma Shiqun. Analysis of the dynamic structure and influencing factors of agricultural products trade network in RCEP member countries. Stat. Res. 2024, 41, 71–84. [Google Scholar]
- Xu, S.; Zhang, H.; Qian, J. Analysis of network characteristics and influencing factors of RCEP regional agricultural trade. J. Nat. Resour. 2024, 39, 2206–2223. [Google Scholar]
- Huang, X.; Li, G. Research on the Evolution of Agricultural Products Trade Network Pattern and Its Influence Mechanism in RCEP Countries—Based on the Perspective of Complex Network. Int. Econ. Trade Explor. 2023, 39, 22–41. [Google Scholar]
- Wang, L.; Ding, F.; Liu, T.; Zheng, Q. The Network Evolution and Influencing Factors of the Global Cultural Printed Material Trade. Sustainability 2025, 17, 918. [Google Scholar] [CrossRef]
- Istudor, N.; Constantin, M.; Privitera, D.; Ignat, R.; Petrescu, I.-E.; Teodor, C. Systemic Competitiveness in the EU Cereal Value Chain: A Network Perspective for Policy Alignment. Land 2025, 14, 731. [Google Scholar] [CrossRef]
- Duan, J.; Nie, C.; Wang, Y.; Yan, D.; Xiong, W. Research on Global Grain Trade Network Pattern and Its Driving Factors. Sustainability 2022, 14, 245. [Google Scholar] [CrossRef]
- Cai, X.; Liu, C.; Zheng, S.; Hu, H.; Tan, Z. Analysis on the evolution characteristics of barite international trade pattern based on complex networks. Resour. Policy 2023, 83, 103593. [Google Scholar] [CrossRef]
- Fan, Z.; Long, R.; Anwar, S.; Wang, J. Does centrality within trade agreements network matter to economic complexity? The conditioning effects of network structure. Int. Rev. Econ. Financ. 2025, 98, 103892. [Google Scholar] [CrossRef]
- Barnett, G.A.; Park, H.W. Co-authorship among the Fellows of the International Communication Association. Scientometrics 2023, 128, 3401–3418. [Google Scholar] [CrossRef]
- Bloch, F.; Jackson, M.O.; Tebaldi, P. Centrality measures in networks. Soc. Choice Welf. 2023, 61, 413–453. [Google Scholar] [CrossRef]
- Leifeld, P.; Cranmer, S.J.; Desmarais, B.A. Temporal Exponential Random Graph Models with btergm: Estimation and Bootstrap Confidence Intervals. J. Stat. Softw. 2018, 83, 1–36. [Google Scholar] [CrossRef]
- Khalilzadeh, J. Demonstration of exponential random graph models in tourism studies: Is tourism a means of global peace or the bottom line? Ann. Tour. Res. 2018, 69, 31–41. [Google Scholar] [CrossRef]
- Wang, X.; Chen, B.; Hou, N.; Chi, Z. Evolution of structural properties of the global strategic emerging industries’ trade network and its determinants: An TERGM analysis. Ind. Mark. Manag. 2024, 118, 78–92. [Google Scholar] [CrossRef]
- Ya, Z.; Pei, K. Factors Influencing Agricultural Products Trade between China and Africa. Sustainability 2022, 14, 5589. [Google Scholar] [CrossRef]
- Zhang, W. The Importance of Money and Connections: Explaining International Status from UNGA Draft Sponsorship Networks. Int. Interact. 2025, 51, 264–294. [Google Scholar] [CrossRef]
- Fu, X.; Chen, H.; Xue, Z. Construction of the Belt and Road Trade Cooperation Network from the Multi-Distances Perspective. Sustainability 2018, 10, 1439. [Google Scholar] [CrossRef]
- Jia, N.; Pi, Z.; Zuo, M.; Liu, D.; An, H.; Wang, J. Structural evolution and the influence mechanism of the global embedded tungsten value flow networks: The perspective of value chain and technological progress. Resour. Policy 2024, 91, 104876. [Google Scholar] [CrossRef]
- Xiao, R.; Zhao, P.; Huang, K.; Ma, T.; He, Z.; Zhang, C.; Lyu, D. Liquefied natural gas trade network changes and its mechanism in the context of the Russia–Ukraine conflict. J. Transp. Geogr. 2025, 123, 104101. [Google Scholar] [CrossRef]
- Xu, H.; Feng, L.; Wu, G.; Zhang, Q. Evolution of structural properties and its determinants of global waste paper trade network based on temporal exponential random graph models. Renew. Sustain. Energy Rev. 2021, 149, 111402. [Google Scholar] [CrossRef]
- Abudukeremu, A.; Youliwasi, A.; Abula, B.; Yiming, A.; Wang, D. Study on the Evolution of SCO Agricultural Trade Network Pattern and Its Influencing Mechanism. Sustainability 2024, 16, 7930. [Google Scholar] [CrossRef]
- Wu, G.; Feng, L.; Peres, M.; Dan, J. Do self-organization and relational embeddedness influence free trade agreements network formation? Evidence from an exponential random graph model. J. Int. Trade Econ. Dev. 2020, 29, 995–1017. [Google Scholar] [CrossRef]
- Lusher, D.; Koskinen, J.; Robins, G. Exponential Random Graph Models for Social Networks: Theory, Methods and Applications; Cambridge University Press: Cambridge, UK, 2013. [Google Scholar]
- Guo, Z.; Qin, F.; Chen, Y.; Di, Y. China’s agricultural trade networks and its influencing factors. Appl. Econ. 2024, 56, 5754–5773. [Google Scholar] [CrossRef]
- Lund Bäck, E.J.; Torstensson, J. Demand, comparative advantage and economic geography in international trade: Evidence from the OECD. Welt. Wirtsch. Ftliches Arch. 1998, 134, 230–249. [Google Scholar] [CrossRef]
- Pangestu, M.; Ing, L.Y. ASEAN: Regional Integration and Reforms. Asian Econ. Pap. 2016, 15, 44–60. [Google Scholar] [CrossRef]
- Leifeld, P.; Cranmer, S.J. A theoretical and empirical comparison of the temporal exponential random graph model and the stochastic actor-oriented model. Netw. Sci. 2019, 7, 20–51. [Google Scholar] [CrossRef]
- Yu, S.; Niu, D.; Liao, F.; Jiang, Y. Manufacturing diffusion trends from the perspective of trade network: The belt vs. the road. Marit. Policy Manag. 2022, 49, 716–736. [Google Scholar] [CrossRef]
- Chen, S.; Qiang, Q. The Trade Network Structure of the “One Belt and One Road” and Its Environmental Effects. Sustainability 2020, 12, 3519. [Google Scholar] [CrossRef]
- Li, C.; Lai, A.; Wang, Z.; Hsu, Y. The preliminary effectiveness of bilateral trade in China’s belt and road initiatives: A structural break approach. Appl. Econ. 2019, 51, 3890–3905. [Google Scholar] [CrossRef]


Disclaimer/Publisher’s Note: The statements, opinions and data contained in all publications are solely those of the individual author(s) and contributor(s) and not of MDPI and/or the editor(s). MDPI and/or the editor(s) disclaim responsibility for any injury to people or property resulting from any ideas, methods, instructions or products referred to in the content. |
© 2025 by the authors. Licensee MDPI, Basel, Switzerland. This article is an open access article distributed under the terms and conditions of the Creative Commons Attribution (CC BY) license (https://creativecommons.org/licenses/by/4.0/).