1. Introduction
Diseases disrupt individuals’ physiological, mental, and social balance, adversely affecting both personal and societal well-being. From a macroeconomic perspective, disease-related declines in labor productivity, withdrawals from the labor market due to early retirement, and reduced employment levels lead to significant economic consequences at the societal level [
1,
2]. At the same time, diseases increase healthcare expenditures by complicating the efficient and effective use of resources allocated to health systems, thereby imposing substantial financial burdens on these systems [
3,
4]. This situation becomes even more pronounced in the case of diseases with a broad impact, such as neurological disorders (NDs), which highlight the social and economic burden they create.
Neurological disorders (NDs) encompass a group of conditions, including Alzheimer’s disease and other dementias, headaches, idiopathic epilepsy, motor neuron diseases, multiple sclerosis, Parkinson’s disease, muscular dystrophies, Huntington’s disease, and other neurological diseases [
5]. Due to their long-term economic and social impacts, NDs are among the most significant global public health issues. These disorders, which impose heavy financial burdens on healthcare systems, also have long-term adverse effects on economic outcomes [
6]. In 2021, it was estimated that approximately 3.4 billion people, corresponding to 43.1% of the global population, had a neurological condition. These diseases accounted for 11.1 million deaths and 443 million disability-adjusted life years (DALYs) lost in the same year [
5,
6,
7]. Moreover, as populations age, the prevalence of these diseases is expected to increase [
8].
Neurological disorders not only diminish individuals’ quality of life but also exert significant pressures on economic and social systems at the societal level. These multidimensional impacts of diseases on individuals and communities constitute a critical area of investigation within the field of health economics. Particularly, the direct and indirect effects of diseases on healthcare expenditures, as well as the disparities in these expenditures across countries, remain central topics of discussion [
7].
Significant differences exist in health expenditures among countries worldwide. In high-income countries, per capita health expenditure (PPP) exceeds an average of USD 6000, while in resource-limited countries, this figure was only USD 100 per capita in 2022 [
5,
9,
10]. In 2021, the United States recorded the highest per capita health expenditure among OECD countries, amounting to USD 12,555. This figure was considerably higher than that of Switzerland, which had the second-highest per capita health expenditure [
11]. Germany, Norway, and the Netherlands also ranked among the top five countries, with approximately USD 8000 per capita health expenditure [
9]. Moreover, while the average per capita health expenditure in OECD member countries exceeded USD 5000, this figure was approximately USD 200 in Sub-Saharan Africa [
9,
11]. Globally, the United States had the highest per capita health expenditure at USD 12,555 annually, whereas South Sudan recorded the lowest, with only USD 33 per capita according to World Bank data [
5].
Health expenditures vary widely depending on the level of economic development. While some countries allocate more than 12% of their gross domestic product (GDP) to health, others allocate less than 3% [
12]. Among OECD countries, the average rate exceeds 13%, whereas in Africa and other underdeveloped and developing countries, it is approximately 5% [
5,
11].
As observed, health expenditure levels show significant variations between countries, stemming from factors such as income levels, demographic structures (aging, DALYs, disease patterns), and health system characteristics [
13]. Effective and efficient management of economic resources is critical for ensuring the sustainability of existing health services, equitable resource allocation, and the strategic long-term planning of health policies. Consequently, income levels have historically been regarded as one of the most critical factors in explaining differences in health expenditures across countries [
14,
15,
16,
17]. Current studies also identify income, measured as GDP per capita, as a key determinant in explaining variations in the level and growth rate of total health expenditures among countries [
14,
18,
19]. Baltagi and Moscone [
18] analyzed the long-term relationship between health expenditures and income for 20 OECD countries between 1971 and 2004. They found that most health expenditures and their determinants were non-stationary and that a long-term relationship exists between health expenditures and income levels.
As modern societies face rapidly aging populations worldwide, aging is considered one of the most significant societal changes of the 21st century [
20]. Generally, younger populations incur lower health expenditures compared to older populations due to lower disease prevalence, reduced healthcare needs, and lower rates of healthcare utilization [
21]. A study conducted in Japan revealed that elderly individuals utilize healthcare services 3.2 times more than younger individuals annually, thereby increasing health expenditures [
22]. The per capita health expenditure for older individuals in developed countries has increased at a faster rate in recent years compared to those under 65 years of age [
23].
Another factor explaining differences in health expenditures is advancements in medical technologies. Despite therapeutic value and cost-effectiveness assessments, medical technologies significantly impact economic production and health expenditures, often increasing costs [
24]. Additionally, Xu et al. [
17] identified the structural characteristics of health systems as another determinant of health expenditures. These structures encompass elements such as service delivery, healthcare financing, external support, and payment mechanisms [
17]. In this context, Andersen and Newman’s [
25] behavioral model of health services emphasizes the roles of predisposing factors (health behaviors, demographics, socioeconomic status), enabling factors (income, informal care availability, health insurance), and need factors (poor health, disability, mortality) in determining individual healthcare utilization and expenditures [
25,
26]. Within this model, neurological disorders (NDs) are categorized as need factors, representing a significant driver of increased health expenditures. Neurological disorders such as Alzheimer’s disease, Parkinson’s disease, epilepsy, stroke, multiple sclerosis, and migraines impose substantial financial burdens on healthcare systems due to long-term care requirements and dependence on advanced medical technologies [
5,
6,
27,
28]. Understanding the economic impacts of neurological disorders is crucial for effectively managing rising health expenditures and the long-term costs of these diseases.
The literature on the effects of diseases on health expenditures and economic outcomes reveals that limited studies have examined the disease profile or prevalence within a society. Recent research has shown that the increasing prevalence of non-communicable diseases (NCDs), such as NDs, contributes to rising health expenditures. For example, a systematic review conducted by Vandenberghe and Albrecht in 2019 demonstrated that diseases not only increase health expenditures but also reduce economic output [
29]. However, neurological disorders remain an underexplored area in cross-country analyses of health expenditures and economic outcomes.
This study aims to examine the impact of neurological disorders on health expenditures and economic output in OECD countries between 2000 and 2021 using dynamic panel data analysis. Theoretically, the prevalence of neurological disorders (NDs) is expected to be significantly positively correlated with health expenditures while negatively affecting economic output. NDs are emerging as a critical global public health issue, imposing growing financial burdens on health systems and creating long-term adverse effects on economic outcomes. By providing an in-depth analysis of the economic impacts of these diseases and their contributions to health expenditures, this study aims to address the gap in cross-country comparisons in the literature. The study’s originality lies in its specific focus on a particular disease group—neurological disorders—and its cross-national coverage of OECD countries, which enables a comparative analysis of health and economic systems. By employing a dual-model framework, this study not only addresses a gap in the literature but also captures the dynamic interdependence between health expenditures and economic output within a broader system-level context. Unlike previous studies that have examined these outcomes in isolation, our systems-based approach provides policymakers with robust empirical evidence that investments in the prevention and early intervention of neurological disorders can generate both healthcare cost savings and long-term macroeconomic benefits.
The remainder of this paper is organized as follows:
Section 2 presents the data sources and methodology employed in the analysis.
Section 3 discusses empirical findings.
Section 4 provides a comprehensive discussion of the results considering the literature. Finally, the last part of the study concludes with key policy implications, limitations and suggestions for future research.
2. Materials and Methods
The analytical strategy of this study is grounded in systems thinking, recognizing that health and economic indicators evolve jointly within a dynamic and interdependent framework. We used a cross-country panel analysis to analyze the effects of neurological disorders (ND) prevalence on the health expenditure and economic output in OECD countries. ND includes Alzheimer’s disease and other dementias, PD, idiopathic epilepsy, MS, motor neuron disease, migraine, tension-type headache and other NDs. We obtained the data from “The 2021 Global Burden of Disease” study. The data was sourced from the Global Burden of Disease (GBD) Study, which provides standardized estimates for all countries using consistent and comparable methods. Neurological disorder prevalence was measured as the age-standardized number of cases per 100,000 population, based on GBD’s systematic analysis. The GBD database ensures comparability across OECD countries by applying uniform case definitions, modeling techniques, and data sources.
We used total health expenditure per capita according to the purchasing power parity (PPP-current international USD) as an indicator for health expenditure (HE), GDP per capita (current international USD -PPP) as a proxy for the income variable, and the share of +65 aged people in the total population (AGE) as a proxy demographic structure. We obtained these data from the World Bank database. Finally, we used share of total investment (INV) in GDP as a proxy for the capacity of economics. We gathered these data from the International Monetary Fund database. While we included all age groups in the model measuring the impact of NDs on healthcare expenditures, we included the working-age population when examining the impact of NDs on economic output. Finally, we used a strongly balanced panel for 38 different OECD countries using annual data and selected variables through the years 2000–2021, which was the most recent year available at the time of data collection. To reduce the impact of measurement differences in the data and potential outliers, all variables were included in the model after being subjected to logarithmic transformation. The data were analyzed using the Levin, Lin, and Chu test after logarithmic transformation. This approach allowed the empirical findings to be interpreted in percentage terms. Since a balanced panel analysis was used in the study, there is no missing data. To avoid data loss, all OECD countries were included in the study.
The data used in our study were obtained from various reliable sources and do not require harmonization. Firstly, all data were organized in a complete and consistent manner, covering 38 OECD countries on an annual basis (2000–2021). To avoid measurement discrepancies, no variable was sourced from multiple databases. Logarithmic transformation was applied to all variables to address potential measurement differences and reduce the impact of outliers. This transformation also facilitated the interpretation of regression coefficients in terms of percentage changes.
The description of the variables used in the study is presented in
Table 1 [
5,
9,
10,
11,
12].
We used dynamic panel data analysis in the study. Particularly when looking at economic variables like income and expenditure, health spending behavior can be impacted by both the historical behavior patterns of previous values and the elements of that time period statically. Therefore, the lagged values of the dependent variable, i.e., the values from previous periods, should also be included among the autoregressive explanatory factors. Although well-known estimation methods can be used mathematically in the estimation of dynamic panel data models, there can be biased and inconsistent estimates obtained due to the problem of endogeneity [
30]. In this instance, the inconsistent results from popular estimation methods have led to the development of alternative estimation methods that use instrumental factors rather than the lagged-dependent variable [
31]. In the literature, the most frequently used estimation method in dynamic panel data models is Arellano and Bond’s Generalized Method of Moments (GMM) [
32]. In the GMM, the first-difference model is transformed using the instrumental variable matrix in the first stage. In the second stage, the transformed model is estimated with the Generalized Least Squares Method. Therefore, this method is also known in the literature as the GMM estimator, Two-Stage Instrumental Variables Estimator. The GMM method is used when the error terms are autocorrelated. In addition, it is also a suitable method in the presence of both homoskedasticity and heteroskedasticity [
33]. However, recognizing the potential limitations of weak instruments in the Arellano–Bond method, we also utilized the Blundell–Bond system GMM approach. This method strengthens the instrument matrix by incorporating both level and difference equations, providing more robust and efficient estimates, especially in cases of persistent data and small sample sizes. The dual application of these methods ensures the robustness of our findings, allowing for a comprehensive evaluation of the effects studied [
34].
Dynamic panel estimators such as Arellano–Bond and Blundell–Bond are particularly suitable for modeling systemic interdependencies and feedback effects among health, demographic, and economic indicators. In the GMM method, the first difference in the model is taken, and the model can be written as follows (Equation (1))
By taking the first difference, the unit effect ( is eliminated from the model. However, is correlated with . Therefore, the first-difference estimator is biased downward.
In the second stage of this model, the instrumental variables should be selected. Suitable instrumental variables
in the model are its lagged values
This is because each lagged variable has zero correlations with the previous differenced error term. For example, in the first-difference model, for t = 3.
The instrumental variable matrix is as follows:
The general matrix form of the instrumental variable first-difference model is as follows:
A vehicle variable first-difference model with an independent variable apart from the lagged-dependent variable is generally represented with the following matrices:
The GMM estimator can be represented with matrices as follows:
In this equation,
is the variance-covariance matrix of the error terms. In GMM estimation, it is necessary to test whether the instrumental variables used are valid, or in other words, whether the overidentification restrictions are valid. Arellano and Bond suggested the Sargan test for this purpose [
32]. Therefore, we used the Sargan test for the instrumental variables. The Sargan test examines the validity of overidentification restrictions, or in other words, it tests the validity of the instrumental variables used. The null hypothesis (H
0) of the Sargan test is formulated as “the overidentification restrictions are valid,” or equivalently, “the instrumental variables are valid.” When this hypothesis cannot be rejected, it is concluded that the instrumental variables used in the GMM estimation are valid.
In the dynamic panel data models, autocorrelation is another condition that needs to be tested. Arellano and Bond proposed a test for this purpose. For the GMM estimation to be efficient, there should be no second-order autocorrelation. The first-order autocorrelation in the first-difference model is insignificant and even expected. However, the absence of second-order autocorrelation is crucial for to validate the GMM estimation [
33]. To ensure the absence of second-order autocorrelation, the residuals obtained from the first-difference model were used. The null hypothesis (H
0) is formulated as “there is no autocorrelation.” Arellano and Bond provide a test statistic for autocorrelation;
This is expressed as [
32]. Here,
is the vector of the residuals with a lag of two periods. In the scope of the study, the F and Likelihood Ratio (LR) tests were conducted to examine whether there is a unit/time effect and the Hausman tests were also used for choosing between fixed and random effects.
The study also conducted a K-means clustering analysis with a fixed number of 2 clusters to examine the determinants of healthcare expenditures (HEP) and gross domestic product (GDP) separately for developed and developing OECD countries. This analysis was based on the healthcare expenditures and GDP variables for the most recent available year in the dataset, 2021. As a result, OECD countries were grouped into two clusters: “developed” and “developing” countries. Subsequently, a Blundell–Bond dynamic panel data analysis was applied separately for each group. For analysis of developing countries, Model 1 considered healthcare expenditures as the dependent variable, while Model 2 focused on GDP as the dependent variable. Similarly, for developed countries, Model 3 analyzed healthcare expenditures, and Model 4 examined GDP as the dependent variable. In the analyses, the lagged values of the logarithmic-transformed dependent variables and relevant variables (ND, AGE, INV) were included as independent variables in the models. A Wald Z-test was employed to assess the significance levels and coefficient differences between the two groups. The aim was to determine whether the effects of the determinants of healthcare expenditures and GDP significantly differed between developed and developing countries
To analyze the impact of neurological disorders (NDs) on health expenditures and economic output, potential confounding variables were theoretically examined to address omitted variable bias and enhance the reliability of the model results. Subsequently, the model was run by incorporating control variables such as cancer and life expectancy. The multicollinearity assumption was tested using the Variance Inflation Factor (VIF). Additionally, the structure and distribution of the residuals were analyzed. In this context, autocorrelation and the relationships between independent variables were examined using scatter plots. In addition, in the models where health expenditures and the prevalence of neurological diseases are included and the dependent variable is gross domestic product (GDP), the lags of GDP were used as instrumental variables. This approach aims to reduce simultaneity bias while preserving the consistency and efficiency of the estimations. The instruments are variables that are correlated with the lags of the endogenous regressors but uncorrelated with the error term. Accordingly, the model was transformed using first differencing, and depending on the performance of the models, estimations were conducted using both one-step and two-step difference GMM and system GMM estimators with robust standard errors. In the two-step estimation, the Windmeijer correction was applied to the standard errors. We used STATA 14.0 software and R 4.4.2 software for all these analyses in the study.
3. Results
3.1. Descriptive Overview and Visualization
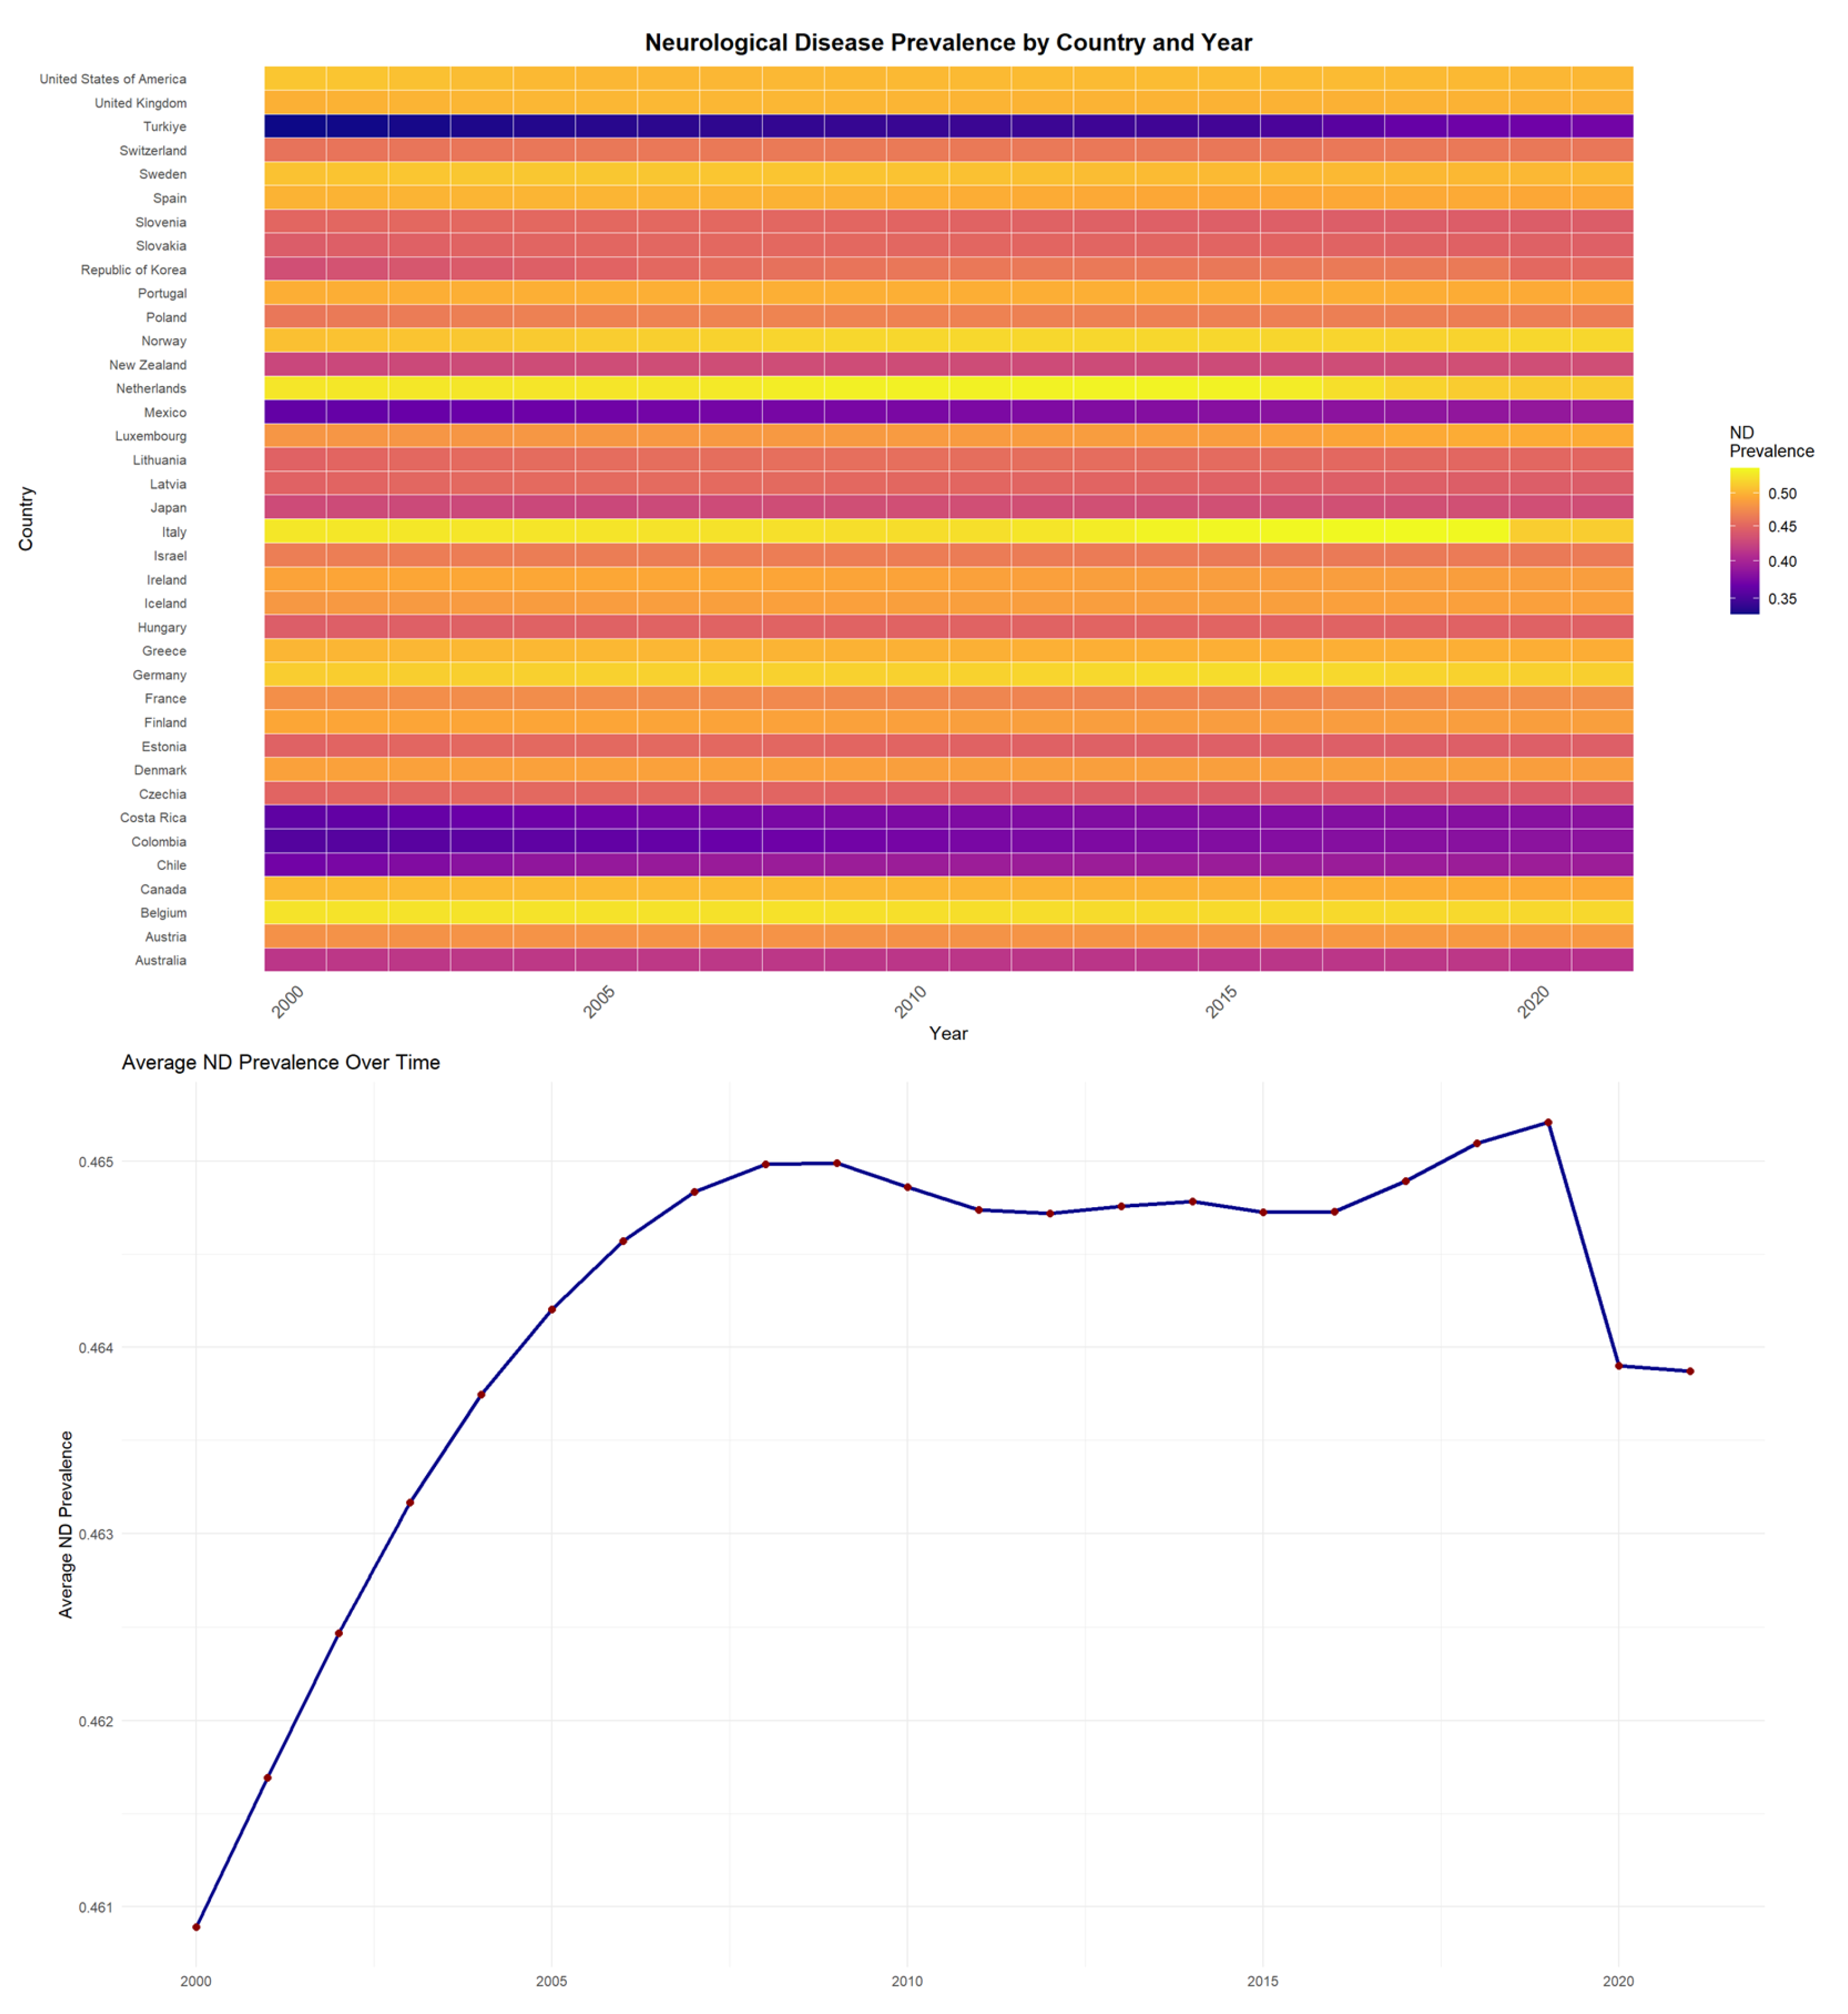
In the study, the level of ND prevalence in OECD countries between 2000 and 2021 and the average ND prevalence trends over time are shown in
Figure 1.
Figure 1 presents both the heatmap visualization and average ND prevalence trends for OECD countries between 2000 and 2021. The blue line illustrates the overall trend in annual average ND prevalence across countries, while the red dots represent the observed yearly mean values. In the heatmap, brighter/warmer colors (yellow-red) represent higher ND prevalence levels, while darker/cooler colors (purple-blue) represent lower prevalence. Accordingly, countries such as the Netherlands, Italy, and Belgium are seen as having the highest ND prevalence values. However, among these countries, Italy’s ND prevalence value has decreased between 2000 and 2021. On the other hand, countries like Turkey, Mexico, and Costa Rica have relatively lower prevalence values compared to other countries. Nonetheless, the prevalence value in these countries has been rising over the years. The average trend analysis further confirms these temporal patterns across the OECD region.
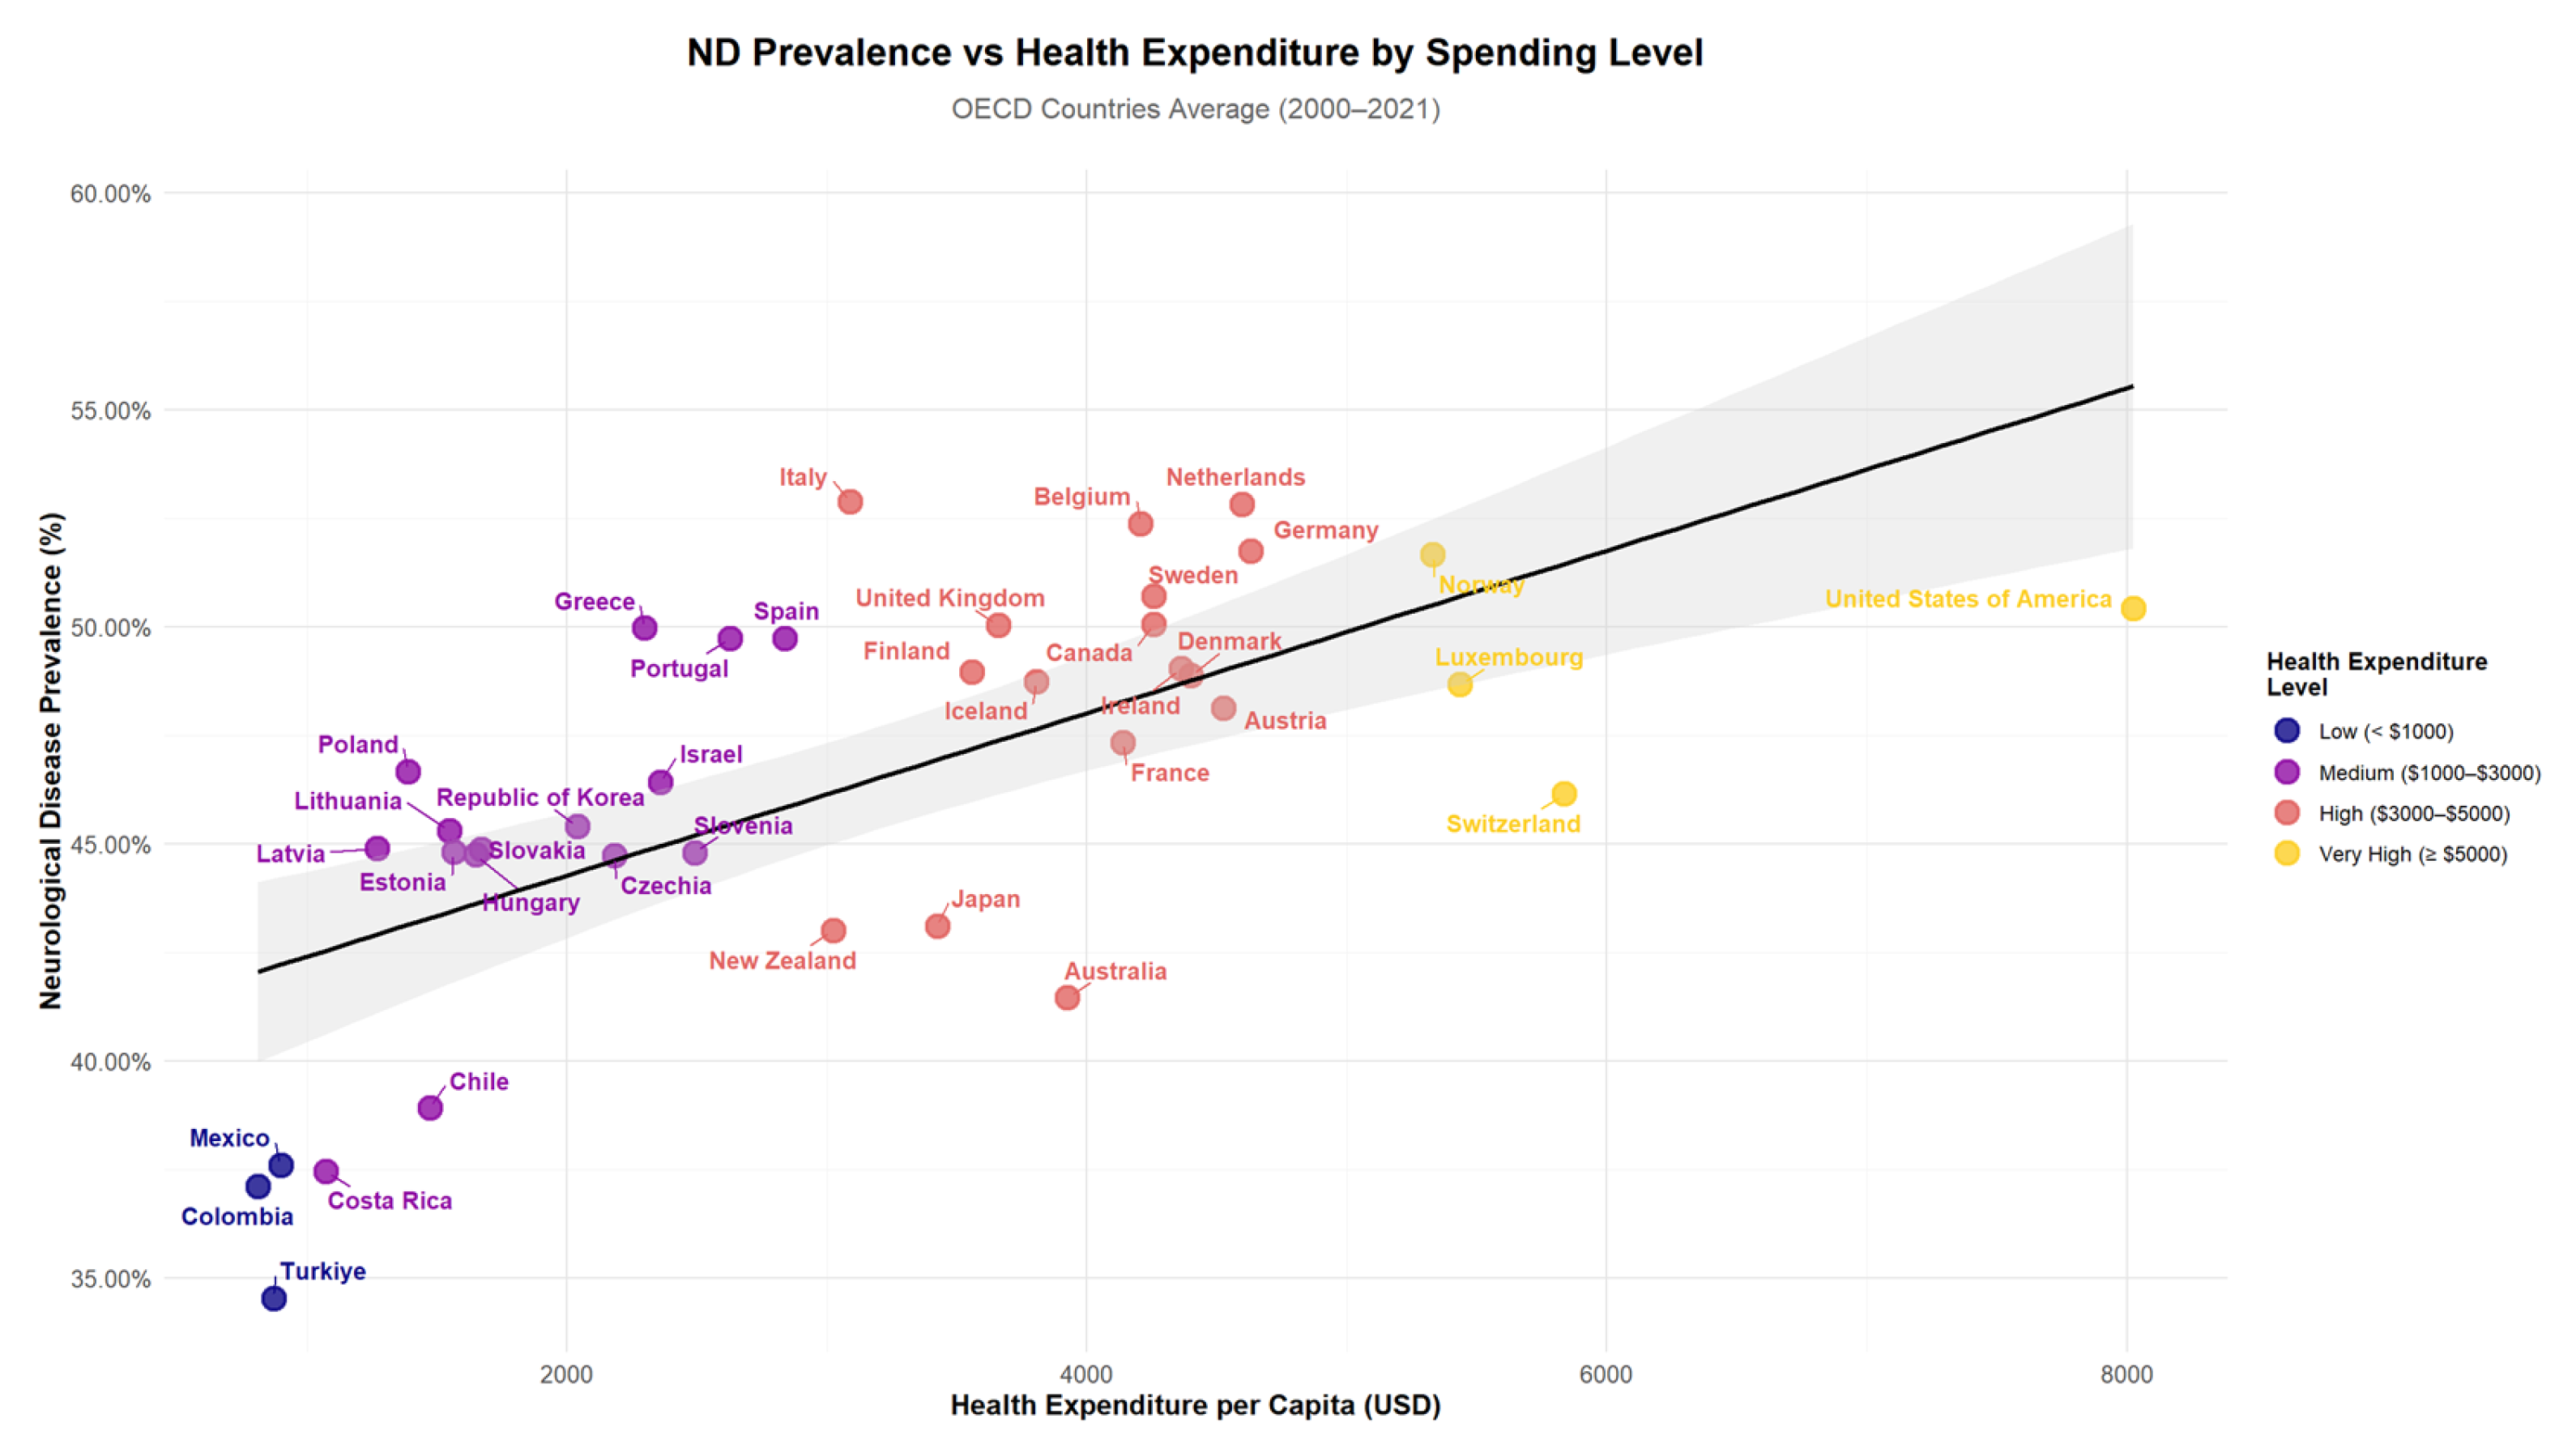
Figure 2 illustrates the relationship between ND prevalence and Health Expenditure per Capita (HEP) across OECD countries. The scatter plot reveals patterns in the data, with countries grouped by their expenditure levels ranging from low (<USD 1000) to very high (≥USD 5000). The visualization shows the distribution of countries across different spending categories and their corresponding ND prevalence rates, with a trend line indicating the overall relationship between health expenditure and neurological disease prevalence.
The descriptive statistics for 2021 are as follows: ND ranges between 0.3706 and 0.5203 with a mean of 0.4639 and a standard deviation of 0.0421. ND2 ranges between 0.4319 and 0.6278, with a mean of 0.5552 and a standard deviation of 0.0555. GDP values range from 17,586.52 to 137,947.34, with a mean of 53,536.89 and a standard deviation of 23,393.90. Age ranges from 8.13 to 29.79, with a mean of 18.14 and a standard deviation of 4.56. Investment rates range from 15.26 to 32.33, with a mean of 23.46 and a standard deviation of 3.79. Health expenditures per capita range from 1190.11 to 12,012.24, with a mean of 5025.50 and a standard deviation of 2403.19 (
Table 2).
Here, using panel data on ND, changes in disease prevalence according to the total health expenditure level per capita were analyzed. ND prevalence, which is not fixed and changes over time, is important for understanding health expenditure. Diseases naturally have a stimulating effect on health expenditures. This effect is even higher for diseases associated with neuron damage. This is because diseases like dementia or epilepsy are typically complex long-term conditions requiring continuous care. When examining the determinants of health expenditures in the literature, the disease structure of the society or the rate of occurrence of diseases in the society is a factor that is known to have an effect but has not been empirically studied much. The long-term care requirement associated with neuron damage-related diseases, the high intensity of health technology used, the intensive labor and knowledge required, the need for continuous care, and the generally lifelong continuation of diseases can be listed as reasons for the high health expenditures in these diseases. Using this longitudinal data approach, this study intended to analyze the net effects of the ND by quantitatively analyzing the differences in the total HEP according to the PPP while controlling for differences in the demographic structure and economic level in OECD countries.
3.2. Estimation Strategy and Model Specification
The health expenditure determinants model used in the empirical analysis was adapted from the model by Xu, Saksena and Holly [
17], who investigated the determinants of health expenditure using country-level panel data analysis. The model (1) created to investigate the effect of ND on the health expenditure level in OECD countries is as follows:
Model (2) was created to investigate the effect of ND on the economic output level in OECD countries as follows:
Here;
lhep: logarithm of total HEP capita calculated according to PPP,
lhept−1: logarithm of the previous period value of total HEP capita calculated according to the PPP,
lgdp: logarithm of the real GDP per capita calculated according to the PPP,
lnd: logarithm of the prevalence value of total ND in the country,
lnd2: logarithm of the prevalence value of the working-age range ND in the country,
lage: logarithm of the proportion of the population aged 65 and over in the total population
linv: logarithm of the proportion of total investment in GDP in the country,
u: error term,
i: OECD countries (panel unit dimension),
t: Years (panel time dimension).
As stated before, many topics are dynamic in nature, meaning they are influenced by their previous values. Therefore, when investigating the impact of ND, it is important to consider dynamic models rather than static models for the reliability of the findings obtained. For this purpose, the analysis results will be presented using the Arellano–Bond (AB) GMM estimator, which is commonly used and popular in the dynamic panel literature. The dataset covers the period from 2000 to 2021 for 38 OECD countries.
Before the AB GMM estimation results, a test for multicollinearity among the independent variables in the model was conducted. The multicollinearity test for the multicollinearity issue was examined using the VIF (Variance Inflation factors). The VIF multicollinearity test results indicate that all values were calculated to be below the multicollinearity threshold value of five. Therefore, it can be concluded that there is no multicollinearity issue among the independent variables in the model.
Then, a test was conducted to examine whether there is a unit/time effect in the model. The most important reason for conducting this test is to see if the model differs from the classical model, in other words, to examine the presence of a unit or time effect in the model. The tests most used in the literature for testing unit or time effects are the F-test and the LR test. According to the conducted LR test for the unit/time effect, the LR test statistic is calculated as 199.9 with a probability value (p) of <0.001 for Model 1 and 84.34 with <0.001 p value for Model 2. Similarly, the F-test conducted for the unit effect yields an F-test with a probability value (p) of <0.001. These results indicate that there is at least one effect (either a unit effect, a time effect, or both effects together) present in the models. The F-test was conducted for the time effect. We found that the probability value (p) of the model is below 0.05. These results indicate that there is no time effect present in the models. Based on the results of the LR and F tests conducted to examine the presence of unit/time effects in the model, it is concluded that there are only unit effects in the models.
After that, a test was run to see if there was a correlation between the independent variables and the unit effects in the model. This test is being carried out in order to determine which estimator will be utilized for the estimation and to determine whether the model is suitable for dynamic model estimation. If the unit effect in the models is correlated with the independent variables, it would be appropriate to use fixed effects models and estimators containing a one-way unit effect, whereas if it is not correlated, it would be appropriate to use random-effects models and estimators containing a one-way unit effect to obtain unbiased and consistent results. The suitability of the model for fixed effects or random effects was examined using the Hausman test. According to the Hausman test results, the probability values (p) were calculated as <0.001. The null hypothesis of the Hausman test states that the coefficients are not systematically different, while the alternative hypothesis suggests that the coefficients are systematically different. Based on the result of the Hausman test, the null hypothesis (H0) is rejected. In other words, the coefficients are systematically different from each other. Therefore, the established models are fixed effect models containing one-way unit effects.
The AB GMM estimation method was used. In that method, the first stage involves transforming the differenced model with instrumental variables, and in the second stage, the estimation results are obtained using the Generalized Least Squares Method. Here, there is a two-step estimation process. In the first stage, it is necessary to assess the validity of the instrumental variable used instead of the variable causing endogeneity issues in the model, in other words, the representativeness of the instrumental variable. Second, it is necessary to test for second-order autocorrelation. Before interpreting the GMM-obtained panel regression estimation results, it is important to conduct some consistency tests. Three different tests were used for consistency, which include the Wald Chi-squared test, which tests the overall significance of the variables in the model; the Sargan test, which tests the validity of the instrumental variables used in the model; and the AB autocorrelation tests, which indicate whether there is an autocorrelation problem in the model. Second-order autocorrelation was examined using the AB autocorrelation test. According to the results of the residual analysis, the significance of the AR (1) terms (−13.66 *** and −5.20 ***) indicates the presence of first-order autocorrelation, while the insignificance of the AR (2) terms (p = 0.435 and p = 0.391) suggests the absence of second-order autocorrelation. The omitted variable problem has thus been evaluated, and based on the results of the residual test, the model is considered valid, showing that only first-order autocorrelation is present in the residuals, with no higher-order autocorrelation issues detected.
3.3. Arellano–Bond GMM Estimation Results
To address potential endogeneity issues in the explanatory variables, the lagged levels of these variables were used as instruments. In Model 1, various lag structures were tested to determine the most appropriate instrument structure for the lnd variable. Considering that its short-term effects may theoretically differ from those of health expenditures, the strength of the instrumental variables was evaluated at different levels. In light of the risks of overidentification and weak instruments, models with fewer lags were preferred among similar alternatives. However, taking into account the cumulative nature of health expenditures, all theoretically relevant lagged values were included in the model without exceeding the maximum number of observations per time unit (maximum = 21). In Model 2, similarly, the 2nd and 3rd lags of gross domestic product (GDP), as well as the 2nd to 8th lags of both health expenditures (lhep) and neurological disease prevalence (lnd)—that is, lag (lhep, 2:8) and lag (lnd, 2:8)—were used as instrumental variables. Through this specification, the aim was to minimize simultaneity bias while ensuring that the instruments were sufficiently correlated with the endogenous variables and uncorrelated with the error term. The validity of the instruments and the comparison of models with different lag structures were assessed using the Sargan test. According to the Wald chi-square test results, the model is statistically significant (
Table 3).
In Model 1, where the dependent variable is health expenditure (lhep), it is observed that the majority of the explanatory variables are statistically significant and in line with theoretical expectations. The lagged dependent variable (lhept−1) is statistically significant at the 1% level and positively signed (β = 0.6357, p < 0.001), indicating a strong persistence effect—i.e., the level of health expenditures in the previous year has a significant positive influence on current expenditures. Per capita income (lgdp) also has a statistically significant and positive effect on health expenditure (β = 0.3892, p < 0.001), which aligns with the income elasticity of demand for healthcare. Interestingly, the prevalence of neurological diseases (lnd and lndt−1) is also statistically significant at the 5% level (p = 0.0400 and p = 0.0403, respectively), and positively signed, suggesting that increasing ND prevalence is associated with higher healthcare spending. This implies that a 1% increase in ND prevalence is associated with approximately an 8.22% rise in health expenditure per capita (β = 8.2196). While this elasticity may appear large, it is important to note that the ND variable exhibits limited variation across countries and is measured on a narrow scale. Therefore, the magnitude of the coefficient likely reflects the compounding and persistent cost structures of chronic neurological conditions—such as dementia and epilepsy—which require intensive, long-term, and often high-tech medical care. In contrast, the variables representing the elderly population share (lage) and investment ratio (linv) show mixed results. While lage is not statistically significant (p > 0.05), linv is weakly significant at the 5% level (β = 0.0360, p = 0.0296), indicating that capital investment plays a moderate role in explaining healthcare expenditures.
In Model 2, where the dependent variable is economic output (lgdp), the most influential predictor is its own lagged value (β = 0.7059, p < 0.001), indicating a high degree of path dependency and confirming the autoregressive nature of GDP growth in OECD countries. This finding suggests that economic performance in a given year is largely shaped by the structural and macroeconomic conditions carried over from the previous period.
Health expenditure (lhep) is also positively and significantly associated with GDP (β = 0.8328, p = 0.0016), reinforcing the notion that spending on health is not merely a cost but also a productive investment in human capital and national output. This positive elasticity implies that a 1% increase in per capita health spending corresponds to an estimated 0.83% increase in GDP per capita, potentially reflecting gains from improved workforce productivity, reduced absenteeism, and stimulus to the healthcare sector itself. Conversely, the lagged health expenditure variable (lhept−1) has a negative and significant effect (β = –0.5666, p = 0.0347), which may reflect short-term crowding-out effects, where previous healthcare spending may temporarily displace other forms of investment or create fiscal pressures. The prevalence of neurological disorders among the working-age population also yields significant but directionally mixed results: while the contemporaneous ND prevalence (lnd2) is positively associated with GDP (β = 13.0064, p = 0.0414), its lagged value (lnd2t−1) is negatively associated (β = –15.8164, p = 0.0370). This asymmetric pattern could suggest a short-term economic stimulus effect due to increased healthcare service demand and public spending, followed by a longer-term decline in productivity as chronic neurological conditions erode labor force capacity and increase dependency ratios. The coefficient of gross capital formation (linv) is close to significance (β = 0.0909, p = 0.0991), indicating a weak but potentially positive association with output. Meanwhile, the aging population variable (lage) remains statistically insignificant (p = 0.2631), suggesting that, at least in the short term, the share of elderly population does not exert a strong direct effect on GDP per capita. However, this does not preclude indirect effects via healthcare spending channels. Overall, these findings highlight a dual mechanism: health investment appears to stimulate economic output, but neurological disease burden may impose a delayed economic drag, underscoring the importance of early intervention and prevention strategies targeting these conditions.
Due to the issue of weak instrument validity, the models in
Table 3 were re-estimated using the more robust and modern Blundell–Bond technique. This approach allowed for a comparison between the models, ensuring the consistency of the results.
3.4. Blundell–Bond System GMM Estimation Results
Table 4 presents the two-step GMM estimation results using the Blundell–Bond estimator. Model 1 considers health expenditure (lhep) as the dependent variable, while Model 2 examines economic growth (lgdp) as the dependent variable. In both models, the Windmeijer correction has been applied, and different instrumental variable structures have been employed. In Model 1, all lags of health expenditure are included as instrumental variables, and the prevalence of neurological diseases is instrumented from the 2nd to the 5th lag. In Model 2, GDP is instrumented from the 2nd to the 4th lag, all cumulative lags of health expenditure are used as instruments, and the prevalence of neurological diseases is instrumented from the 2nd to the 7th lag. The selection and validity of these models have been evaluated using autocorrelation and Sargan test statistics.
Lagged values of the ND variable were introduced as instruments alongside the lagged dependent variable to mitigate potential endogeneity. The Sargan test results (p = 0.1002 for Model 1 and p = 0.1364 for Model 2) confirm the validity of the chosen instruments, indicating no overidentification issues. Additionally, the absence of second-order autocorrelation (AR (2) p = 0.470 in Model 1 and p = 0.0721 in Model 2) supports the internal consistency of the dynamic panel structure. Although the AR (2) value in Model 2 is marginal, it remains above the 0.05 threshold. The Wald test results (p < 0.001 for both models) further confirm the joint significance of the explanatory variables.
In Model 1, where the dependent variable is healthcare expenditure (lhep), the results reveal a strong and persistent dynamic relationship, as reflected in the coefficient of the lagged dependent variable (β = 0.8605, p < 0.001). This suggests that healthcare expenditures are highly inertial and heavily shaped by past values, which is consistent with institutional budgeting cycles and the path-dependent nature of health system investments. Income per capita (lgdp) also has a positive and significant effect (β = 0.1289, p < 0.001), supporting the hypothesis that economic prosperity leads to greater health spending. Notably, both current and lagged ND prevalence (lnd and lndt−1) are statistically significant (p = 0.0431 and p = 0.0302, respectively), indicating that rising neurological disorder burden places upward pressure on healthcare expenditures. The estimated coefficients suggest that a 1% increase in ND prevalence is associated with a 3.8–4.1% change in health spending, highlighting the high cost-intensity of chronic neurological conditions. In contrast, aging (lage) and investment (Iinv) are not significant predictors in this model.
In Model 2, where the dependent variable is economic output (lgdp), the coefficient of the lagged dependent variable (β = 0.7983, p < 0.001) once again confirms the strong autoregressive nature of GDP growth. Health expenditure (lhep) has a positive and statistically significant effect on GDP (β = 0.5270, p < 0.001), suggesting that investment in health contributes to economic productivity, possibly through improved labor force participation and human capital. Interestingly, the lagged value of health spending (lhept−1) has a negative sign (β = −0.3685, p < 0.001), which may reflect short-term opportunity costs or delayed efficiency effects. Investment (Iinv) also emerges as a significant driver of growth (β = 0.1277, p = 0.0017). Regarding neurological disease prevalence, both lnd2 and its lag (lnd2t−1) are marginally significant at the 10% level (p = 0.0726 and p = 0.0593), and their opposing signs may imply a nonlinear or threshold effect—where short-term increases in disease burden stimulate healthcare-related activity, but long-term prevalence depresses economic output by reducing labor productivity. The aging variable (lage) is marginally significant (p = 0.0803), possibly indicating a modest positive association between an older population and economic output, potentially driven by healthcare-sector employment and consumption.
Overall, both models confirm the strong dynamic structure of the dependent variables and reveal meaningful associations between neurological disorder prevalence, health expenditures, and economic output. The use of the Blundell–Bond estimator provides a robust framework for understanding these relationships while accounting for endogeneity and instrument validity. Moreover, the nonlinear specification using squared ND prevalence terms (lnd2 and lnd2t−1) in Model 2 revealed marginal significance. The coefficient for lnd2 was β = 7.8518, SE = 4.3729, p = 0.0726, while the lagged term lnd2t−1 yielded β = −8.2236, SE = 4.3608, p = 0.0593. Although only weakly significant at the 10% level, these findings suggest a potential nonlinear relationship, implying that countries with higher neurological disorder burdens may face disproportionately greater economic costs—indicative of a threshold effect worth further investigation.
3.5. Subgroup Analysis: Developed vs. Developing OECD Countries
To further account for systemic heterogeneity in health and economic structures, we conducted subgroup analyses by classifying OECD countries based on key system-level indicators—namely GDP per capita and health expenditure per capita.
3.5.1. Cluster Identification and Group Differences
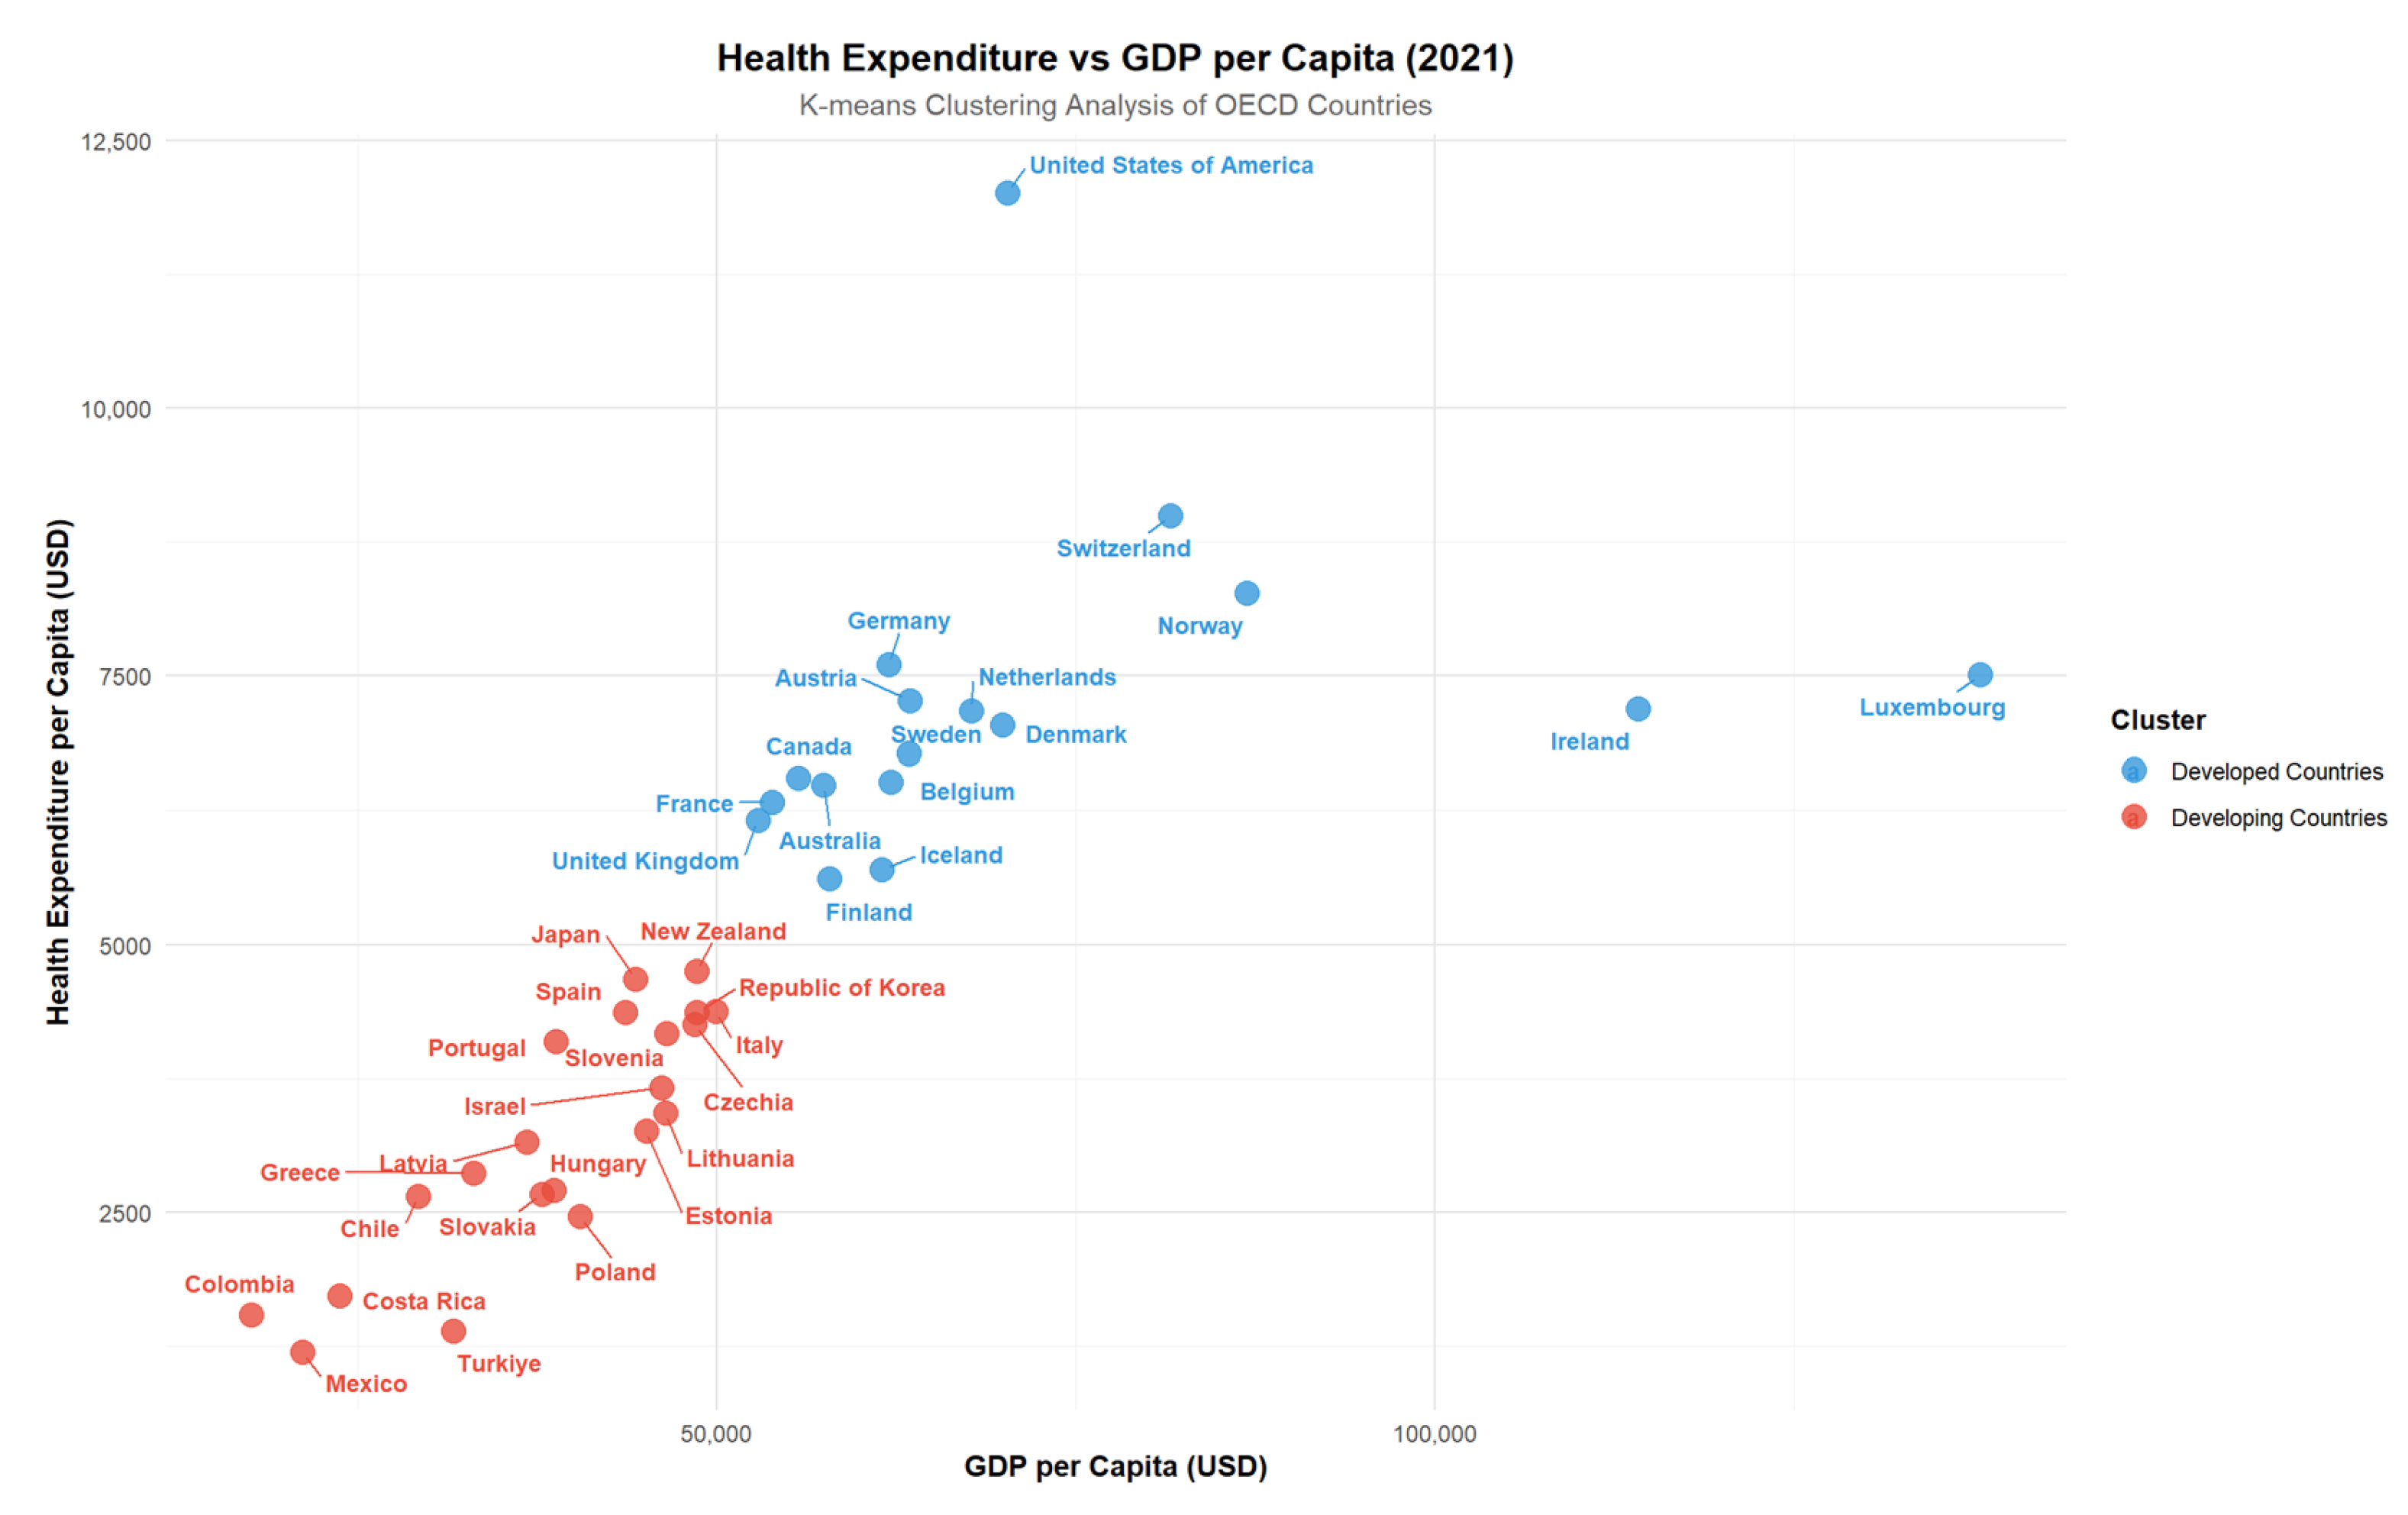
Using K-means clustering on the most recent 2021 data, countries were grouped into two distinct clusters representing developed and developing systems. This classification allowed us to evaluate whether the effects of neurological disorders on health expenditure and economic output vary across structurally different healthcare and economic systems. Such stratification enhances the interpretability of the models by reflecting how systemic capacity conditions the impact of disease burden.
The clustering analysis based on GDP and health expenditures for OECD countries in 2021 divided the countries into two distinct groups. Cluster 1 represents developing countries, while Cluster 2 corresponds to developed countries. Developed countries in Cluster 2, such as the United States, Germany, and Australia, exhibit higher GDP and health expenditures per capita. In contrast, developing countries in Cluster 1, including Turkey, Mexico, and Colombia, show relatively lower levels of GDP and health expenditures. This classification highlights the economic and healthcare expenditure disparities among OECD member states, offering a basis for subgroup analysis in evaluating the impact of neurological disorders on health expenditures and economic outcomes (
Figure 3).
3.5.2. GMM Results by Subgroup
Table 5 presents the results of four models estimated using the system GMM estimator, which examine the relationships between health expenditures and GDP per capita separately for clustered developed and developing countries. Each model includes the dynamic effect of the dependent variable along with key determinants such as health expenditures, the prevalence of neurological disorders, the age dependency ratio, and the investment rate. The optimal lag structure for the instrumental variables (IVs) used in the estimations was determined based on the results of the Sargan test, autocorrelation tests [AR(1), AR(2)], and the Wald test for overall model significance, in order to ensure model consistency and to avoid problems related to over-identification.
In Model 1, which examines factors affecting healthcare expenditures in developing countries, both lagged healthcare expenditures (β = 0.8753, p < 0.001) and GDP per capita (β = 0.1130, p = 0.0338) have statistically significant and positive effects. This indicates that health spending in these countries is highly path-dependent and also responsive to economic performance. In other words, current healthcare expenditures are shaped both by previous allocations and by the country’s economic capacity. Although the prevalence of neurological diseases (lnd) shows a positive coefficient (β = 0.2900), it is not statistically significant (p = 0.9341), possibly due to lower baseline prevalence or limited diagnostic infrastructure in developing contexts. The aging population variable (lage) is also not significant (p = 0.7261), indicating that age composition is not a primary driver of healthcare expenditures in these countries. Investment (Iinv) has a marginally positive effect (β = 0.0410, p = 0.1637), suggesting that capital formation may have some role in shaping healthcare infrastructure but is secondary to income and past spending.
In Model 2 for developing countries, lagged GDP (β = 0.7606, p < 0.001) and investment (β = 0.1322, p = 0.0059) emerge as key positive determinants of economic output. Healthcare expenditures (β = 0.4844, p = 0.0192) also have a moderate and significant positive impact, highlighting their role as a growth-enhancing input—likely by improving population health and labor productivity. Although the neurological disease variable (lnd2) has a negative coefficient (β = –2.9866), it is not statistically significant (p = 0.5751), which may reflect underreporting or data limitations in capturing disease burden accurately. Aging again appears to have no significant short-term impact on GDP (p = 0.4823). These findings underline the importance of investment and health system strengthening in boosting economic growth in lower-income OECD members.
In Model 3, which focuses on healthcare expenditures in developed countries, the only statistically significant determinant is the lagged dependent variable (β = 0.9269, p < 0.001). This strong persistence suggests that once a country reaches a certain threshold of healthcare spending, it tends to maintain or gradually expand it, regardless of annual variations in economic or demographic indicators. This inertia may reflect institutional budgeting processes, long-term infrastructure investments, and established population health management systems in advanced economies. The lack of statistically significant effects from current income, aging, or ND prevalence supports the idea that healthcare expenditures in developed countries are governed more by structural and policy-related mechanisms than by short-term pressures.
In Model 4, where the dependent variable is GDP in developed countries, the strongest determinant is again the lagged value of GDP (β = 0.8167, p < 0.001), highlighting the robust persistence of economic output in these contexts. None of the other explanatory variables—including healthcare spending (lhep), neurological disease prevalence (lnd2), investment (Iinv), or aging (lage)—show significant effects. This suggests that short-term changes in health conditions or investments may have limited immediate impact on economic performance in high-income countries, likely due to mature economies being more resilient and less sensitive to annual fluctuations in these domains.
3.5.3. Comparison of Coefficients Across Groups (Wald Z-Test)
According to the Wald Z-test findings, no significant difference was found between the groups regarding the effects of lagged healthcare expenditures (lhep
t−1), GDP (lgdp), neurological diseases (lnd), aging (lage), and investment (Iinv) on healthcare expenditures (
p > 0.05). Similarly, no significant difference was observed between the groups for the effects of lagged GDP (lgdp
t−1), healthcare expenditures (lhep), neurological diseases (lnd2), and aging (lage) on GDP. However, the effect of investment (Iinv) on GDP was found to be significantly higher in developing countries (β = 0.165) compared to developed countries (β = 0.052) (
p = 0.030) (
Table 6).
After clustering the countries into developed and developing groups, the significance of the variables lnd, lndt−1, lnd2, and lnd2t−1 diminished, which can be attributed to several factors. First, clustering reduces heterogeneity between the countries, causing them to become more similar, and potentially masking distinct dynamics such as those between health expenditures and economic growth in developed and developing nations. In the aggregated model, where all countries are considered together, neurological diseases had a significant impact. However, splitting them into subgroups may have reduced this effect due to the different nature of their economic and healthcare systems. Additionally, the statistical power of the model is reduced post-clustering, as each subgroup contains fewer observations, making it harder to detect statistically significant relationships. Finally, the structural differences in the way neurological diseases and healthcare expenditures interact with GDP across different income groups likely explain the loss of significance for neurological diseases in the clustered analysis. This suggests that the economic and healthcare dynamics in developed and developing countries differ significantly, and these differences might not be captured effectively by the clustered model.
4. Discussion
Understanding the dynamic relationships between health expenditure, economic output, and neurological disorders (NDs) requires a systems-based approach, as these variables are embedded within complex, evolving macroeconomic and healthcare structures. This study provides important insights into these relationships by employing robust dynamic panel data methods. Both the Arellano–Bond and Blundell–Bond estimations demonstrate the significance of lagged dependent variables, highlighting the persistent and evolving nature of these economic indicators. ND prevalence shows a significant positive impact on health expenditure, reflecting its economic burden on healthcare systems. However, its negative effect on economic output is statistically significant only in the Blundell–Bond results, highlighting the importance of estimator choice. The system GMM approach used in Blundell–Bond, by incorporating additional moment conditions, may better capture persistent dynamics and long-term effects, which the difference GMM method (Arellano–Bond) might underrepresent.
The findings show that a 1% increase in ND prevalence leads to a 0.04% rise in healthcare expenditure, consistent with theoretical expectations and illustrative of the economic burden posed by these conditions. This impact is multifaceted, operating through direct costs, indirect costs, and long-term societal effects. Direct costs include expenditures related to diagnosis, treatment, rehabilitation, and long-term care. For instance, multiple sclerosis (MS) imposes substantial costs due to specialized medical needs, frequent and prolonged hospitalizations, and increased medication use [
35]. These expenditures not only place a significant financial burden on individual households but also exert considerable pressure on national healthcare systems. Indirect costs arise from productivity losses linked to disability, premature mortality, and caregiving responsibilities. Neurological disorders such as MS, migraine, and epilepsy are associated with significant reductions in workplace productivity and increased absenteeism, reflecting their substantial global economic burden. Additionally, caregivers often encounter financial difficulties, as many reduce their working hours or leave employment entirely to provide care [
36,
37,
38]. These effects contribute to broader economic challenges by reducing workforce participation. The long-term societal impacts of NDs are profound, influencing demographic, economic, and social systems. Aging populations, disproportionately affected by NDs, contribute to increasing dependency ratios, a shrinking productive workforce, and greater demands on healthcare and social security systems. Moreover, the increasing burden of NDs places sustained pressure on national economies by increasing public health expenditures and reducing overall economic productivity [
39,
40].
Neurological disorders (NDs) significantly contribute to disability, with years lost to disability from neurological and musculoskeletal disorders surpassing all other disease categories [
28]. Among these, Functional Neurological Disorders (FNDs) have been identified as a substantial driver of healthcare resource utilization and associated economic costs. Although advancements in accurate diagnosis have shown potential to mitigate some of these costs, effective and cost-efficient treatments for FNDs remain elusive [
41]. The broader health burden of NDs stems largely from the long-term disability they cause, emphasizing the urgency of improving clinical management strategies and expanding research efforts. Without timely intervention, the global economic impact of neurological disorders is likely to intensify, posing significant challenges to healthcare systems and public health infrastructure worldwide [
6,
39].
A systematic review of 322 incidence and case series studies on epilepsy, a neurological disorder, published before 2014, included prospective consecutive patient recruitment and economic outcomes. According to the review’s findings, people with epilepsy, their families, and health systems all bear a heavy financial burden. All studies reviewed consistently associated the disease with substantial costs related to medications, outpatient medical consultations, and notably higher costs associated with ongoing seizures [
42]. Another study found that epilepsy sufferers incur 2.6 times higher health expenditures than those without epilepsy [
43].
A 2011–2031 projection study of the health and economic impacts of MS in Canada revealed that the total per capita healthcare cost (excluding out-of-pocket expenses) for adults aged 20 years in 2011 was approximately USD 2,500 for those without NDs and approximately USD 16,800 for those with MS. The total out-of-pocket expenditures of MS individuals were estimated to increase from USD 126 million in 2011 to USD 170 million in 2031. Furthermore, it is predicted that the economic burden on the health system and society will increase significantly, despite a slight increase in MS prevalence in the next 20 years [
44].
The results of the study indicate that the total cost of dementia in the UK is estimated to increase from £23.0 billion in 2015 to £80.1 billion by 2040. It is estimated to reach £80.1 billion by 2040, while the average annual per capita cost is expected to increase from £35,100 in 2015 to £58,900 in 2040. Conversely, the total cost of dementia is estimated to increase from 0.8% to 1.9%of GDP between 2015 and 2040 [
45]. The high prevalence of dementia in South Korea, coupled with the rapid rise in the elderly population, has led to an excessive burden on health expenditures. The study revealed that medical expenses for dementia patients were significantly higher than that for those without. Dementia patients over 70 years of age spent approximately 2.4 times more money per person (76,972 thousand won) compared to nondementia patients (31,105 thousand won) [
46]. The study demonstrated that the annual healthcare costs of dementia patients increased by approximately 6–7 years following the diagnosis [
47].
In 2018, the average annual Medicaid payments for Medicare beneficiaries without Alzheimer’s or other dementias in the USA were (USD 365), while the average annual Medicaid payments for individuals with Alzheimer’s or other dementias were (USD 8565), which 23 times higher [
48]. According to the results of many studies in the literature, dementia imposes enormous and unsustainable burdens on individuals, families, communities, health systems, and state administrations [
49]. The estimated annual cost of dementia worldwide is 604 billion USD. Imagining such a figure, which corresponds to approximately 1% of the world GDP, is difficult. Therefore, if all the economic burden caused by dementia could be fit into a country, it would be the 21st largest economy in the world, its size somewhere between Poland and Saudi Arabia [
50].
The rising prevalence of PD, like other NDs, places a significant burden on society and the healthcare system [
51]. In 2017, the estimated total economic burden of PD in the US was USD 51.9 billion, including direct medical costs of USD 25.4 billion and indirect and nonmedical costs of USD 26.5 billion. According to projections, the number of people with PD will increase from 1.04 million in 2017 to 1.6 million by 2037, representing a total increase of 58%. The total economic burden will exceed USD 79 billion by 2037 [
52].
The study discovered a statistically significant positive correlation between GDP per capita and health expenditure. A 1% increase in income level leads to a 0.0508% increase in health expenditure (
p < 0.05). This finding indicates that as individuals’ income increase, they tend to spend and invest more on healthcare. This is consistent with economic theories and the health capital model, supporting the view that increases in income levels cause higher health expenditures. Health capital plays a crucial role in the health demand model developed by Grossman [
53]. According to Grossman’s model, health is seen as an investment that enhances the quality of life and productivity in individuals. Considering that individuals tend to allocate more resources to this investment s their income rises, an increase in health expenditures is expected. Similarly, developed countries spend a significant portion of their GDP on health services, as they believe that health is an important driver of economic development. A large body of literature empirically demonstrates the long-run relationship between GDP and health expenditures. This is performed by usually taking data from the OECD countries. The results of this study are comparable to those of other studies that use GDP per capita as a significant factor to explain why overall health expenditures vary from one country to another. Newhouse (1977), the pioneer of exploring the relationship between these two variables in the literature, found that GDP per capita can explain more than 90% of health expenditure differences between developed countries [
54]. Similarly, a recent study found that HEP capita of a nation is significantly and positively correlated with the national GDP [
55]. In a study examining the impact of GDP per capita on health expenditures across 27 EU member states from 2000 to 2018, it was concluded that GDP positively affects health expenditures [
56]. Another study aimed at investigating the long-term effects of GDP on health expenditures in 21 OECD countries during the 1992–2018 period found a positive and enduring relationship between GDP per capita and health expenditures. This suggests that rising GDP per capita eventually results in increasing health expenditure [
56]. Using a panel of OECD nations from 1971 to 2004, Baltagi and Moscone (2010) examined the long-term economic relationship between income and health expenditures and estimated that the income elasticity of health expenditures was 0.446. Thus, they concluded that health expenditures are a necessity, with a 1% increase in countries’ income levels resulting in a 0.446% increase in health expenditures, thereby supporting the conclusion of positive relationship observed in similar studies [
18].
The study concluded that the proportion of the elderly population in society has a statistically significant and positive effect on health expenditures. Specifically, a 1% rise in the proportion of the elderly population triggers a 0.0137% increase in health expenditures (
p < 0.05). This finding underscores the impact of demographic shifts on health expenditures and highlights the strain of an aging population on healthcare systems. Similarly, the existing literature emphasizes the influence of demographic changes on health expenditures. These studies consistently find that per capita health expenditures are generally higher among the elderly compared to younger age groups, particularly within the healthcare systems of developed countries. For instance, a study using panel data analysis to investigate data from 2000 to 2013 in. OECD countries aimed to estimate the determinants of health expenditures. It concluded that the most significant determinants in these countries are GDP per capita and the population aged 65 and over [
57]. Another study examining the impact of aging on nations highlighted that the elderly tend to utilize health services more than younger demographics. The study emphasized the significant effect of this demographic change on health spending, particularly as the percentage of the population that is elderly keeps increasing. It stated that rising healthcare costs are a result of the world’s aging population [
58]. In another study examining factors explaining Asian countries’ health expenses, it was concluded that GDP and the aging population are the two significant primary variables [
59].
This study used panel data from various countries to identify the determinants of health expenses, revealing a significant and positive relationship between both variables and health expenses. Essentially, as the national income of these countries increases, health expenditures also rise. Similarly, health expenses would increase with the increase in the proportion of the elderly population increases [
59]. Another study that underscores the impact of the elderly population on long-term care expenditures found that the annual increase in health expenses due to an aging population can reach up to 1%. This rise is primarily attributed to the high costs associated with long-term care services, such as home care, rehabilitation centers, and palliative care services required by the elderly population [
26]. Additionally, a study using current expenditure data from the EU revealed that average health expenditures are generally higher for older age groups. However, it suggests that the aging population itself is not the primary driver of health expenditure growth. According to the study, policy initiatives that are specific to the demographic makeup of the population can help control rises in health costs that are caused by the elderly population [
60].
The world’s aging population and the increasing prevalence of neurodegenerative diseases such as epilepsy, MS, dementia, Alzheimer’s disease and PD challenge the healthcare system in a number of ways. Advances in bioinformatics and biomedical research are enabling the understanding of neurodegenerative disorders [
61]. As supported by the findings of this study, modern medical technology is an important determinant of the rise in health expenses. Investments in new medical technology change the rate of cost increase in health expenditures by approximately 25–75%. On the other hand, since investments in health technologies can also help extend patients’ life expectancy with life-threatening or chronic conditions, they may lead to higher health expenses as individuals can benefit from health services for many years [
24].
The findings of this study highlight the economic and healthcare implications of NDs across OECD countries. When countries were grouped by development level, the previously significant effects of neurological disorders lost their statistical strength. This may be due to reduced variation and smaller sample sizes within each group, which limits the ability to detect meaningful relationships. It also suggests that the impact of neurological diseases on economic outcomes may differ across income levels. While the analysis effectively captures critical factors such as GDP, investment, and demographic characteristics, the inclusion of additional variables could further enrich the discussion and contextualize the results. The determinants of healthcare expenditure (HCE) growth encompass a wide range of factors, including socio-demographic, economic, technological, environmental, and lifestyle determinants, alongside changes in disease patterns and health system characteristics [
21,
62]. Existing literature underscores the impact of health system characteristics such as public versus private service provision, the structure of financing mechanisms (e.g., tax-based versus social insurance systems), and provider payment models like fee-for-service versus capitation, all of which shape expenditure levels. Additionally, external funding sources and healthcare workforce density exhibit varying effects on spending, influenced by contextual factors such as income level and system efficiency [
17]. Sociocultural dimensions, including health-seeking behaviors and societal attitudes toward healthcare utilization, may also play a pivotal role [
21,
25]. Behavioral factors influencing healthcare expenditure, such as calorie intake, fat intake, and alcohol consumption have been examined in a limited number of studies conducted in OECD countries [
63].
These factors, while not included in the current analysis due to data availability constraints, highlight areas for potential exploration in future research. Future studies could provide a more nuanced perspective by incorporating variables such as healthcare efficiency, insurance coverage rates, and cultural determinants. Such expansions would complement the current findings and further clarify how system-level and behavioral factors interact with the economic implications of NDs. Importantly, this study contributes to addressing a notable gap in the literature by providing robust evidence on the aggregate economic burden of NDs, emphasizing the need for targeted interventions and policy reforms. While including additional variables could enhance the level of detail in future analyses, the present study offers a crucial step forward in understanding the intersection of health expenditures, economic outcomes, and neurological disorders.
Our findings point toward potential threshold effects in how neurological disorder prevalence translates into increased health expenditure. Specifically, the significant nonlinear term detected in the system GMM model implies that countries with already high ND prevalence may experience disproportionately higher financial burdens. This nonlinear pattern highlights the possibility that healthcare costs do not rise at a constant rate but may accelerate as disease burden increases, further reinforcing the need for early intervention and strategic resource allocation. Moreover, it would be valuable to conclude future research by exploring alternative methodological approaches to build upon these findings. Given the structure and scope of the dataset, future studies could investigate the application of machine learning models to predict health expenditure trends related to neurological disorders or to identify nonlinear patterns that may be overlooked by traditional Generalized Method of Moments (GMM) approaches. Such efforts would provide continuity to the research from both a technical and applied perspective, thereby enriching the understanding of the economic impacts of neurological disorders.
5. Limitations
This study offers valuable insights into the economic implications of neurological disorders (NDs) across OECD countries; however, certain limitations should be noted. Although the dataset was well-prepared and balanced to ensure consistency, inherent differences in data collection practices and healthcare systems among countries may introduce subtle variations. The dataset used in this study covers the period 2000–2021, which includes the onset of the COVID-19 pandemic. However, the post-pandemic effects on healthcare expenditures and the economic burden of neurological disorders may not yet be fully captured due to delays in data collection and reporting. Future research with more recent data could provide a clearer understanding of the pandemic’s long-term implications. Additionally, such data may highlight the interconnected nature of communicable and non-communicable diseases, such as neurological disorders, and how acute public health crises can worsen chronic disease burdens through delayed diagnoses, disrupted care, and increased patient vulnerability.
The use of advanced dynamic panel data techniques, such as Arellano–Bond and Blundell–Bond GMM, has strengthened the reliability of the results. Nevertheless, as with any method relying on instrumental variables, the robustness of the findings depends on the strength and validity of these instruments. While every effort was made to select appropriate instruments, this aspect remains a potential area for further exploration. In particular, while the GMM estimation effectively addresses the endogeneity of the lagged dependent variable, it may offer limited control over potential endogeneity in other explanatory variables. This reflects a broader methodological constraint of relying primarily on internal instruments within dynamic panel settings, especially in the absence of strong and valid external instruments. Although the selected approach is widely accepted and suited to the study’s structure and data characteristics, future research could benefit from complementing it with additional techniques—such as external instrumentation or control function approaches—to better capture complex relationships involving variables like healthcare expenditures or broader economic indicators. Further assessment of instrument validity would also enhance the overall robustness and interpretability of such empirical findings.
Additionally, the study focuses on macroeconomic indicators to provide broad policy-relevant conclusions but excludes country-specific healthcare strategies or interventions, which may offer additional context. Future research could consider incorporating healthcare system characteristics, such as insurance coverage rates, government health expenditure, and system efficiency, as well as cultural factors like health-seeking behaviors and societal attitudes toward healthcare utilization, to provide a more nuanced understanding of health expenditures in relation to neurological disorders. Lastly, the logarithmic transformation applied to the variables supports interpretation and reduces the impact of outliers; however, it assumes proportional relationships and may overlook nonlinear or threshold effects that could exist. These considerations do not weaken the validity of the findings but rather highlight directions for future studies to expand and refine the current findings.
6. Conclusions
The rising prevalence of neurological disorders (NDs) significantly contributes to increased healthcare expenditures and imposes a substantial economic burden on society. This study confirms the theoretical expectations that NDs, especially those associated with neuron damage, impose a substantial economic burden on society. Addressing this issue requires a multifaceted approach that includes preventive measures, increased research funding, enhanced healthcare infrastructure, integrated care models, and policy reforms. Given the lack of studies on the effects of NDs on health expenses in the literature, the economic effects of NDs on the health system were evaluated on a disease basis, including MS, dementia, Alzheimer’s disease, and PD. The findings of the studies in the literature support our conclusions. It is evident that NDs increase health expenditures and impose significant economic burdens on societies, both when evaluated individually and considering the total effect on the health system.
The growing prevalence of neurological disorders (NDs) continues to place significant pressure on healthcare systems and economies, necessitating proactive and context-specific strategies to mitigate their impact. Investing in preventive healthcare and early detection programs is crucial for reducing the long-term costs associated with advanced disease stages. These efforts could include public awareness campaigns, routine screenings, and genetic counseling, which not only lessen the burden on healthcare systems but also improve patient outcomes. Advancing medical research into the causes, prevention, and treatment of NDs is another priority. Increased funding in this area could lead to more effective treatments and potentially curative therapies, alleviating both the healthcare and economic burdens associated with these diseases. At the same time, enhancing healthcare infrastructure—such as training additional neurology professionals and improving access to specialized care in rural and underserved regions—is critical for meeting the needs of ND patients. Integrated care models that combine medical, psychological, and social support can further improve patient outcomes while optimizing resource use.
This study emphasizes the need for tailored strategies that address the unique characteristics of OECD countries. For instance, nations with higher GDP per capita could focus on investing in advanced medical technologies and integrated care systems, which have been identified as significant drivers of health expenditures. Meanwhile, countries with aging populations should prioritize cost-effective long-term care solutions and expand geriatric healthcare services to address the rising prevalence of age-related neurological conditions. Preventive initiatives, including public education campaigns and early diagnosis programs, should also be adapted to reflect the specific prevalence and cost dynamics of diseases like dementia, Parkinson’s disease, and multiple sclerosis across different contexts.
Furthermore, the integration of economic models, such as the Arellano–Bond and Blundell–Bond models, provided a system-level lens to explore how economic and health domains interact dynamically, enabling policymakers to capture both feedback loops and lagged effects of disease burden. These models provide valuable insights into how countries with varying economic statuses are affected differently by NDs, underlining the importance of considering income level and healthcare system efficiency in policy development. By grounding recommendations in empirical findings and adapting them to diverse healthcare systems and economic conditions, policymakers can develop sustainable and effective responses to the challenges posed by NDs. Strategies such as cost-effectiveness analyses and informed resource allocation are essential to achieving a balance between healthcare expenditure and economic growth, ensuring the sustainability of healthcare systems while improving the quality of life for those affected. Recognizing the broader implications of NDs and integrating them into long-term healthcare planning is imperative as we strive to address this growing global concern.


 ,
, 

