

Fostering the “Performativity” of Performance Information Use by Decision-Makers through Dynamic Performance Management: Evidence from Action Research in a Local Area


Abstract
1. Introduction
2. Performance Management in Local Areas under Dynamic and Complex Conditions: A Performative Perspective to the Use of Performance Information
3. System Dynamics for “Performative” Performance Management
4. Experimenting with System Complexity: Challenges in the Design of SD-Based Interactive Learning Environments
5. Using an SD-Based Interactive Learning Environment for “Performative” Performance Management: Evidence from Action Research in a Local Area
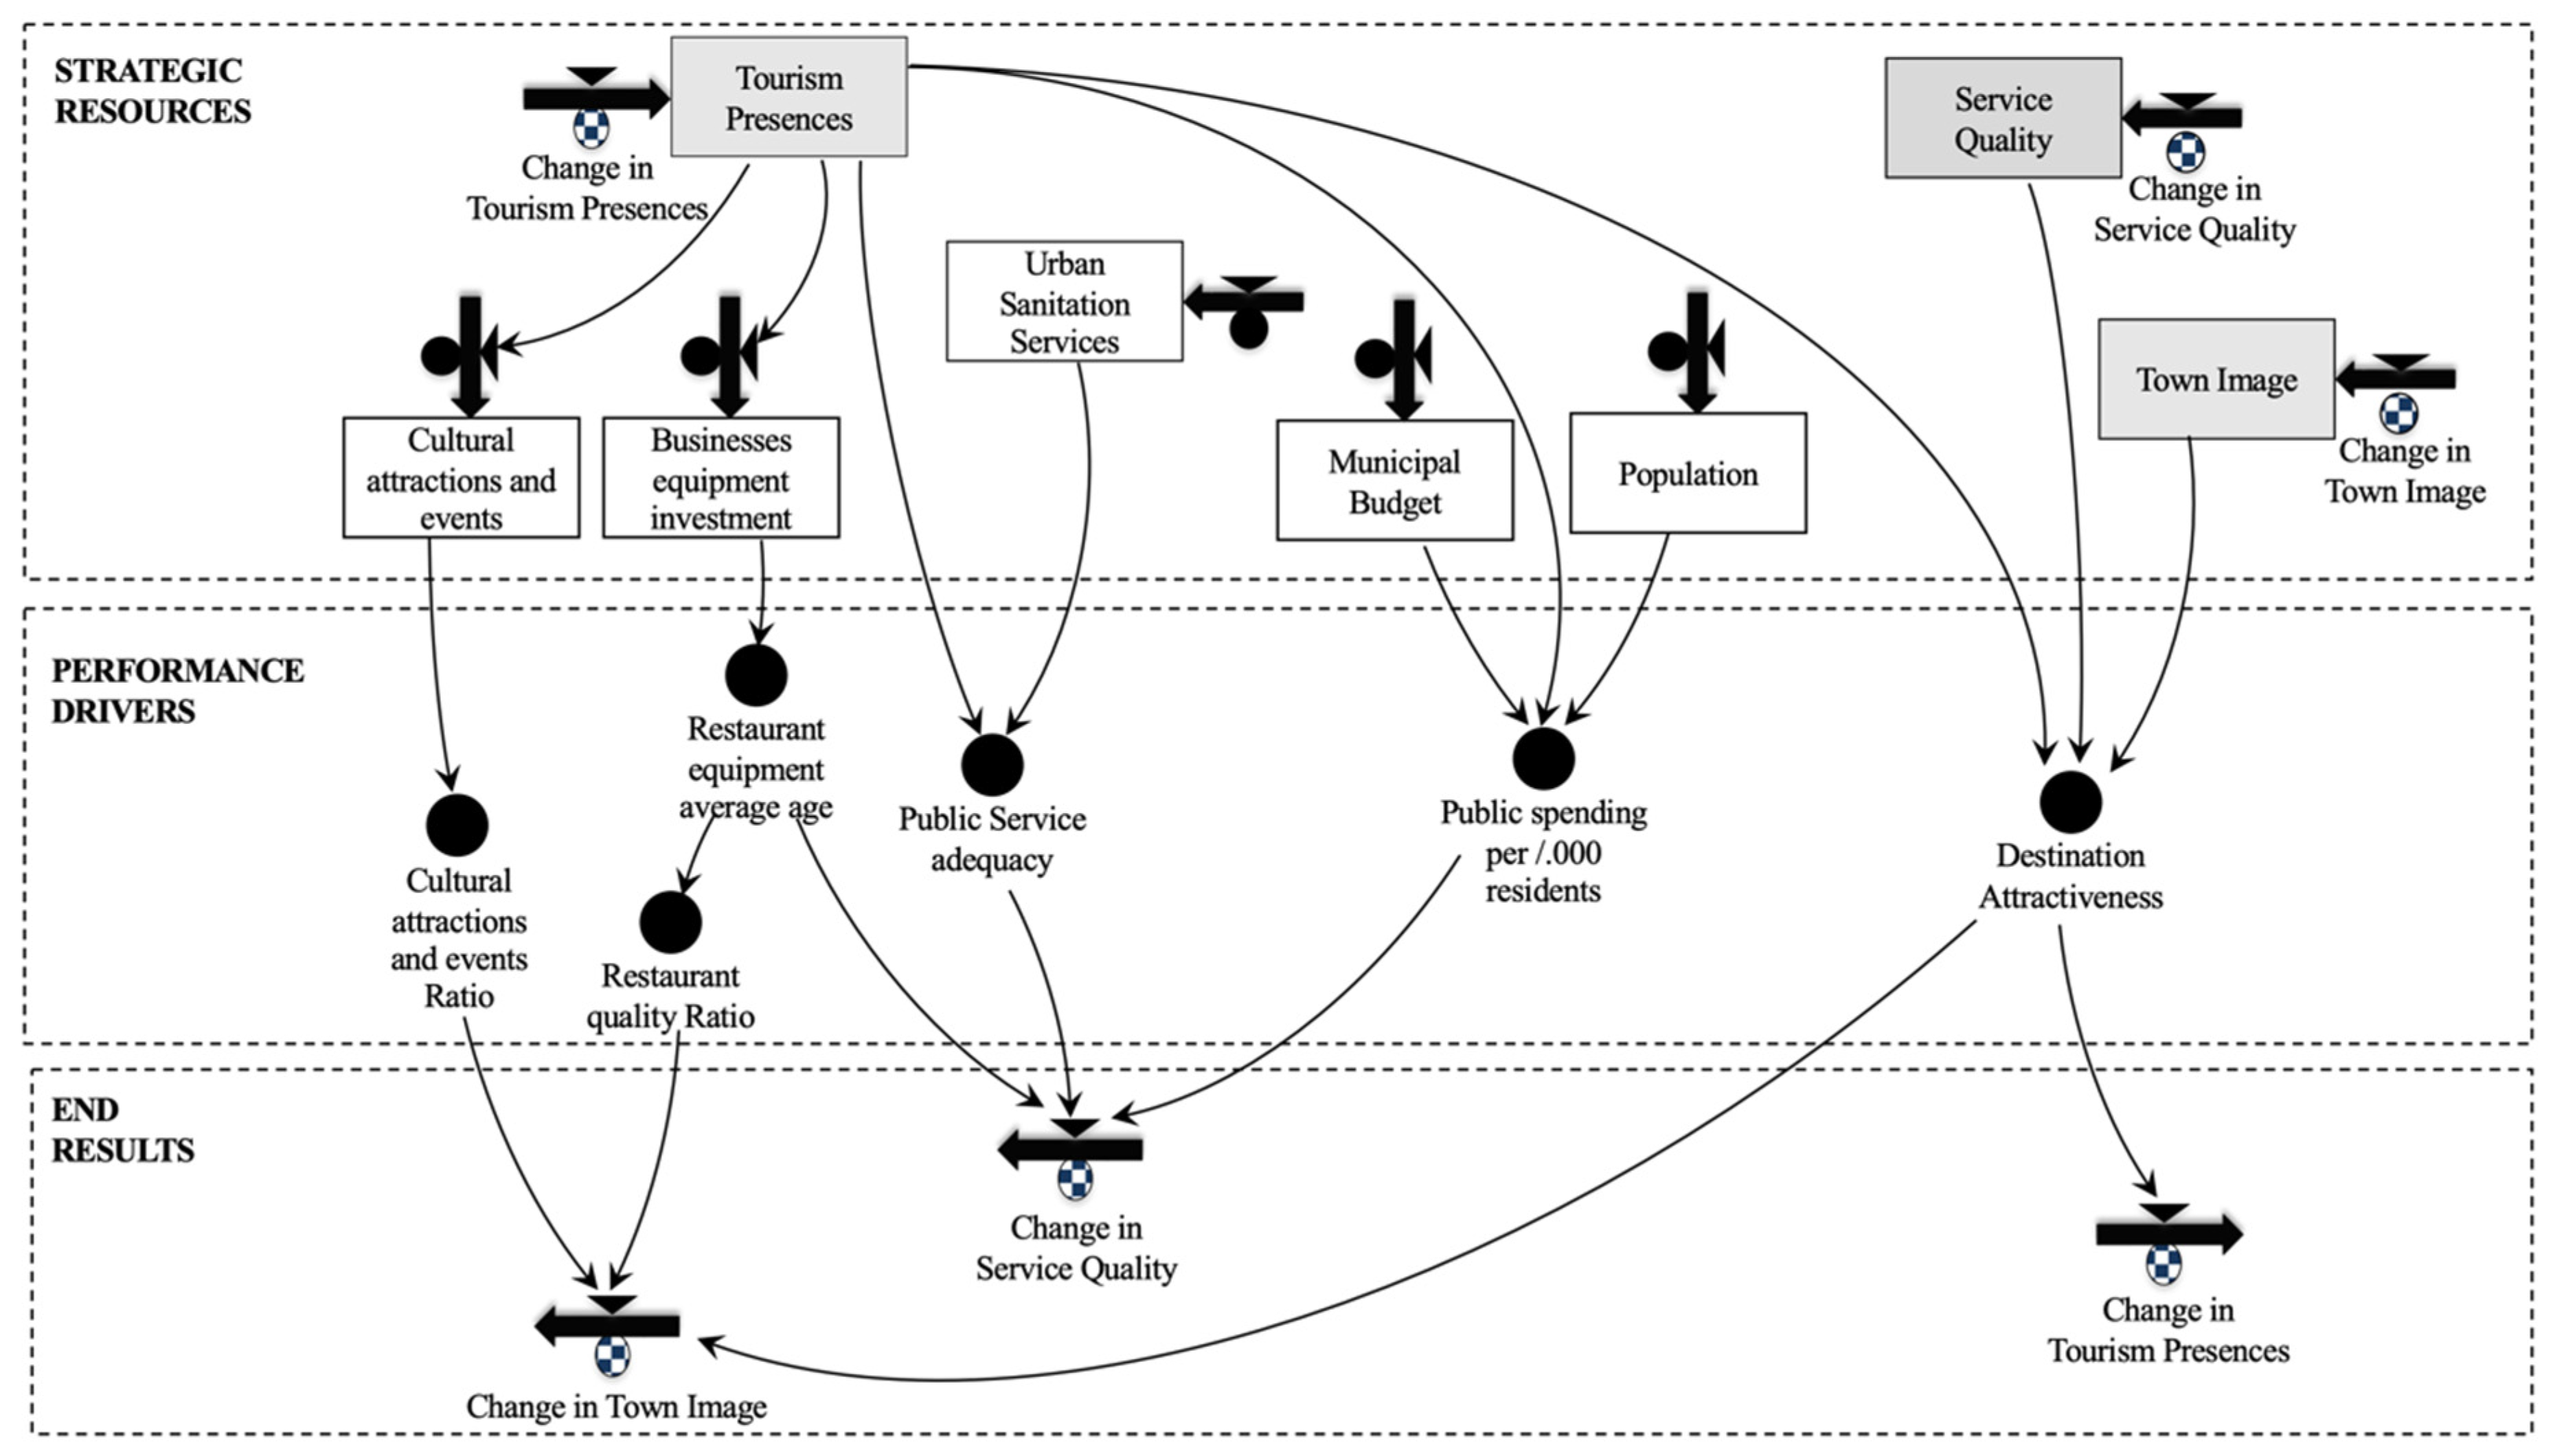
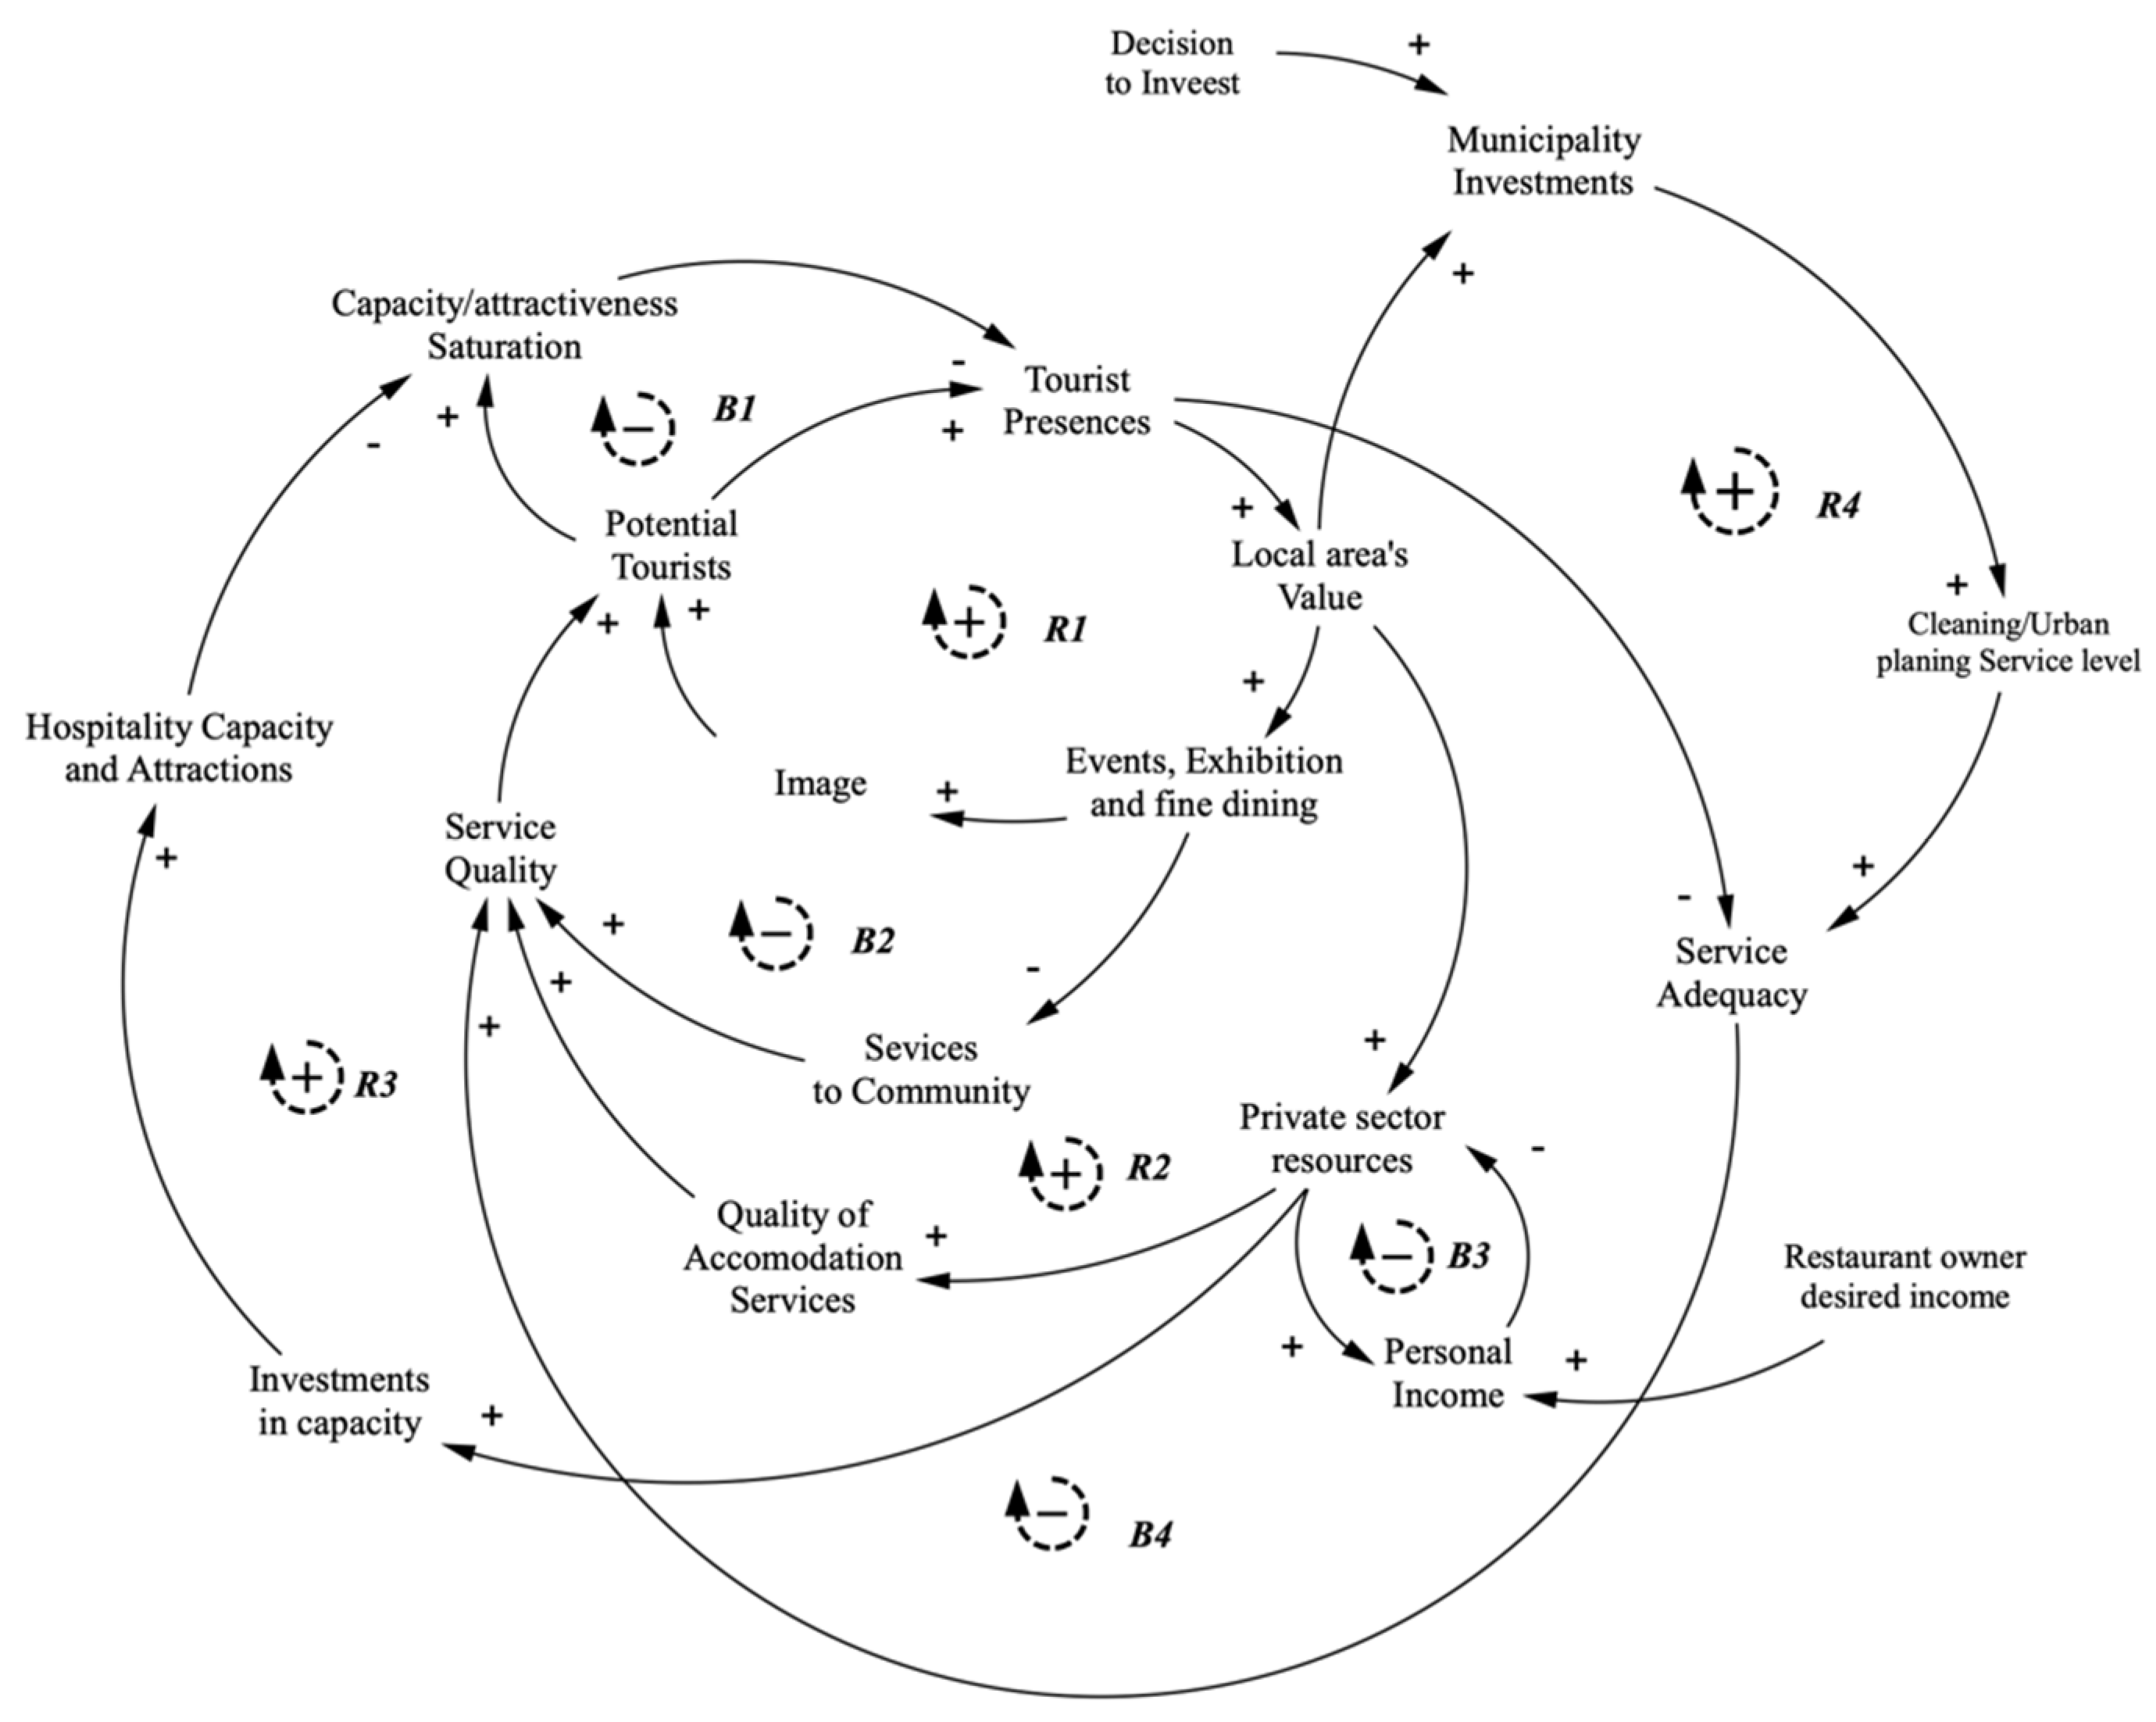
5.1. The Model Structure as a Causal Loop Diagram
5.2. The Interface of the ILE
5.3. The Action Research Process
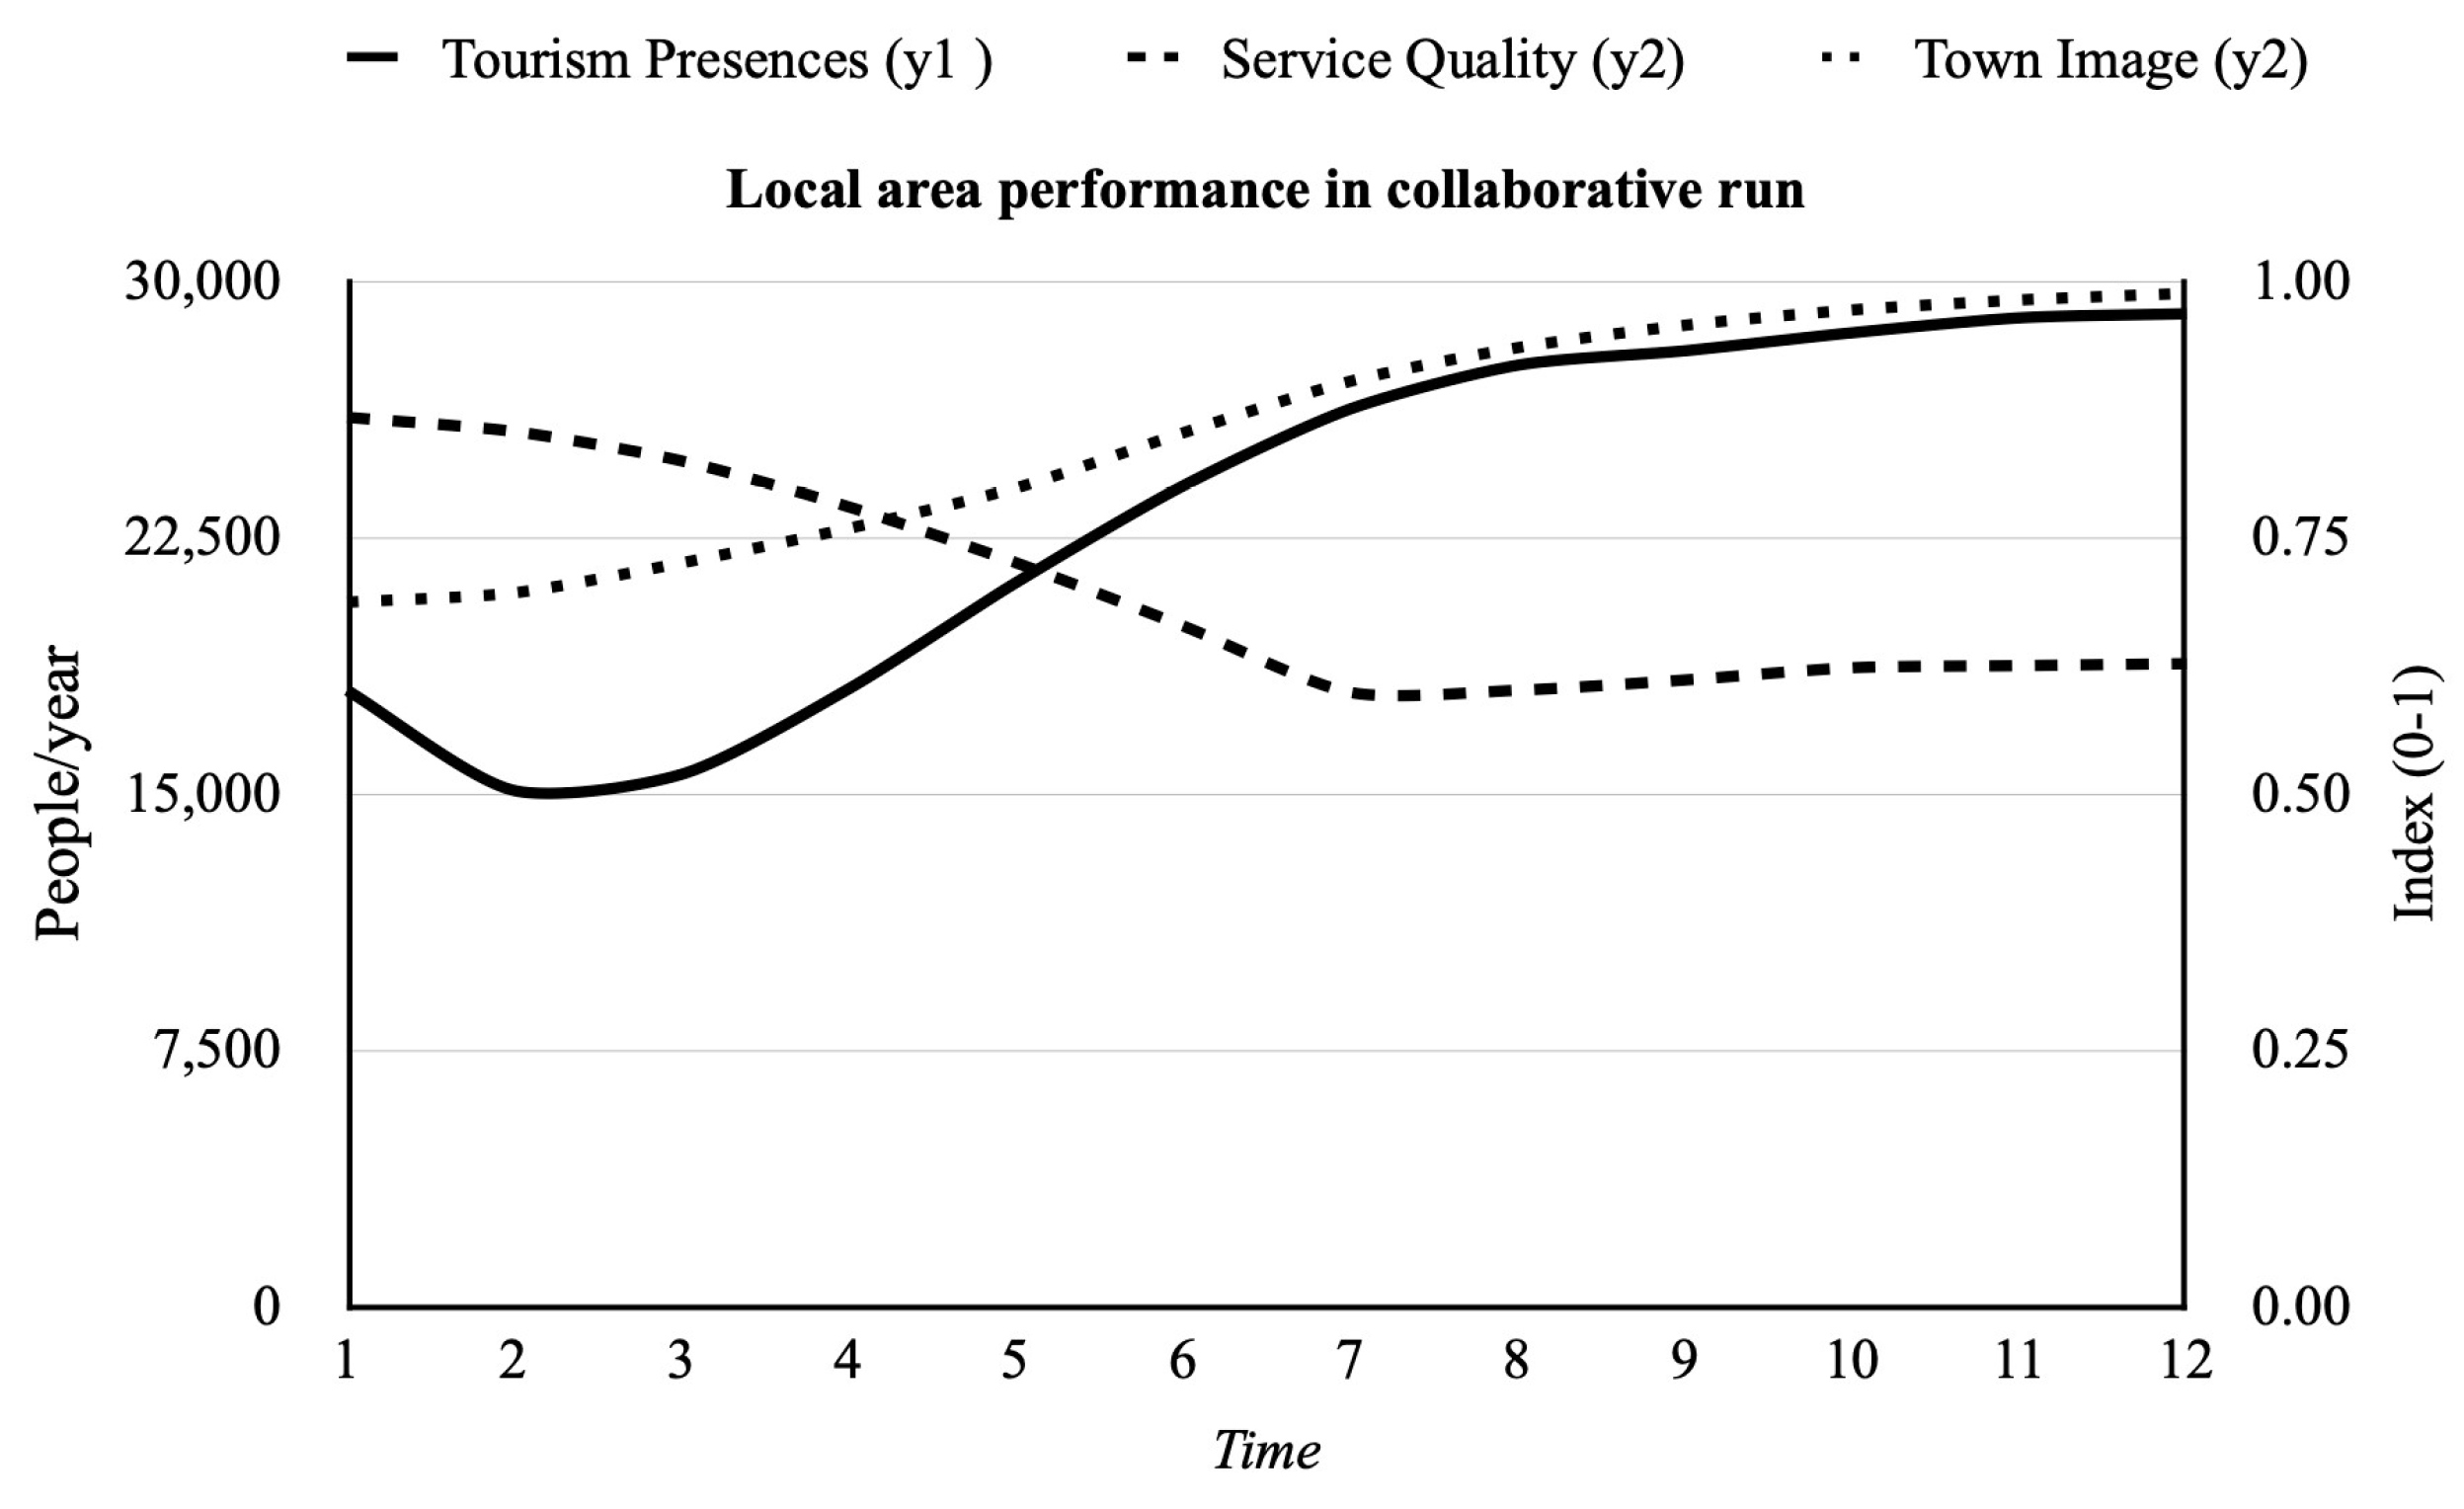
5.4. Simulation Outputs
6. A Dynamic Performance Approach to Foster the “Performativity” of Performance Information Use by Decision-Makers in Inter-Institutional Settings
7. Conclusions
Author Contributions
Funding
Data Availability Statement
Conflicts of Interest
Appendix A. Simulation Model Overview: Full List of Model Variables, Equations, Properties, and Unit of Measures
Model modules | |||
| Business Sector | |||
| Variable Name | Equations | Properties | Units |
| Equipement_and_Store(t) | Equipement_and_Store(t − dt) + (Renovation − Obsolescnce_rate) × dt | INIT Equipement_and_Store = Initial_Equi_and_store_level | EUR |
| Hospitality_Capacity(t) | Hospitality_Capacity(t − dt) + (Construction_Rate − Obasolescence_rate) × dt | INIT Hospitality_Capacity = Desired_Capacity | bed |
| Loan(t) | Loan(t − dt) + (New_loan − repayment_rate) × dt | INIT Loan = 0 | EUR |
| Long_term_Investments(t) | Long_term_Investments(t − dt) + (From_private_money + From_Loan) × dt | INIT Long_term_Investments = 0 | EUR |
| On_ordering_Capacity(t) | On_ordering_Capacity(t − dt) + (Starting_costruction − Construction_Rate) × dt | INIT On_ordering_Capacity = ON_orderring_Capacity_DESIRED | bed |
| Private_Funds(t) | Private_Funds(t − dt) + (Revenues − Spending − From_private_money − Personal_Expenses) × dt | INIT Private_Funds = Revenues/Avg_markup | EUR |
| Tot_cust(t) | Tot_cust(t − dt) + (change_in_tot_customer) × dt | INIT Tot_cust = STD_person_to_follow_high_quality_restaurants + Customers | people/year |
| change_in_tot_customer | (total_customers-Tot_cust)/1 | people/(year-yr) | |
| Construction_Rate | On_ordering_Capacity/AVG_Constriction_Time | bed/yr | |
| From_Loan | GaP × Fraction_from_loan | EUR/yr | |
| From_private_money | GaP × Fraction_to_invest_in_a_new_project | EUR/yr | |
| New_loan | From_Loan | EUR/yr | |
| Obasolescence_rate | Hospitality_Capacity/15 | bed/yr | |
| Obsolescnce_rate | Equipement_and_Store/AVG_lifetime | EUR/yr | |
| Personal_Expenses | Desired_Personal_income | EUR/yr | |
| Renovation | EQ_ADJ | EUR/yr | |
| repayment_rate | Loan/15 | EUR/yr | |
| Revenues | Earnings_from_operation | EUR/yr | |
| Spending | Renovation + Total_Costs + Interest_spending + repayment_rate + Fix_Costs + Networking_expenses | EUR/yr | |
| Starting_costruction | MAX(TOTAL_Capacity_ADJ;0) | bed/yr | |
| Actual_level_of_Equipment_and_Store | Equipement_and_Store/Initial_Equi_and_store_level | Unitless | |
| Actual_person_follow_quality | IF(TRND_arrivals < 0) THEN(Effect_of_perfceived_quality_on_ST_person_to_follow_quality_rest × STD_person_to_follow_high_quality_restaurants) ELSE(Effect_of_perfceived_quality_on_ST_person_to_follow_quality_rest × STD_person_to_follow_high_quality_restaurants) | ||
| AVG_Constriction_Time | 3 | year | |
| AVG_lifetime | 10 | year | |
| Avg_markup | 2.4 | Unitless | |
| AVG_price | 40 | EUR/people | |
| AVG_spending_per_customer | Total_Costs/Tot_cust | EUR/person | |
| AVG_Unit_cost | AVG_price/Avg_markup | EUR/people | |
| AVG_working_Days | 280 | per year | |
| Benchmark | AVG_price/1.6 | EUR/person | |
| Capacity_equivalent | Hospitality_Capacity × AVG_working_Days | bed/yr | |
| Capacity_GAP | Desired_Capacity-Hospitality_Capacity | bed | |
| Cpèacity_ADJ | (Capacity_GAP/Time_to_correct) + Perceived_Obs_rate | bed/yr | |
| Credit_Line | IF(Private_Funds < 0) THEN(Private_Funds × −1) ELSE(0) | EUR | |
| Customers | Shared_Resources.arrivals × Probability_to_eat_in_a_Resaturants | person/yr | |
| Desired_Capacity | Goal | bed | |
| Desired_investment | 50,000 | EUR | |
| Desired_Personal_income | 30,000 | EUR/year | |
| Earnings_from_operation | total_customers × AVG_price | EUR/yr | |
| Effect_of_perfceived_quality_on_ST_person_to_follow_quality_rest | GRAPH(perceived_quality) Points: (0.000, 0.500), (0.200, 0.561093247588), (0.400, 0.647909967846), (0.600, 0.747588424437), (0.800, 0.872990353698), (1.000, 1.02090032154), (1.200, 1.17202572347), (1.400, 1.31028938907), (1.600, 1.41961414791), (1.800, 1.48392282958), (2.000, 1.500) | Unitless | |
| Effect_of_price_on_probability | GRAPH(SMTH1(Price_Ratio;1.5)) Points: (0.500, 1.3000), (0.650, 1.2459807074), (0.800, 1.18424437299), (0.950, 1.10964630225), (1.100, 0.996463022508), (1.250, 0.844694533762), (1.400, 0.741800643087), (1.550, 0.659485530547), (1.700, 0.579742765273), (1.850, 0.536012861736), (2.000, 0.512861736334) | Unitless | |
| effetc_of_Long_termi_porjects_on_capacity | GRAPH(SMTH1(Municipality.Completed_Projects;2)) Points: (0.000, 1.0000), (2.000, 1.3536977492) | Unitless | |
| EQ_ADJ | (Equipment_and_store_gap/Time_to_close_the_gap) + Obsolescnce_rate | REPORT IN TABLE AS FLOW | EUR/yr |
| Equipment_and_store_gap | (Private_desired_EQ_store_level × Initial_Equi_and_store_level)-Equipement_and_Store | EUR | |
| Fix_Costs | (55,000 × (AVG_working_Days/160)) + (unit_fixed_per_cust × Customers) | EUR/year | |
| Fraction_from_loan | 1-Fraction_to_invest_in_a_new_project | per year | |
| Fraction_to_invest_in_a_new_project | 0.2 | per year | |
| GaP | New_investment_switch × (Desired_investment-Long_term_Investments) | EUR | |
| Goal | 200 × effetc_of_Long_termi_porjects_on_capacity × Long_term_Investement_ratio | bed | |
| Gross_Profit_or_Losses | Revenues-Spending | REPORT IN TABLE AS FLOW | EUR/yr |
| Initial_Equi_and_store_level | 150,000 | EUR | |
| Interest_rate | 0.05 | per year | |
| Interest_spending | (Credit_Line + Loan) × Interest_rate | EUR/yr | |
| Long_term_Investement_ratio | GRAPH(Long_term_Investments/Desired_investment) Points: (0.000, 1.000), (2.000, 1.500) | Unitless | |
| Networking_expenses | 500 | EUR/year | |
| New_investment_switch | 1 | ||
| Obsolescence_ratio | MIN(1;Actual_level_of_Equipment_and_Store/obsolescence_treshold) | Unitless | |
| obsolescence_treshold | 0.85 | ||
| On_ordering_capacity_GAP | ON_orderring_Capacity_DESIRED-On_ordering_Capacity | bed | |
| On_ordering_Correction | On_ordering_capacity_GAP/Time_to_Correct_capacity | bed/yr | |
| ON_orderring_Capacity_DESIRED | Cpèacity_ADJ × AVG_Constriction_Time | bed | |
| Perceived_Obs_rate | SMTH1(Obasolescence_rate;1.5) | REPORT IN TABLE AS FLOW | bed/yr |
| perceived_quality | SMTH1(Quality_index × Actual_level_of_Equipment_and_Store;1.5) | Unitless | |
| Price_Ratio | AVG_price/Reference_price | person/people | |
| Private_desired_EQ_store_level | 1-reduce_the_mantenaince | Unitless | |
| Probability_to_eat_in_a_Resaturants | 0.45 × Shared_Resources.Effect_of_AVG_oer_tourists_spending_on_probability × Effect_of_price_on_probability | Unitless | |
| Quality_index | GRAPH(AVG_spending_per_customer/Benchmark) Points: (0.000, 0.5000), (0.150, 0.516923076923), (0.300, 0.546153846154), (0.450, 0.601538461538), (0.600, 0.658461538462), (0.750, 0.755384615385), (0.900, 0.896923076923), (1.050, 0.975384615385), (1.200, 0.998461538462), (1.350, 1.0000), (1.500, 1.0000) | Unitless | |
| reduce_the_mantenaince | 0 | Unitless | |
| Reference_price | 30 | EUR/person | |
| STD_person_to_follow_high_quality_restaurants | 1000 | people/year | |
| Time_to_close_the_gap | 1 | year | |
| Time_to_correct | 2 | year | |
| Time_to_Correct_capacity | 3 | year | |
| TOTAL_Capacity_ADJ | Cpèacity_ADJ + On_ordering_Correction | bed/yr | |
| Total_Costs | AVG_Unit_cost × Tot_cust | EUR/yr | |
| total_customers | Customers + Actual_person_follow_quality | person/yr | |
| TRND_arrivals | TREND(Shared_Resources.arrivals;1) | per time | |
| unit_fixed_per_cust | GRAPH(Customers) Points: (0, 1.000), (600, 1.000), (1200, 1.000), (1800, 1.000), (2400, 1.000), (3000, 1.24437299035), (3600, 1.81028938907), (4200, 2.18971061093), (4800, 2.67845659164), (5400, 2.89067524116), (6000, 3.000) | EUR/people | |
| Municipality | |||
| Variable Name | Equations | Properties | Units |
| Completed_Projects(t) | Completed_Projects(t − dt) + (Realizatio_rate) × dt | INIT Completed_Projects = 0 | project |
| Cumulative_Payment_for_projects(t) | Cumulative_Payment_for_projects(t − dt) + (New_payment_to_perform − Payement_to_Businesses) × dt | INIT Cumulative_Payment_for_projects = To_build | EUR |
| Done(t) | Done(t − dt) + (Fisical_Construction_Rate) × dt | INIT Done = 0 | EUR |
| Executive_projects(t) | Executive_projects(t − dt) + (Designing_Rate − Win_rate) × dt | INIT Executive_projects = 0 | project |
| Loan(t) | Loan(t − dt) + (Change_in_loacn − Loan_Repayment_rate) × dt | INIT Loan = To_build × Fraction_to_Loan | EUR |
| Municipal_Funds(t) | Municipal_Funds(t − dt) + (Revenues − Spending) × dt | INIT Municipal_Funds = 9000000 | EUR |
| N_of_Cultural_events(t) | N_of_Cultural_events(t − dt) + (Chnage_in_Events) × dt | INIT N_of_Cultural_events = Number_of_events | event |
| On_ordering_Service_Level(t) | On_ordering_Service_Level(t − dt) + (Planning_Service_Level − Implementation_Service_rate) × dt | INIT On_ordering_Service_Level = 0 | people |
| ON_planning_stage(t) | ON_planning_stage(t − dt) + (Planning_rate − Designing_Rate) × dt | INIT ON_planning_stage = 0 | project |
| PLanned_Project(t) | PLanned_Project(t − dt) + (Change_in_Project) × dt | INIT PLanned_Project = 0 | project |
| Projects_Funds(t) | Projects_Funds(t − dt) + (Money_to_project − Flow_1) × dt | INIT Projects_Funds = 0 | EUR |
| Resources_won(t) | Resources_won(t − dt) + (Money_from_Other_sources − Payment) × dt | INIT Resources_won = 0 | EUR |
| Service_level(t) | Service_level(t − dt) + (Implementation_Service_rate − Service_reduction) × dt | INIT Service_level = Shared_Resources. Population + Shared_Resources. Presences | people |
| Surplus_or_debt(t) | Surplus_or_debt(t − dt) + (new_surplus + Debt_repayment − using_surplus − new_debt_1) × dt | INIT Surplus_or_debt = 0 | EUR |
| To_be_realized(t) | To_be_realized(t − dt) + (Win_rate − Realizatio_rate) × dt | INIT To_be_realized = 0 | project |
| To_build(t) | To_build(t − dt) + (new_financed_project − Fisical_Construction_Rate) × dt | INIT To_build = To_be_realized × AVG_Amount_in_EUR_per_Project_from_EU | EUR |
| Change_in_loacn | new_financed_project × Fraction_to_Loan | EUR/yr | |
| Change_in_Project | (Decision_to_Start_a_project-PLanned_Project)/1 | project/yr | |
| Chnage_in_Events | events_adj | event/yr | |
| Debt_repayment | IF(Surplus_or_debt < 0) THEN((Surplus_or_debt × −1)/5) ELSE(0) | EUR/yr | |
| Designing_Rate | Flow_1/AVG_resources_per_Project | project/yr | |
| Fisical_Construction_Rate | Payement_to_Businesses | EUR/yr | |
| Flow_1 | Projects_Funds/1 | EUR/yr | |
| Implementation_Service_rate | On_ordering_Service_Level/AVG_imolementation_Time | person/yr | |
| Loan_Repayment_rate | Loan/AVG_time_to_repay_loan | EUR/yr | |
| Money_from_Other_sources | new_financed_project × Fraction_from_EU | EUR/yr | |
| Money_to_project | AVG_resources_per_Project × Planning_rate | EUR/yr | |
| new_debt_1 | IF(deficit_surplus_indicator < 0) THEN((deficit_surplus_indicator × −1)/1) ELSE(0) | EUR/yr | |
| new_financed_project | Perceived_Win_rate × AVG_Amount_in_euro_per_Project_from_EU | EUR/yr | |
| New_payment_to_perform | perceived_Flow_of_loan + Perceived_Flow_of_Resources_from_EU | EUR/yr | |
| new_surplus | IF(deficit_surplus_indicator > 0) THEN(deficit_surplus_indicator/1) ELSE(0) | EUR/yr | |
| Payement_to_Businesses | MAX_payment_available | EUR/yr | |
| Payment | Payement_to_Businesses × Fraction_from_EU | EUR/yr | |
| Planning_rate | ADJ_ofr_projects | project/yr | |
| Planning_Service_Level | MAX(TOTAL_ADJ_1;0) | person/yr | |
| Realizatio_rate | Fisical_Construction_Rate/AVG_Amount_in_euro_per_Project_from_EU | project/yr | |
| Revenues | Total_Fixed_Revenues + Revenues_rom_Tourism | EUR/yr | |
| Service_reduction | IF(Service_level > Municipality_Waste_Desired_Service_Level) THEN((Service_level-Municipality_Waste_Desired_Service_Level)/1) ELSE(0) | person/yr | |
| Spending | Projects_Spending + Interest_Spending + General_Personnel_Administration_and_Social + Rimborso_Prestiti + Garbage_collection_to_pop_Expenses + Cultural_and_Tourism_Policies | EUR/yr | |
| using_surplus | IF(Surplus_or_debt < 0) OR (Surplus_or_debt = 0) THEN(0) ELSE(Surplus_or_debt × Fraction_of_surplus_to_spend) | EUR/yr | |
| Win_rate | Converter_1 | project/yr | |
| ACTUAL_spending_per_capita | General_Personnel_Administration_and_Social/Shared_Resources.Population | EUR/(person-yr) | |
| ADJ_ofr_projects | (PLanned_Project-Tot_projects)/AT | project/yr | |
| AT | 1 | year | |
| AVG_Amount_in_euro_per_Project_from_EU | 1,000,000 | EUR/project | |
| AVG_cost | GRAPH(Service_level) Points: (0, 100.00), (3000, 100.00), (6000, 100.00), (9000, 100.00), (12,000, 100.00), (15,000, 100.00), (18,000, 80.00), (21,000, 80.00), (24,000, 80.00), (27,000, 80.00), (30,000, 80.00) | EUR/(people-year) | |
| AVG_exectution_Time | 3 | year | |
| AVG_imolementation_Time | 1 | year | |
| AVG_per_capita_from_STATE | GRAPH(TIME) Points: (0.00, 199.421221865), (1.00, 195.36977492), (2.00, 183.794212219), (3.00, 172.797427653), (4.00, 160.643086817), (5.00, 145.594855305), (6.00, 124.758842444), (7.00, 103.344051447), (8.00, 83.6655948553), (9.00, 61.0932475884), (10.00, 40.8360128617), (11.00, 29.8392282958), (12.00, 20.0) | EUR/(people-year) | |
| AVG_resources_per_Project | 50,000 | EUR/project | |
| AVG_revenues_per_Turist | 400 | EUR/people | |
| AVG_Spending_per_Event | IF(N_of_Cultural_events = 0) THEN(0) ELSE(Spending_in_Tourism_and_Cultural_Events/N_of_Cultural_events) | EUR/(event-year) | |
| AVG_Taxes_Per_citizens | 400 | EUR/(people-year) | |
| AVG_time_to_repay_loan | 10 | year | |
| Bechmark | 6000 | EUR/(event-year) | |
| Contribution_per_events | 10,000 | EUR/(event-year) | |
| Converter_1 | PULSE(Probability_to_Win_a_call_For_tenders) | ||
| Credit_line | IF(Municipal_Funds < Hist_value) THEN(Hist_value-Municipal_Funds) ELSE(0) | EUR | |
| Cultural_and_Tourism_Policies | Public_spenging_in_Events + Resources_to_Museum + Networking_investment + Garbage_speding_to_Tourism | EUR/year | |
| Decision_to_Start_a_project | 2 | project | |
| deficit_surplus_indicator | Surplus_Deficit_Indicator | EUR/yr | |
| Desired_Payment_rate | To_build/AVG_exectution_Time | EUR/yr | |
| Effectiveness_of_Events | GRAPH(AVG_Spending_per_Event/Bechmark) Points: (1.000, 1.0000), (2.000, 1.5000) | Unitless | |
| events_adj | (Number_of_events-N_of_Cultural_events)/1 | ||
| Events_Ratio | N_of_Cultural_events/Months_of_the_year | event/month per year | |
| fractio_to_loan_repayment | 0 | per year | |
| Fraction_from_EU | 0.4 | Unitless | |
| Fraction_general_Administration_expenses | 1-Fraction_to_cultural_and_tourism_policiies_garbage_and_loan-Fraction_to_social_expenses | per year | |
| Fraction_of_Garbage_collection_ex_to_tourims | 0 | 1/year | |
| Fraction_of_surplus_to_spend | 1 | per year | |
| Fraction_to_cultural_and_tourism_policiies_garbage_and_loan | (1/1) + Fraction_of_Garbage_collection_ex_to_tourims + fractio_to_loan_repayment + to_project_spendin | 1/year | |
| Fraction_to_Loan | 0.6 | Unitless | |
| Fraction_to_social_expenses | 0.09 | per year | |
| Garbage_collection_to_pop_Expenses | IF(Service_level > Shared_Resources.Population) THEN(Shared_Resources.Population × AVG_cost) ELSE(Service_level × AVG_cost) | EUR/year | |
| Garbage_speding_to_Tourism | (Service_level × AVG_cost)-Garbage_collection_to_pop_Expenses | EUR/year | |
| Gen_and_Cult | Fraction_general_Administration_expenses + Fraction_to_cultural_and_tourism_policiies_garbage_and_loan | per year | |
| General_Personnel_Administration_and_Social | Revenues-Total_tourism_Policy_spending {included contributions + museum personnell} | REPORT IN TABLE AS FLOW | EUR/yr |
| Hist_value | HISTORY(Municipal_Funds;TIME-1) | EUR | |
| INIT_Municipal_Funds | Revenues × obsr_time | REPORT IN TABLE AS FLOW | EUR |
| Interest_of_loan | Loan × INTEREST_RATE_FOR_LOAN | EUR/yr | |
| INTEREST_RATE_FOR_LOAN | GRAPH(AVG_time_to_repay_loan) Points: (0.00, 0), (40.00, 0.01) | per year | |
| Interest_Spending | IF(Surplus_or_debt < 0) THEN((Surplus_or_debt) × percentage_Interest) ELSE(0) | EUR/yr | |
| Max_Available_payment | 0 | ||
| MAX_payment_available | MAX(MIN(Desired_Payment_rate;(New_payment_to_perform-Debt_repayment + using_surplus));0) | REPORT IN TABLE AS FLOW | EUR/yr |
| Months_of_the_year | 12 | month per year | |
| Municipality_Waste_Desired_Service_Level | 30,000 | people | |
| Networking_investment | 31,000 | EUR/year | |
| Number_of_events | 10 | events | |
| obsr_time | 1 | year | |
| On_ordering_Correction | On_ordering_GAP/Time_to_Correct_SL | person/yr | |
| On_ordering_GAP | ON_orderring_SL_DESIRED-On_ordering_Service_Level | people | |
| ON_orderring_SL_DESIRED | SL_ADJ × AVG_imolementation_Time | people | |
| Perceived_Event_Ratio | SMTH1(Events_Ratio × Effectiveness_of_Events;1.5) | event/month per year | |
| perceived_Flow_of_loan | SMTH1(Change_in_loacn;1) | REPORT IN TABLE AS FLOW | EUR/yr |
| Perceived_Flow_of_Resources_from_EU | SMTH1(Money_from_Other_sources;1) | REPORT IN TABLE AS FLOW | |
| Perceived_Win_rate | SMTH1(Win_rate;1) | REPORT IN TABLE AS FLOW | project/yr |
| percentage_Interest | 0.05 | per year | |
| Probability | MIN(Tot_projects × 5;35) | project/yr | |
| Probability_to_Win_a_call_For_tenders | MONTECARLO(Probability;20) | project/yr | |
| Project_won | 1 | project/yr | |
| Projects_Spending | Money_to_project | REPORT IN TABLE AS FLOW | EUR/yr |
| Public_spenging_in_Events | Spending_in_Tourism_and_Cultural_Events | EUR/year | |
| Resources_to_Museum | 0 | EUR/year | |
| Revenues_from_region | GRAPH(TIME) Points: (0.00, 2,000,000), (0.833333333333, 1,980,707.3955), (1.66666666667, 1,980,707.3955), (2.50, 1,967,845.65916), (3.33333333333, 1,954,983.92283), (4.16666666667, 1,935,691.31833), (5.00, 1,935,691.31833), (5.83333333333, 1,954,983.92283), (6.66666666667, 1,974,276.52733), (7.50, 1,942,122.1865), (8.33333333333, 1,942,122.1865), (9.16666666667, 1,974,276.52733), (10.00, 1,961,414.791) | ||
| Revenues_from_state | Shared_Resources.Population × AVG_per_capita_from_STATE | EUR/year | |
| Revenues_rom_Tourism | Shared_Resources.arrivals × AVG_revenues_per_Turist | EUR/year | |
| Rimborso_Prestiti | Interest_of_loan + Loan_Repayment_rate + Debt_repayment | REPORT IN TABLE AS FLOW | EUR/yr |
| Service_Adequancy | MIN(Service_level/(Shared_Resources.Presences + Shared_Resources.Population);1) | Unitless | |
| SL_ADJ | SL_GAP/Time_to_implement_service_level | person/yr | |
| SL_GAP | Municipality_Waste_Desired_Service_Level-Service_level | people | |
| Spending_in_Tourism_and_Cultural_Events | N_of_Cultural_events × Contribution_per_events | EUR/year | |
| Surplus_Deficit_Indicator | Revenues-Spending | REPORT IN TABLE AS FLOW | EUR/yr |
| taxation_over_citizens | Shared_Resources.Population × AVG_Taxes_Per_citizens | EUR/year | |
| Time_to_Correct_SL | 1 | year | |
| Time_to_implement_service_level | 1 | year | |
| to_project_spendin | 0 | per year | |
| Tot_projects | Executive_projects + ON_planning_stage | project | |
| TOTAL_ADJ_1 | SL_ADJ + On_ordering_Correction | person/yr | |
| Total_Fixed_Revenues | taxation_over_citizens + Revenues_from_state + Revenues_from_region | EUR/year | |
| Total_Fraction | Gen_and_Cult + Fraction_to_social_expenses | ||
| total_spending | Garbage_collection_to_pop_Expenses + Rimborso_Prestiti + General_Personnel_Administration_and_Social + Cultural_and_Tourism_Policies | EUR/yr | |
| Total_tourism_Policy_spending | Rimborso_Prestiti + Cultural_and_Tourism_Policies + Garbage_collection_to_pop_Expenses | EUR/yr | |
| Museum | |||
| Variable Name | Equations | Properties | Units |
| Articles(t) | Articles(t − dt) + (New_Pubblications) × dt | INIT Articles = Cumulative_Events × STD_PUB_PER_EVENT | pub |
| Completed_Projects(t) | Completed_Projects(t − dt) + (Completition_Rate) × dt | INIT Completed_Projects = 0 | project |
| Concerts(t) | Concerts(t − dt) + (Chnage_in_COncerts_1) × dt | INIT Concerts = Number_of_Concerts | event |
| Cumulative_Events(t) | Cumulative_Events(t − dt) + (Flow_4) × dt | INIT Cumulative_Events = Exibition + Concerts | event |
| Exibition(t) | Exibition(t − dt) + (Chnage_in_Events) × dt | INIT Exibition = Number_of_Exibition_performances_or_pubblications | event |
| Museum_Funds(t) | Museum_Funds(t − dt) + (Revenues − Spending) × dt | INIT Museum_Funds = Revenues×Observ_time | EUR |
| On_Working_stage(t) | On_Working_stage(t − dt) + (Planning_rate − Completition_Rate) × dt | INIT On_Working_stage = 0 | project |
| PLanned_Project(t) | PLanned_Project(t − dt) + (Change_in_Project) × dt | INIT PLanned_Project = Decision_to_Start_a_project_with_school | project |
| Revenues_value(t) | Revenues_value(t − dt) + (Change_in_prev_value) × dt | INIT Revenues_value = Revenues × Observ_time | EUR |
| Spending_value(t) | Spending_value(t − dt) + (Flow_1) × dt | INIT Spending_value = Spending × Observ_time | EUR |
| Surplus_or_debt(t) | Surplus_or_debt(t − dt) + (new_surplus − using_surplus − new_debt) × dt | INIT Surplus_or_debt = 0 | EUR |
| Change_in_prev_value | GAP/Time_to_perceive | EUR/yr | |
| Change_in_Project | (Decision_to_Start_a_project_with_school-PLanned_Project)/1 | project/yr | |
| Chnage_in_COncerts_1 | Conceerts_adj_1 | event/yr | |
| Chnage_in_Events | Axibition_ADJ | event/yr | |
| Completition_Rate | On_Working_stage/1 | project/yr | |
| Flow_1 | Converter_1/Time_to_perceive | EUR/yr | |
| Flow_4 | (Exibition + Concerts)/Obsrv_time | event/yr | |
| new_debt | IF(deficit_surplus_indicator < 0) THEN((deficit_surplus_indicator × −1)/1) ELSE(0) | EUR/yr | |
| New_Pubblications | ((Exibition × STD_PUB_PER_EVENT + STD_PUB_PER_EVENT*Concerts)*TOTAL_Multiplier)/obs_time | pub/yr | |
| new_surplus | IF(deficit_surplus_indicator > 0) THEN(deficit_surplus_indicator/1) ELSE(0) | EUR/yr | |
| Planning_rate | PLanned_Project/1 | project/yr | |
| Revenues | Revenues_from_Ticket_sold + revenues_from_Municipality + using_surplus | EUR/yr | |
| Spending | Spending_in_Exibition + Administrative_And_General_Costs + Concert_Spending + Education_Spending + Networking_expenses | EUR/yr | |
| using_surplus | IF(Surplus_or_debt < 0) OR (Surplus_or_debt = 0) THEN(0) ELSE(Surplus_or_debt × Fraction_of_surplus_to_spend) | EUR/yr | |
| Administrative_And_General_Costs | 32,000 | EUR/year | |
| AVG_contribution_per_project | 2000 | EUR/project | |
| AVG_pub_per_event | Articles/Cumulative_Events | pub/event | |
| AVG_Spending_per_CONCEERT_1 | IF(Concerts = 0) THEN(0) ELSE(Spendig_in_concerts/Concerts) | EUR/(event-year) | |
| AVG_Spending_per_Event | IF(Exibition = 0) THEN(0) ELSE(Spending_in_exibitions/Exibition) | EUR/(event-year) | |
| Axibition_ADJ | (Number_of_Exibition_performances_or_pubblications-Exibition)/0.25 | ||
| Conceerts_adj_1 | (Number_of_Concerts-Concerts)/0.25 | ||
| Concert_Intensiveness | (Concerts × MIN(Effectiveness_of_Events_1;1))/Months_of_the_year_1 | event/month per year | |
| Concert_Spending | Spendig_in_concerts-spending_coverage_from_private | EUR/year | |
| Contribute_per_Concerts | 3000 | EUR/(event-year) | |
| Contribution_per_exibition | 5000 | EUR/(event-year) | |
| Converter_1 | ((Spending × Observ_time)-Spending_value) | REPORT IN TABLE AS FLOW | EUR |
| Converter_6 | Surplus_or_debt | EUR | |
| Decision_to_Start_a_project_with_school | 2 | project | |
| deficit_surplus_indicator | Revenues_value-Spending_value | EUR | |
| Differentiation_Ratio | GRAPH(Exibition/Concerts) Points: (0.000, 0.000), (0.200, 0.250803858521), (0.400, 0.51768488746), (0.600, 0.742765273312), (0.800, 1.000), (1.000, 1.000), (1.200, 1.000), (1.400, 1.000), (1.600, 0.652733118971), (1.800, 0.353697749196), (2.000, 0.000) | Unitless | |
| Education_Spending | Completition_Rate × AVG_contribution_per_project | REPORT IN TABLE AS FLOW | EUR/yr |
| effect_of_events_frequency_on_visits | GRAPH(Perceived_frequency_of_events_per_month/threshold) Points: (0.500, 0.5000), (0.650, 0.77459807074), (0.800, 0.871382636656), (0.950, 0.918649517685), (1.100, 1.01189710611), (1.250, 1.09196141479), (1.400, 1.13183279743), (1.550, 1.15948553055), (1.700, 1.17942122186), (1.850, 1.1884244373), (2.000, 1.18713826367) | Unitless | |
| Effectiveness_of_Events_1 | GRAPH(AVG_Spending_per_CONCEERT_1/Reference_AVG_spending_per_Concerts) Points: (0.000, 0.500), (1.000, 1.00160771704), (2.000, 2.000) | Unitless | |
| Exibition_Intensiveness | (Exibition × MIN(Exibition_spending_multiplier;1))/Months_of_the_year | event/month per year | |
| Exibition_spending_multiplier | GRAPH(AVG_Spending_per_Event/Reference_AVG_spending_per_EXIBITION_1) Points: (0.000, 0.500), (1.000, 1.00160771704), (2.000, 2.000) | Unitless | |
| Financial_Authonomy | (Revenues_from_Ticket_sold + using_surplus)/Revenues | REPORT IN TABLE AS FLOW | Unitless |
| Fraction_of_surplus_to_spend | 1 | per year | |
| GAP | ((Revenues × Observ_time)-Revenues_value) | REPORT IN TABLE AS FLOW | EUR |
| Historical_Revenues | HISTORY(Revenues_value;TIME-1) | EUR | |
| init_value_of_museum_funds | 60,000 | EUR | |
| Months_of_the_year | 12 | month per year | |
| Months_of_the_year_1 | 12 | month per year | |
| Networking_expenses | 4800 | EUR/year | |
| Number_of_Concerts | 7 | events | |
| Number_of_Exibition_performances_or_pubblications | 7 | events | |
| obs_time | 1 | year | |
| Observ_time | 1 | year | |
| Obsrv_time | 1 | year | |
| One_day_Visitors | 15,000 × ratio | people/year | |
| perceived | SMTH1(Shared_Resources.arrivals;1) | ||
| Perceived_Event_Ratio | SMTH1(Exibition_Intensiveness;1.5) | Unitless | |
| Perceived_Event_Ratio_1 | SMTH1(Concert_Intensiveness;1.5) | Unitless | |
| Perceived_frequency_of_events_per_month | SMTH1(Exibition_Intensiveness + Concert_Intensiveness;1.5) | event/month per year | |
| Price | 2.5 | EUR/people | |
| probability_to_visit | 0.7 × Shared_Resources.Effect_of_AVG_oer_tourists_spending_on_probability | Unitless | |
| Professionality_Indicator | IF(Financial_Authonomy > 0.7) AND(pub_coverage_ratio > 0.99) AND(Converter_6 > 0) THEN(1) ELSE(0.5) | Unitless | |
| pub_coverage_ratio | AVG_pub_per_event/STD_PUB_PER_EVENT | Unitless | |
| ratio | GRAPH(Municipality.Perceived_Event_Ratio/threshold) Points: (0.000, 0.411575562701), (0.200, 0.469453376206), (0.400, 0.565916398714), (0.600, 0.739549839228), (0.800, 0.945337620579), (1.000, 1.05466237942), (1.200, 1.09324758842), (1.400, 1.11254019293), (1.600, 1.12540192926), (1.800, 1.13183279743), (2.000, 1.13826366559) | Unitless | |
| Reference_AVG_spending_per_Concerts | 300 | EUR/(event-year) | |
| Reference_AVG_spending_per_EXIBITION_1 | 3500 | EUR/(event-year) | |
| Resources_from_external_parties | Contribute_per_Concerts × Professionality_Indicator × STD_fraction_of_external_contribution | EUR/(event-year) | |
| Resources_from_external_parties_per_exibition | Professionality_Indicator × STD_fraction_of_external_contribution × Contribution_per_exibition | EUR/(event-year) | |
| revenues_from_Municipality | Municipality.Resources_to_Museum | EUR/year | |
| Revenues_from_Ticket_sold | Ticket_Sold × Price | EUR/year | |
| Spendig_in_concerts | (Concerts × Contribute_per_Concerts) | EUR/year | |
| spending_coverage_from_private | Concerts × Resources_from_external_parties | EUR/year | |
| Spending_coverage_from_private_to_all_exibition | Exibition × Resources_from_external_parties_per_exibition | EUR/year | |
| Spending_in_Exibition | Spending_in_exibitions-Spending_coverage_from_private_to_all_exibition | EUR/year | |
| Spending_in_exibitions | (Exibition × Contribution_per_exibition) | EUR/year | |
| STD_fraction_of_external_contribution | 0.25 | Unitless | |
| STD_PUB_PER_EVENT | 2 | pub/event | |
| threshold | 1 | event/month per year | |
| Ticket_Sold | (perceived × probability_to_visit) + visits_due_to_the_events + One_day_Visitors | people/year | |
| Time_to_perceive | 0.5 | year | |
| Tot_projects | Completed_Projects + On_Working_stage | project | |
| TOTAL_Multiplier | Exibition_spending_multiplier + Effectiveness_of_Events_1 | Unitless | |
| total_resources_from_private | Spending_coverage_from_private_to_all_exibition + spending_coverage_from_private | EUR/year | |
| visits_due_to_the_events | 10,000 × effect_of_events_frequency_on_visits | people/year | |
| Shared Resources | |||
| Variable Name | Equations | Properties | Units |
| Businesses(t) | Businesses(t − dt) + (Change_in_Businesses) × dt | INIT Businesses = INIT_number_of_Businesses | units |
| Labour(t) | Labour(t − dt) + (Hiring_Rate − Quit_rate) × dt | INIT Labour = Businesses×AVG_Workers_per_Business | people |
| Local_area_Image(t) | Local_area_Image(t − dt) + (Change_in_Image) × dt | INIT Local_area_Image = Indicated_Image | Unitless |
| Population(t) | Population(t − dt) + (Birtn_rate + In_Migration − Death_rate − Out_Migraton) × dt | INIT Population = 9090 | people |
| Potential(t) | Potential(t − dt) + (New_tourists_potential − arrivals − Flow_1) × dt | INIT Potential = 10000 | people |
| Potential_Room_Occupancy(t) | Potential_Room_Occupancy(t − dt) + (Change_in_bed) × dt | INIT Potential_Room_Occupancy = Potential × Avg_residence_time | bed/year |
| Presences(t) | Presences(t − dt) + (arrivals − Leaving_rate) × dt | INIT Presences = Potential × 1.8 | people |
| Serv_Quality(t) | Serv_Quality(t − dt) + (Change_in_Service_Quality) × dt | INIT Serv_Quality = Srv_Quot_indx | Unitless |
| Vacancies(t) | Vacancies(t − dt) + (Opening_Rate − Clsing_rate) × dt | INIT Vacancies = Desired_Vacancies | people |
| arrivals | Room_Capacity_Utilization×person_per_bed × Business_Sector.Capacity_equivalent | person/yr | |
| Birtn_rate | Population × Avg_Birth_rate | person/yr | |
| Change_in_bed | (Potential × Avg_residence_time-Potential_Room_Occupancy)/1 | bed/(year-yr) | |
| Change_in_Businesses | Local_Value_TREND × (Businesses × Weight_of_tourism_on_main_econmy) | unit/yr | |
| Change_in_Image | (Indicated_Image-Local_area_Image)/Perception_Time | per year | |
| Change_in_Service_Quality | (Srv_Quot_indx-Serv_Quality)/2 | per year | |
| Clsing_rate | Hiring_Rate | person/yr | |
| Death_rate | Population × Avg_death_rate | person/yr | |
| Flow_1 | Potential × effect_of_service_quality_on_reduction_rate | person/yr | |
| Hiring_Rate | Vacancies/Time_to_hire | person/yr | |
| In_Migration | Fraction_in_mig_rate × Population | Unitless | |
| Leaving_rate | Presences/Min_Holiday_lenght | person/yr | |
| New_tourists_potential | Ini_number_of_tourists × Effect_of_Local_Area_Image_on_New_Tourists | person/yr | |
| Opening_Rate | Desired_Vacancies_Creation_Rate | person/yr | |
| Out_Migraton | Population × Fraction_Out_Mig | person/yr | |
| Quit_rate | Labour × AVG_Duartion_time | person/yr | |
| ADJ_for_labour | (Desired_Labour-Labour)/Time_to_adjust_labour | person/yr | |
| ADJ_for_Vacancies | (Desired_Vacancies-Vacancies)/Time_t_oadjust_vacancies | person/yr | |
| arrivals_1 | SMTH1(arrivals;2) | REPORT IN TABLE AS FLOW | person/yr |
| Avg_Birth_rate | 0.01 | per year | |
| Avg_death_rate | 0.01 | per year | |
| AVG_Duartion_time | 0.01 | per year | |
| AVG_holiday_lenght | Presences/Leaving_rate | REPORT IN TABLE AS FLOW | years |
| AVG_per_tourist_spending | Total_Networking_expenses/arrivals | REPORT IN TABLE AS FLOW | EUR-yr/(person-year) |
| Avg_residence_time | 2.4 | bed/(person-year) | |
| AVG_Workers_per_Business | 3 | people/unit | |
| Desired_Hiring_Rate | ADJ_for_labour + Expected_Quittig_rate | person/yr | |
| Desired_Labour | Businesses × AVG_Workers_per_Business | people | |
| Desired_Vacancies | Desired_Hiring_Rate × Time_to_hire | people | |
| Desired_Vacancies_Creation_Rate | ADJ_for_Vacancies + Desired_Hiring_Rate | person/yr | |
| Effect_of_AVG_oer_tourists_spending_on_probability | GRAPH(AVG_per_tourist_spending/Reference_Spending) Points: (0.000, 0.500), (0.200, 0.561093247588), (0.400, 0.647909967846), (0.600, 0.747588424437), (0.800, 0.872990353698), (1.000, 1.02090032154), (1.200, 1.17202572347), (1.400, 1.31028938907), (1.600, 1.41961414791), (1.800, 1.48392282958), (2.000, 1.500) | ||
| effect_of_Local_area_image_on_min_holiday_lenght | GRAPH(Local_area_Image) Points: (0.6500, 0.7000), (0.6850, 0.769453376206), (0.7200, 0.842765273312), (0.7550, 0.902572347267), (0.7900, 0.979742765273), (0.8250, 1.04340836013), (0.8600, 1.11479099678), (0.8950, 1.19389067524), (0.9300, 1.24790996785), (0.9650, 1.27877813505), (1.0000, 1.28649517685) | Unitless | |
| Effect_of_Local_Area_Image_on_New_Tourists | GRAPH(Local_area_Image) Points: (0.000, 0.300), (0.100, 0.384887459807), (0.200, 0.53536977492), (0.300, 0.697427652733), (0.400, 0.882636655949), (0.500, 1.04469453376), (0.600, 1.24919614148), (0.700, 1.38424437299), (0.800, 1.461414791), (0.900, 1.500), (1.000, 1.500) | Unitless | |
| effect_of_service_quality_on_reduction_rate | GRAPH(perceived_service_quality) Points: (0.000, 1.000), (0.100, 0.96463022508), (0.200, 0.893890675241), (0.300, 0.829581993569), (0.400, 0.749196141479), (0.500, 0.668810289389), (0.600, 0.56270096463), (0.700, 0.440514469453), (0.800, 0.289389067524), (0.900, 0.141479099678), (1.000, 0.000) | Unitless | |
| Expected_Quittig_rate | SMTH1(Quit_rate;1) | REPORT IN TABLE AS FLOW | |
| Fraction_in_mig_rate | GRAPH(Ratio_Pop_Workforce_needed) Points: (1.000, 0), (2.000, 0.01) | per year | |
| Fraction_Out_Mig | GRAPH(Ratio_Pop_Workforce_needed) Points: (0.000, 0.01), (1.000, 0) | per year | |
| Indicated_Image | MIN(Business_Sector.perceived_quality × Museum.Differentiation_Ratio×Municipality.Perceived_Event_Ratio;1) | Unitless | |
| Ini_number_of_tourists | 10,000 | people/year | |
| INIT_number_of_Businesses | 450 | units | |
| Local_Value_TREND | TREND(arrivals_1;1) | per year | |
| Loosin_services | GRAPH(TIME) Points: (0.00, 0.0102893890675), (0.833333333333, 0.0102893890675), (1.66666666667, 0.0257234726688), (2.50, 0.0540192926045), (3.33333333333, 0.087459807074), (4.16666666667, 0.128617363344), (5.00, 0.226366559486), (5.83333333333, 0.36270096463), (6.66666666667, 0.535048231511), (7.50, 0.689389067524), (8.33333333333, 0.766559485531), (9.16666666667, 0.8000), (10.00, 0.8000) | ||
| Min_Holiday_lenght | 2 × effect_of_Local_area_image_on_min_holiday_lenght | year | |
| perceived_service_quality | SMTH3(Serv_Quality;5;1) | Unitless | |
| Percentage_growth_rate | PERCENT(TREND_of_arrivals) | Unitless | |
| Perception_Time | 2.5 | year | |
| person_per_bed | 1 | person/bed | |
| Ratio_Pop_Workforce_needed | (Vacancies/(Population × 0.42-Labour))/Reference_Vacancies_over_pop | Unitless | |
| Ratio_Social_Spending_per_capita | Municipality.ACTUAL_spending_per_capita/Reference_Social_spending_per_capita | Unitless | |
| Reference_Social_spending_per_capita | 1000 | EUR/(person-yr) | |
| Reference_Spending | 4 | EUR/people | |
| Reference_Vacancies_over_pop | 0.02 | Unitless | |
| Room_Capacity_Saturation | Potential_Room_Occupancy/Business_Sector.Capacity_equivalent | yr/year | |
| Room_Capacity_Utilization | GRAPH(Room_Capacity_Saturation) Points: (0.000, 0.000), (0.555555555556, 0.167202572347), (1.11111111111, 0.305466237942), (1.66666666667, 0.472668810289), (2.22222222222, 0.620578778135), (2.77777777778, 0.778135048232), (3.33333333333, 0.893890675241), (3.88888888889, 0.977491961415), (4.44444444444, 1.000), (5.000, 1.000) | Unitless | |
| Srv_Quot_indx | Municipality.Service_Adequancy × Business_Sector.Obsolescence_ratio × Ratio_Social_Spending_per_capita | Unitless | |
| Time_t_oadjust_vacancies | 1 | year | |
| Time_to_adjust_labour | 1 | year | |
| Time_to_hire | 0.6 | year | |
| Total_Networking_expenses | Municipality.Networking_investment + Museum.Networking_expenses + (Business_Sector.Networking_expenses × 20) | EUR/year | |
| TREND_of_arrivals | TREND(arrivals;1) | REPORT IN TABLE AS FLOW | per time |
| Weight_of_tourism_on_main_econmy | 0.3 | Unitless | |
| Zero | 0 | ||
| Run Specs: | |
| Start Time | 0 |
| Stop Time | 12 |
| DT | 0.025 |
| Fractional DT | False |
| Save Interval | 0.025 |
| Sim Duration | 12 |
| Time Units | Years |
| Pause Interval | 3 |
| Integration Method | Euler |
| Keep All Variable Results | True |
| Run By | Run |
| Calculate Loop Dominance Information | False |
| 1 | iThink and STELLA (short for Systems Thinking, Experimental Learning Laboratory with Animation, also marketed as iThink) are visual programming languages for system dynamics modeling introduced by Barry Richmond in 1985. The program, distributed by iseesystems®, allows users to run models created as graphical representations of a system using three fundamental building blocks: stocks, flows, and converters. iThink is used in academia as a teaching tool and is adopted for a variety of research and consultancy purposes. |
| 2 | It is a script for developing structured group model-building sessions [103]. |
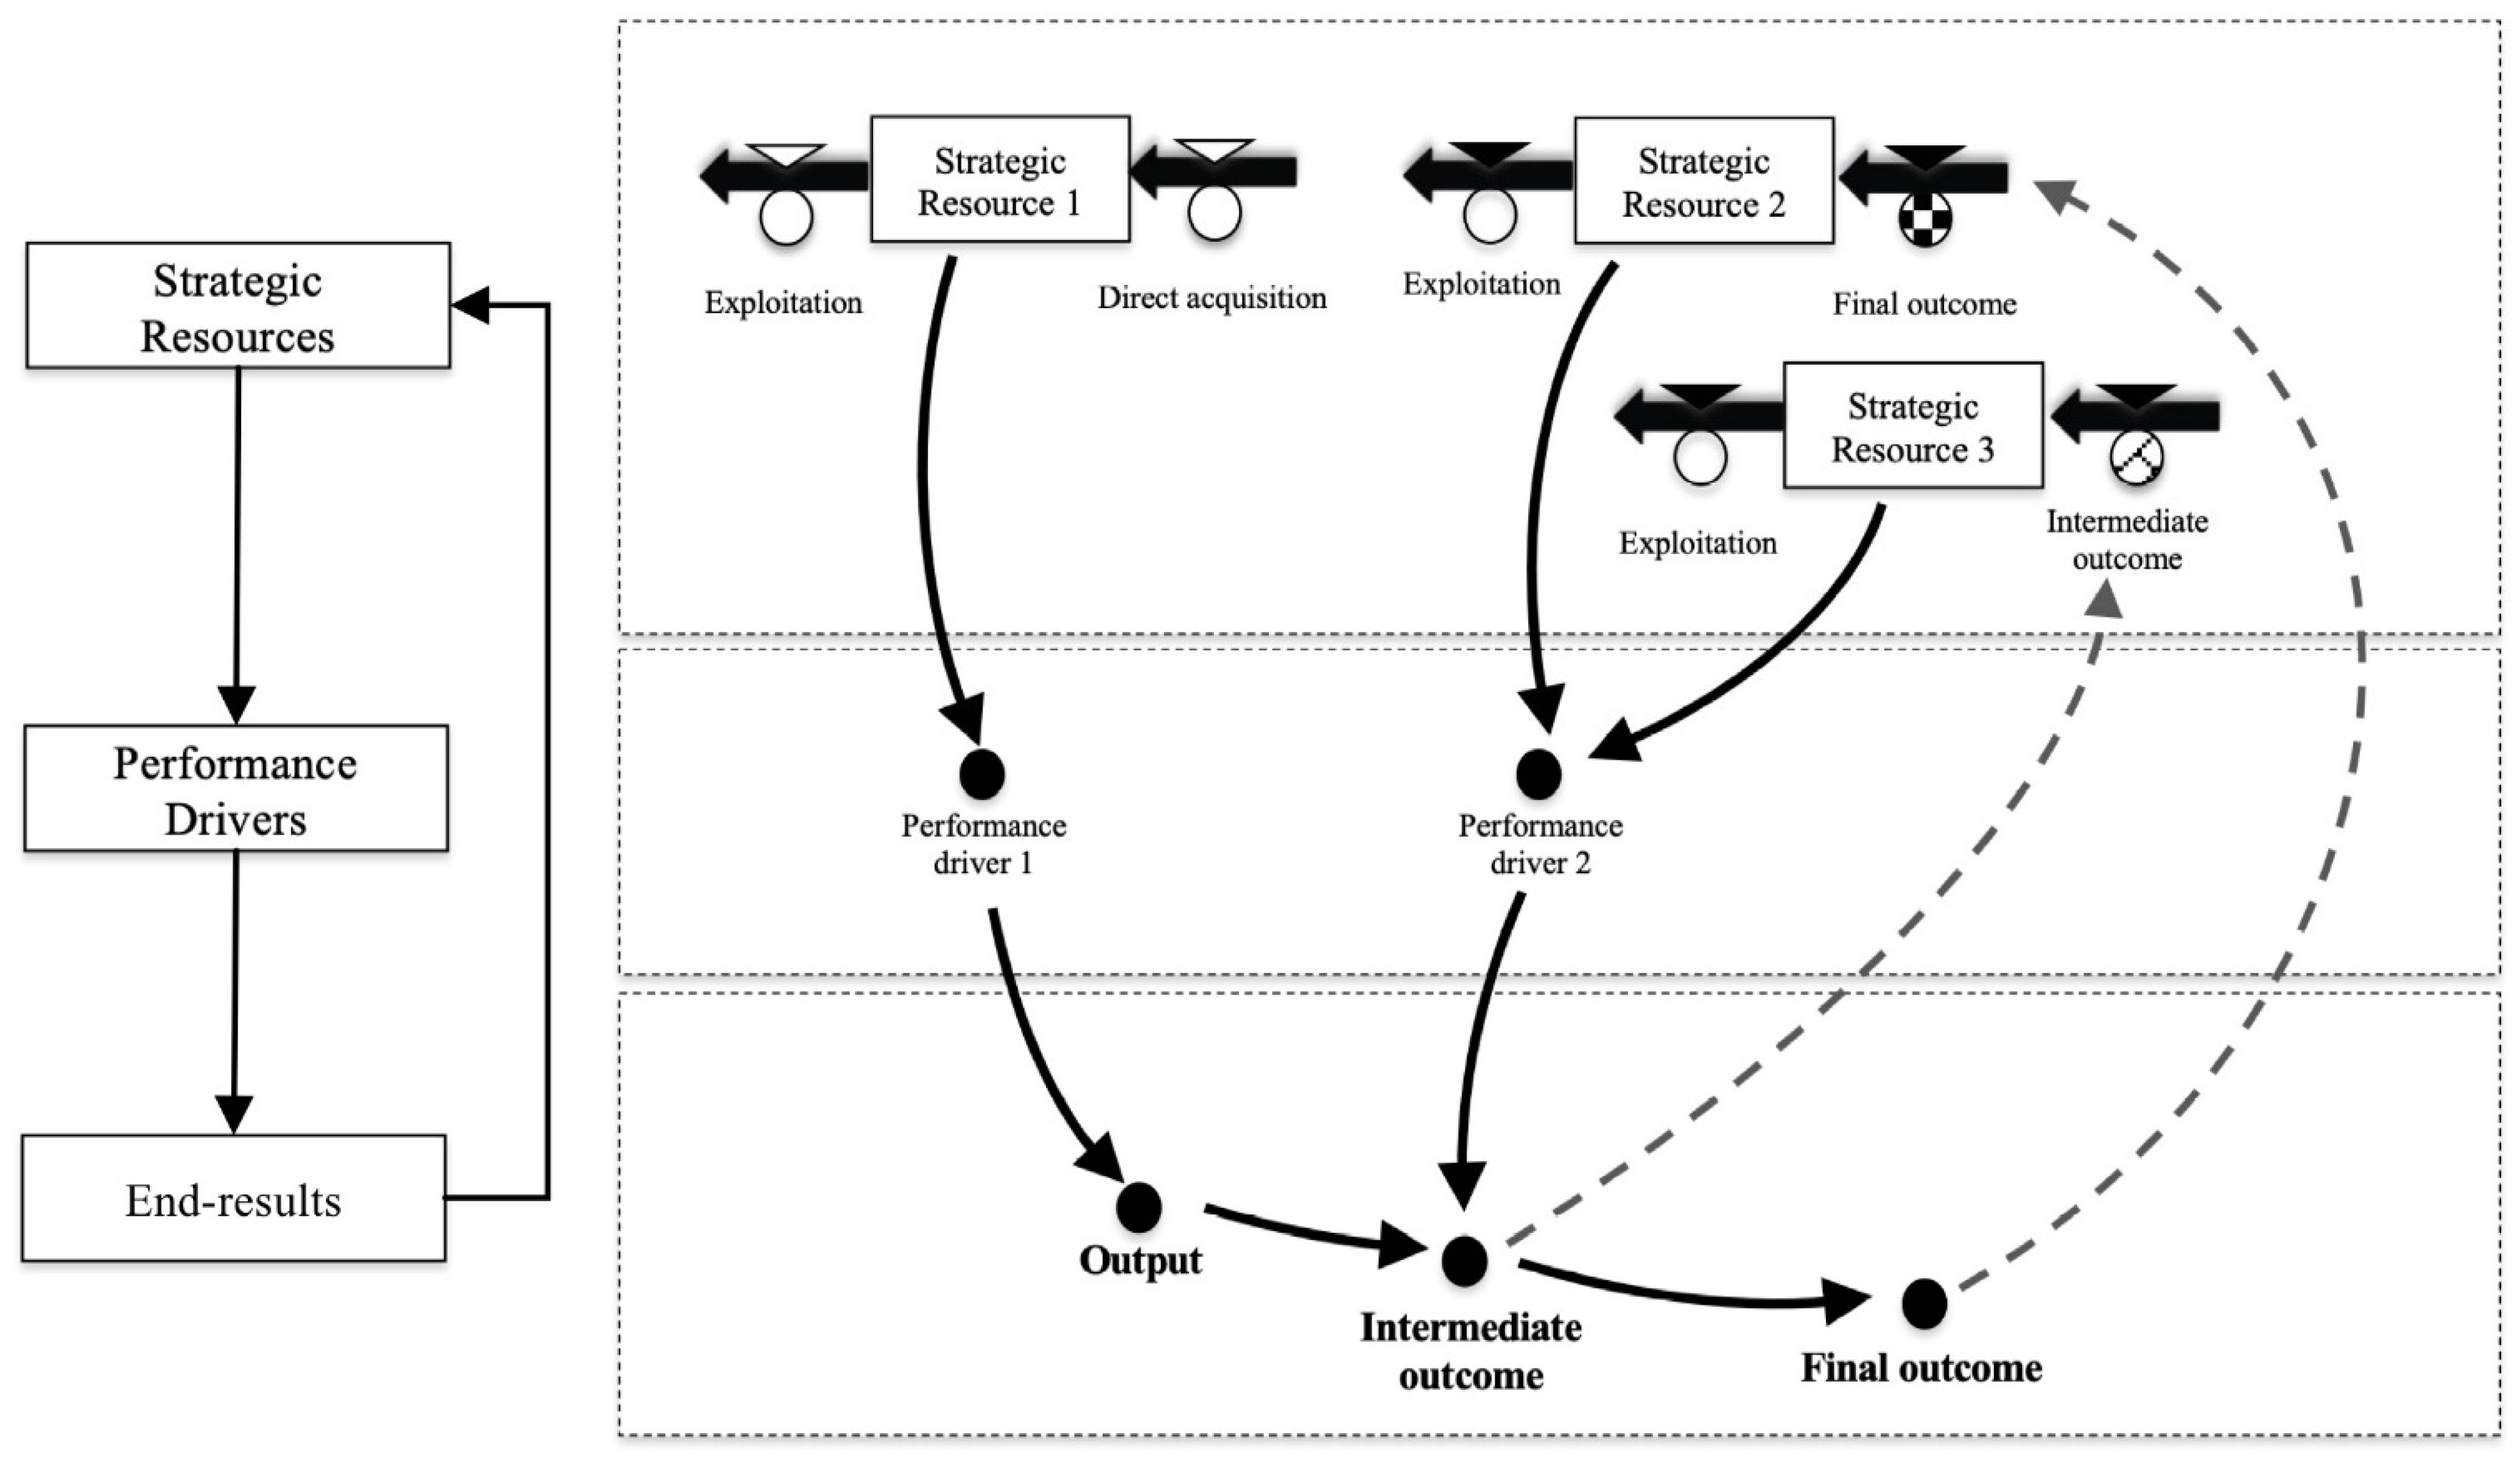
| 3 | The figure depicts outcomes also in the upper section of the DPM insight model, which shows strategic resources. They are modeled (by using a “chessboard” symbol) as co-flows of the corresponding variables in the “end results” section. Also, they are modeled as grey-filled boxes to distinguish “common goods” from other strategic resources. |
References
- Rocha, H.; Kunc, M.; Audretsch, D.B. Clusters, economic performance, and social cohesion: A system dynamics approach. Reg. Stud. 2020, 54, 1098–1111. [Google Scholar] [CrossRef]
- Bianchi, C. Enhancing policy design and sustainable community outcomes through collaborative platforms based on a dynamic performance management and governance approach. In Handbook of Policy Design; Peters, G., Fontaine, G., Eds.; Edward Elgar: Cheltenham, UK, 2022; pp. 411–433. [Google Scholar]
- Cepiku, D. Performance Management in Public Administrations. In The Routledge Handbook of Global Public Policy and Administration; Klassen, T., Cepiku, D., Lah, T.J., Eds.; Routledge: London, UK, 2017. [Google Scholar]
- Fryer, K.; Antony, J.; Ogden, S. Performance management in the public sector. Int. J. Public Sect. Manag. 2009, 22, 478–498. [Google Scholar] [CrossRef]
- Rajala, T.; Laihonen, H.; Vakkuri, J. Exploring challenges of boundary-crossing performance dialogues in hybrids. J. Manag. Gov. 2020, 24, 799–820. [Google Scholar] [CrossRef]
- Talbot, C. Performance Management. In The Oxford Handbook of Public Management; Ferlie, E., Lynn, L.E., Pollitt, C., Eds.; Oxford University Press: Oxford, UK, 2005. [Google Scholar] [CrossRef]
- Vignieri, V. Active community for climate change: A Dynamic Performance Governance analysis of a biodiversity preservation program. Sustain. Account. Manag. Policy J. 2023. [Google Scholar] [CrossRef]
- Cronin, M.A.; Gonzalez, C.; Sterman, J. Why don’t well-educated adults understand accumulation? A challenge to researchers, educators, and citizens. Organ. Behav. Hum. Decis. Process. 2009, 108, 116–130. [Google Scholar] [CrossRef]
- Korzilius, H.; Raaijmakers, S.; Rouwette, E.; Vennix, J. Thinking Aloud While Solving a Stock-Flow Task: Surfacing the Correlation Heuristic and Other Reasoning Patterns. Syst. Res. Behav. Sci. 2014, 31, 268–279. [Google Scholar] [CrossRef]
- Moxnes, E. Misperceptions of basic dynamics: The case of renewable resource management. Syst. Dyn. Rev. 2004, 20, 139–162. [Google Scholar] [CrossRef]
- Cavenago, D.; Trivellato, B. Organising strategic spatial planning: Experiences from Italian cities. Space Polity 2010, 14, 167–188. [Google Scholar] [CrossRef]
- Dredge, D. Policy networks and the local organisation of tourism. Tour. Manag. 2006, 27, 269–280. [Google Scholar] [CrossRef]
- Porter, M.E. The competitive advantage of the inner city. In The City Reader; Routledge: London, UK, 2011; pp. 282–295. [Google Scholar]
- Banfield, E.C. Moral Basis of a Backward Society; Free Press: New York, NY, USA, 1967. [Google Scholar]
- Kale, P.; Singh, H.; Perlmutter, H. Learning and protection of proprietary assets in strategic alliances: Building relational capital. Strateg. Manag. J. 2000, 21, 217–237. [Google Scholar] [CrossRef]
- Vignieri, V. Enhancing Performance Regimes to Enable Outcome-Based Policy Analysis in Cross-Boundary Settings; Springer International Publishing: New York, NY, USA, 2022; Volume 6. [Google Scholar] [CrossRef]
- Dekker, H.C. Control of inter-organizational relationships: Evidence on appropriation concerns and coordination requirements. Account. Organ. Soc. 2004, 29, 27–49. [Google Scholar] [CrossRef]
- Ouchi, W.G. A Conceptual Framework for the Design of Organizational Control Mechanisms. Manag. Sci. 1979, 25, 833–848. [Google Scholar] [CrossRef]
- Lim, S.; Berry, F.S.; Lee, K.H. Stakeholders in the Same Bed with Different Dreams: Semantic Network Analysis of Issue Interpretation in Risk Policy Related to Mad Cow Disease. J. Public Adm. Res. Theory 2016, 26, 79–93. [Google Scholar] [CrossRef]
- Bianchi, C.; Vignieri, V. Dealing with “abnormal” business growth by leveraging local area common goods: An outside-in stakeholder collaboration perspective. Int. J. Product. Perform. Manag. 2020, 70, 613–634. [Google Scholar] [CrossRef]
- Vignieri, V.; Bianchi, C. Designing Outcome-oriented Performance Regimes to enhance societal transition for inner area regeneration. Paper presented at Public Administration Review Virtual Boutique Symposium on “Harnessing the Evolutionary Advantage of Emergent PM Regimes: Strengthening Accountability for Challenges of Modern Public Administration and Governance”. 2022. [Google Scholar]
- Bouckaert, G.; Halligan, J. Managing Performance: International Comparisons; Routledge: London, UK, 2008. [Google Scholar]
- Van Dooren, W.; Bouckaert, G.; Halligan, J. Performance Management in the Public Sector; Routledge: New York, NY, USA, 2015. [Google Scholar] [CrossRef]
- Bianchi, C. Dynamic Performance Management; Springer International Publishing: New York, NY, USA, 2016; Volume 1, Issue 1. [Google Scholar] [CrossRef]
- Bianchi, C.; Rivenbark, W.C. Performance Management in Local Government: The Application of System Dynamics to Promote Data Use. Int. J. Public Adm. 2014, 37, 945–954. [Google Scholar] [CrossRef]
- Bianchi, C.; Tomaselli, S. A dynamic performance management approach to support local strategic planning. Int. Rev. Public Admin. 2015, 20, 370–385. [Google Scholar] [CrossRef]
- Cosenz, F.; Noto, L. Combining system dynamics modelling and management control systems to support strategic learning processes in SMEs: A Dynamic Performance Management approach. J. Manag. Control 2015, 26, 225–248. [Google Scholar] [CrossRef]
- Noto, G. Strategic Planning for Urban Transportation: A Dynamic Performance Management Approach; Springer International Publishing: New York, NY, USA, 2020; Volume 3. [Google Scholar] [CrossRef]
- Vignieri, V. Framing the Sources of Image of a Local Area through Outcome-Based Dynamic Performance Management. Public Organ. Rev. 2019, 19, 249–271. [Google Scholar] [CrossRef]
- Callon, M. Performativity, misfires and politics. J. Cult. Econ. 2010, 3, 163–169. [Google Scholar] [CrossRef]
- Barnabè, F.; Busco, C. The causal relationships between performance drivers and outcomes. J. Account. Organ. Chang. 2012, 8, 528–538. [Google Scholar] [CrossRef]
- Vosselman, E. The ‘performativity thesis’ and its critics: Towards a relational ontology of management accounting. Account. Bus. Res. 2014, 44, 181–203. [Google Scholar] [CrossRef]
- Busco, C.; Quattrone, P. Performing business and social innovation through accounting inscriptions: An introduction. Account. Organ. Soc. 2018, 67, 15–19. [Google Scholar] [CrossRef]
- Busco, C.; Quattrone, P. In Search of the “Perfect One”: How accounting as a maieutic machine sustains inventions through generative ‘ in -tensions. Manag. Account. Res. 2018, 39, 1–16. [Google Scholar] [CrossRef]
- Ammons, D.N.; Rivenbark, W.C. Factors influencing the use of performance data to improve municipal services: Evidence from the North Carolina benchmarking project. Public Adm. Rev. 2008, 68, 304–318. [Google Scholar] [CrossRef]
- Moynihan, D. Advocacy and Learning: An Interactive-Dialogue Approach to Performance Information Use. In Performance Information in the Public Sector; Van Dooren, W., Van de Walle, S., Eds.; Palgrave Macmillan: London, UK, 2008. [Google Scholar]
- Kroll, A. Drivers of performance information use: Systematic literature review and directions for future research. Public Perform. Manag. Rev. 2015, 38, 459–486. [Google Scholar] [CrossRef]
- Moynihan, D.; Lavertu, S. Does Involvement in Performance Management Routines Encourage Performance Information Use? Evaluating GPRA and PART. Public Adm. Rev. 2012, 72, 592–602. [Google Scholar] [CrossRef]
- Van de Walle, S.; van Dooren, W. How is Information Used to Improve Performance in the Public Sector? Exploring the Dynamics of Performance Information. In Connecting Knowledge and Performance in Public Services: From Knowing to Doing; Walshe, K., Harvey, G., Jas, P., Eds.; Cambridge University Press: Cambridge, UK, 2009; pp. 1–26. Available online: https://core.ac.uk/reader/18517941 (accessed on 2 January 2024).
- Lane, D.C. Modelling as learning: A consultancy methodology for enhancing learning in management teams. Eur. J. Oper. Res. 1992, 59, 64–84. [Google Scholar] [CrossRef]
- Lane, D.C. What Is a ‘Policy Insight’? Syst. Res. Behav. Sci. 2012, 29, 590–595. [Google Scholar] [CrossRef]
- Berg, B.L. Qualitative Research Methods for the Social Sciences, 4th ed.; Allyn and Bacon: Boston, MA, USA, 2001. [Google Scholar]
- Gerlak, A.K.; Heikkila, T. Building a theory of learning in collaboratives: Evidence from the Everglades restoration program. J. Public Adm. Res. Theory 2011, 21, 619–644. [Google Scholar] [CrossRef]
- Laihonen, H.; Mäntylä, S. Principles of performance dialogue in public administration. Int. J. Public Sect. Manag. 2017, 30, 414–428. [Google Scholar] [CrossRef]
- Rajala, T.; Laihonen, H. Fragmentation and performance dialogues in public management. Int. J. Public Sector Manag. 2022. ahead-of-print. [Google Scholar] [CrossRef]
- Vignieri, V. Destination Governance at Stake: Fostering Policy Coordination Among Decision-Makers of a Small Town. Tour. Plan. Dev. 2019, 16, 556–574. [Google Scholar] [CrossRef]
- Behn, R. The big questions of public management. Public Adm. Rev. 1995, 55, 313–324. [Google Scholar] [CrossRef]
- Bouckaert, G. The History of the Productivity Movement. Public Product. Manag. Rev. 1990, 14, 53. [Google Scholar] [CrossRef]
- Bouckaert, G. Measurement and Meaningful Management. Public Product. Manag. Rev. 1993, 17, 31. [Google Scholar] [CrossRef]
- Moore, M.H. Creating Public Value: Strategic Management in Government; Harvard University Press: Cambridge, MA, USA, 1995. [Google Scholar]
- Bovaird, T. The Political Economy of Performance Measurement. In Organizational Performance and Measurement in the Public Sector: Toward Service, Efforts and Accomplishment Reporting; Halachmi, A., Bouckaert, G., Eds.; Quorum Books: Westport, CT, USA, 1996; pp. 145–165. [Google Scholar]
- Emerson, K.; Nabatchi, T. Collaborative Governance Regimes; Georgetown University Press: Washington, DC, USA, 2015. [Google Scholar]
- Moynihan, D. The Dynamics of Performance Management; Georgetown University Press: Washington, DC, USA, 2008. [Google Scholar]
- Rajala, T.; Laihonen, H. Managerial choices in orchestrating dialogic performance management. Balt. J. Manag. 2019, 14, 141–157. [Google Scholar] [CrossRef]
- Revellino, S.; Mouritsen, J. Accounting as an engine: The performativity of calculative practices and the dynamics of innovation. Manag. Account. Res. 2015, 28, 31–49. [Google Scholar] [CrossRef]
- Amernic, J.; Craig, R. Understanding accounting through conceptual metaphor: Accounting is an instrument? Crit. Perspect. Account. 2009, 20, 875–883. [Google Scholar] [CrossRef]
- MacKenzie, D. An Engine, Not a Camera: How Financial Models Shape Markets; MIT Press: Cambridge, MA, USA, 2008. [Google Scholar]
- Sterman, J. Business Dynamics: Systems Thinking and Modeling for a Complex World; Irwin/McGraw-Hill: New York, NY, USA, 2000. [Google Scholar]
- Weick, K.E. Sensemaking in Organizations; Sage: Thousand Oaks, CA, USA, 1995. [Google Scholar]
- Kleinmuntz, D.N. Cognitive Heuristics and Feedback in a Dynamic Decision Environment. Manag. Sci. 1985, 31, 680–702. [Google Scholar] [CrossRef]
- Forrester, J.W. Industrial Dynamics; MIT Press: Cambridge, MA, USA, 1980. [Google Scholar]
- Simon, H.A. Administrative Behavior: A Study of Decision-Making Process in Administrative Organization, 1st ed.; Macmillian: New York, NY, USA, 1947. [Google Scholar]
- Sterman, J. Learning in and about complex systems. Syst. Dyn. Rev. 1994, 10, 291–330. [Google Scholar] [CrossRef]
- Mohring, H. Maximizing, measuring, and not double counting transportation-improvement benefits: A primer on closed- and open-economy cost-benefit analysis. Transp. Res. Part B Methodol. 1993, 27, 413–424. [Google Scholar] [CrossRef]
- Thissen, W.; Walker, W.E. Public Policy Analysis; Thissen, W., Walker, W.E., Eds.; Springer: New York, NY, USA, 2013; Volume 179. [Google Scholar] [CrossRef]
- Prest, A.R.; Turvey, R. Cost-Benefit Analysis: A Survey. Econ. J. 1965, 75, 683–735. [Google Scholar] [CrossRef]
- Bell, S.; Morse, S. Measuring Sustainability: Learning From Doing; Taylor & Francis: New York, NY, USA, 2013. [Google Scholar]
- Innes, J.E.; Booher, D.E. Planning with Complexity. In Planning with Complexity; Routledge: London, UK, 2018. [Google Scholar] [CrossRef]
- Roberts, J.; Scapens, R. Accounting systems and systems of accountability—Understanding accounting practices in their organisational contexts. Account. Organ. Soc. 1985, 10, 443–456. [Google Scholar] [CrossRef]
- Quattrone, P. Management accounting goes digital: Will the move make it wiser? Manag. Account. Res. 2016, 31, 118–122. [Google Scholar] [CrossRef]
- Bovaird, T. Attributing Outcomes to Social Policy Intervention—‘Gold Standard’ or ‘Fool’s Gold’ in Public Policy and Management? Soc. Policy Adm. 2014, 48, 1–23. [Google Scholar] [CrossRef]
- Ansell, C.; Gash, A. Collaborative platforms as a governance strategy. J. Public Adm. Res. Theory 2018, 28, 16–32. [Google Scholar] [CrossRef]
- Otley, D. Performance management under conditions of uncertainty: Some valedictory reflections. Pac. Account. Rev. 2012, 24, 247–261. [Google Scholar] [CrossRef]
- Forrester, J.W. Industrial Dynamics; MIT Press: Cambridge, MA, USA, 1961. [Google Scholar]
- Richardson, G.P. Problems in causal loop diagrams revisited. Syst. Dyn. Rev. 1997, 13, 247–252. [Google Scholar] [CrossRef]
- Forrester, J.W. Urban Dynamics; MIT Press: Cambridge, MA, USA, 1969; Volume 114. [Google Scholar]
- Forrester, J.W. Policies, decisions and information sources for modeling. Eur. J. Oper. Res. 1992, 59, 42–63. [Google Scholar] [CrossRef]
- Morecroft, J.D.W. Strategic Modelling and Business Dynamics: A Feedback Systems Approach; Wiley: New York, NY, USA, 2015. [Google Scholar]
- Wolstenholme, E. System Enquiry: A System Dynamics Approach; Wiley: New York, NY, USA, 1990. [Google Scholar]
- Lane, D.C. The folding star: A comparative reframing and extension of validity concepts in system dynamics. In International System Dynamics Conference; Shimada, T., Saeed, K., Eds.; Gakushuin University: Tokyo, Japan, 1995; Volume 1, pp. 111–130. [Google Scholar]
- Senge, P.; Forrester, J.W. Tests for building confidence in system dynamics models. TIMS Stud. Manag. Sci. 1980, 14, 209–228. [Google Scholar]
- Ghaffarzadegan, N.; Lyneis, J.; Richardson, G.P. How small system dynamics models can help the public policy process. Syst. Dyn. Rev. 2011, 27, 22–44. [Google Scholar] [CrossRef]
- Vennix, J.A.M. Group Model Building: Facilitating Team Learning Using System Dynamics; J. Wiley: New York, NY, USA, 1996. [Google Scholar]
- Heclo, H. Modern Social Politics in Britain and Sweden: From Relief to Income Main-Tenance; Yale University Press: London, UK, 1974. [Google Scholar]
- Meseguer, C. Policy Learning, Policy Diffusion, and the Making of a New Order. ANNALS Am. Acad. Political Soc. Sci. 2005, 598, 67–82. [Google Scholar] [CrossRef]
- Muniesa, F.; Millo, Y.; Callon, M. An Introduction to Market Devices. Sociol. Rev. 2007, 55 (Suppl. S2), 1–12. [Google Scholar] [CrossRef]
- Reason, P.; Bradbury, H. The SAGE Handbook of Action Research: Participative Inquiry and Practice; SAGE Publications: Thousand Oaks, CA, USA, 2007. [Google Scholar]
- Morecroft, J.D.W. System dynamics and microworlds for policymakers. Eur. J. Oper. Res. 1988, 35, 301–320. [Google Scholar] [CrossRef]
- Argyris, C.; Schön, D. Organizational Learning: A Theory of Action Perspective; Addison-Wesley Pub. Co.: Reading, MA, USA, 1978. [Google Scholar]
- Argyris, C.; Putnam, R.; Smith, D.M. Action Science; Jossey-Bass Inc. Pub.: San Francisco, CA, USA, 1985; Volume 13. [Google Scholar]
- Morecroft, J.D.W.; Sterman, J. Modeling for Learning Organizations; Taylor & Francis: New York, NY, USA, 2000. [Google Scholar]
- Bianchi, C. Processi di Apprendimento nel Governo dello Sviluppo della Piccola Impresa: Una Prospettiva Basata sull’integrazione tra Modelli Contabili e di System Dynamics Attraverso i Micromondi; Giuffrè: Milan, Italy, 2001. [Google Scholar]
- Bianchi, C.; Bivona, E. Commercial and financial policies in family firms: The small business growth management flight simulator. Simul. Gaming 2000, 31, 197–229. [Google Scholar] [CrossRef]
- Isaacs, W.; Senge, P. Overcoming limits to learning in computer-based learning environments. Eur. J. Oper. Res. 1992, 59, 183–196. [Google Scholar] [CrossRef]
- Kim, D.H. Learning Laboratories: Designing a Reflective Learning Environment. In Computer-Based Management of Complex Systems: Vol. Proceeding; Milling, P.M., Zahn, E.O.K., Eds.; Springer: Berlin/Heidelberg, Germany, 1989; pp. 327–334. [Google Scholar]
- Senge, P. Organizational learning: A new challenge for system dynamics. In Computer-Based Management of Complex Systems: Vol. Proceeding; Milling, P.M., Zahn, E.O.K., Eds.; Springer: Berlin/Heidelberg, Germany, 1989; pp. 229–236. [Google Scholar]
- Lewin, K. Action research and minority problems. In Resolving Social Conflicts; Lewin, G.W., Ed.; Harper & Row: New York, NY, USA, 1946. [Google Scholar]
- Eden, C.; Huxham, C. Action research for management research. Br. J. Manag. 1996, 7, 75–86. [Google Scholar] [CrossRef]
- Vignieri, V.; Guerrera, A.; Scirè, G. Tourism Governance at Stake: Supporting decision makers in a small town through an Interactive Learning Environment. In Il Governo Aziendale: Tra Tradizione e Innovazione; Marchi, L., Lombardi, R., Anselmi, L., Eds.; Franco Angeli: Milano, MI, Italy, 2016; Volume 2, pp. 127–139. [Google Scholar]
- Moynihan, D.; Fernandez, S.; Kim, S.; LeRoux, K.M.; Piotrowski, S.J.; Wright, B.E.; Yang, K. Performance Regimes Amidst Governance Complexity. J. Public Admin. Res. Theory 2011, 21 (Suppl. S1), i141–i155. [Google Scholar] [CrossRef]
- Ackermann, F.; Andersen, D.F.; Eden, C.; Richardson, G.P. ScriptsMap: A tool for designing multi-method policy-making workshops. Omega 2011, 39, 427–434. [Google Scholar] [CrossRef]
- Saunders, M.; Lewis, P.; Thornhill, A. Research Methods for Business Students; Financial Times/Prentice Hall: Englewood Cliffs, NJ, USA, 2007. [Google Scholar]
- Hovmand, P.; Rouwette, E.; Andersen, D.; Richardson, G.; Calhoun, A.; Rux, K.; Hower, T. Scriptapedia: A Handbook of Scripts for Developing Structured Group Model Building Sessions. In Social Science Media; Radboud Repository of the Radboud University Nijmegen: Nijmegen, The Netherlands, 2011. [Google Scholar]
- Andersen, D.; Richardson, G.P. Scripts for group model building. Syst. Dyn. Rev. 1997, 13, 107–129. [Google Scholar] [CrossRef]
- Black, L.J. When visuals are boundary objects in system dynamics work. Syst. Dyn. Rev. 2013, 29, 70–86. [Google Scholar] [CrossRef]
- Giorgino, M.C.; Barnabè, F.; Kunc, M. Experiencing with visuals in accounting education: The case of integrated reports. The Int. J. of Manag. Ed. 2023, 21, 100809. [Google Scholar] [CrossRef]
- Ruggiero, P. No Longer Only Numbers: An Exploratory Analysis of the Visual Turn in Reporting of Public Sector Organisations. In New Trends in Public Sector Reporting; Manes-Rossi, F., Levy Orelli, R., Eds.; Springer International Publishing: NewYork, NY, USA, 2020; pp. 105–127. [Google Scholar] [CrossRef]
- Miller, P.; O’Leary, T. Mediating instruments and making markets: Capital budgeting, science and the economy. Account. Organ. Soc. 2007, 32, 701–734. [Google Scholar] [CrossRef]
- Miller, P.; Power, M. Accounting, Organizing, and Economizing: Connecting Accounting Research and Organization Theory. Acad. Manag. Ann. 2013, 7, 557–605. [Google Scholar] [CrossRef]
- Alessi, S. Designing educational support in system-dynamics-based interactive learning environments. Simul. Gaming 2000, 31, 178–196. [Google Scholar] [CrossRef]
- Barlas, Y.; Diker, V.G. A dynamic simulation game (UNIGAME) for strategic university management. Simul. Gaming 2000, 31, 331–358. [Google Scholar] [CrossRef]
- Davidsen, P.I. Issues in the design and use of system-dynamics-based interactive learning environments. Simul. Gaming 2000, 31, 170–177. [Google Scholar] [CrossRef]
- Kopainsky, B.; Pedercini, M.; Davidsen, P.I.; Alessi, S.M. A blend of planning and learning: Simplifying a simulation model of national development. Simul. Gaming 2010, 41, 641–662. [Google Scholar] [CrossRef]
- Ceresia, F. A System Dynamics-Based Interactive Learning Environment for Online Formative (Self-)Assessment of Wanna-Be Entrepreneurs’ Performance Management Capabilities. Adm. Sci. 2023, 14, 3. [Google Scholar] [CrossRef]
- Barlas, Y. Formal aspects of model validity and validation in system dynamics. Syst. Dyn. Rev. 1996, 12, 183–210. [Google Scholar] [CrossRef]
- Qudrat-Ullah, H. Yes we can: Improving performance in dynamic tasks. Decis. Support Syst. 2014, 61, 23–33. [Google Scholar] [CrossRef]
- Sterman, J. Appropriate summary statistics for evaluating the historical fit of system dynamics models. Dynamica 1984, 10, 51–66. [Google Scholar]


| Policy Lever | Unit of Measure | Description | |
|---|---|---|---|
| Businesses | New investment switch | Decision rule to invest in expanding the business capacity | |
| Fraction of bank account to invest | % | Fraction of new investment financed through business funds (the rest fractioned through the back loan) | |
| Maintenance reduction fraction | % | Percentage of obsolescence tolerated by the owner | |
| Personal income | EUR/year | Financial withdrawals per year as business owner personal income | |
| Networking expenses | EUR/year | Resource invested in flyers and projects with local partners | |
| Working days per year | days/year | Average number of working days in a year | |
| Mark-up | dimensionless | Ratio between the price and its cost | |
| Unit price | EUR/customer | Average price paid per customer | |
| Museum | Project with school | N° of projects | Number of projects run by the museum |
| Surplus allocation | % | Fraction of cumulative surplus (if any) to current expenditure | |
| Networking expenses | EUR/year | Resource invested in flyers and projects with local partners | |
| Concerts | N° of concerts | Number of concerts organized on average by the museum | |
| Pre-concert contribution | EUR/concerts × year | Average resources spent per concert per year | |
| Exhibitions | N° of exhibitions | Number of exhibitions organized on average by the museum | |
| Pre-exhibition contribution | EUR/exhibition × year | Average resources spent per exhibition per year | |
| Municipality | Surplus allocation | % | Fraction of cumulative surplus (if any) to current expenditure |
| EU-based projects | N° of projects | Number of projects through which apply for EU call for tenders | |
| Resources to museum | EUR/year | Supply of funds to museums | |
| Cleaning, Urban space planning, and Garbage collection | N° of people | Level of services provided to keep the local area clean, well-organized, and safe | |
| Events | N° of events | Number of cultural and touristic events hosted on average by the municipality | |
| AVG event contribution | EUR/event × year | Average supply of funds per event per year |
Disclaimer/Publisher’s Note: The statements, opinions and data contained in all publications are solely those of the individual author(s) and contributor(s) and not of MDPI and/or the editor(s). MDPI and/or the editor(s) disclaim responsibility for any injury to people or property resulting from any ideas, methods, instructions or products referred to in the content. |
© 2024 by the authors. Licensee MDPI, Basel, Switzerland. This article is an open access article distributed under the terms and conditions of the Creative Commons Attribution (CC BY) license (https://creativecommons.org/licenses/by/4.0/).
Share and Cite
Vignieri, V.; Grippi, N. Fostering the “Performativity” of Performance Information Use by Decision-Makers through Dynamic Performance Management: Evidence from Action Research in a Local Area. Systems 2024, 12, 115. https://doi.org/10.3390/systems12040115
Vignieri V, Grippi N. Fostering the “Performativity” of Performance Information Use by Decision-Makers through Dynamic Performance Management: Evidence from Action Research in a Local Area. Systems. 2024; 12(4):115. https://doi.org/10.3390/systems12040115
Chicago/Turabian StyleVignieri, Vincenzo, and Noemi Grippi. 2024. "Fostering the “Performativity” of Performance Information Use by Decision-Makers through Dynamic Performance Management: Evidence from Action Research in a Local Area" Systems 12, no. 4: 115. https://doi.org/10.3390/systems12040115
APA StyleVignieri, V., & Grippi, N. (2024). Fostering the “Performativity” of Performance Information Use by Decision-Makers through Dynamic Performance Management: Evidence from Action Research in a Local Area. Systems, 12(4), 115. https://doi.org/10.3390/systems12040115