Abstract
The proper control of cathode spot motion is the key issue in the application of vacuum arc deposition (VAD). Improving the arc spot discharge requires considering the structure and properties of the deposited films/coatings as well as the deposition velocity, target utilization, etc. To achieve this goal, it is necessary to precisely observe cathode spots during discharge at both microscopic and macroscopic scales. However, how to capture the motion and splitting behavior of cathode spots using simple equipment remains an open question. In this work, we analyze the motion and the splitting behavior of cathode spots considering industry application on a Cr target for VAD under arc currents in the direct mode (70 A, 100 A, 150 A 200 A) and 400 A as a peak value in the pulse mode with two applied magnetic fields (20 Gs and 40 Gs) at the macroscopic scale using a high-speed digital camera, employing different exposure times under an extracted interval of 1 ms ranging from 0.01 ms to 20 ms. Furthermore, the images are also compared when the interval is extended to 2 ms and 4 ms. Considering all factors in the available data, 0.05 ms is suggested as the best exposure time, and 1 ms is suggested as the most suitable extracted interval for cathode spot observation under these conditions. Hopefully, this paper provides a suitable technique for observing the motion and splitting behavior of cathode spots at a macroscopic scale with the purpose of suppressing/eliminating the injection of macroparticles at the source for industrial VAD coating products of high quality.
1. Introduction
Vacuum arc deposition (VAD) has been widely utilized in the deposition of various kinds of dense films/coatings due to the excellent characteristics of the plasma produced from an active cathode spot with the purpose of element transfer from cathodes to substrates under a negative bias [1,2]. The visual impression of a vacuum arc discharge is that there are some highly bright and fast-swimming cathode spots on the cathode surface in a small size and with a very high current density [3,4,5,6]. The cathode spot (CS), as an intense source of electron and ion beams, plays a very important role in maintaining the burning of a vacuum arc [7,8,9], and its motion is the key factor affecting the physical characteristics of the vacuum arc plasma, the utilization of the cathode material, and the quality of the subsequent films/coatings. Nevertheless, as extremely high current density concentrates on a CS in a small area, it causes the appearance and then expansion of a liquid pool inevitably; after that, it triggers a strong ejection of droplets, or so-called macroparticles (MPs) with sizes ranging from submicrometer to over 100 μm [10,11,12], especially if the CS stays in a fixed position on the cathode surface for a slightly longer duration, which can cause not only pollution to the deposited films/coatings, resulting in an increase in the surface roughness and a poor microstructure, but also a serious deterioration of the quality and performance of the films/coatings [13]. This problem prevents VAD from producing desirable films/coatings of high quality, especially at the nanoscale for industry applications in electronics, semiconductor, data storage, and optical areas [14,15].
Over the past fifty years, the structure and dynamics of CSs have become the most important area of discussion and research for high-quality films/coatings by VAD. There is consensus in the literature that external magnetic field-enhanced VAD [16] is a more effective means of reducing MPs at the start of the process (by controlling the CS movement) than other methods such as magnetically ‘steered arcs’ [17], magnetic filters [18,19,20,21], and optimizing the gas flow rate or substrate bias [22,23]. There are two main techniques for reducing MPs: increasing the motion velocity [21] and splitting the CS. Both aim to control the CS motion and thus decrease the discharge power concentration by making the CS remain in a fixed position for a shorter duration or distributing the CS to cover as much cathode surface as possible, thus reducing the liquid molten pool area. Meanwhile, higher CS coverage on the cathode surface will also lead to a higher target utilization rate [24]. To achieve the goal of controlling the CS motion and thus reduce MPs, accurate observation of the movement and the splitting behavior of the CS during arc discharge is necessary. However, how to observe the movement and the splitting behavior of CS exactly remains an open question.
To analyze the CS motion for the controlling mechanism, the available reports can be divided into either micro or macro-observation on the CS at the spatial scale. Generally, micro-observation for CSs was employed to find the smallest spatial structures and fastest temporal events through using complicated equipment [16,25]. However, due to their highly nonstationary nature, it is still hard to observe the microstructure of CSs concisely, and the results reported by different authors are quite contradictory [26].
Cathode spots are highly unusual physical objects and notoriously difficult to measure, as only the light emission from these spots could be imaged. So, it is also very useful and important to observe CS motion at the macro scale by light emission accounting for the very small scale and the very short characteristic time. Researchers have found that macroscopic-scale images of CSs in motion can be easily extracted from a dynamic video captured with a proper exposure time at a suitable interval extracted by a high-speed camera, which is available at universities, educational institutes, and coating factories. Although a lot of research has been carried out on this topic, there is still inconsistency regarding the observing parameters, particularly exposure time, as many values can be found for CS observation among different researchers. In 1950, Gallagher chose 0.25 ms as the exposure time for CS observation, reporting a speed of 75 m/s for CS motion [27]. Song reported their results on arc characteristics with an exposure time of 0.002 ms [28]. Sato et al. [29] used 0.01 ms and 0.17 ms as their exposure times to record CS movement using a high-speed video camera, while Lin et al. used both 0.1 ms [30] and 2 ms [31] as exposure times to record the CS trajectory. In addition, Zhirkov et al. chose 0.125 ms as the exposure time to study the arc dissipation in more detail [32]. Moreover, Tian’s group set two much longer exposure times, 25 ms and 100 ms, to spot trace. They emphasized that the observation was designed to cover a group of spots in ignition but not a single spot event [24]. Furthermore, a range of exposure times from 0.05 ms to 0.066 ms [33] and from 0.04 ms to 0.1 ms [34] were also reported for photographing the spots. In our former work, both 1 ms [35] and 0.05 ms [36] were chosen as exposure times to observe CS movement, by which a new cathode spot was found to be ignited, split, and extinguished repeatedly on the cathode surface. Comparing the general validity of the available results mentioned above, an exposure time in the range of 0.01 ms to 0.25 ms was commonly employed to record CS movement using a commercial high-speed video camera, in which 0.01 ms is the limitation or the minimum exposure time for the camera. However, a specialized investigation of the exposure times for CS observation in VAD is still absent.
It is very useful to observe or image CSs using a camera with proper resolutions for measuring time and space during the arc process for high-quality VAD products. The two resolutions do not need to be very high, as a high-resolution camera is always not only very expensive but also unavailable, especially for industry applications. Actually, a spot is an assembly of emission centers showing fractal properties in both spatial and temporal dimensions [37]. Theoretically, to obtain a clear image of a CS, the exposure time should be set as short as possible, considering that a long exposure time may smear out the image of a fast-changing object undergoing rapid agitation and show only the overall trajectory. However, to acquire a clear image with more information about the CS track, it is better to set the exposure time longer. Thus, there are competing advantages between these techniques that need be balanced properly. At the same time, to obtain the details for a CS, from ignition to splitting and extinction, several sequential intervals have to be extracted from a video by a high-speed camera to not only cover the whole discharge process but also distinguish the episode. So, setting a proper interval is also necessary for this goal.
On the basis of our former research investigating the effects of structures and optimizing the configurations of cathode materials [38,39], the applied magnetic fields [40], the type of cathodic vacuum arc [41] on CS motion for VAD coatings, and their mechanisms, this paper focuses on the motion and splitting behavior of CSs at the macroscopic scale, on a Cr target in a specific and adjustable compound magnetic field, rather than investigating the CS’s microstructure. First, CS images under arc currents of 70 A, 100 A, 150 A and 200 A in direct mode and 400 A as a peak value in pulse mode and two applied magnetic field strengths (20 Gs and 40 Gs) are photographed with a high-speed digital camera for three seconds (the recorded time) using several exposure times: 0.01 ms, 0.03 ms, 0.05 ms to 0.25 ms, and 0.50 ms to 20 ms as the longest exposure time. Then, the images extracted from the records with different intervals from 1 ms to 4 ms are compared. At last, based on the observed results on the cathode spot discharge, the best exposure time and the most suitable extracted interval are suggested for CS observation. Meanwhile, the effect of the arc current and the applied magnetic field on CS motion on the cathode surface is discussed. Compared with our former research, the experimental results related to the observing parameters is emphasized in this work.
2. Experimental Details and Methodology
2.1. Apparatus and Discharge Parameters
An arc ion plating (AIP) device was employed in the experiment, which has been introduced in detail in our previous papers [36,38,39]. In the device, a water-cooled pure Cr target (purity of 99.95%) that is 100 mm in diameter and 30 mm in thickness and an inclined wall shoulder were employed as the cathode arc source. A cathode carrier with an internal chamber accommodating water for cooling that was made of copper was placed behind the cathode. A ring-distributed permanent magnet assembly was arranged behind the target, consisting of several permanent magnets placed uniformly along a circular trajectory. The permanent magnets in the outer ring were placed horizontally (perpendicular to the target surface), while those in the inner ring were placed vertically (parallel to the target surface). This ring-shaped permanent magnet assembly was coupled with an electromagnetic coil behind the target, which generated a distributed magnetic field covering the entire target surface through magnetic circuit superposition. The magnetic field lines were dominated by the transverse direction, distributing uniformly and symmetrically on the target surface. This directional and uniform transverse magnetic field formed a stable constraint on CS, driving it to perform a regular circular motion along the target surface uniformly. The employed electromagnetic coil was made of enameled copper wire that was 1 mm in width, 105 mm in inner diameter, 120 mm in outer diameter, 50 mm in height, and had a total of 600 windings. This coil with a total resistance of 9.6 Ω was connected to a separate current source and controlled by a solid-state relay to permit independent adjustment of the current amplitude, the pulse duration, and the turn-on time of the coil current to ensure that the arc could burn in a uniform quasi-stationary axisymmetric magnetic field (AMF) [42]. The distance between the coil and cathode surface was 5 mm. A magnetometer (SHT-V) was employed to measure the transverse magnetic flux density at the bottom of the inclined wall shoulder, which was justified by altering the current in the electromagnetic coil.
An observation window was installed directly opposite the cathode target on the vacuum chamber with a transparent protective layer that can be replaced to avoid being coated. A blocking component was also placed in front of the observation window for further preventing the cathode ions coating on the window, which can be turned on/off outside the vacuum chamber. A high-speed industrial digital camera model NPX-GS6500UM was placed 1.20 m away from the arc source outside the observation window.
Table 1 shows the specific parameters in the discharge experiments. Before each experiment, the maximum transverse magnetic field strength on the cathode surface was adjusted to 20 Gs and 40 Gs. Afterwards, the vacuum chamber was pumped to 5.0 × 10⁻³ Pa and maintained by a turbomolecular pump, Ar with a gas flow rate of 400 sccm was introduced, and the specimen was first cleaned through Ar glow discharges for 10 min, using a bias voltage of −500 V. Then, the digital arc power supply was turned on, and either a DC or pulse operation arc mode was employed. In the case of the DC mode, the current value was set to 70 A, 100 A, 150 A, and 200 A in turn. In the case of the pulse operation mode, the arc was operated using 70 A as steady base arc current, 400 A as a peak current with a duty cycle of 10%, and a pulse frequency of 25 Hz, as an example. Each instance of CS motion under different observing parameters was recorded. The discharge time was set to 30 min for all experiments.

Table 1.
Experimental discharge parameters for CS motion using high-speed photography.
2.2. Observation on CS Motion and Image Processing
The CS motion under different discharge parameters was monitored through the observation window by the high-speed camera and captured as a dynamic video. The exposure time was set as 0.01 ms, 0.03 ms, 0.05 ms, 0.07 ms, 0.10 ms, 0.15 ms, 0.25 ms 0.5 ms, 1 ms, 5 ms, 10 ms and 20 ms. The cases when the exposure time was chosen as 0.5 ms and more than 0.5 ms (1 ms, 5 ms, 10 ms and 20 ms) are called long exposure cases. The recording time of each set of discharge videos was 3 s, and a total of 211 sets of dynamic video data were included in each experiment.
After capturing dynamic videos of the CS motion under different parameters, images were extracted from each video by post-processing software (Kinovea, version 0.9.5) at an interval of 1 ms except for the cases where the exposure time was more than 1 ms. To find the reproducibility of the results, three groups of images were arbitrarily chosen for each video and compared with each other under the same conditions. About 3000 images were extracted from each video without any magnification, and then the CS characteristics under different parameters were compared. When long exposure times were used, groups of 600, 300 and 150 images were also extracted from the same video (with corresponding intervals of 5 ms, 10 ms, and 20 ms), and these sets were also compared with the cases with the interval of 1 ms. In addition, to ensure comparability, the images extracted under the same interval times (1 ms, 2 ms, 4 ms) labeled similarly.
3. Results and Discussion
3.1. Effect of Exposure Time on the Observation
It is accepted that a CS is a microscopic region whose transverse dimensions are no greater than 10 μm [43]. So, it appears as a bright spot in images taken by an industrial camera, whose motion is actually a process involving the ignition of a new CS and the extinguishment of an old one in sequence. It has been reported that the spot does not exist alone but rather splits into two or more microspots, and there are also microspots accompanied by motion [36]. To identify these characteristic clearly, it is necessary to employ an appropriate exposure time, as all phenomena happen in a very short time. Theoretically, the exposure time for an image should be set as short as possible to prevent the image from being smeared out by the motion of the CSs. In order to distinguish the difference in CS movement, twelve sets of exposure times at a proper interval were designed and performed for the spot dynamics. First, 1 ms was fixed as the interval extracted from the recorded video for the spot images. Then, the effect of longer intervals and longer exposure times on the observable CS characteristics was also considered, which will be discussed in Section 3.2.
3.1.1. The CS Images for Arc Current in DC Mode
First, we compared a series of CS images in sequence (CS motion) in the direct current mode at currents of 70 A, 100 A, 150 A and 200 A for 12 ms in a magnetic field of 20 Gs under exposure times from 0.01 ms to 0.25 ms. Regarding the similarity of these images, the case (for 12 ms) at a current of 70 A and exposure time of 0.03 ms was chosen as an example to show the CS trajectory over the whole process. Then, an image for each of the different exposure times was chosen for each of the four arc currents as well.
We found that a steady arc motion was achieved under all four arc currents, in which the spot moves clockwise, as shown in Figure 1a. Furthermore, the spot exists not as a single one from the beginning to the end but rather often splits into and becomes two microspots in images 2, 3, 4, 7, 10 and 12.

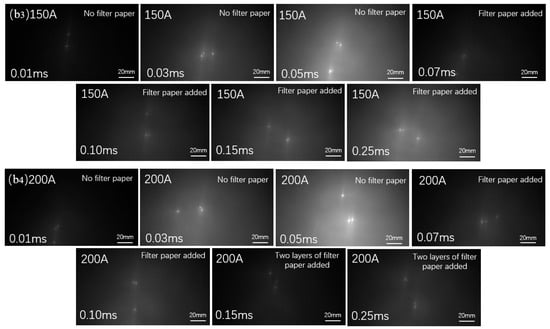
Figure 1.
(a) Arc spot dynamic motion process under an argon gas pressure of 2.0 Pa, at a direct current (DC) of 70 A, and an exposure time of 0.03 ms as an example. Comparison of arc spot discharge characteristics of Cr cathode under an argon gas pressure of 2.0 Pa at arc currents of 70 A (b1), 100 A (b2), 150 A (b3) and 200 A (b4) with exposure times of 0.01 ms, 0.03 ms, 0.05 ms, 0.07 ms, 0.10 ms, 0.15 ms and 0.25 ms.
The effect of exposure time on CS images for the four arc currents is shown in Figure 1b. Generally, it is a little hard to distinguish the spot/microspots in the images when the exposure time is 0.01 ms, especially when the arc current is 70 A and 100 A. However, microspots can be found clearly in the images under all arc currents when the exposure time is increased to 0.03 ms, and the results are almost the same when the exposure time is further increased to 0.05 ms. Meanwhile, a bigger spot appears when the exposure time is 0.07 ms and the arc current is 70 A. When the exposure time is increased to 0.10 ms, 0.15 ms and 0.25 ms, filter paper has to be employed in front of the camera lens to prevent the dazzling light from the spots affecting the image, resulting in dim images of poor quality that make the CS details difficult to distinguish, as shown in Figure 1b.
The effect of the exposure time on the observation results is attributed to both the moving distance and the merging of the microspots. It should be mentioned that the exposure time is a duration rather than a moment, which can be regarded as a point only if it is short enough. It has been widely accepted that a spot moves with a speed of 10–100 m/s during the arc process [16]. Considering 30 m/s as the average CS movement speed, when a CS separates into two microspots that move in opposite directions, they will be 0.3 mm from each other in 0.01 ms theoretically, which is too small to be distinguished by the naked eye from 1.2 m away. However, once they are 0.9 mm apart (after 0.03 ms), and 1.5 mm apart (after 0.05 ms), these distances can be distinguished more easily. It is important to acknowledge that all these values are theoretical distances, which will be shorter in actuality, as the split microspots cannot move in absolute opposite directions. In addition, as mentioned before, the split microspots may merge and resplit during in the arc process. So, it is possible to find only one spot at the merging stage and two subspots at the splitting stage, which is also the reason why a single spot is found in some of the images. Furthermore, it can be predicted that the longer the exposure time is, the farther the distance that the microspot moves. During this process, splitting and merging happen in sequence, and the microspots cannot move in a stable direction, causing a bigger bright spot/microspots to appear in the image which can be regarded as an aggregated state, as shown in images for the cases of 0.07 ms in Figure 1(b1, b2) and 0.05 ms in Figure 1(b3, b4). Our results indicate that a longer exposure time is not suitable for observing CSs, especially when a relatively lower arc current is employed.
It also seems that the number of microspots depend on the arc current, as two microspots can be found when the arc current is 70 A and 100 A, while three even four microspots appear when the arc current is 150 A and 200 A. Furthermore, when the arc current is 70 A, as shown in Figure 1(b1), two microspots appear in most of the images, while a single bigger spot is also visible in a few of the images. However, two microspots appear in all of the images when the arc current reaches 100 A (Figure 1(b2)), indicating that the splitting state of the spot began to stabilize. At this point, it is supposed from the images in Figure 1(b2) that 50 A may be the lowest current for a stable CS under current conditions (or a little higher). It has been reported that the total current for a CS is limited, and if the current is lower, the CS cannot be self-sustained and the arc will be broken, but if the current is larger than double the lowest current, the CS will split spontaneously [44]. Comparing our results between the arc currents of 70 A and 100 A, it can be seen that 70 A is higher than the lowest current but lower than its double value; however, the split state under 70 A cannot be maintained, and the split microspots will merge soon. At this moment, because the arc current density is not high enough to maintain the two microspots, the spots and their currents combine, which is regarded as microspot merging. Therefore, we predict that a single spot will split into two microspots when half of the current is lower than but close to the lowest current for the stable discharge of the spot, which is referred to as the threshold current. When the arc current is further increased to 150 A, then the current has been increased to more than twice the threshold current, and the CS consequently shows a relatively stable splitting state. In some of the images, a spot splits into two microspots and moves independently. Theoretically, each spot carries half of the current (75 A), which is close to the case with the current of 70 A in Figure 1(b1). There is a tendency for continuous secondary splitting, as two microspots show a new split which results in three microspots appearing in several images—even four microspots appear at the exposure time 0.05 ms, although they will soon merge back into two microspots in most of the images in this case. Nearly the same results appear when the arc current is increased to 200 A; thus the details about this case are omitted to save space. In addition, it should be mentioned that the CSs are always in a state of dynamic change between merging and splitting, and the velocity acceleration of the arc spot under a large current will cause an unstable state for the splitting and further increase the frequency of the splitting cycle. As a result, the microspots cannot be separated and always exist in a form of agglomeration. Considering this point, we still recommend selecting shorter exposure times for CS observation to prevent misunderstanding the images that smear out part of the CS trajectory due to the spots’ high speed.
Combining the results mentioned above, it is indicated that under the current conditions, the exposure time should be no shorter than 0.03 ms and no longer than 0.10 ms to observe the spots clearly. And, unlike the CS motion in the pulse operation mode, which will be introduced in the following section, there is no clear evidence to demonstrate the periodic behavior of the constantly merging and resplitting microspots under the direct current mode in this paper.
3.1.2. The CS Images for Arc Current in Pulse Operation Arc Mode
Combining the results mentioned above, it can be found that the spot-splitting state is not ideal and stable in a direct current cathodic arc, and the existence of the periodic extinction phenomenon leads to an unchangeable characteristic of relatively concentrated discharge for the CS, which may result in the appearance of a strong ejection of droplets, which are also called macroparticles. In this section, we turn to the observation of CSs with arc currents in the pulse operation mode.
Figure 2 shows the images of CS motion across the whole process, including characteristics under a magnetic field strength of 20 Gs and an Ar flow rate of 400 sccm in the pulse operation mode with different exposure times. Here, a DC arc current of 70 A is the steady arc current, 400 A is the peak current with a duty cycle of 10%, and the pulse frequency is 25 Hz as an example.
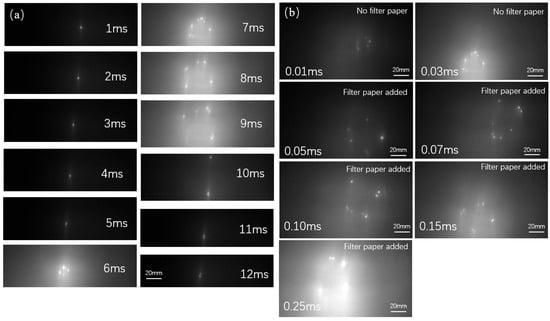
Figure 2.
(a) Pulsed arc spot discharge characteristics of the Cr cathode under argon gas with a pressure adjusted to 2.0 Pa with an exposure time of 0.03 ms at a base current 70 A and a peak current of 400 A at a transverse magnetic field of 20 Gs with a duty cycle of 10%, and a pulse frequency of 25 Hz for 12 ms as an example. (b) Pulsed arc spot discharge characteristics of the Cr cathode under argon gas with a pressure adjusted to 2.0 Pa with exposure times of 0.01 ms, 0.03 ms, 0.05 ms, 0.07 ms, 0.10 ms, 0.15 ms and 0.25 ms at the same conditions.
As can be seen in Figure 2a, the spot also moves clockwise at the base current of 70 A during the period of 0–5 ms, and when the current increases instantaneously to 400 A at 6 ms, between 6 ms and 9 ms, during the peak current, the spot instantly becomes brighter and splits into 6–8 microspots, which expand in a circular shape and can be particularly seen in the image taken during the period over 8–9 ms. Figure 2(a9) represents the spot at the moment of 9–10 ms: the peak period ends, the arc current returns to 70 A, and the spot groups dissipate, leaving only two microspots in motion and then a single spot. As the spot at an arc current of 70 A shows no clear progressive secondary splitting, the images without the peak current are almost the same as those under the direct current of 70 A, as mentioned above. On the other hand, the splitting duration (6–9 ms) of the microspots is attributed to the peak current lasting for 4 ms due to the pulse frequency of 25 Hz and duty cycle of 10%. Notably, this is followed by the base current phase for the spot, which lasts for 36 ms until the start of the next pulse period.
Figure 2b shows the peak current (when the arc current increased to 400 A) and the effect of the exposure time on the observed microspots. Almost the same results happen in the figures with different exposure times: 6–8 microspots appear, last for 4 ms, and repeat every 40 ms in all of these cases, which stems from the splitting of the original (mother) spot and the duration of the peak current. Furthermore, despite an appearance of microspot splitting, this process occurs with a gradual cyclical progression, meaning the splitting effect is invariably inconsistent. In contrast, in the pulsed mode, the plasma zone formed by the base current value of 70 A is less concentrated, and a relatively dense plasma flow is generated when the current jumps to 400 A during the peak period, which is promotes the splitting of the liquid melt pool area and, thus, helps to refine the particles [44]. Comparing the CS images from the pulse operation mode (Figure 2) and DC mode (Figure 1), the CS splitting changes from a discrete state in the DC mode to an aggregated state in the pulse operation mode. Furthermore, it is indicated that the microspots tend to organize in a roughly circular expanding ring, which is attributed to a self-generated transverse magnetic field from the pulsed arc current by the bending and extension of the CS motion trajectory [24].
In summary, both the observed diameter of the spots in the direct current mode and the intense pulsed current superimposed in the direct current mode seem to reduce as the exposure time decreases from 0.25 ms to 0.05 ms, and no new or further splitting occurs when the exposure time is less than 0.05 ms. Furthermore, the microspots will quickly merge and split again, repeating the characteristic periodic motion. Theoretically, the exposure time for the observation of CS motion should be within a limited range capable only with a high-speed camera [34], as individual spots cannot be distinguished in an image taken over a much shorter time interval, while only a spot trajectory will be visible in images taken over a longer time interval (resulting in the ‘bigger diameter’ of the spot). From the results in this paper, exposure times shorter than 0.05 ms are unnecessary if several intervals can be employed, which will cover several episodes of the splitting and merging process. It should be also emphasized that the aim of our observation of CS movement at the macroscale is to distinguish the splitting and merging process, including showing as much of the movement trajectory as possible while utilizing the maximum accuracy and minimum exposure time of an ordinary camera. Thus, we recommend 0.05 ms as the exposure time for the observation on CS movement and characteristic behavior, as has been chosen in our previous research [36,38,40]. In this paper, our attention on CS observation is moved from the microscale to the macroscale by a proper temporal resolution for an acceptable spatial resolution.
3.2. Effect of Long Exposure Time and Interval Extracted on the Observation
When the exposure time is chosen as 0.5 ms (missing in the pulse operation arc mode), 1 ms, 5 ms, 10 ms and 20 ms, respectively, which are designated as long exposure time cases, the CS shows a continuous line (long trajectory) rather than a dazzling bright spot in both the DC arc mode (Figure 3) and pulse operation arc mode (Figure 4), especially at 5 ms, 10 ms and 20 ms. For the exposure times of 0.5 ms and 1 ms, a much bigger spot appears in the images. Tian et al. [24] reported that the CS motion is caused by some fragments dying off and new ones appearing; they chose 25 ms and 200 ms as the exposure times for both the DC and pulse operation arc modes, resulting in images with more fragments and longer traces as the exposure time increased. Although our exposure times were much shorter than theirs, continuous lines were observed in the images with exposure times longer than 0.5 ms. Details (characteristic) related to the CSs splitting and merging cannot be observed if the exposure time is much longer. After analyzing the images mentioned above, we recommend an exposure time no longer than 0.25 ms for CS observation of the motion and splitting behavior.
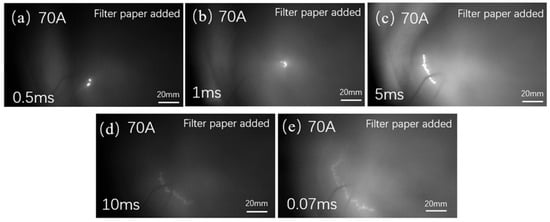
Figure 3.
Arc spot discharge characteristics for Cr cathode with a direct current 70 A under an argon gas pressure of 2.0 Pa with exposure times of 0.5 ms (a), 1.0 ms (b), 5 ms (c), 10 ms (d), and 20 ms (e).
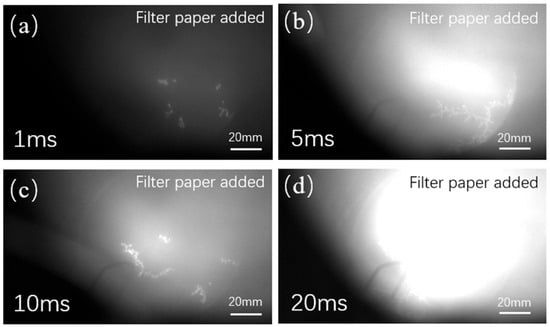
Figure 4.
Pulsed arc spot discharge characteristics of the Cr cathode with the argon gas pressure adjusted to 2.0 Pa with exposure times of 1 ms (a), 5 ms (b), 10 ms (c), and 20 ms (d) at a base current 70 A and a peak current 400 A at a transverse magnetic field of 20 Gs with a duty cycle of 10% and a pulse frequency of 25 Hz.
Comparing the spot motion and trajectory between the direct current mode (Figure 3) and pulsed arc mode (Figure 4), keeping all other conditions the same, it can be found that the high pulsed current of the arc sources attached to a low DC operation produced different CS traces. This could be because the pulsed booster enhances electron emission, and a small DC current helps to stabilize the cathodic arc discharge; we discuss this topic in detail in our former research [38]. It should be mentioned that the enhanced electron emission, one of most attractive features of pulsed current discharge, may affect the plasma density and distribution as well as change the spot movement behavior [24].
Figure 5 shows sequential images when the exposure time is 0.05 ms and the time intervals are 1 ms, 2 ms and 4 ms under currents of 70 A (Figure 5A) and 200 A (Figure 5B). In this case, the images with the 2 ms and 4 ms intervals are selections or fragments from the images with the 1 ms interval to ensure that the comparison is meaningful. It can be seen that the spots travelled a longer distance between neighboring images with 2 ms and 4 ms intervals. However, the trajectories and details related to the spot movement are unclear in the middle images, which makes further analysis on CS splitting and merging difficult.
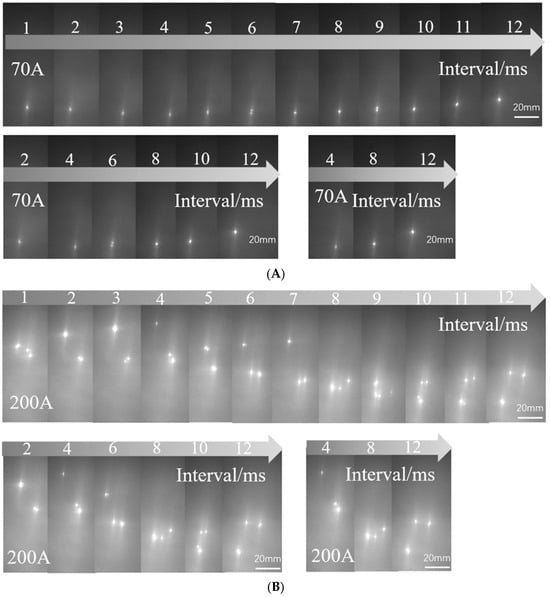
Figure 5.
Comparison on arc spot discharge characteristics for Cr cathode under direct currents of 70 A (A) and 200 A (B) in an argon gas pressure of 2.0 Pa at an exposure time of 0.05 ms with intervals of 1 ms, 2 ms, and 4 ms.
As the images mentioned above are extracted from a video with an interval of 1 ms, considering that the self-splitting of the CS and the merging of the microspots (subspots) are periodic, it is very important to choose a proper interval period to show the characteristic of CS motion clearly. In this case, 1500, 750, 600, 300 and 150 images can be extracted from a video with a length of 3 s, keeping the exposure time as 0.05 ms. Additional intervals of 2 ms, 4 ms, 5 ms, 10 ms and 20 ms were chosen and compared with those at the interval of 1 ms. Taking the cases with the arc currents of 70 A and 200 A mentioned above as examples, it is indicated that the CS motion characteristics are similar in images taken over different interval periods.
As CS motion can be divided into occurrence, splitting, accompanying movement, merging, and re-occurrence at the neighboring position [38], the whole process will repeat sequentially from a statistical point of view. Therefore, the interval chosen has to cover at least two full cycles of the whole process. Then, the CS motion behavior can be inferred by a comparative analysis of sequential intervals. In this paper, the lifetime or duration of a spot is in the range of 3–4 ms for the direct current mode, while it is 4 ms for the pulsed arc spot discharge mode with a duty cycle of 10% and a pulse frequency of 25 Hz. Therefore, the CS movement’s characteristics or evolution can be observed by comparing the difference between neighboring images when 1 ms is chosen as the exact interval. However, this purpose cannot be achieved if 4 ms or longer (duration) is chosen as the interval. The information obtained is also limited when the duration is shorter than 4 ms, such as when 2 ms is chosen as the interval. In summary, as the whole process of a spot motion from occurrence to extinguishment lasts about 3–4 ms in this work, 1 ms is suggested as the longest interval for a clear observation of CS motion.
In summary, considering the instability of a CS, and the periodical appearance of discharged power concentration and spot merging, the CS motion behavior from occurrence to splitting and extinguishment has to be observed within a specific time interval. There is still no recognized value of the CS lifetime, although some researchers regard it in the order of microseconds, such as the 5 ms suggested by Rakahovsky [45]. It is suggested by our results that the extracted interval for CS observation cannot exceed 1 ms, which is better considering the number of the extracted images. Furthermore, it is also unnecessary to choose a value much shorter than 1 ms, as too much time and effort has to be spent, although a little more information can be obtained by analyzing more images.
3.3. Effects of Transverse Magnetic Field Strength on the Observed CS Motion Characteristics
With the purpose of observing CS motion accurately and clearly by a commercial camera, the effect of magnetic field strength as an important factor on CS motion characteristics under different exposure times is also considered and analyzed in this paper. Figure 6 shows the CS images in the direct current mode at a current of 70 A under exposure times from 0.01 ms to 0.25 ms when the magnetic field increases to 40 Gs. In this figure, all the parameters but the magnetic field applied are the same as those in Figure 1. It can be seen that the spot is obviously accelerated compared with that in the magnetic field of 20 Gs (Figure 1) by counting the distance between the two neighboring spots. The increased velocity (about 50 m/s in value) is attributed to the coupling effect of nitrogen poisoning the target and reducing the critical concentration requirement of the spot’s self-sustaining discharge on the positive charge layer under the different magnetic field strengths. Comparing the CS images under the two magnetic fields in Figure 1 and Figure 6, it can be also seen that when the magnetic field strength is 20 Gs, the spots split into two microspot groups under the impact of the primary microexplosion, which are relatively stable, and they exhibit a circular motion in the form of a “binary star” before splitting and merging into smaller microspots independently. When the velocity is not high, the CS splitting behavior is relatively stable, which is conducive to the separation of liquid molten pools. Although in the long run, spots will still disappear and merge, and there will be a concentrated current discharge, the periodicity is relatively long, which accelerates the CS splitting behavior. However, when the magnetic field strength is increased to 40 Gs, it is obvious that the CS stability becomes poor, the split microspots always show a form of agglomeration, and the periodic frequency of the CS splitting and merging is increased significantly, which can be found more clearly upon further increasing the magnetic field strength to 60 Gs, as shown in our former research [36]. Comparing the CS motion across all of the scenarios under a higher magnetic field strength in Figure 6, it can be found that the tendency of the CS trajectory is almost the same as that under 20 Gs, confirming that the 0.05 ms and 1 ms suggestions for the proper exposure time and extracted interval for CS observation are suitable and reliable. In addition, it appears that the life cycle of the microspots after splitting is shorter under the higher magnetic field strength, which may impair the CS splitting behavior.
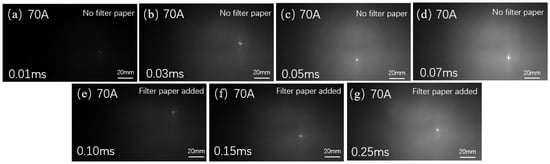
Figure 6.
Arc spot discharge characteristics for Cr cathode with a direct current of 70 A under an argon gas pressure of 2.0 Pa and a magnetic field strength of 40 Gs with exposure times of 0.01 ms (a), 0.03 ms (b), 0.05 ms (c), 0.07 ms (d), 0.10 ms (e), 0.15 ms (f) and 0.25 ms (g).
4. Conclusions
It is important to control the cathode spot motion in order to produce high-quality films/coatings in the application of vacuum arc deposition. The prerequisite of achieving this goal is to observe the cathode spot and its motion behavior clearly, exactly and fully. In this paper, the effects of exposure time and the extracted intervals for the observation on CS motion characteristics are investigated by a Cr target at arc currents of 70 A, 100 A, 150 A and 200 A in the direct mode and 400 A as a peak value in the pulse mode under two transverse magnetic field strengths (20 Gs and 40 Gs) with a high-speed camera. It is indicated that the proper exposure time should range from 0.03 ms to 0.10 ms, and 0.05 ms is suggested for the observation. In the direct arc current mode, 50 A may be actual or a little higher than the threshold current for a stable CS under current conditions. CS splitting and even further splitting appear as the current value increases. In the pulse mode, considering the instability of the spot motion and periodical appearance of the discharge power concentration and spot merger, the suitable extracted interval has to cover one fourth or one fifth of the whole CS motion process from occurrence, splitting, until extinguishment. Thus, 1 ms is suggested as the suitable extracted interval for the observation. Hopefully, this paper may provide other researchers with a reference of how to observe the CS motion and splitting behavior at a macroscopic scale with a commercial ordinary camera for industry applications.
Author Contributions
H.D., writing—original draft, writing—review and editing, methodology, funding acquisition; K.Z., writing—review and editing, formal analysis, data curation, investigation, methodology; D.L., writing—review and editing, funding acquisition; W.L., conceptualization, writing—review and editing, investigation, funding acquisition, supervision. All authors have read and agreed to the published version of the manuscript.
Funding
This research was funded by the Jiangmen Science and Technology Planning Project (grant number KTP20250418), the General Project of Equipment Key Laboratory Fund (grant number 61420052023WD005), the Research Initiation Project of Guangzhou Maritime University/Guangzhou Jiaotong University (grant number K42022105), the Natural Science Foundation of Zhejiang Province (grant number LY19E010004), and the Major Scientific and Technological Innovation Project in Wenzhou City (grant numbers ZG2022033, ZG2021022).
Institutional Review Board Statement
Not applicable.
Informed Consent Statement
Not applicable.
Data Availability Statement
The data that support the findings of this study are available from the corresponding author upon reasonable request.
Conflicts of Interest
The third author, Debin Liu, employed by Guangdong Jinhong New Materials Co., Ltd., discloses his conflict of interest as outlined by the MDPI guidelines, that his contributions to this work and manuscript were made independently without any requirement, guidance or input by his employer, and he received no financial compensation from any source for his contributions. The remaining authors declare that the research was conducted in the absence of any commercial or financial relationships that could be construed as a potential conflict of interest.
References
- Kimblin, C.W. Cathode spot erosion and ionization phenomena in the transition from vacuum to atmospheric pressure arcs. J. Appl. Phys. 1974, 45, 5235–5244. [Google Scholar] [CrossRef]
- Zhitomirsky, V.N.; Zarchin, O.; Boxman, R.L.; Goldsmith, S. Transport of a Vacuum-Arc Produced Plasma Beam in a Mag-netized Cylindrical Duct. IEEE Trans. Plasma Sci. 2003, 31, 977–982. [Google Scholar] [CrossRef]
- Boxman, R.L.; Goldsmith, S.; Izraeli, I.; Shalev, S. A Model of the Multicathode-Spot Vacuum Arc. IEEE Trans. Plasma Sci. 1983, 11, 138–145. [Google Scholar] [CrossRef]
- Jüttner, B. Cathode spots of electric arcs. J. Phys. D Appl. Phys. 2001, 34, R103–R123. [Google Scholar] [CrossRef]
- Beilis, I. A mechanism for nanosecond cathode spot operation in vacuum arcs. IEEE Trans. Plasma Sci. 2001, 29, 844–847. [Google Scholar] [CrossRef]
- Beilis, I. State of the theory of vacuum arcs. IEEE Trans. Plasma Sci. 2001, 29, 657–670. [Google Scholar] [CrossRef]
- Hantzsche, E. Mysteries of the arc cathode spot: A retrospective glance. IEEE Trans. Plasma Sci. 2003, 31, 799–808. [Google Scholar] [CrossRef]
- Chaly, A.; Logatchev, A.; Shkol’NIk, S. Cathode spot dynamics on pure metals and composite materials in high-current vacuum arcs. IEEE Trans. Plasma Sci. 1997, 25, 564–570. [Google Scholar] [CrossRef]
- Beilis, I. Vacuum arc cathode spot grouping and motion in magnetic fields. IEEE Trans. Plasma Sci. 2002, 30, 2124–2132. [Google Scholar] [CrossRef]
- Utsumi, T.; English, J.H. Study of electrode products emitted by vacuum arcs in form of molten metal particles. J. Appl. Phys. 1975, 46, 126–131. [Google Scholar] [CrossRef]
- Anders, A. Growth and decay of macroparticles: A feasible approach to clean vacuum arc plasmas? J. Appl. Phys. 1997, 82, 3679–3688. [Google Scholar] [CrossRef]
- Daalder, J. Cathode spots and vacuum arcs. Phys. B+C 1981, 104, 91–106. [Google Scholar] [CrossRef]
- McClure, G.W. Plasma expansion as a cause of metal displacement in vacuum-arc cathode spots. J. Appl. Phys. 1974, 45, 2078–2084. [Google Scholar] [CrossRef]
- Tay, B.; Zhao, Z.; Chua, D. Review of metal oxide films deposited by filtered cathodic vacuum arc technique. Mater. Sci. Eng. R Rep. 2006, 52, 1–48. [Google Scholar] [CrossRef]
- Wang, F.Z. Advances in cathode arc ion plating technology. Vac. Cryog. 2020, 26, 87–95. [Google Scholar]
- Jüttner, B.; Kleberg, I. The retrograde motion of arc cathode spots in vacuum. J. Phys. D Appl. Phys. 2000, 33, 2025–2036. [Google Scholar] [CrossRef]
- Swift, P.D. Macroparticles in films deposited by steered cathodic arc. J. Phys. D Appl. Phys. 1996, 29, 2025. [Google Scholar] [CrossRef]
- Karpov, D. Cathodic arc sources and macroparticle filtering. Surf. Coatings Technol. 1997, 96, 22–33. [Google Scholar] [CrossRef]
- Martin, P.; Bendavid, A. The filtered arc process and materials deposition. Surf. Coatings Technol. 2001, 142–144, 7–10. [Google Scholar] [CrossRef]
- Martin, P.J.; Bendavid, A. Review of the filtered vacuum arc process and materials deposition. Thin Solid Film. 2004, 394, 1–14. [Google Scholar] [CrossRef]
- Boxman, R.; Beilis, I.; Gidalevich, E.; Zhitomirsky, V. Magnetic control in vacuum arc deposition: A review. IEEE Trans. Plasma Sci. 2005, 33, 1618–1625. [Google Scholar] [CrossRef]
- Huang, M.; Lin, G.; Zhao, Y.; Sun, C.; Wen, L.; Dong, C. Macro-particle reduction mechanism in biased arc ion plating of TiN. Surf. Coatings Technol. 2003, 176, 109–114. [Google Scholar] [CrossRef]
- Ali, M.; Hamzah, E.; Abbas, T.; Toff, M.R.H.M.; Qazi, I.A. Macrodroplet reduction and growth mechanisms in cathodic arc physical vapor deposition of TiN films. Surf. Rev. Lett. 2008, 15, 653–659. [Google Scholar] [CrossRef]
- Ma, Y.; Gong, C.; Tian, X.; Chu, P.K. Imaging and motion of cathode group spots during pulse-enhanced vacuum arc evaporation. Vacuum 2017, 139, 37–43. [Google Scholar] [CrossRef]
- Juttner, B. The dynamics of arc cathode spots in vacuum. J. Phys. D Appl. Phys. 1995, 28, 516–522. [Google Scholar] [CrossRef]
- Anders, A.; Yushkov, G.Y. Ion flux from vacuum arc cathode spots in the absence and presence of a magnetic field. J. Appl. Phys. 2002, 91, 4824–4832. [Google Scholar] [CrossRef]
- Gallagher, C.J. The Retrograde Motion of the Arc Cathode Spot. J. Appl. Phys. 1950, 21, 768–771. [Google Scholar] [CrossRef]
- Song, X.; Shi, Z.; Liu, C.; Yang, H.; Ma, M.; Jia, S.; Wang, L. Experimental Investigation on the Characteristics of Drawn Vacuum Arc in Initial Expanding Stage and in Forced Current-Zero Stage. IEEE Trans. Plasma Sci. 2011, 39, 1330–1335. [Google Scholar] [CrossRef]
- Sato, A.; Iwao, T.; Yumoto, M. Relation between surface roughness and number of cathode spots of a low-pressure arc. Plasma Sources Sci. Technol. 2008, 17, 045007. [Google Scholar] [CrossRef]
- Wang, S.; Lin, Z.; Qiao, H.; Ba, D.; Zhu, L. Influence of a Scanning Radial Magnetic Field on Macroparticle Reduction of Arc Ion-Plated Films. Coatings 2018, 8, 49. [Google Scholar] [CrossRef]
- Song, X.; Wang, Q.; Lin, Z.; Zhang, P.; Wang, S. Control of vacuum arc source cathode spots contraction motion by changing electromagnetic field. Plasma Sci. Technol. 2018, 20, 025402. [Google Scholar] [CrossRef]
- Zhirkov, I.; Petruhins, A.; Rosen, J. Effect of cathode composition and nitrogen pressure on macroparticle generation and type of arc discharge in a DC arc source with Ti–Al compound cathodes. Surf. Coatings Technol. 2015, 281, 20–26. [Google Scholar] [CrossRef]
- Sherman, J.C.; Webster, R.; Jenkins, J.E.; Holmes, R. Cathode spot motion in high current vacuum arcs on copper electrodes. J. Phys. D Appl. Phys. 1975, 8, 696–702. [Google Scholar] [CrossRef]
- Aganval, M.S.; Holmes, R. Cathode spot motion in high-current vacuumarcs under self-generated azimuthal and applied axial magnetic fields. J. Phys. D Appl. Phys. 1984, 17, 743–756. [Google Scholar]
- Lang, W.; Xiao, J.; Gong, J.; Sun, C.; Huang, R.; Wen, L. Study on cathode spot motion and macroparticles reduction in axisymmetric magnetic field-enhanced vacuum arc deposition. Vacuum 2010, 84, 1111–1117. [Google Scholar] [CrossRef]
- Zhang, K.; Lang, W.; Du, H.; Huang, Z.; Gao, B.; Wang, X. Study on microspot splitting characteristics in cathode spot motion of vacuum arc. Vacuum 2023, 213, 112151. [Google Scholar] [CrossRef]
- Anders, A. Cathodic Arcs: From Fractal Spots to Energetic Condensation; Springer Inc.: New York, NY, USA, 2008. [Google Scholar]
- Zhang, K.; Lang, W.; Du, H.; Chen, Z.; Wei, X.; Wang, X.; Gao, B. Comparative study of the microspot splitting characteristics of direct-current and pulsed cathodic vacuum arc. J. Vac. Sci. Technol. A 2023, 41, 053105. [Google Scholar] [CrossRef]
- Du, H.; Zhang, K.; Xu, F.; Zuo, D.W.; Lang, W.C. Investigation of Arc Spot Splitting behavior on Cathodes from Aluminum, Titanium, and their alloy under flow of different gases. J. Vac. Sci. Technol. A 2024, 42, 063106. [Google Scholar] [CrossRef]
- Du, H.; Zhang, K.; Liu, D.; Lang, W. Progress in the Circular Arc Source Structure and Magnetic Field Arc Control Technology for Arc Ion Plating. Materials 2025, 18, 3498. [Google Scholar] [CrossRef]
- Lang, W.; Zhang, K.; Du, H.; Zhao, Z.; Wang, D.; Wang, X.; Gao, B. Study on the microspot splitting characteristics of pulsed cathodic vacuum arc. Vacuum 2024, 221, 112920. [Google Scholar] [CrossRef]
- Lang, W.C. Design and Performance of the Transverse Rotating Magnetic Field Steered Arc Source Used in Vacuum Arc Deposition. Adv. Mater. Res. 2011, 337, 70–76. [Google Scholar] [CrossRef]
- Robson, A.E. The motion of a low-pressure arc in a strong magnetic field. J. Phys. D Appl. Phys. 1978, 11, 1917–1923. [Google Scholar] [CrossRef]
- Wang, L.; Zhang, X.; Wang, Y.; Yang, Z.; Jia, S. Simulation of cathode spot crater formation and development on CuCr alloy in vacuum arc. Phys. Plasmas 2018, 25, 043511. [Google Scholar] [CrossRef]
- Rakhovsky, V.I. State of the Art of Physical Models of Vacuum Arc Cathode Spots. IEEE Trans. Plasma Sci. 1987, 15, 481–487. [Google Scholar] [CrossRef]
Disclaimer/Publisher’s Note: The statements, opinions and data contained in all publications are solely those of the individual author(s) and contributor(s) and not of MDPI and/or the editor(s). MDPI and/or the editor(s) disclaim responsibility for any injury to people or property resulting from any ideas, methods, instructions or products referred to in the content. |
© 2026 by the authors. Licensee MDPI, Basel, Switzerland. This article is an open access article distributed under the terms and conditions of the Creative Commons Attribution (CC BY) license.