
Micro-Arc Oxidation Phenomenon for Producing Coatings of AZ31B Mg Alloy Using Na3PO4 with Varying KOH Concentrations and Voltages: A Study


Abstract
:1. Introduction
2. Materials and Methods
2.1. Materials
2.2. Pretreatment
2.3. Microarc Oxidation (MAO) Coating
2.4. Characterization and Testing
3. Results and Discussion
3.1. MAO Coating Prepared in Na3PO4 Solution
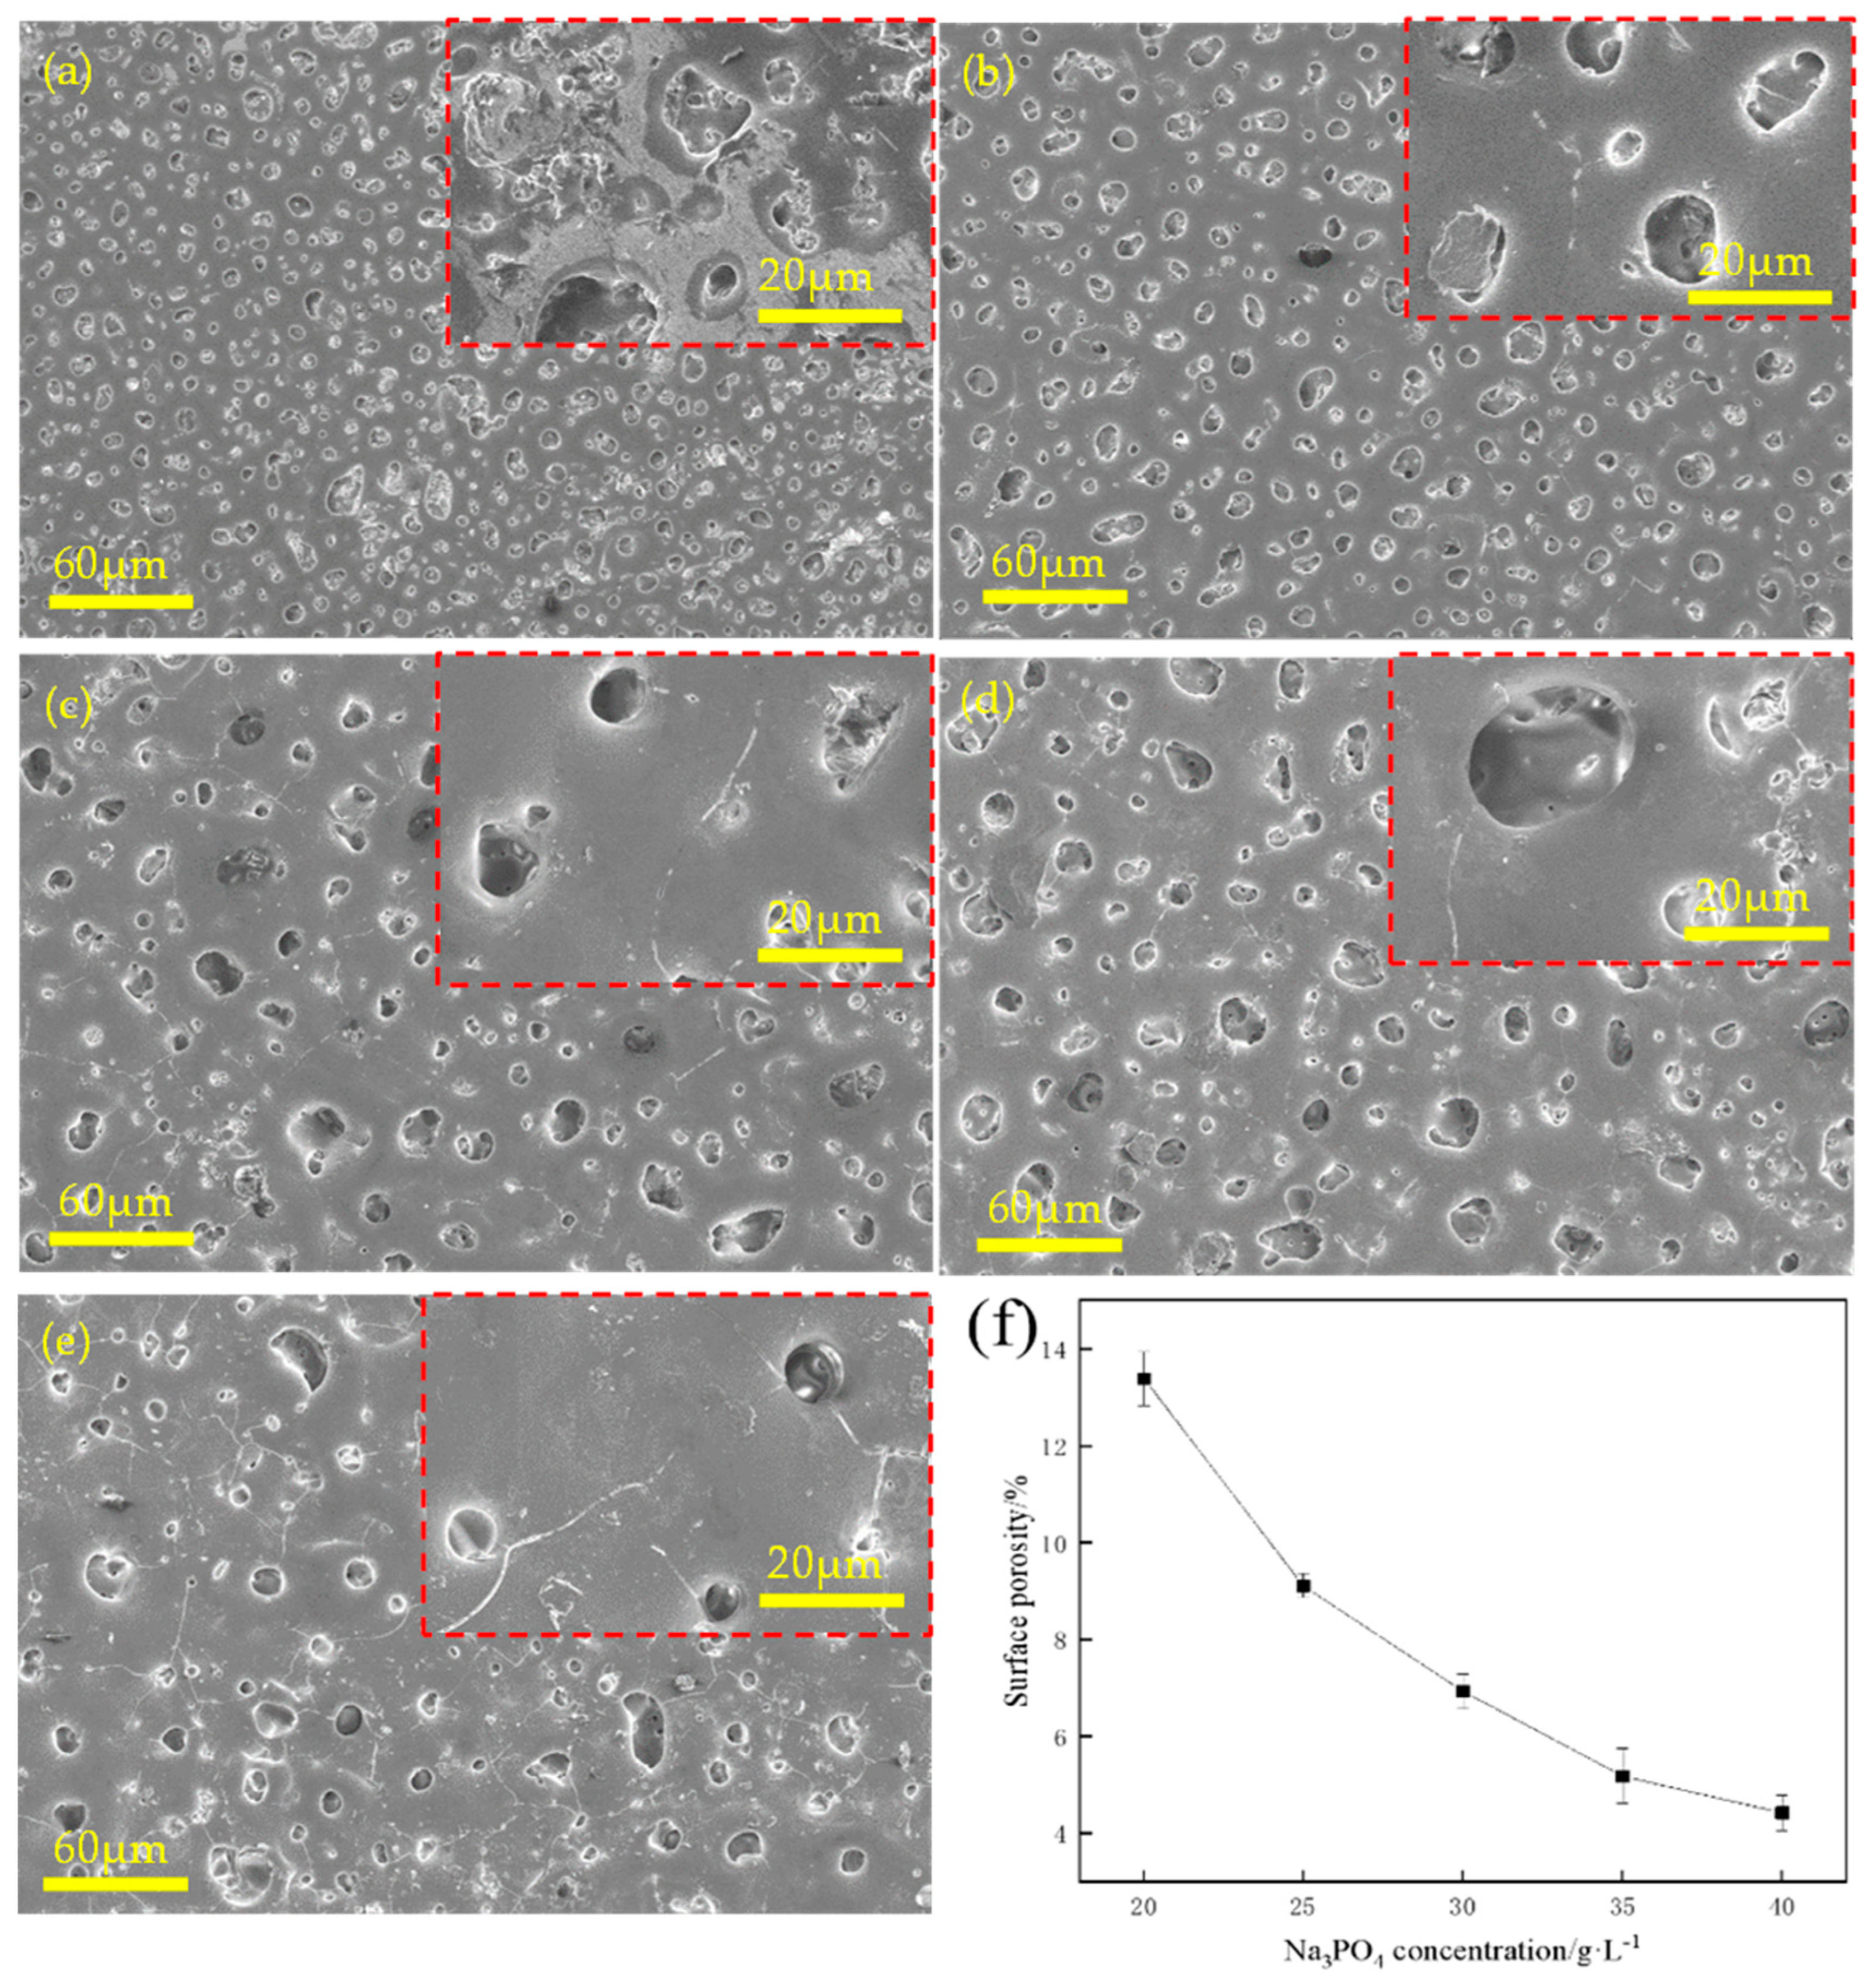
3.1.1. Spark Condition, Surface Morphologies, and Microstructure
3.1.2. Coating Thickness and Roughness
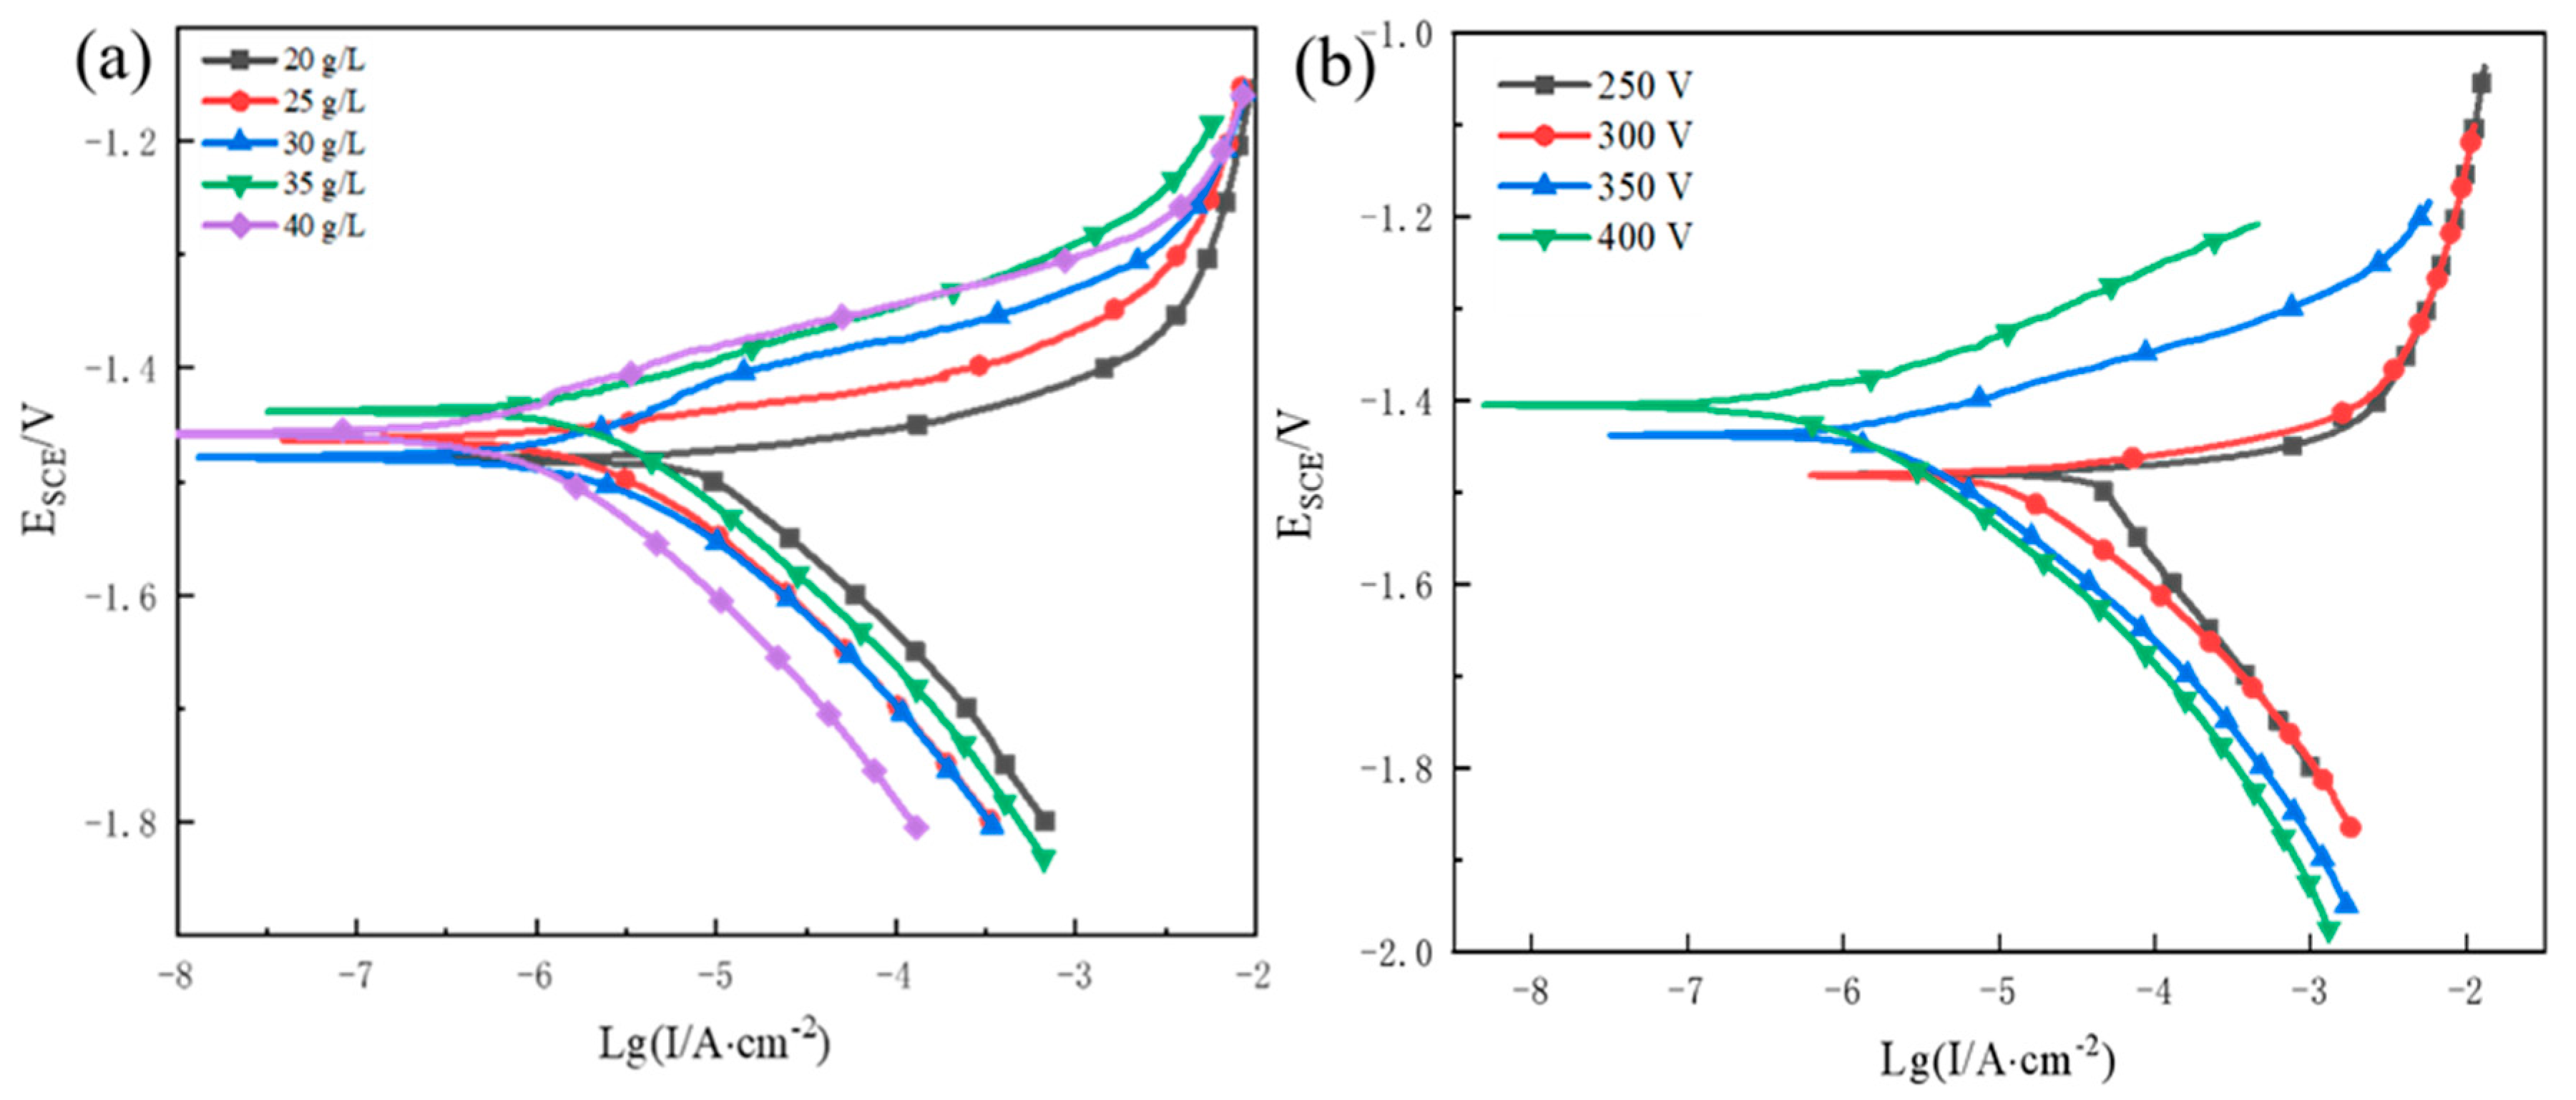
3.1.3. Potentiodynamic Polarisation Test
3.2. MAO Coating Prepared by Na3PO4 + KOH Solution
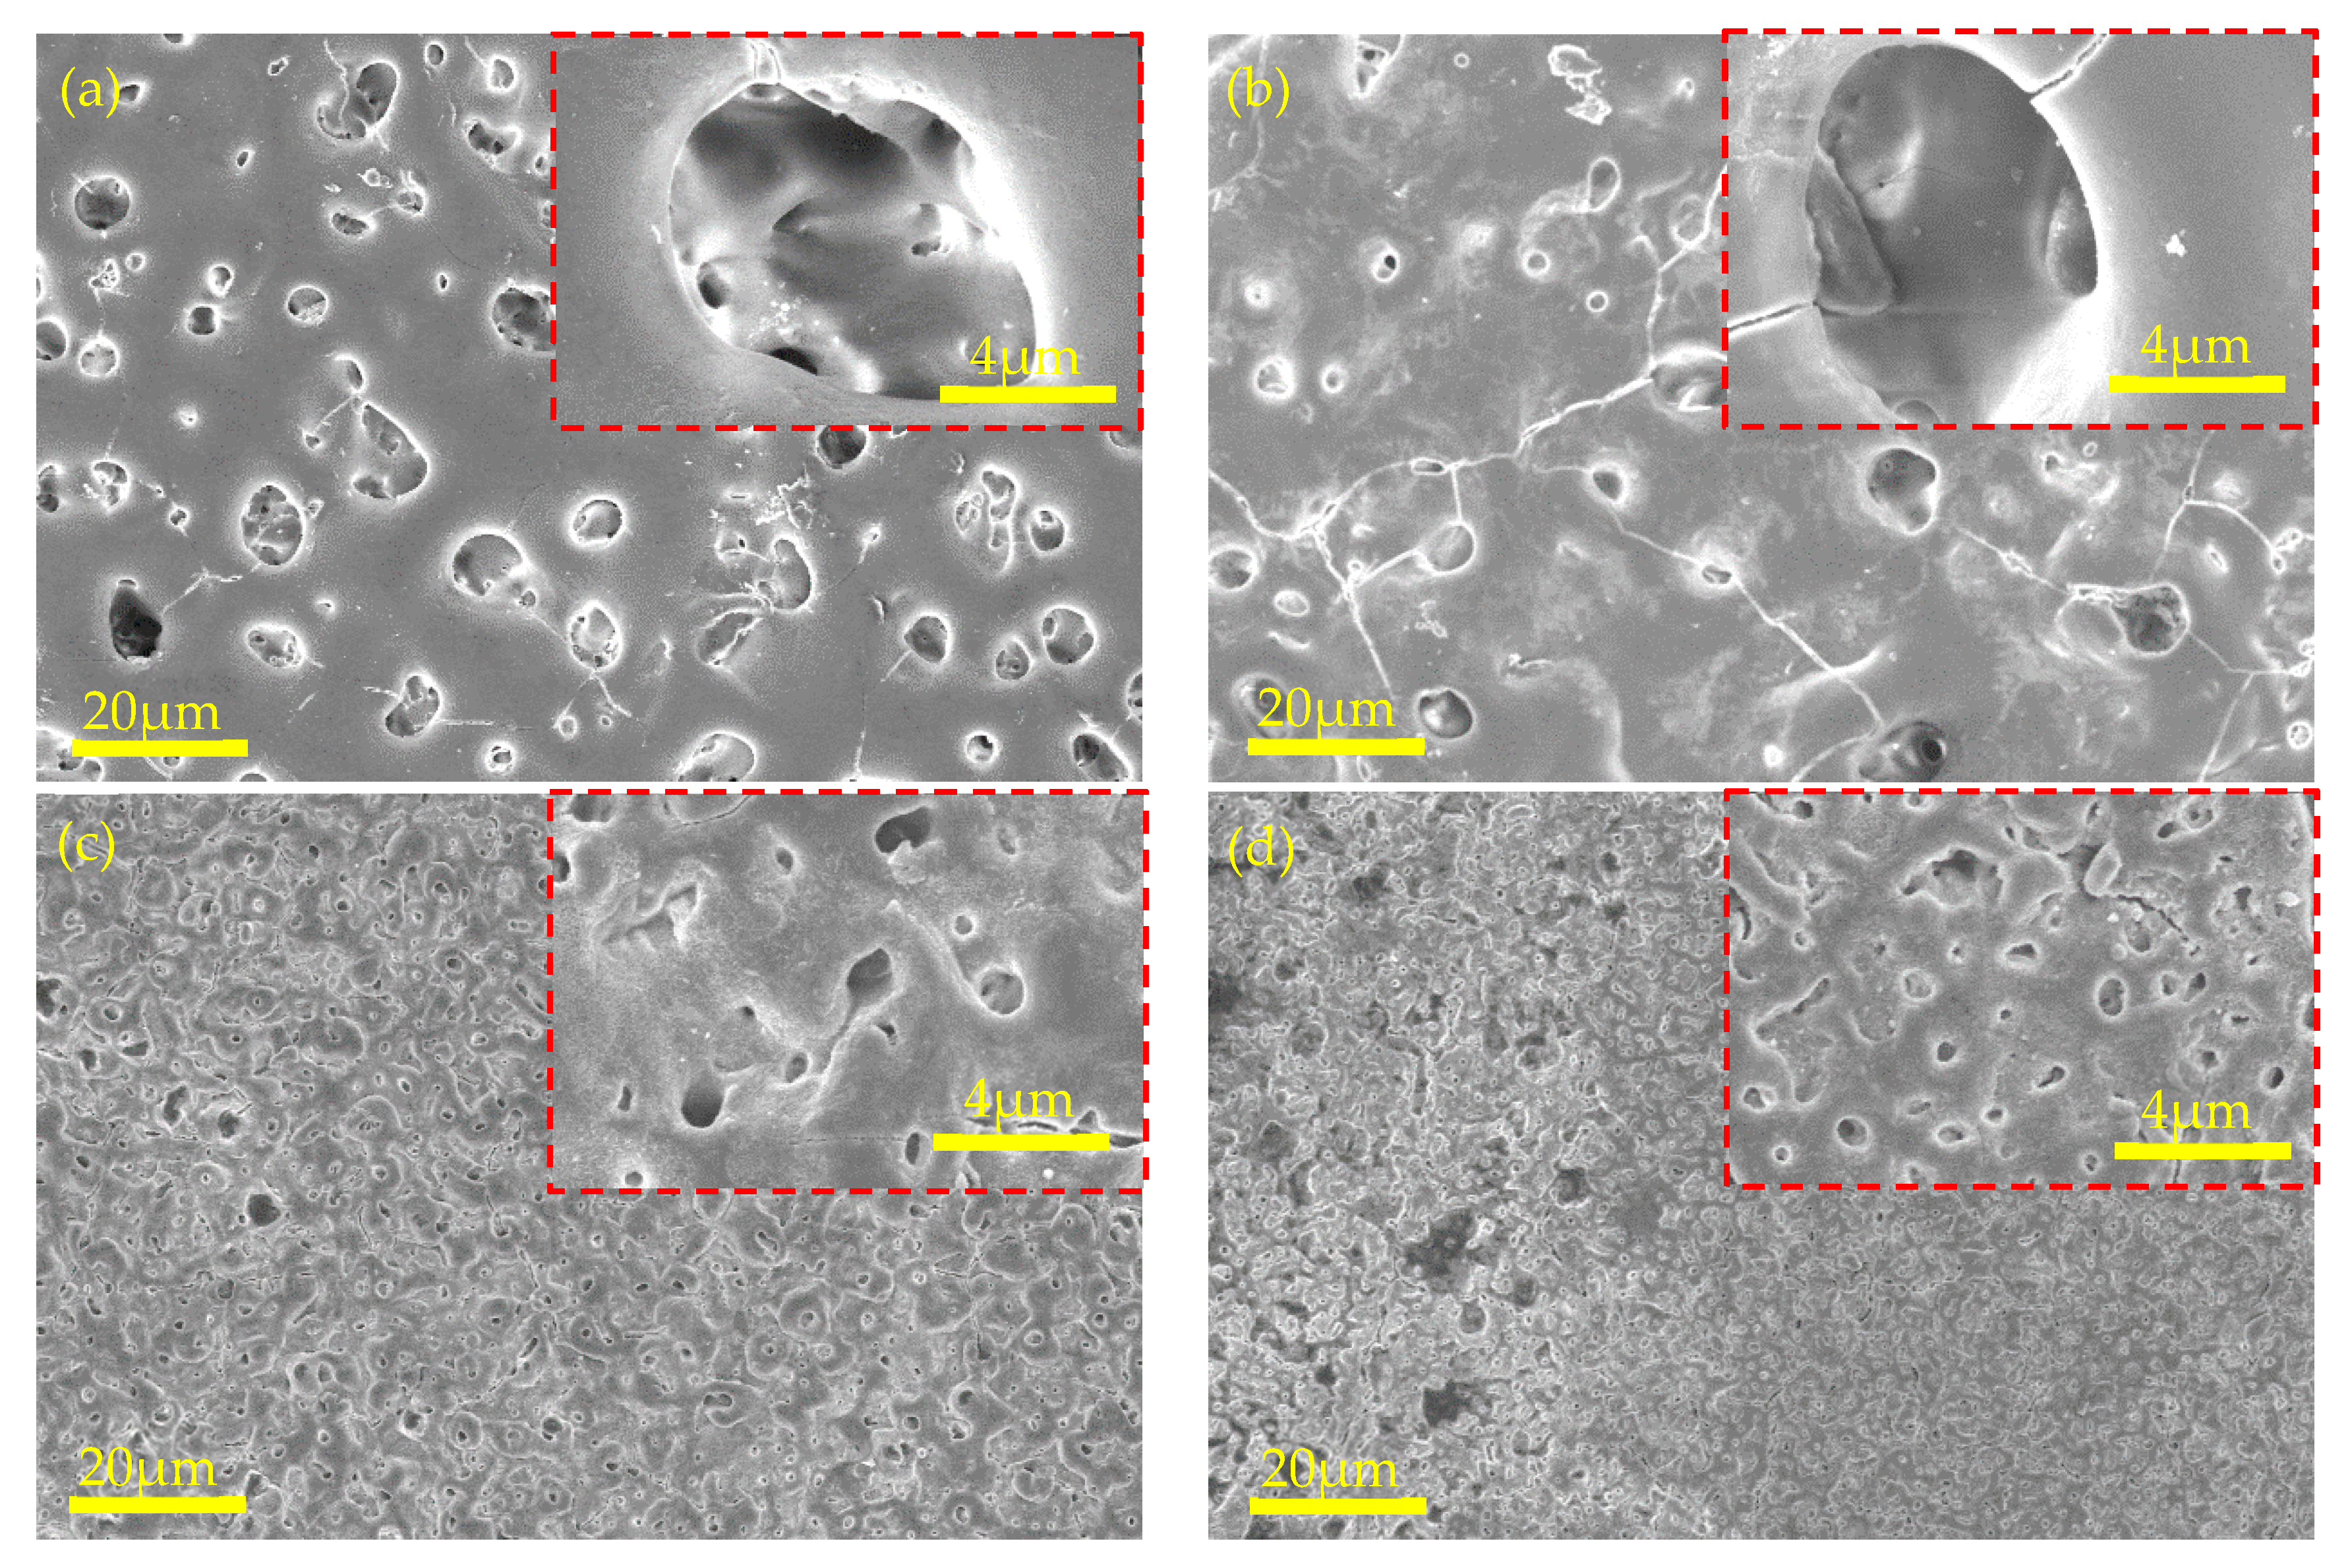
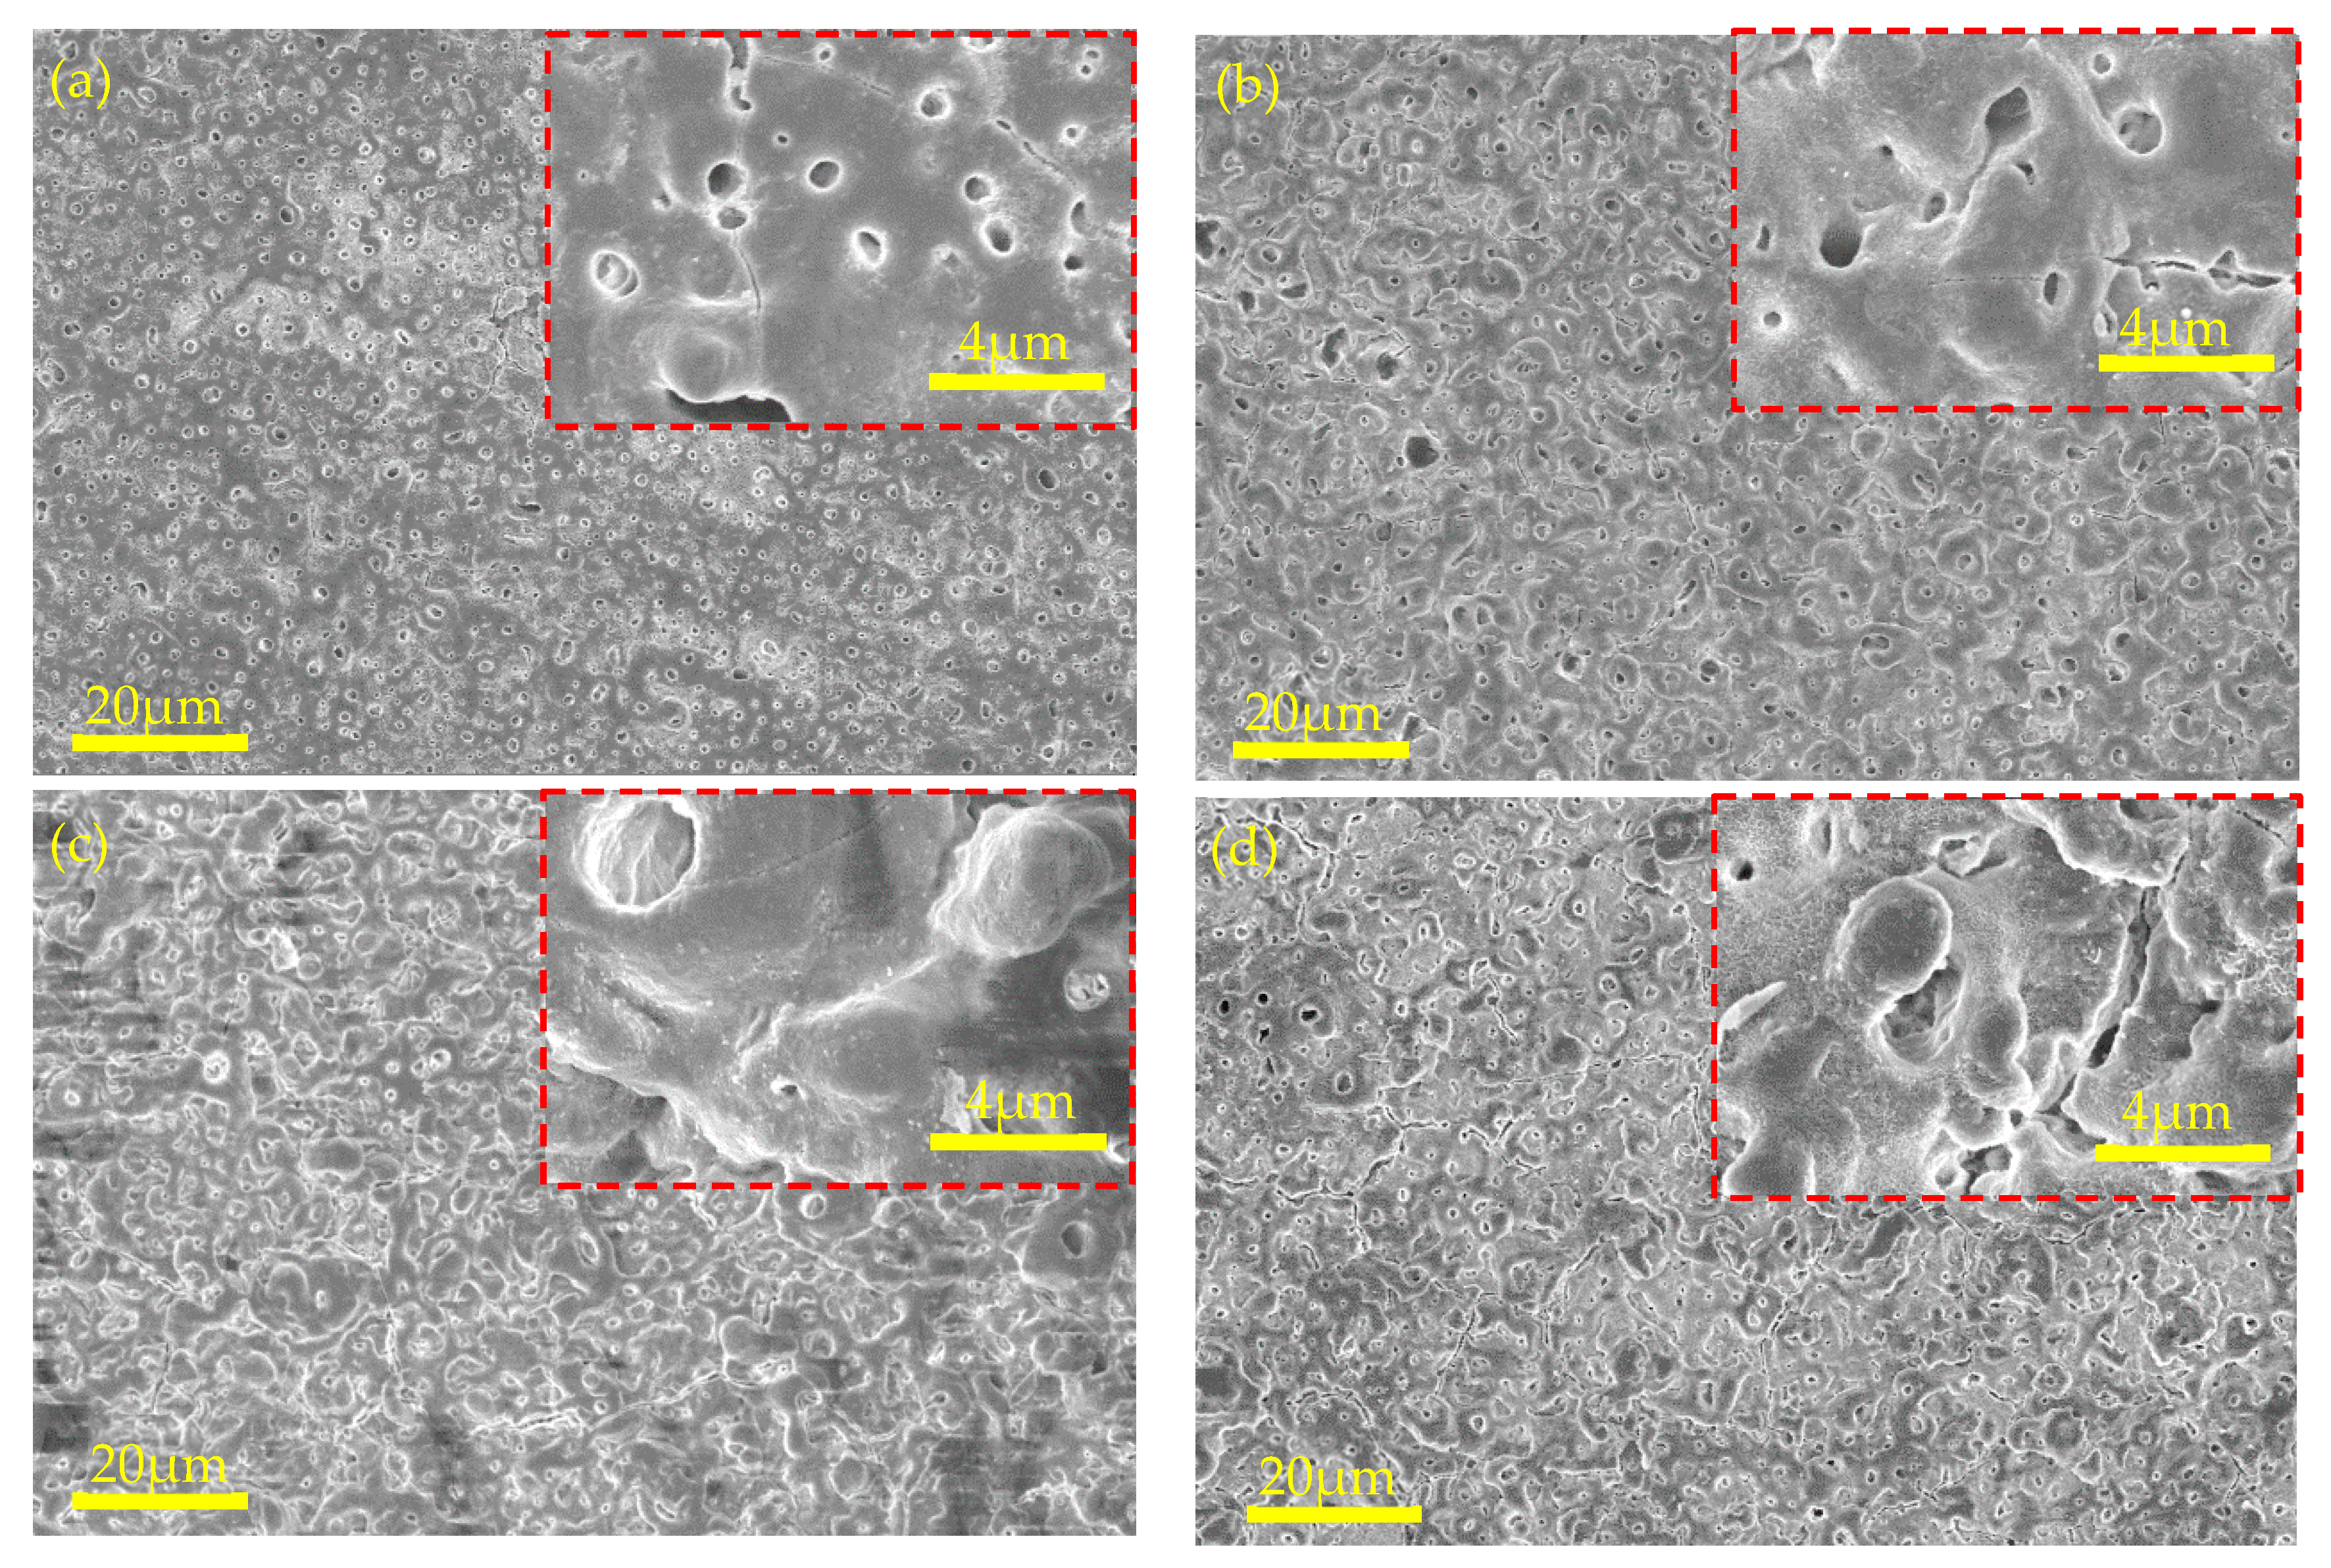
3.2.1. Spark Condition, Surface Morphologies, and Microstructure
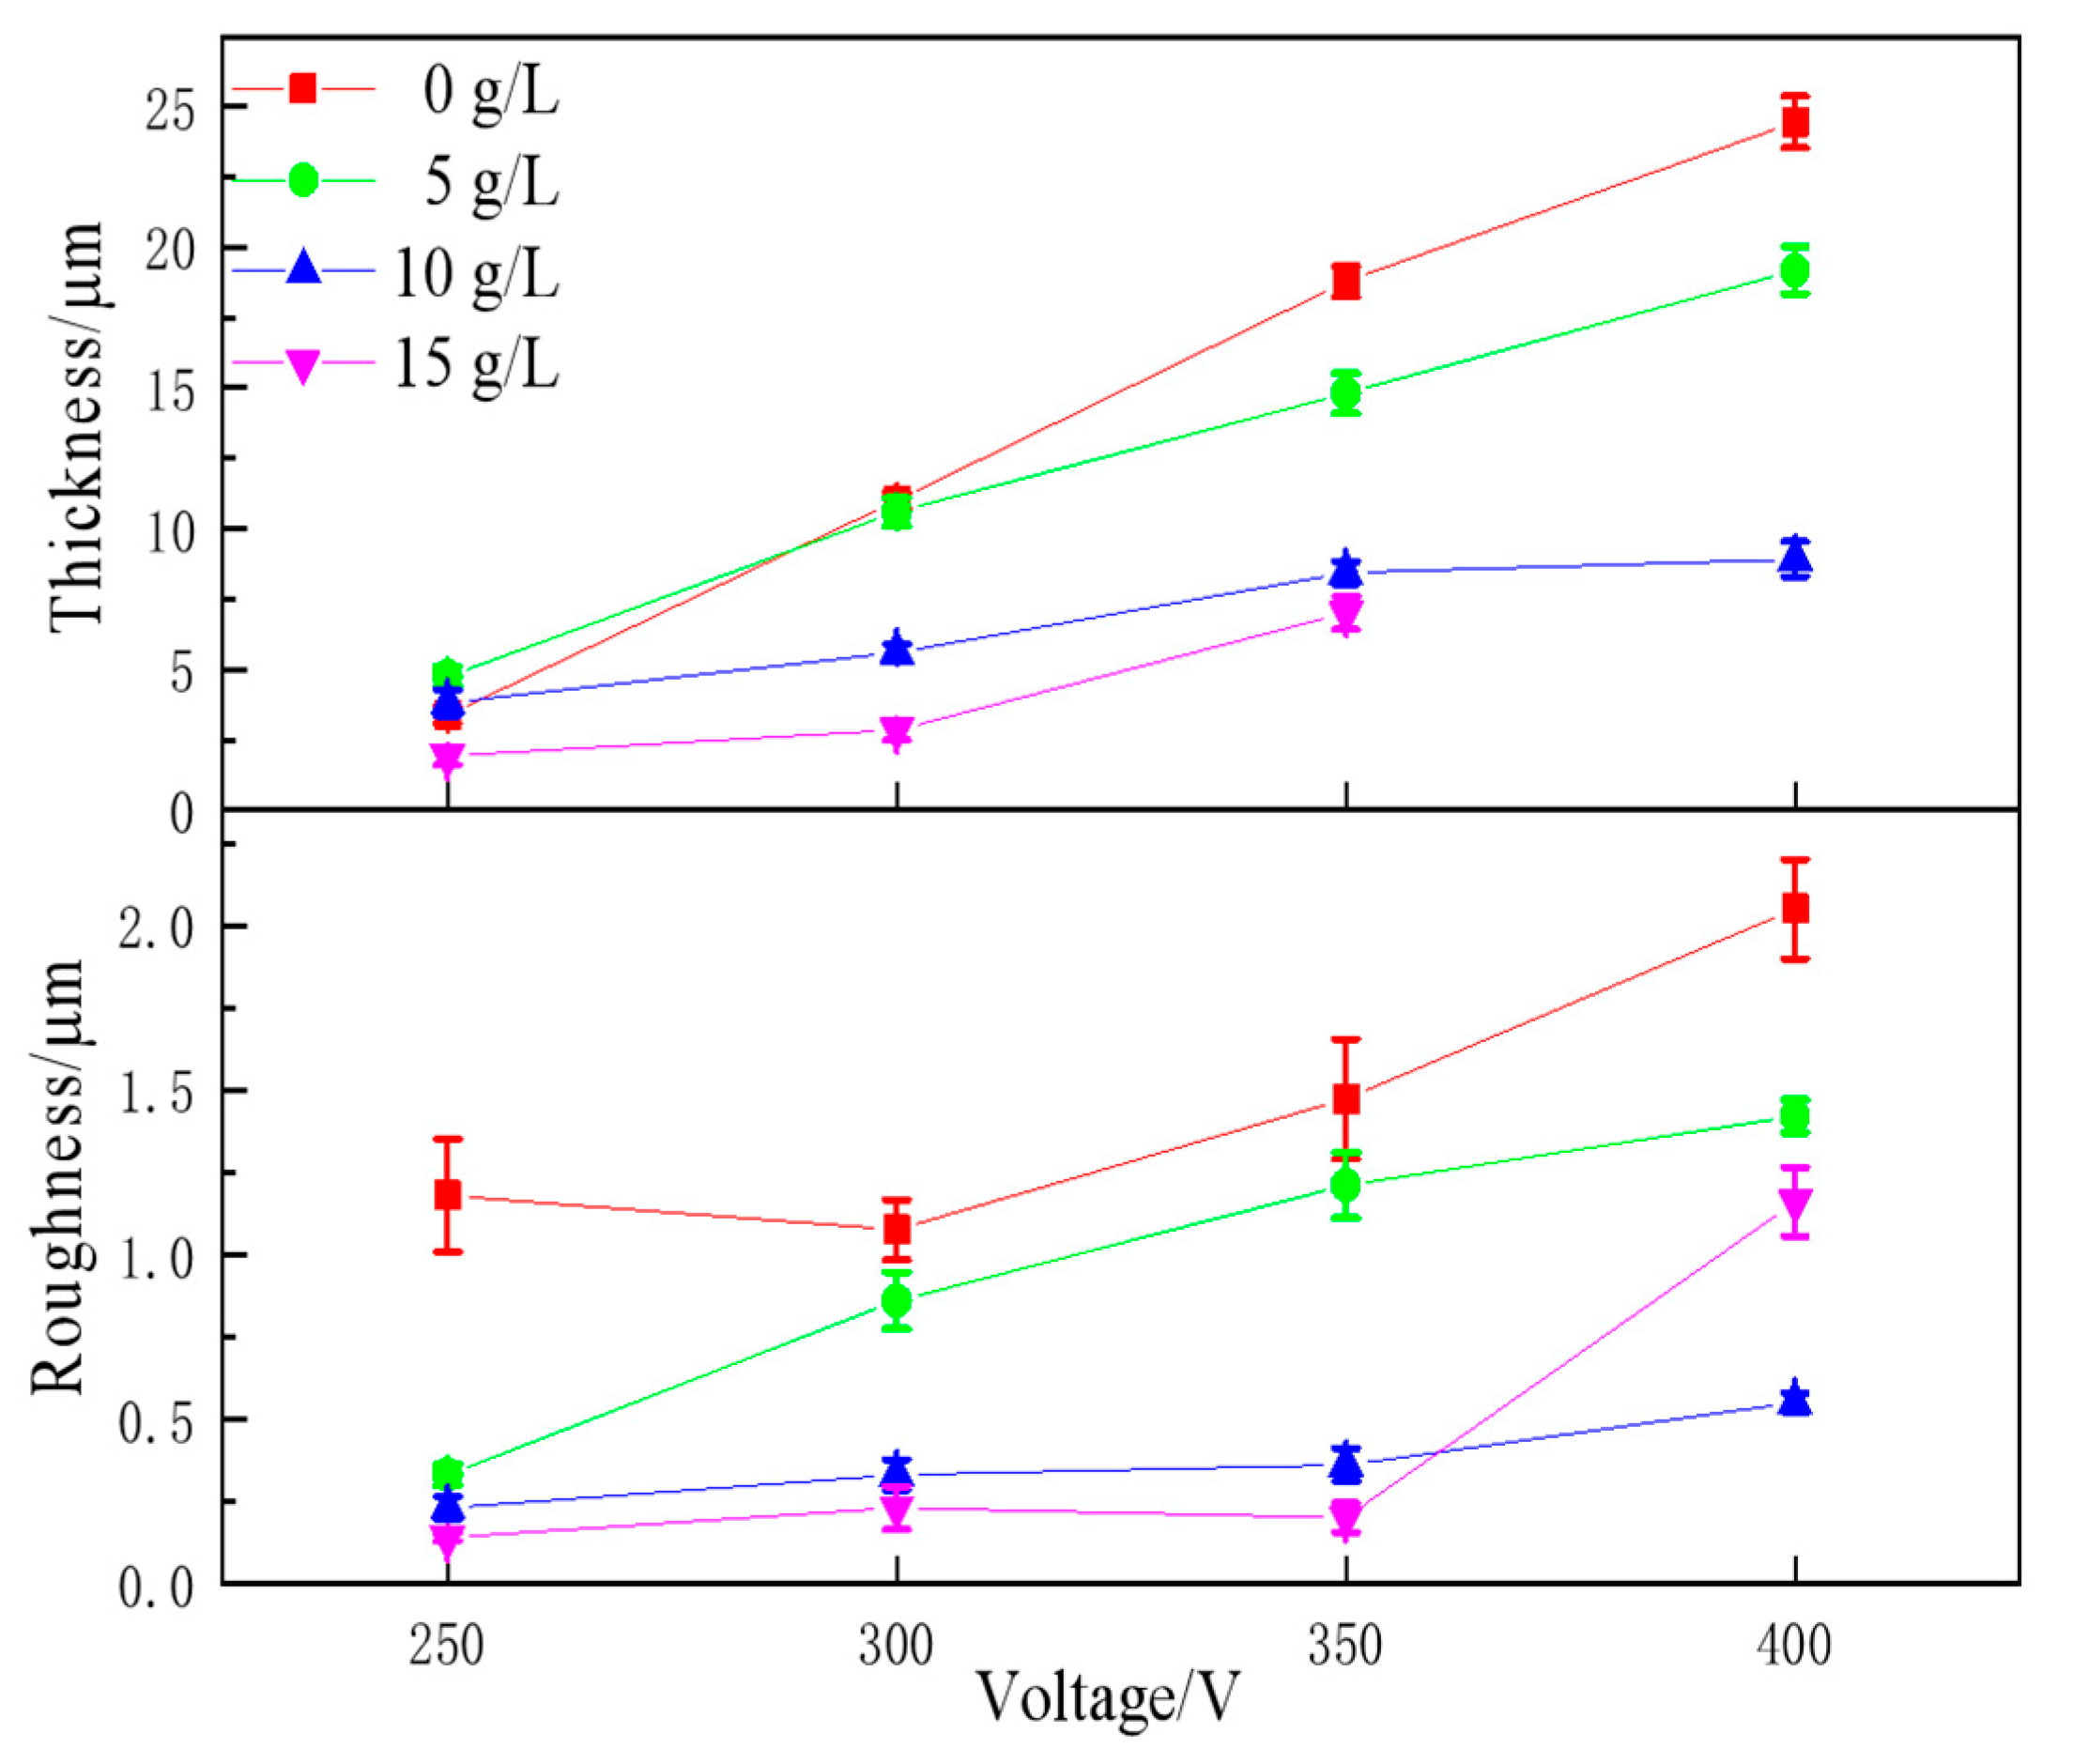
3.2.2. Coating Thickness and Roughness
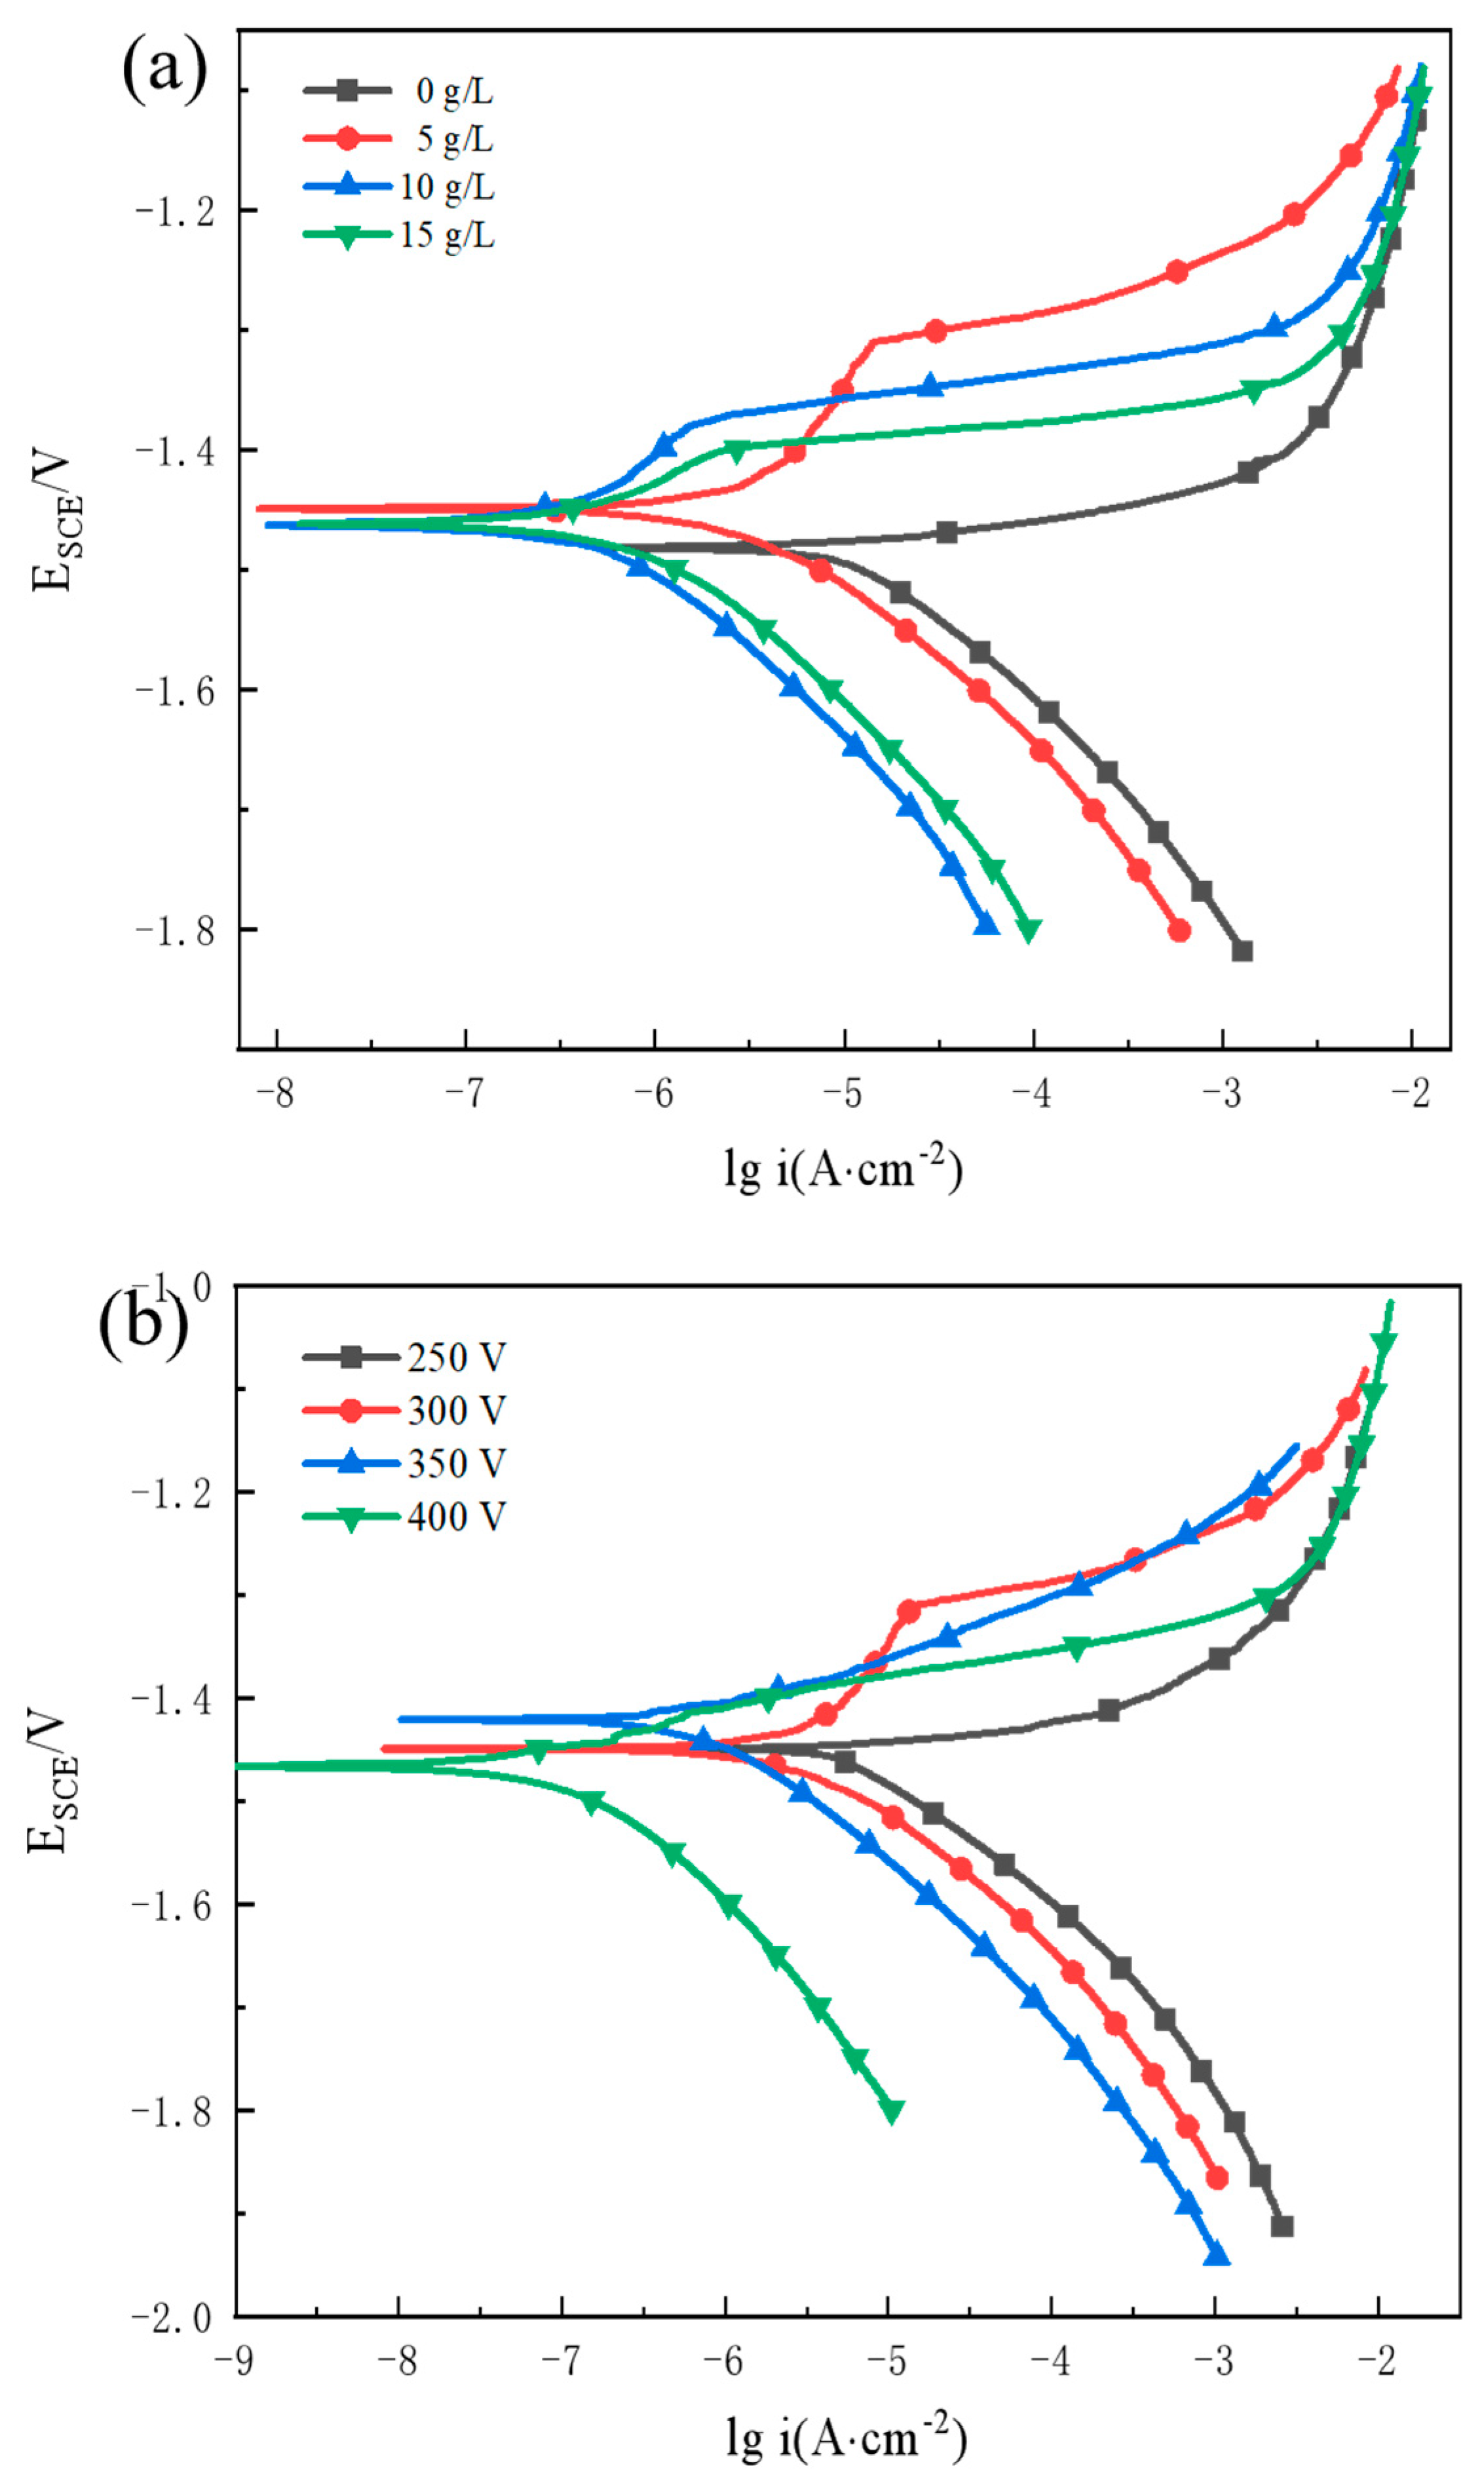
3.2.3. Potentiodynamic Polarisation Test
4. Conclusions
Author Contributions
Funding
Institutional Review Board Statement
Informed Consent Statement
Data Availability Statement
Conflicts of Interest
References
- Yao, W.H.; Wu, L.; Wang, J.F.; Jiang, B.; Zhang, D.F.; Serdechnova, M.; Shulha, T.; Blawert, C.; Zheludkevich, M.L.; Pan, F. Micro-arc oxidation of magnesium alloys: A review. J. Mater. Sci. Technol. 2022, 118, 158–180. [Google Scholar] [CrossRef]
- Zhang, L.; Zhang, J.Q.; Chen, C.F.; Gu, Y.H. Advances in microarc oxidation coated AZ31 Mg alloys for biomedical applications. Corros. Sci. 2014, 91, 7–28. [Google Scholar] [CrossRef]
- Kaseem, M.; Fatimah, S.; Nashrah, N. Recent progress in surface modification of metals coated by plasma electrolytic oxidation: Principle, structure, and performance. Prog. Mater. Sci. 2020, 117, 100735. [Google Scholar] [CrossRef]
- Wang, Z.; Cheng, Z.; Zhang, Y.; Shi, X.; Rao, M.; Wu, S. Effect of voltage on the microstructure and high-temperature oxidation resistance of micro-arc oxidation coatings on AlTiCrVZr refractory high-entropy alloy. Coatings 2022, 13, 14. [Google Scholar] [CrossRef]
- Hu, Y.; Wang, Z.; Ai, J.; Bu, S.; Liu, H. Preparation of coating on the titanium surface by micro-arc oxidation to improve corrosion resistance. Coatings 2021, 11, 230. [Google Scholar] [CrossRef]
- Shi, X.; Wang, Y.; Li, H.; Zhang, S.; Zhao, R.; Li, G.; Zhao, Y. Corrosion resistance and biocompatibility of calcium-containing coatings developed in near-neutral solutions containing phytic acid and phosphoric acid on AZ31B alloy. J. Alloys Compd. 2020, 823, 153721. [Google Scholar] [CrossRef]
- Qin, J.; Shi, X.; Li, H.; Zhao, R.; Li, G.; Zhang, S.; Zhang, R. Performance and failure process of green recycling solutions for preparing high degradation resistance coating on biomedical magnesium alloys. Green Chem. 2022, 24, 8113–8130. [Google Scholar] [CrossRef]
- Yan, L.; Zhong, L.W.; Fu, W.Y.; Zhao, Z.; Fa, H.C.; Hui, B.S. Effect of electrolyte constituents on properties of anodic coatings of magnesium alloys. J. Chin. Soc. Corros. Prot. 2011, 31, 255–259. [Google Scholar]
- Cui, X.J.; Ping, J. Research Progress of Microarc Oxidation for Corrosion Prevention of Mg-alloys. J. Chin. Soc. Corros. Prot. 2018, 38, 87–104. [Google Scholar]
- Forno, A.D.; Bestetti, M. Effect of the electrolytic solution composition on the performance of micro-arc anodic oxidation films formed on AM60B magnesium alloy. Surf. Coat. Technol. 2010, 205, 1783–1788. [Google Scholar] [CrossRef]
- Sun, S.N.; Ye, G.; Lu, Z.T.; Weng, Y.M.; Ma, G.F.; Liu, J.T. Surface Treatment of Zn-Mn-Mg Alloys by Micro-Arc Oxidation in Silicate-Based Solutions with Different NaF Concentrations. Materials 2021, 14, 4289. [Google Scholar] [CrossRef] [PubMed]
- Li, Z.Y.; Cai, Z.B.; Cui, X.J.; Liu, R.R.; Yang, Z.B.; Zhu, M.H. Influence of nanoparticle additions on structure and fretting corrosion behavior of micro-arc oxidation coatings on zirconium alloy. Surf. Coat. Technol. 2021, 410, 126949. [Google Scholar] [CrossRef]
- Chai, L.Y.; Yu, X.; Yang, Z.H.; Wang, Y.Y.; Masazumi, O. Anodizing of magnesium alloy AZ31 in alkaline solutions with silicate under continuous sparking. Corros. Sci. 2008, 50, 3274–3279. [Google Scholar] [CrossRef]
- Seyfoori, A.; Mirdamadi, S.; Khavandi, A.; Raufi, Z.S. Biodegradation behavior of micro-arc oxidized AZ31 magnesium alloys formed in two different electrolytes. Appl. Surf. Sci. 2012, 261, 92–100. [Google Scholar] [CrossRef]
- Mori, Y.; Koshi, A.; Liao, J.S.; Ason, H.; Ono, S. Characteristics and corrosion resistance of plasma electrolytic oxidation coatings on AZ31B Mg alloy formed in phosphate-silicate mixture electrolytes. Corros. Sci. 2014, 88, 254–262. [Google Scholar] [CrossRef]
- Cui, X.J.; Dai, X.; Zheng, B.Y.; Zhang, Y.J. Effect of KH-550 on the structure and properties of micro-arc oxide films on the surface of AZ31B magnesium alloy. J. Chin. Soc. Corros. Prot. 2017, 37, 227–232. [Google Scholar]
- Feng, L.; Zheng, L.G.; Li, S.Z.; Zheng, D.J.; Lin, C.J.; Dong, S.G. Effect of Ferric Citrate on Microstructure and Corrosion Resistance of Micro-arc Oxidation Black Film on Mg-alloy AZ40M. J. Chin. Soc. Corros. Prot. 2017, 37, 360–365. [Google Scholar]
- Bai, A.; Chen, Z.J. Effect of electrolyte additives on anti-corrosion ability of micro-arc oxide coatings formed on magnesium alloy AZ91D. Surf. Coat. Technol. 2009, 203, 1956–1963. [Google Scholar] [CrossRef]
- Liu, Y.; Wei, Z.L.; Yang, F.W.; Zhang, Z. Anodizing of AZ91D Magnesium Alloy in Borate-Terephthalic Acid Electrolyte. Acta Phys. Chim. Sin. 2011, 27, 2385–2392. [Google Scholar]
- Gu, Y.H.; Cai, X.J.; Ning, C.Y.; Xiong, W.M.; Yue, W.; He, B.H. Effects of voltage on the microstructure and corrosion performance of microarc oxidation coatedAZ31 magnesium alloys. China Surf. Eng. 2012, 25, 21. [Google Scholar]
- Cui, X.J.; Wang, R.; Wei, J.S.; Bai, C.B.; Lin, X.Z. Effect of electrical parameters on micromorphology and corrosion Resistance of micro-arc oxidation coating on AZ31B Mg alloy. J. Chin. Soc. Corros. Prot. 2014, 34, 495–501. [Google Scholar]
- Simchcn, F.; Sicber, M.; Lampke, T. Electrolyte influence on ignition of plasma electrolytic oxidation processes on light metals. Surf. Coat. Technol. 2017, 315, 205–213. [Google Scholar] [CrossRef]
- Sachiko, O.; Shuichi, M.; Yoichi, M.; Akihiko, K.; Jinsun, L.; Hidetaka, A. Effect of Electrolyte Concentration on the Structure and Corrosion Resistance of Anodic Films Formed on Magnesium through Plasma Electrolytic Oxidation. Electrochim. Acta 2017, 240, 415–423. [Google Scholar]
- Wu, X.R.; Jia, Z.J.; Ma, H.Y.; Liao, S.D.; Wang, B.G. Fundamentals of electrochemistry(III)-Electrical double layer model and its development. Energy Storage Sci. Technol. 2013, 2, 152–156. [Google Scholar]


| Element | Mg | Al | Zn | Mn | Si | Cu | Fe | Ni |
|---|---|---|---|---|---|---|---|---|
| Content (wt.%) | Balance | 2.94 | 0.9 | 0.21 | 0.01 | 0.01 | 0.003 | 0.00053 |
| Parameters | Settings |
|---|---|
| Work time (min) | 10 |
| Distance between samples and arc source (mm) | 100 |
| Voltage (V) | 250–400 |
| Frequency (Hz) | 300 |
| Duty cycle (%) | 5 |
| KOH Concentration/g·L−1 | Electrical Conductivity/mS | pH |
|---|---|---|
| 0 | 24.09 | 12.34 |
| 5 | 32.58 | 13.21 |
| 10 | 51.37 | 13.40 |
| 15 | 60.78 | 13.60 |
| Concentration/ Voltage (V) | 250 | 300 | 350 | 400 |
|---|---|---|---|---|
| 20 g/L Na3PO4 | 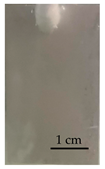 | 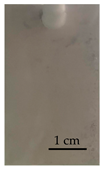 |  |  |
| 25 g/L Na3PO4 |  |  |  |  |
| 30 g/L Na3PO4 |  |  |  |  |
| 35 g/L Na3PO4 | 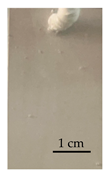 | 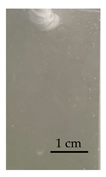 | 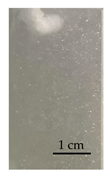 |  |
| 40 g/L Na3PO4 | 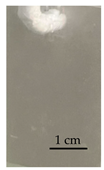 | 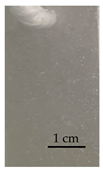 |  | 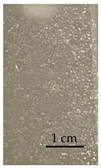 |
| Concentration/ Voltage (V) | 250 | 300 | 350 | 400 |
|---|---|---|---|---|
| 20 g/L Na3PO4 | 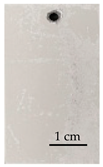 | 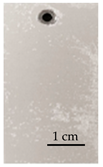 | 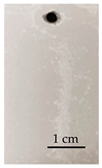 | 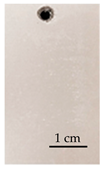 |
| 25 g/L Na3PO4 | 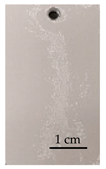 | 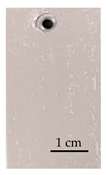 |  |  |
| 30 g/L Na3PO4 |  |  |  |  |
| 35 g/L Na3PO4 |  |  |  |  |
| 40 g/L Na3PO4 |  |  |  |  |
| Sample | icorr/μA·cm−2 | Ecorr/V | βa/mV | βc/mV | Rp/kΩ·cm−2 |
|---|---|---|---|---|---|
| 20 g/L | 12.816 | −1.46 | 188.538 | 89.737 | 4.744 |
| 25 g/L | 11.051 | −1.48 | 219.801 | 113.337 | 6.767 |
| 30 g/L | 2.554 | −1.47 | 170.955 | 85.859 | 22.378 |
| 35 g/L | 1.859 | −1.43 | 189.517 | 189.517 | 50.973 |
| 40 g/L | 1.882 | −1.47 | 174.131 | 160.896 | 44.435 |
| Sample | icorr/μA·cm−2 | Ecorr/V | βa/mV | βc/mV | Rp/kΩ·cm−2 |
|---|---|---|---|---|---|
| 250 V | 40.998 | −1.47 | 218.671 | 114.678 | 1.835 |
| 300 V | 46.412 | −1.48 | 282.279 | 109.07 | 1.695 |
| 350 V | 1.859 | −1.43 | 189.517 | 189.517 | 50.973 |
| 400 V | 0.951 | −1.44 | 206.639 | 90.987 | 66.426 |
| Concentration/ Voltage (V) | 250 | 300 | 350 | 400 |
|---|---|---|---|---|
| 5 g/L KOH | 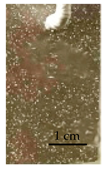 | 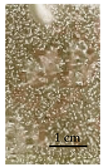 | 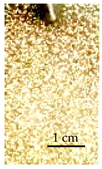 | 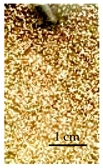 |
| 10 g/L KOH |  |  |  |  |
| 15 g/L KOH | 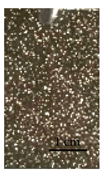 | 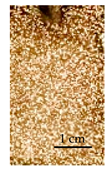 | 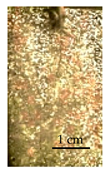 | 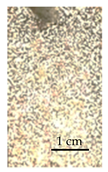 |
| Concentration/ Voltage (V) | 250 | 300 | 350 | 400 |
|---|---|---|---|---|
| 5 g/L KOH |  |  |  |  |
| 10 g/L KOH |  | 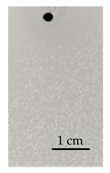 | 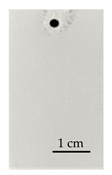 | 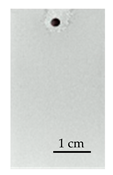 |
| 15 g/L KOH | 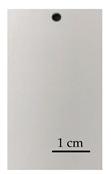 |  |  |  |
| Sample | icorr/μA·cm−2 | Ecorr/V | βa/mV | βc/mV | Rp/kΩ·cm−2 |
|---|---|---|---|---|---|
| 250 V | 54.891 | −1.43 | 218.9 | 88.461 | 1.148 |
| 300 V | 0.785 | −1.46 | 165.457 | 153.542 | 101.450 |
| 350 V | 0.744 | −1.42 | 181.624 | 153.67 | 111.883 |
| 400 V | 0.193 | −1.47 | 203.687 | 89.263 | 312.576 |
| Sample | icorr/μA·cm−2 | Ecorr/V | βa/mV | βc/mV | Rp/kΩ·cm−2 |
|---|---|---|---|---|---|
| 0 g/L | 46.412 | −1.48 | 282.279 | 109.07 | 1.695 |
| 5 g/L | 0.785 | −1.46 | 165.457 | 153.542 | 101.450 |
| 10 g/L | 0.756 | −1.46 | 163.179 | 142.57 | 100.648 |
| 15 g/L | 0.715 | −1.46 | 153.745 | 112.364 | 90.795 |
Disclaimer/Publisher’s Note: The statements, opinions and data contained in all publications are solely those of the individual author(s) and contributor(s) and not of MDPI and/or the editor(s). MDPI and/or the editor(s) disclaim responsibility for any injury to people or property resulting from any ideas, methods, instructions or products referred to in the content. |
© 2023 by the authors. Licensee MDPI, Basel, Switzerland. This article is an open access article distributed under the terms and conditions of the Creative Commons Attribution (CC BY) license (https://creativecommons.org/licenses/by/4.0/).
Share and Cite
Yan, H.; Qi, Y.; Cui, X.; Li, C. Micro-Arc Oxidation Phenomenon for Producing Coatings of AZ31B Mg Alloy Using Na3PO4 with Varying KOH Concentrations and Voltages: A Study. Coatings 2023, 13, 1370. https://doi.org/10.3390/coatings13081370
Yan H, Qi Y, Cui X, Li C. Micro-Arc Oxidation Phenomenon for Producing Coatings of AZ31B Mg Alloy Using Na3PO4 with Varying KOH Concentrations and Voltages: A Study. Coatings. 2023; 13(8):1370. https://doi.org/10.3390/coatings13081370
Chicago/Turabian StyleYan, Han, Yuming Qi, Xuejun Cui, and Chunyang Li. 2023. "Micro-Arc Oxidation Phenomenon for Producing Coatings of AZ31B Mg Alloy Using Na3PO4 with Varying KOH Concentrations and Voltages: A Study" Coatings 13, no. 8: 1370. https://doi.org/10.3390/coatings13081370
APA StyleYan, H., Qi, Y., Cui, X., & Li, C. (2023). Micro-Arc Oxidation Phenomenon for Producing Coatings of AZ31B Mg Alloy Using Na3PO4 with Varying KOH Concentrations and Voltages: A Study. Coatings, 13(8), 1370. https://doi.org/10.3390/coatings13081370