Abstract
(1 − x)(Na0.5Bi0.5)TiO3–xBi(Mg2/3Nb1/3)O3 ceramics with x = 0.00 mol.% (0BMN), 0.01 mol.% (1BMN), 0.03 mol.% (3BMN), and 0.05 mol.% (5BMN) were synthesized using a solid-state processing technique. The thermogravimetric analysis (TGA) of uncalcined samples up to 730 °C showed that the maximum weight loss was observed for 3BMN, whereas the minimum weight loss was attributed to the 0BMN sample. After that, calcination was performed at 800 °C for 4 h. The XRD of calcined samples showed the successful formation of the perovskite phase with no impurity phases. 1BMN and 3BMN samples showed some of the lattice strain; however, a morphotropic phase boundary (MPB) existed around x = 0.03 between the rhombohedral and tetragonal structure. The TGA of the green pellets showed weight loss up to the sintering temperature (1100 °C) and during the 3 h holding period. 5BMN showed the maximum weight loss up to sintering temperature, as well as during the holding period, whereas 0BMN displayed the minimum weight loss up to sintering temperature, as well as some weight gain during the holding period. The relative permittivity (εr) was maximum at low frequencies, but the addition of BMN improved the εr. The frequency dependence of dielectric loss (tanδ) showed that the maximum loss was observed for 3BMN at lower frequencies, and 5BMN showed the maximum loss at higher frequency among all samples.
1. Introduction
Piezoelectric ceramics primarily based on lead oxide (PbO) are commonly used as piezoelectric actuators, sensors, and transducers for their exceptional piezoelectric properties [1]. Nonetheless, evaporation related to the hazardous nature of PbO during high-temperature sintering not only leads to ecological pollution, but also triggers variability of the composition and electrical characteristics of material [2,3]. Consequently, researchers around the world are focused on the synthesis of green lead-free piezoelectric ceramics to eliminate the hazardous lead oxide-based ceramics [4]. The research on lead-free piezoceramics has already started a new journey to replace lead zirconium titanate (PZT) with nonharmful choices [5]. Moreover, the European Union (EU) passed legislation on Restriction of Hazardous Substances (RoHS), Waste from Electrical and Electronic Equipment (WEEE), and End of Life Vehicles (ELV), propelling scientists to take out poisonous substances from electrical and electronic devices to lessen their effect on the surroundings and wellbeing of people [6]. Sodium bismuth titanate (Na0.5Bi0.5TiO3 denoted as NBT) is one of the emerging lead-free ceramics, and it was discovered in 1960 [7,8]. It has a distorted perovskite structure (ABO₃) with rhombohedral R3c symmetry at room temperature (RT). It exhibits superior dielectric, piezoelectric (d33 = 73 pC/N), and electromechanical properties and could potentially replace PZT; however, it has some major drawbacks, such as the vaporization of Na1+ and Bi3+ at high temperatures, the low piezoelectric constant (d33), high coercive field (Ec), low depolarization temperature (Td), and high conductivity [9,10]. It has been established that Bi vaporizes at high sintering temperatures (>1150 °C). Moreover, Hiruma et al. revealed that Bi vaporizes when sintered at 1100 °C due to the high dielectric loss of undoped BNT ceramics at T > Td, which makes poling treatment difficult due to high conductivity and pinning of domains. The difficulties related to bismuth (Bi) volatilization can be reduced by doping stable oxide-containing compounds in NBT [11]. Kimura et al. observed that the excess Bi2O3 increased the sintered density because of a decrease in grain growth. It was reported that excess Bi2O3 enhances texture development and improves piezoelectric properties [12]. In another study, stoichiometric and nonstoichiometric BNT ceramics were prepared to clarify the effects of Bi and Na vaporizations on phase transitions and electrical properties. It was concluded that the dielectric losses were decreased and d33 increased when the Bi/Na ratio increased. Furthermore, the resistivity was increased with excess Bi and the leakage current was very small above Td for BNT-Bi(0.01) because of low conductivity [11]. The CeO2-doped NBT also showed a superior piezoelectric constant (d33) and other electronic properties [13]. Recently, a new NBT-based relaxor ferroelectric was prepared by combining NBT with Bi1/2(Mg2/3Nb1/3) O3 (BMN), which gave d33 = 94 pC/N at x = 0.07. Furthermore, the values of dielectric constant and electromechanical coupling factor also increased when BMN was added to NBT [14]. Another study showed the effects of excess Bi on 0.99Bix (Na0.8K0.2)0.5–0.01SrTiO3 (x = 0.5–0.535). The excess Bi increased RT strain properties and gave a d33* value of 440 pm/V [15]. Furthermore, a study on (1 − x) (0.8Bi1/2Na1/2TiO3–0.2Bi1/2K1/2TiO3)–xBiMg2/3Nb1/3O3 (100xBMN) (BNT–BKT–BMN) ceramics revealed that the introduction of BMN gave rise to strain properties and aided the transformation from ferroelectric to relaxor phase. The maximum value of d33* was also found to be 784 pm/V [16]. Another study showed the improvement in ferroelectric and piezoelectric properties of 0.8Bi1/2Na1/2TiO3–0.2Bi1/2K1/2TiO3 (BNT–BKT, BNKT) by doping Bix/3Mgy/3Nbz/3O3 (BMN) [17]. Another study revealed that the (1−x)[0.85BaTiO3–0.15Bi(Mg2/3Nb1/3)O3]–xNa0.5Bi0.5TiO3 (BT–BMN–NBT) system gives an improved dielectric constant and dielectric loss [18]. Therefore, in this study, we prepared a binary solid solution of (1 − x)Na0.5Bi0.5TiO3-xBi(Mg2/3Nb1/3) ceramics to observe the effect of BMN on Na and Bi volatility during the calcination and sintering process. Another goal of this study was to study the effect of different concentrations of BMN on the dielectric properties of NBT–BMN piezoelectric ceramics.
2. Experimental Procedure
The (1 − x)Na0.5Bi0.5TiO3–xBi(Mg2/3Nb1/3)O3 (NBT–BMN) ceramics with x = 0.00 mol.% (0BMN), 0.01 mol.% (1BMN), 0.03 mol.% (3BMN), and 0.05 mol.% (5BMN) were prepared using a conventional solid-state sintering technique. Na2CO3, Bi2O3, TiO2, MgO, and Nb2O5 were used as raw materials with 99.9% purity (Daejung Chemicals & Metals Co., Ltd, Shiheung-city, Korea) and were stoichiometrically weighed in hot conditions to avoid any moisture pickup. The powders were subjected to planetary ball milling at 300 rpm in ethanol solution for 2 h. Zirconia jars and zirconia balls of diameter ranging from 5 to 20 mm were used as grinding media. After the ball milling process, the slurry was dried in a drying oven at 80 °C to let the ethanol evaporate. Then, the mixed powders were crushed in a mortar and pestle to break the agglomerates. Finally, the powder was passed through a sieve of mesh size 149 µm. Thermogravimetric analysis (TGA)/differential scanning calorimetry (DSC) was performed on the sample using an SDT Q600 Thermal Analyzer (TA instruments, New Castle, DE, USA) to determine the weight losses and perovskite phase formation temperature. The temperature was raised from 30 °C to 950 °C at a rate of 10 °C/min. According to the results, the calcination temperature was determined and finalized. All the compositions were calcined at 800 °C for 4 h in an alumina crucible by a chamber furnace (PLF 130/18, Protherm Furnaces, Ankara, Turkey). Calcination is an important step to remove the carbonates from the powders and for perovskite phase formation. The heating rate and cooling rate were set to be 5 °C/min. A small sample from the calcined batch was crushed using a mortar and pestle, and then the X-ray Diffraction (XRD) of these samples was performed on an X’Pert PRO (PANalytical, Almelo, The Netherland), to verify the perovskite phase formation. The diffraction patterns were recorded over the angular range (2θ) from 15° to 80° at room temperature. The whole batch of the calcined sample was again ball-milled in ethanol for 1 h, dried, crushed using mortar and pestle, and sieved over the mesh size 149 µm. The powders were then die-pressed into discs of 12.8 mm diameter in a pressing machine. Polyvinyl alcohol (PVA) was used as the binder, and a pressure of 2000 psi (140 bar) was uniaxially applied on the powder for 45–60 s to get the compacted green pellet. The TGA/DSC of green pellets was performed on an SDT Q600 Thermal Analyzer (TA instruments) to understand the weight loss under the sintering conditions. The heating rate was set to be 5 °C/min and, after reaching 1100 °C, the samples were held for 3 h in air at this temperature to complete the sintering cycle. The green pellets were sintered in an energy-saving box furnace at 1100 °C for 3 h. The pellets were first heated at 600 °C at a rate of 5 °C/min for 2 h to remove the binder and other organic materials. Then, the temperature was raised to 1100 °C at a heating rate of 5 °C/min. After sintering at 1100 °C, the samples were allowed to cool down at a rate of 5 °C/min until 400 °C. Below 400 °C, the furnace was turned off and the samples were allowed to furnace cool until room temperature. The dielectric measurements were carried out using an LCR meter TH2826 by Tonghui (Changzhou Tonghui Electronic Co., Ltd., Changzhou, China). The silver coating was applied on the sintered samples to measure the frequency dependence of relative permittivity (εr). The current was kept constant at 100 mV, and the frequency was increased from 1 kHz to 1 MHz.
3. Results and Discussion
3.1. TGA/DSC of Uncalcined Samples
Figure 1 shows the TGA/DSC results of the uncalcined samples. There were three distinct/major weight loss steps, as shown in Figure 1b; therefore, the weight loss during TGA was divided into three stages. Furthermore, the weight losses for all the batches are summarized in Table 1.
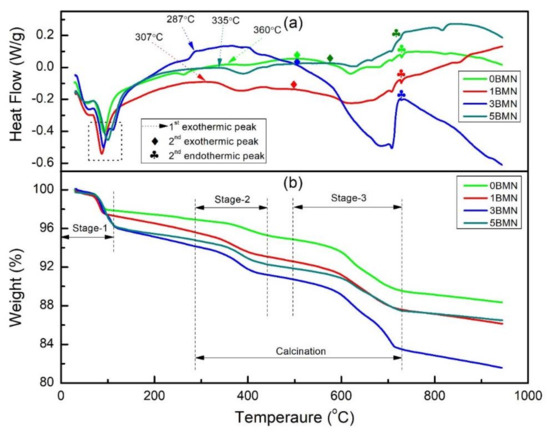
Figure 1.
(a) DSC and (b) TGA of uncalcined samples.

Table 1.
Weight loss during TGA of uncalcined samples.
Weight loss during stage-1 was associated with the evaporation of moisture [19]. This was confirmed by the first endothermic peaks in the DSC curve, which appeared around 100 °C and are represented inside the dashed square in Figure 1a. Furthermore, the maximum weight loss due to moisture was observed for the 5BMN sample. In addition, as the amount of BMN increased, the moisture loss also increased.
Weight loss during stage-2 was due to the decomposition of carbonates and the escape of CO2 gas [20]. The start of stage-2 was attributed to the first exothermic peak in the DSC curve, represented by dashed arrows in Figure 1a. However, the starting temperature of stage-2 was different for all the batches ranging from 287 °C for 3BMN to 360 °C for 0BMN. The last weight loss step, i.e., Stage-3, was attributed to the weight loss during perovskite phase formation and crystallization of (1 − x) NBT–xBMN. In the DSC curve (Figure 1a), there were two peaks in the temperature range of 500 °C and 750 °C. The second exothermic peak marks the start of stage-3 (crystallization) and the second endothermic peak marks its end. A maximum weight loss of 7.16% was observed for 3BMN during stage-3. No further significant weight loss was observed beyond 730 °C, showing the complete crystallization of perovskite structure [21].
To evaluate the weight loss during calcination due to the removal of CO and CO2, the weight loss from the start of stage-2 to the end of stage-3 was considered, as shown in Figure 1b. The maximum weight loss of 10.68% was observed for the 3BMN sample. 5BMN displayed the minimum weight loss during calcination (6.83%). The total weight loss was the total weight reduced from the material from the beginning of stage-1 to the end of stage-3 (~730 °C). The maximum total weight loss was observed for the 3BMN sample, which was around 16.52%. The reason for this could be the presence of rhombohedral–tetragonal MPB that exists around x = 0.03, as discussed in the XRD results in the next section. The distortion in the crystal structure may have been the reason for the high volatility of the sample as shown in Table 1. The minimum total weight loss of 10.57% was shown by 0BMN. This shows that the addition of BMN promoted the weight loss in NBT as compared to pure NBT during calcination. The TGA curve even showed a slight weight loss beyond stage-3, indicating the volatility of Na and Bi at higher temperatures. Therefore, to minimize further weight loss, the calcination temperature was set to 800 °C.
3.2. XRD of Calcined Samples
The XRD of calcined samples was performed to assess the perovskite phase formation and the effect of BMN on the crystal structure of NBT. Figure 2a shows the XRD spectra in the 2θ range from 15° to 75° of all the samples calcined at 800 °C. A perovskite structure without any impurity peaks was confirmed for all the samples, showing that BMN completely diffused into the structure of NBT [16,22].
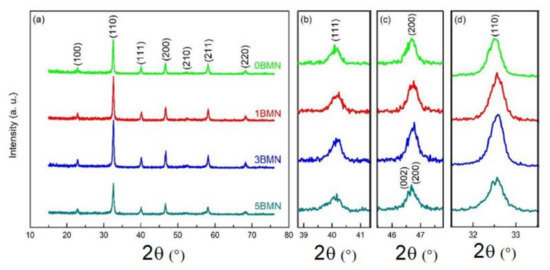
Figure 2.
(a) XRD patterns of calcined (1 − x)NBT–xBMN samples; (b–d) show enlarged XRD patterns of (111), (200), and (110) diffraction peaks, respectively.
The (111), (200), and (110) peaks are magnified in Figure 2b–d, respectively. In Figure 2c, the (200) peak started to split, and a new peak started to emerge from the left in the 3BMN sample. This new (002) peak can be seen in the 5BMN sample. This means that the structures for 0BMN and 1BMN were rhombohedral with R3c symmetry [15,16]; however, with the increasing amount of BMN, the structure became tetragonal with P4bm symmetry [23,24]. Consequently, it could be said that there is a rhombohedral–tetragonal MPB that exists around x = 0.03 for the NBT–BMN system.
As shown in Figure 2d, the height of the (110) peak was low for 0BMN; however, the height increased for 1BMN and 3BMN samples. This increase in peak intensity indicated a more ordered and highly crystallized structure [25]. Nevertheless, the intensity sharply decreased in the case of 5BMN, suggesting strain relaxation in the structure as it transformed from rhombohedral to tetragonal. Since the effective radii of (Mg2/3Nb1/3)3+ and Ti4+ are 0.069 and 0.061 nm respectively, the broadening of the (111) peak in Figure 2b also indicated the lattice strains in the crystal induced by the addition of BMN due to the substitution of (Mg2/3Nb1/3)3+ for Ti4+ [26].
3.3. TGA during the Sintering Process
The TGA/DSC of green pellets for all four samples was done to evaluate the weight loss up to and at the sintering temperature. Figure 3 shows the TGA curves of all the samples during sintering. The weight loss observations are summarized in Table 2. It has been established by previous researchers that Na1+ and Bi3+ cations start evaporating at high sintering temperatures (>1130 °C) [24]. This causes vacancies at the A-site in the crystal lattice, which affects the structural homogeneity, stoichiometry, and properties of NBT [13].
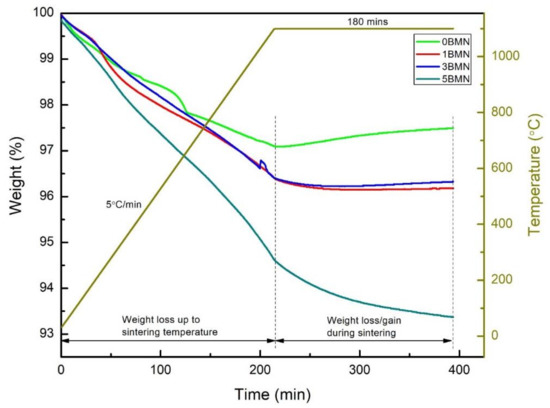
Figure 3.
TGA curves for 0BMN, 1BMN, 3BMN, and 5BMN during sintering at 1100 °C for 3 h in the air.
Table 2.
Weight loss/gain (+) during sintering.
Figure 3 shows that 5BMN displayed the maximum weight loss of 5.3% and 0BMN showed the minimum weight loss of 2.88% up until sintering temperature. The major portion of this weight loss could be attributed to the moisture and binder loss, which was added during the compaction of green pellets. Moreover, upon holding the samples at 1100 °C for 3 h, there was a notable increase in the weight of 0BMN, whereas 5BMN displayed further weight loss of 1.18% during the same holding period. Moreover, 1BMN and 3BMN showed very slight weight loss. 0BMN displayed a weight gain of (+)0.4% until the end of the sintering period. It is interesting to note that, at such a high temperature, the weight increased instead of decreasing.
In order to study the phenomenon behind the weight gain, it is important to determine the crystal structure changes and/or new compound formation during sintering. For this purpose, the TGA/DSC curve during sintering was also plotted for 0BMN, as shown in Figure 4.

Figure 4.
TGA/DSC curves of 0BMN sample during sintering at 1100 °C for 3 h in the air.
Nevertheless, there were no visible exothermic and endothermic peaks during the 3 h holding at 1100 °C. This represents no major crystal structure changes. However, sintering in the air reduced the number of oxygen vacancies and led to the decomposition of the material to keep charge neutrality. Further research could be done for 0BMN to establish the reason for weight gain during sintering.
3.4. Frequency Dependence of Relative Permittivity (εr)
Figure 5 shows the frequency dependence of relative permittivity (εr) of 0BMN, 1BMN, 3BMN, and 5BMN samples at room temperature. The εr was maximum at low frequencies for all four samples. The εr of the 5BMN sample (750) was the maximum among all the samples, whereas the εr of the undoped sample i.e., 0BMN was the minimum among all at all frequencies. This showed the increase in εr as BMN increased in NBT [17,18]. Moreover, the εr decreased when measuring frequency increased due to a decrease in polarization [27]. At low frequencies, all the polarization mechanisms were activated, whereas, at higher frequencies, polarization mechanisms ceased to function. Therefore, the net polarization of the material decreased, which led to the decrease in εr. It is proven that relative permittivity (εr) was a function of frequency and was very prominent in the above results. The lattice distortions caused by the A or B site disorder caused the abovementioned behaviors. The Bi3+ ions substituted the A site and (Mg2/3Nb1/3)3+ ions substituted the B site of the perovskite crystal structure and caused lattice distortions in the material [10]. The polarization switching required a high dielectric constant as BMN increased in NBT [16]. Furthermore, the higher εr of 5BMN could be due to better densification during sintering [22]. The difference in the decrease in relative permittivity (εr) as the frequency increased was maximum in the 5BMN sample and minimum in the 0BMN sample. This trend shows the difference in the decrease in the rate of relative permittivity (εr) increase as BMN doping increased.
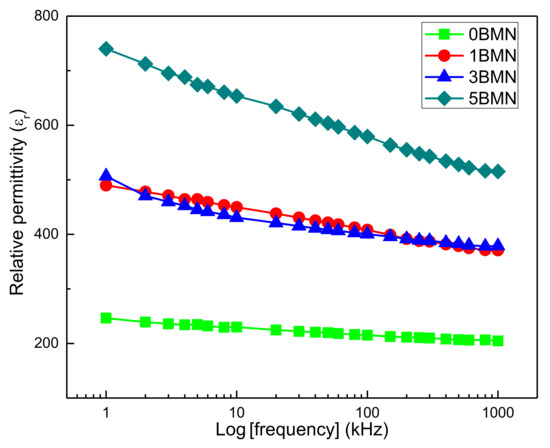
Figure 5.
Frequency dependence of relative permittivity (εr).
3.5. Frequency Dependence of Dielectric Loss (tanδ)
The frequency dependence of dielectric loss (tanδ) for sintered 0BMN, 1BMN, 3BMN, and 5BMN samples at room temperature was determined, as shown in Figure 6. For 3BMN, the steep decrease in tanδ in the frequency range of 1 kHz and 100 kHz indicated leakage current [28]. During polarization (below 10 kHz), 3BMN showed the maximum loss. As the frequency started to increase, the dielectric loss slightly decreased for 0BMN. For 1BMN, it started to increase with the increase in frequency, whereas, for 5BMN, it stayed within a certain range. At lower frequencies, the friction due to dipole rotation increased dielectric losses. There was a slight hump in the losses of all samples in the range of 100 kHz to 1000 kHz, showing relaxor behavior [29]. This could be attributed to the change in the polarization mechanism due to the increase in frequency [9,30]. At higher frequencies (i.e., 1000 kHz), 5BMN displayed the highest tanδ, whereas 0BMN displayed the lowest tanδ among all samples.
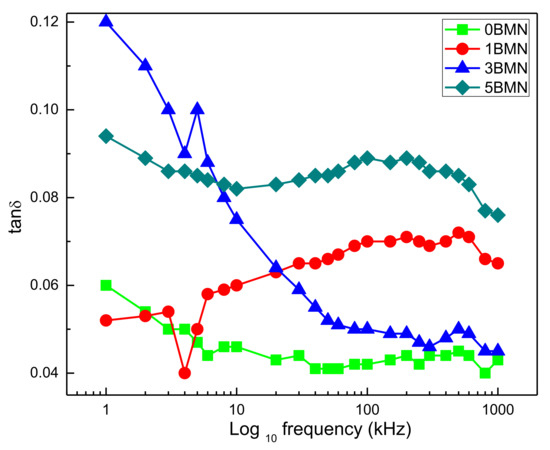
Figure 6.
Frequency dependence of dielectric loss (tanδ).
4. Conclusions
In this study, (1 − x)Na0.5Bi0.5TiO3–xBi(Mg2/3Nb1/3)O3 ceramics (x = 0 mol.%, 1 mol.%, 3 mol.%, and 5 mol.%) were synthesized by conventional solid-state processing route to evaluate their thermal behavior during calcination and sintering. The calcination was performed at 800 °C for 4 h, and sintering was performed at 1100 °C for 3 h. TGA/DSC of the as-milled powder was performed to understand the weight loss during calcination. 3BMN displayed the maximum and 5BMN displayed the minimum weight loss during the calcination process; however, the minimum total weight loss of 10.57% was shown by 0BMN. The XRD spectra showed that all samples had a single-phase perovskite structure, but there was a structural change from rhombohedral to tetragonal symmetry around x = 0.03. Moreover, 1BMN and 3BMN samples also showed lattice strain due to the addition of BMN. TGA of the green pellets was also done to evaluate the weight loss during sintering. 5BMN showed the maximum weight loss up until sintering temperature, as well as during the holding period; however, 0BMN displayed the minimum weight loss up until sintering temperature, along with some weight gain during the holding period. The DSC curve for 0BMN showed no major peaks that could indicate structural changes during the holding period. Further research could be done to evaluate the reason behind this weight gain. The frequency dependence of relative permittivity (εr) showed that the εr was maximum at low frequencies for all the samples; however, the increase in BMN content increased εr. Furthermore, increasing the frequency resulted in a decrease in εr due to the lattice distortions of dopant ions. The frequency dependence of dielectric loss (tanδ) showed that the maximum loss was observed for 3BMN at lower frequencies (<10 kHz). However, 5BMN showed the maximum loss at higher frequency among all samples.
Author Contributions
Conceptualization, S.A.A. and F.H.; methodology, M.I.; software, S.H.S.; validation, M.S., formal analysis, M.A.A.; investigation, A.A.A.B.; resources, A.A.G.; data curation, M.M.A.-A.; writing—original draft preparation, M.S.J.; writing—review and editing, S.A.; visualization, S.A.-T.; supervision, F.H.; project administration, S.A.; funding acquisition, M.O. All authors have read and agreed to the published version of the manuscript.
Funding
The authors are grateful to the Deanship of Scientific Research, King Saud University for funding through Vice Deanship of Scientific Research Chairs and this research was funded by the Dean-ship of Scientific Research at Princess Nourah bint Abdulrahman University through the Fast-track Research Funding Program.
Institutional Review Board Statement
Not applicable.
Informed Consent Statement
Not applicable.
Conflicts of Interest
The authors declare no conflict of interest.
References
- Shibata, K.; Wang, R.; Tou, T.; Koruza, J. Applications of lead-free piezoelectric materials. MRS Bull. 2018, 43, 612–616. [Google Scholar] [CrossRef]
- Xie, K.; Hu, H.; Xu, S.; Chen, T.; Huang, Y.; Yang, Y.; Yang, F.; Yao, H. Fate of heavy metals during molten salts thermal treatment of municipal solid waste incineration fly ashes. Waste Manag. 2020, 103, 334–341. [Google Scholar] [CrossRef] [PubMed]
- Tiwari, S.; Tripathi, I.; Tiwari, H. Effects of lead on Environment. Int. J. Emerg. Res. Manag. Technol. 2013, 2, 204–212. [Google Scholar]
- Akça, E.; Yılmaz, H. Lead-free potassium sodium niobate piezoceramics for high-power ultrasonic cutting application: Modelling and prototyping. Process. Appl. Ceram. 2019, 13, 65–78. [Google Scholar] [CrossRef]
- Saito, Y.; Takao, H.; Tani, T.; Nonoyama, T.; Takatori, K.; Homma, T.; Nagaya, T.; Nakamura, M. Lead-free piezoceramics. Nature 2004, 432, 84. [Google Scholar] [CrossRef]
- Shams, S. Circular Economy Policy Barriers: An Analysis of Legislative Challenges in White Goods and Automotive Industry within the EU. Master’s Thesis, The Royal Institute of Technology (KTH), Stockholm, Sweden, June 2020. [Google Scholar]
- Lima, A.C.; Pereira, N.; Martins, P.L.A.; Lanceros-Mendez, S. Magnetic materials for magnetoelectric coupling: An unexpected journey. Handb. Magn. Mater. 2020, 29, 57–110. [Google Scholar]
- Smolenskii, G.; Isupov, V. New ferroeleetries of com-plex composition. Soy. Phys. Solid State 1961, 2, 2. [Google Scholar]
- Singha, A.; Praharaj, S.; Rout, D. Effect of sintering time on microstructure and electrical properties of lead-free sodium bismuth titanate perovskite. Mater. Today Proc. 2020. [Google Scholar] [CrossRef]
- Singh, P.; Pandey, R.; Singh, P. Tailoring the electrical and structural properties of sodium bismuth titanate with sintering temperature. Mater. Today Proc. 2020, 44, 166–169. [Google Scholar] [CrossRef]
- Hiruma, Y.; Nagata, H.; Takenaka, T. Thermal depoling process and piezoelectric properties of bismuth sodium titanate ceramics. J. Appl. Phys. 2009, 105, 084112. [Google Scholar] [CrossRef]
- Kimura, T.; Fukuchi, E.; Tani, T. Fabrication of textured bismuth sodium titanate using excess bismuth oxide. Jpn. J. Appl. Phys. 2005, 44, 8055. [Google Scholar] [CrossRef]
- Halim, N.; Majid, W.A.; Velayutham, T. Ferroelectric, pyroelectric and piezoelectric properties of CeO2-doped Na0.5Bi0.5TiO3 ceramics. SN Appl. Sci. 2019, 1, 582. [Google Scholar] [CrossRef]
- Zhou, C.; Liu, X. Dielectric and piezoelectric properties of bismuth-containing complex perovskite solid solution of Bi1/2Na1/2TiO3− Bi(Mg2/3 Nb1/3)O3. J. Mater. Sci. 2008, 43, 1016–1019. [Google Scholar] [CrossRef]
- Liu, X.; Li, F.; Li, P.; Zhai, J.; Shen, B.; Liu, B. Tuning the ferroelectric-relaxor transition temperature in NBT-based lead-free ceramics by Bi nonstoichiometry. J. Eur. Ceram. Soc. 2017, 37, 4585–4595. [Google Scholar] [CrossRef]
- Dong, G.; Fan, H.; Shi, J.; Li, Q. Large strain response with low driving field in Bi1/2Na1/2TiO3–Bi1/2K1/2TiO3–Bi(Mg2/3Nb1/3)O3 ceramics. J. Am. Ceram. Soc. 2018, 101, 3947–3955. [Google Scholar] [CrossRef]
- Dong, G.; Fan, H.; Jia, Y. Effect of the element ratio in the doping component on the properties of 0.975 (0.8 Bi1/2Na1/2TiO3–0.2 Bi1/2K1/2TiO3)–0.025Bix/3Mgy/3Nbz/3O3 ceramics. J. Mater. Res. 2020. [Google Scholar] [CrossRef]
- Wang, T.; Liu, J.; Kong, L.; Yang, H.; Wang, F.; Li, C. Evolution of the structure, dielectric and ferroelectric properties of Na0.5Bi0.5TiO3-added BaTiO3–Bi (Mg2/3Nb1/3) O3 ceramics. Ceram. Int. 2020, 46, 25392–25398. [Google Scholar] [CrossRef]
- Mishra, P.; Kumar, P. Effect of sintering temperature on dielectric, piezoelectric and ferroelectric properties of BZT–BCT 50/50 ceramics. J. Alloys Compd. 2012, 545, 210–215. [Google Scholar] [CrossRef]
- Yoon, M.-S.; Khansur, N.H.; Ur, S.-C. The effect of pre-milling/pre-synthesis process and excess Ba on the microstructure and dielectric/piezoelectric properties of nano-sized 0.94 [(Bi0.5Na0.5)TiO3]–0.06 [Ba(1 + x)TiO3]. Ceram. Int. 2010, 36, 1265–1275. [Google Scholar] [CrossRef]
- Chaouchi, A.; Kennour, S.; d’Astorg, S.; Rguiti, M.; Courtois, C.; Marinel, S.; Aliouat, M. Characterization of sol–gel synthesised lead-free (1− x) Na0.5Bi0.5TiO3–xBaTiO3-based ceramics. J. Alloys Compd. 2011, 509, 9138–9143. [Google Scholar] [CrossRef]
- Badapanda, T.; Venkatesan, S.; Panigrahi, S.; Kumar, P. Structure and dielectric properties of bismuth sodium titanate ceramic prepared by auto-combustion technique. Process. Appl. Ceram 2013, 7, 135–141. [Google Scholar] [CrossRef][Green Version]
- Pan, Z.; Wang, Q.; Chen, J.; Liu, C.; Fan, L.; Liu, L.; Fang, L.; Xing, X. Enhanced piezoelectric properties of tetragonal (Bi1/2K1/2)TiO3 lead-free ceramics by substitution of pure Bi-based Bi (Mg2/3Nb1/3) O3. J. Am. Ceram. Soc. 2015, 98, 104–108. [Google Scholar] [CrossRef]
- Bhandari, S.; Sinha, N.; Ray, G.; Kumar, B. Processing and properties of ferroelectric Bi0. 5 (Na0.65K0.35)0.5 TiO3 ceramics under the effect of different sintering temperature. Scr. Mater. 2014, 89, 61–64. [Google Scholar] [CrossRef]
- Yoshida, K.; Fujimori, H. Morphotropic Phase Boundary on K-substituted Na0.5Bi0.5TiO3 synthesized with suppressing evaporation of bismuth and sodium. Trans. Mater. Res. Soc. Jpn. 2020, 45, 207–210. [Google Scholar] [CrossRef]
- Amini, R.; Ghazanfari, M.R.; Alizadeh, M.; Ardakani, H.A.; Ghaffari, M. Structural, microstructural and thermal properties of lead-free bismuth–sodium–barium–titanate piezoceramics synthesized by mechanical alloying. Mater. Res. Bull. 2013, 48, 482–486. [Google Scholar] [CrossRef]
- Naceur, H.; Megriche, A.; Maaoui, M.E. Frequency-dependant dielectric characteristics and conductivity behavior of Sr1−x (Na0. 5Bi0.5)xBi2Nb2O9 (x = 0.0, 0.2, 0.5, 0.8 and 1.0) ceramics. Orient. J. Chem. 2013, 29, 937–944. [Google Scholar] [CrossRef]
- Singh, P.; Pandey, R.; Singh, P. Polyol-mediated synthesis of Bi-deficient Mg2+-doped sodium bismuth titanate and study of oxide ion migration behaviour with functional properties. J. Alloys Compd. 2020, 860, 158492. [Google Scholar]
- Tsurumi, T.; Harigai, T. Dielectric and Optical Properties of Perovskite Artificial Superlattices, Handbook of Advanced Dielectric, Piezoelectric and Ferroelectric Materials; Elsevier: Amsterdam, The Netherlands, 2008; pp. 971–1005. [Google Scholar]
- Bacha, E.; Renoud, R.; Terrisse, H.; Borderon, C.; Richard-Plouet, M.; Gundel, H.; Brohan, L. Electrophoretic deposition of BaTiO3 thin films from stable colloidal aqueous solutions. J. Eur. Ceram. Soc. 2014, 34, 2239–2247. [Google Scholar] [CrossRef]
Publisher’s Note: MDPI stays neutral with regard to jurisdictional claims in published maps and institutional affiliations. |
© 2021 by the authors. Licensee MDPI, Basel, Switzerland. This article is an open access article distributed under the terms and conditions of the Creative Commons Attribution (CC BY) license (https://creativecommons.org/licenses/by/4.0/).