Abstract
Direct ascorbic acid fuel cells (DAAFCs) employ biocompatible ascorbic acid (AA) as fuel, allowing convenient storage, transportation, and fueling as well as avoiding fuel crossover. The AA oxidation reaction (AAOR) largely governs the performance of DAAFCs. However, AAOR electrocatalysts currently have low activity, and state-of-the-art ones are limited to carbon black. Herein, we report the synthesis of an unprecedented AAOR electrocatalyst comprising 3.9 ± 1.1 nm CeO2 nanoparticles evenly distributed on carbon black simply by the wet chemical precipitation of Ce(OH)3 and a subsequent heat treatment. The resultant CeO2/C shows a remarkable AAOR activity with a peak current density of 13.1 mA cm−2, which is 1.7 times of that of carbon black (7.67 mA cm−2). According to X-ray photoelectron spectroscopy (XPS), the surface Ce3+ of CeO2 appears to contribute to the AAOR activity. Furthermore, our density functional theory (DFT) calculation reveals that that the proton of the hydroxyl group of AA can easily migrate to the bridging O sites of CeO2, resulting in a faster AAOR with respect to the pristine carbon, -COOH, and -C=O sites of carbon. After an i-t test, CeO2/C loses 17.8% of its initial current density, which is much superior to that of carbon black. CeO2 can capture the electrons generated by the AAOR to protect the -COOH and -C=O sites from being reduced. Finally, DAAFCs fabricated with CeO2/C exhibit a remarkable power density of 41.3 mW cm−2, which is the highest among proton-exchange-membrane-based DAAFCs in the literature.
1. Introduction
Ascorbic acid (AA, vitamin C) can be either directly extracted from green plants or biochemically synthesized [1,2]. Relative to hydrogen and alcohol fuel, AA is much safer for use without fuel crossover and can be easily transported, stored, and refueled [3]. As an advantageous supplementation to hydrogen fuel cells, low-temperature direct AA fuel cells (DAAFCs) have many potential applications in portable chargers, unmanned aerial vehicles, cochlear implants, and pacemakers [4,5,6,7,8]. Since Fujiwara et al. first studied low-temperature DAAFCs [9], many have contributed to this emerging field [10]. However, the development of DAAFCs has been seriously jeopardized by the slow kinetics of the AA oxidation reaction (AAOR) at the anode side. Additionally, proton-exchange-membrane-based DAAFCs only have a record power density of 31 mW cm−2 [11]. It is crucial to investigate advanced AAOR electrocatalysts to improve the single’s cell performance.
In recent years, several AAOR electrocatalysts have been investigated, including noble metals [12,13], TiO2 [14], polymers [2,15,16], porphyrins [17,18], and high-surface-area carbon black [11,19,20]. Our group previously reported that carbon black (BP2000) is the most effective AAOR electrocatalyst [11]. However, state-of-the-art AAOR electrocatalysts remain as carbon black and deep un-derstanding on the nature of AAOR active sites are still missing. Inspired by the fact that CeO2 can electrochemically oxidize methanol [21,22,23], ethanol [24], formic acid [25], and glycerol [26,27], we are curious about whether CeO2 can function as a new type of AAOR electrocatalyst after being supported on carbon.
Herein, we report the synthesis of a series of CeO2/C electrocatalysts simply by the wet chemical deposition of Ce(OH)3 on carbon, followed by a heat treatment to convert Ce(OH)3 to CeO2 in the air. Typical CeO2/C comprises 3.9 ± 1.1 nm CeO2 nanoparticles evenly distributed on carbon black. CeO2/C exhibits an exceptional activity with an AAOR peak current density of 13.1 mA cm−2, which is 1.7 times of that of carbon black (7.67 mA cm−2). We found that the CeO2, -COOH, and -C=O of carbon and pristine carbon can strongly adsorb AA and are active sites for the AAOR. We investigated the origin of the high level of AAOR activity with X-ray photoelectron spectroscopy (XPS) and a density functional theory (DFT) calculation. Furthermore, after 4 h of an i-t test, CeO2/C lost 17.8% of its initial current density, which is much superior to that of carbon black (a loss of 33.1%). We explored the reason why CeO2/C has a superior stability to that of carbon black. Eventually, CeO2/C was fabricated as the anode of DAAFCs’ single cell, which exhibits the highest peak power density in the literature of 41.3 mW cm−2. This study expands our knowledge of the types of advanced AAOR electrocatalysts and presents our understanding of the nature of AAOR active sites for the first time.
2. Materials and Methods
2.1. Materials
Cerium(III) nitrate hexahydrate (Ce(NO3)3·6H2O, 99%) was ordered from Sigma-Aldrich (St. Louis, MO, USA) and used as received. Potassium hydroxide (KOH, 85%), ethanol (C2H6O, 99.9%), nitric acid (HNO3, 65%), and sulphuric acid (H2SO4, 98%) were obtained from Sinopharm Chemical Reagent Co., Ltd. (Shanghai, China). Black Pearls 2000 (BP2000) carbon black was purchased from Cabot (Boston, MA, USA). All aqueous solutions were prepared with ultrapure water (18.2 MΩ cm at 25 °C) produced from a Millipore water system (Synergy® UV, Île-de-France, France).
2.2. Electrocatalysts Synthesis
Carbon black was treated in 4 M HNO3 aq. at 80 °C for 1 h and then washed with deionized water until the pH of filtrate reached 7. The dried carbon black was dispersed in deionized water under ultrasonic agitation, followed by being frozen with liquid nitrogen and lyophilized at −60 °C for 24 h for future use.
In a typical synthesis of 2 wt% CeO2/C, 50 mg of treated carbon black was dispersed in 20 mL of deionized water under sonication. Next, 296.5 μL of 20 mM Ce(NO3)3 aq. was added to the suspension. Subsequently, 3.95 mL of 2 M KOH aq. was added dropwise to the mixture with a pipette under magnetic stirring (300 rpm). After 30 min of reaction, black precipitates were collected by washing them with deionized water until the pH of filtrate reached 7 and dried in a vacuum oven at 65 °C for 1 h. Finally, the sample was heat-treated in a tube furnace at 250 °C for 1 h with a ramping rate of 10 °C min−1 from room temperature in air. CeO2/C electrocatalysts with different CeO2 loadings (1–10 wt%) were also synthesized by simply varying the amount of Ce(NO3)3 aq. while holding the other reaction parameters constant. The real loadings of CeO2 on carbon were determined by thermogravimetric analysis (TGA) and inductive coupled plasma (ICP), which are close to the theoretical values (Figure S1 and Table S1).
2.3. Single Cell Tests
An electrocatalyst-coated membrane (CCM) of 4 cm2 was fabricated by spraying CeO2/C ink with an I/C of 0.1 onto the anode side of a Nafion 211 membrane to reach an anodic electrocatalyst loading of 1 mg cm−2. The cathode side was similarly fabricated with commercial Pt/C (JM, 60 wt%) at a platinum loading of 0.6 mgPt cm−2 (I/C = 0.4). Anodic gas diffusion layer (TGP-H-60, Toray, Tokyo, Japan) and cathodic gas diffusion layer (GDL-10d, Sunrisepower Co., Ltd., Dalian, China) were hot-pressed to sandwich the CCM at 130 °C for 2 min to obtain a membrane electrode assembly (MEA). For comparison, MEAs with carbon black as the anodic electrocatalyst were also fabricated under the same conditions. Fuel cell tests were carried out on an in-house fuel cell system. Via a peristaltic pump, 0.5 M AA aq. was continuously delivered to the anode side at a flow rate of 15 mL min−1, while humidified oxygen (100% RH) was supplied to the cathode side (400 mL min−1). The temperature of liquid fuel, O2, and single cell hardware was maintained at 80 °C. Polarization plots were collected using an electronic load (PLZ1004WH, Kikusui, Yokohama, Japan).
2.4. DFT Calculation
A pristine 4 × 4 graphene (GRA) layer model was functionalized by hydroxyl, carboxyl, or carbonyl group as well as by the introduction of a Stone–Wales defect. Models of cerium oxide cluster on the GRA were also built.
All models were fully optimized with the B3LYP hybrid functional using Gaussian 09 program [28]. The cerium atoms (Ce) in these models were described by large-core quasi-relativistic pseudopotentials (ECP47MWB for tetravalent Ce and ECP48MWB for trivalent Ce) together with the corresponding basis sets for the valence shells [29,30]. For C, H, and O in the models, the 6–31G(d,p) basis set{#4} was employed [31]. All calculations were conducted in aqueous phase with the solvation effect of water considered through the solvation model based on density (SMD) [32]. The influence of dispersion was considered by Grimme’s DFT-D3 correction in all calculations [33].
Vibrational frequency analysis was carried out to confirm all of the stationary points are minima and to abstract thermal corrections. Gibbs free energies were evaluated at 298.15 K and 1 atm.
The adsorption free energies of AA molecule on GRA () were calculated as follows:
where GGRA+AA, GGRA, and GAA are the total energies of the GRA with the adsorbate adsorbed, intact GRA, and intact AA molecule, respectively.
ΔGads = GGRA+AA − (GGRA + GAA)
The deformation energy of the AA molecule (Edef,AA) is defined as follows:
where Edis,AA and Eeq,AA are energies of AA molecule with distorted geometry in adsorbed models and in its intact form, respectively.
Edef,AA = Edis,AA − Eeq,AA
3. Results and Discussion
This section is divided into subsections. It provides a concise and precise description of the experimental results and their interpretation, as well as the experimental conclusions that can be drawn.
3.1. Synthesis and Structural Characterizations of CeO2/C
In a typical synthesis, carbon black was first mixed with a Ce(NO3)3 aqueous solution (Figure 1a). Next, KOH aq. was added in to have Ce3+ precipitate out on carbon as Ce(OH)3. Lastly, the sample was heat-treated at 250 °C in the air for 1 h, during which the Ce(OH)3 was oxidized to form CeO2 on carbon.
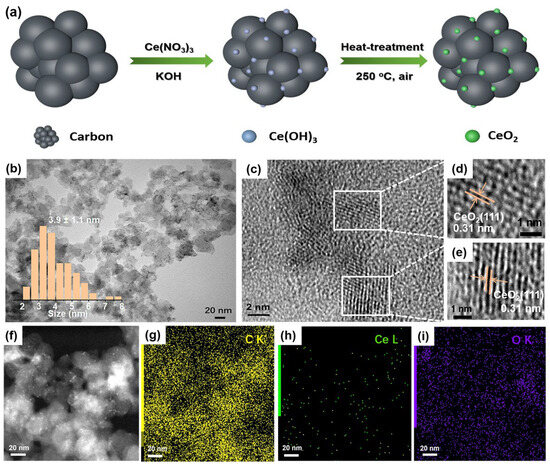
Figure 1.
Synthetic scheme and structural characterizations of CeO2/C. (a) Schematic diagram of synthetic route of CeO2/C; (b) TEM image of 2 wt% CeO2/C; (c–e) HRTEM images of 2 wt% CeO2/C; (f) STEM image; and (g–i) TEM-EDX elemental mapping of 2 wt% CeO2/C. Inset: size distribution plot of CeO2 nanoparticles created by manually measuring at least 150 individual ones.
Transmission electron microscope (TEM) images reveal that the CeO2 nanoparticles have an average size of 3.9 ± 1.1 nm on carbon without any noticeable agglomerations (Figure 1b). High-resolution TEM (HRTEM) images clearly show that the CeO2 nanoparticles are crystalline with a typical lattice spacing of 0.31 nm (Figure 1c–e), which corresponds to the (111) crystal plane of fluorite CeO2 [34]. The elemental mapping shows that sparse Ce is uniformly dispersed on carbon in the whole selected area (Figure 1f–i). According to the TGA and ICP results (Figure S1 and Table S1), the loading of CeO2 on carbon is 2.15 wt%. The X-ray diffraction pattern (XRD) shows that CeO2/C possesses characteristic diffraction peaks of a fluorite structure (Figure S2), consistent with the HRTEM images (Figure 1d,e). According to the Raman spectra, the loading of CeO2 did not change the ratio of the D peak to G peak (ID/IG) of the carbon support (Figure S3), in good agreement with the low-CeO2 loading. Similarly, the N2 adsorption/desorption measurements in Figure S4 show that the surface area of 2 wt% CeO2/C is similar to that of carbon. This implies that the low loading of CeO2 barely affects the specific surface area of carbon.
3.2. Electrochemical Activity of CeO2/C
The cyclic voltammetry (CV) curve of 2 wt% CeO2/C exhibits an obvious anodic peak residing at around 0.54 V (vs. RHE) in 0.5 M H2SO4 + 1 mM AA aq., corresponding to the AAOR (Figure 2a). The AAOR peak current density of 2 wt% CeO2/C reaches 13.1 mA cm−2, which is about 1.7 times of that of carbon black (7.67 mA cm−2, Table S2), which is the previously identified best AAOR electrocatalyst [11,19,20]. Moreover, 2 wt% CeO2/C has a lower onset potential of 0.441 V (vs. RHE) compared with that of carbon black. furthermore, we found that the loading of 100 μg cm−2 2 wt% CeO2/C on a rotating disk electrode (RDE) resulted in the best AAOR activity (Figure 2b). It is possible that there is a sufficient amount of electrocatalyst and efficient mass transfer at a loading of 100 μg cm−2. Higher or lower than this loading, either the amount of electrocatalyst or the mass transfer is not optimal. In addition, the loading of CeO2 on carbon apparently influences the peak current density of the AAOR (Figure 2c and Figure S5). It turns out that all of CeO2/C electrocatalysts are superior to carbon and the 2 wt% CeO2/C has the highest AAOR peak current density. Nyquist plots of the carbon black and CeO2/C with different CeO2 loadings on carbon show that the 2 wt% CeO2/C exhibits the smallest diameter of the half arc, which suggests it has the smallest charge transfer resistance and the fastest reaction kinetics (Figure 2d). This partly explains why the 2 wt% CeO2/C has the highest AAOR activity.
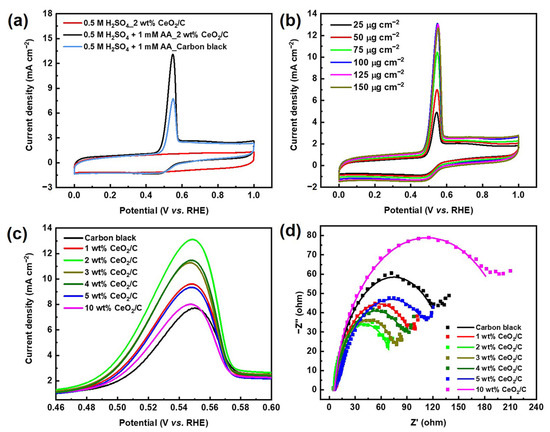
Figure 2.
Electrochemical performance of electrocatalysts. (a) CV curves of 2 wt% CeO2/C and carbon black collected in N2-saturated 0.5 M H2SO4 aq. and 1 mM AA + 0.5 M H2SO4 aq., respectively, with a sweep rate of 50 mV s−1; (b) CV curves of 2 wt% CeO2/C collected in N2-saturated 1 mM AA + 0.5 M H2SO4 aq. at different loadings of 2 wt% CeO2/C on RDE; (c) Locally enlarged CV curves of carbon black and CeO2/C with different CeO2 loadings on carbon collected in N2-saturated 1 mM AA + 0.5 M H2SO4 aq., while keeping the loading of CeO2/C on RDE constant at 100 μg cm−2; and (d) Nyquist plots of carbon black and CeO2/C with different CeO2 loadings on carbon collected in N2-saturated 1 mM AA + 0.5 M H2SO4 aq. at 0.5 V (vs. RHE).
3.3. Nature of Active Sites and AAOR Mechanism
It is necessary to further explore the nature of active sites and the AAOR mechanism. Our X-ray photoelectron spectroscopy (XPS) results show that the percentage of surface Ce3+ residing at about 886.2 and 904.8 eV relative to the total amount of Ce species gradually decreases from 34.8% to 20.1% in the series of CeO2/C samples (Figure 3 and Table S3) [34,35,36,37,38]. Ce3+ and oxygen vacancies co-exist, so Ce3+ is usually used to describe oxygen vacancies [39]. As shown in Figure 2c and Figure 3b, it seems that the total Ce3+ surface content correlates well to the AAOR activity. Moreover, the 2 wt% CeO2/C has both the highest Ce3+ surface content of 0.68 wt% and the highest AAOR activity. We propose that the high oxygen vacancy content would be conducive for this improvement in the AAOR activity.
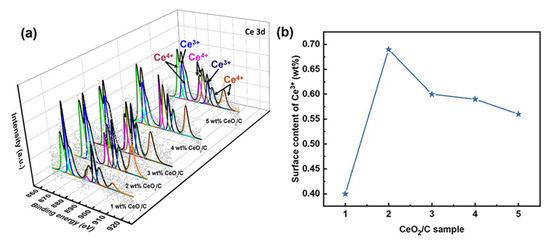
Figure 3.
Ce 3D XPS analysis of a series of CeO2/C. (a) Different CeO2 loadings with Ce3+ at 886.2 and 904.8 eV and Ce4+ at about 883, 888.9, 899.3, 901.9, 908.8, and 917.2 eV; (b) surface content of Ce3+.
A DFT calculation was conducted to gain more insight into the role of ceria. In the models (Figure 4a,b), a ceria cluster is anchored on the GRA via four O-bridged bonds. We have also investigated the binding of ceria on GRA via a non-bonded interaction and found it thermodynamically unstable. Hence, the model of the physical adsorption of the ceria on GRA was not considered for the AAOR. The adsorption free energy of AA was calculated to be −40.61 kcal mol−1 with the aliphatic hydroxyl group (Figure 4a) and −53.53 kcal mol−1 with the hydroxyl group on the five-membered ring connecting to the ceria, respectively (Figure 4b). This strongly suggests that the ceria can provide adsorption sites for AA and thus functions as an efficient AAOR electrocatalyst. Interestingly, when the hydroxyl group of the five-membered ring interacts with the ceria, the proton of the hydroxyl group can easily migrate to the bridging O sites of the ceria. This further implies that the presence of the ceria would accelerate the AAOR process and explains why the 2 wt% CeO2/C has an excellent AAOR activity.
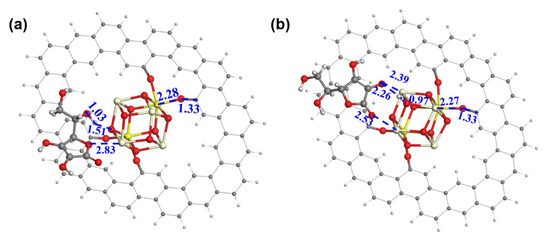
Figure 4.
The construction of AA adsorption models on ceria cluster/GRA. (a) AA adsorbed on ceria cluster/GRA with the aliphatic hydroxyl and the ether oxygen of the five-membered ring as bridges; (b) AA adsorbed on ceria cluster/GRA with two hydroxyl groups of the five-membered ring as bridges. Oxygen, carbon, hydrogen, trivalent cerium, and tetravalent cerium atoms are in red, black, white, light yellow, and bright yellow, respectively. The distances between neighboring atoms are in angstrom.
3.4. Durability of CeO2/C and Its Origins
For potential applications, the durability of the 2 wt% CeO2/C was also investigated by the chronoamperometric method at 0.5 V (vs. RHE) with carbon black used as a comparison. After 4 h of an i-t test, the current density of the 2 wt% CeO2/C degrades by 18.8% (Figure 5a) and is much superior to that of carbon black with a current density degradation of 33.1%. This clearly shows that the 2 wt% CeO2/C has an apparently improved durability compared to that of the carbon black. After the i-t test, the surface-oxygen-containing groups of the 2 wt% CeO2/C decrease from 33.7% to 24.5%, while those of carbon decrease from 34.4% to 17.6%, as shown in Figure 5b–d and Tables S4 and S5 [11]. It seems that the AAOR activity is closely related to the carbon surface oxygen species. We further employed a DFT to study the nature of the active sites on carbon.
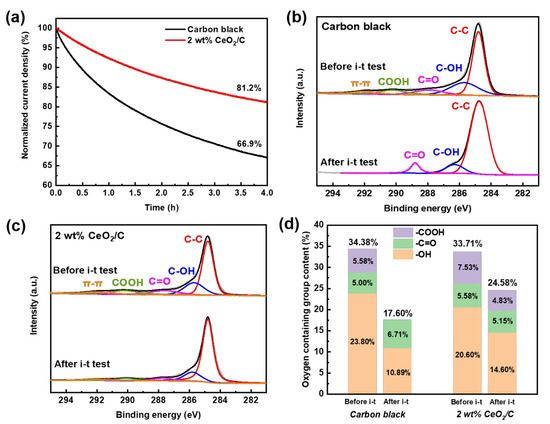
Figure 5.
Durability and the origins of CeO2/C. (a) i-t curves of 2 wt% CeO2/C and carbon black collected at 0.5 V (vs. RHE) in 0.5 M H2SO4 + 1 mM AA aq.; (b) C 1s XPS of 2 wt% CeO2/C before and after i-t test; (c) C 1s XPS of carbon black before and after i-t test; and (d) surface oxygen content change of 2 wt% CeO2/C and carbon black before and after i-t test based on XPS.
Figure 6 shows the AA adsorption geometries of GRA with -OH, -C=O, and -COOH. The adsorption of AA at the -OH site is the weakest with an adsorption energy of −1.77 kcal mol−1 (Table S6). In contrast, the adsorption at the -C=O and -COOH sites are much stronger with an adsorption energy of −4.48 kcal mol−1 and −5.27 kcal mol−1, respectively. In addition, the hydrogen bond distance is 1.76 Å between the carboxyl H of GRA and the carbonyl O of the AA’s five-membered ring, while the hydrogen bond distance is 2.82 Å between the hydroxyl H of GRA and the carbonyl O of the AA’s five-membered ring. This is consistent with the corresponding adsorption energy. It is certain that the AA molecule has a higher propensity to be adsorbed and oxidized at the carboxyl site than at the hydroxyl site. Furthermore, the -C=O site and GRA have an AA adsorption energy similar to that of the -COOH site and would also function as AAOR active sites.
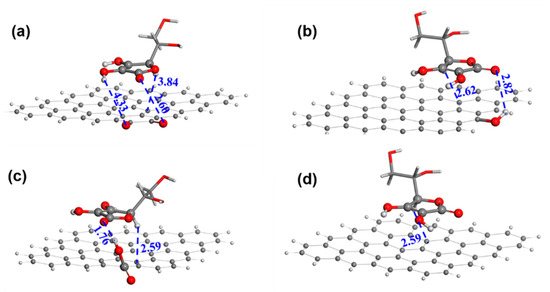
Figure 6.
The adsorption geometries of AA on different substrates. (a) Carbonyl; (b) hydroxyl; (c) carboxyl; and (d) graphene sheet. Red, black, and white are oxygen, carbon, and hydrogen atoms, respectively. The distances between neighboring atoms are in angstrom.
During the i-t test, the total content of the -C=O and -COOH of the carbon black decreases from 10.6% to 6.7%. The -COOH has been completely lost with a possible partial conversion to -C=O, which increases from 5.0% to 6.7% after the i-t test. It is more than likely that the -COOH of the carbon black has been gradually reduced by electrons from the AAOR, resulting in the decrease in active sites and AAOR activity. In contrast, the total content of the -C=O and -COOH of the 2 wt% CeO2/C slightly decreases from 13.1% to 10.0% (Figure 5d and Table S5), suggesting that the CeO2 may have protected the -C=O and -COOH by capturing electrons and thus reducing the loss of active sites. Moreover, our HRTEM images of the 2 wt% CeO2/C after the durability test (Figure S6) show that the diameter of the CeO2 nanoparticles remains almost unchanged. It is clear that the CeO2 nanoparticles are able to survive the i-t test, and the activity loss mainly comes from the degradation of the carbon support.
3.5. DAAFC Performance
In order to verify the performance of the CeO2/C electrocatalyst, 2 wt% CeO2/C was fabricated into the anode of a 4 cm2 DAAFC single cell with commercial Pt/C (60 wt%) as the cathode. The single cell peak power density reaches 41.3 mW cm−2 at 80 °C after temperature optimization (Figure 7a,b). Compared with the single cell fabricated with carbon black (33.8 mW cm−2), the power density increases by 22%. This proves that the 2 wt% CeO2/C has an excellent activity in single cells. To the best of our knowledge, the peak power density of the 2 wt% CeO2/C is the highest among documented DAAFCs using a proton exchange membrane (Figure 7c and Table S7) [2,12,18,19,20,40,41,42]. The peak power density of our DAAFCs with the non-noble metal anodic electrocatalyst is close to that of direct methanol fuel cells typically with PtRu/C as the anodic electrocatalyst [43,44,45]. We suspect that the relatively sluggish AAOR cannot generate enough protons for the cathodic oxygen reduction reaction, thus jeopardizing their single cell performance. Consequently, when an optimal concentration of 0.2 M H2SO4 and 0.5 M AA aq. was fueled to the anode, the maximum power maximum power density reached 52 mW cm−2 (Figure 7d), which is 26% higher than that of the anode fueled without H2SO4.
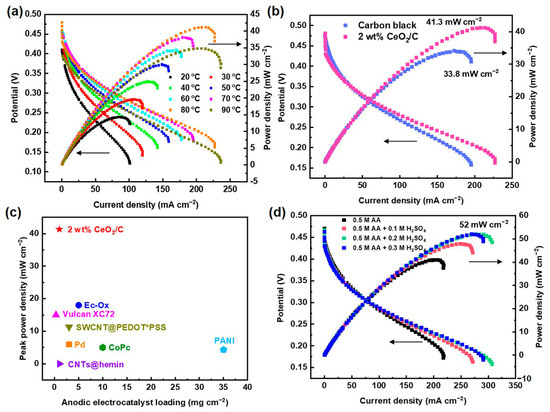
Figure 7.
DAAFC performance of 2 wt% CeO2/C. (a) Polarization curves and power density curves of DAAFCs with 2 wt% CeO2/C and carbon black as anodes, respectively, tested at 80 °C; (b) polarization curves and power density curves of DAAFCs fabricated with 2 wt% CeO2/C as anode tested at 20–90 °C; (c) comparison of DAAFCs’ peak power density with different electrocatalysts and loadings; (d) polarization curves and power density curves of DAAFCs fabricated with 2 wt% CeO2/C as anode, while supplying 0.1–0.3 M H2SO4 aq. to the anode.
4. Conclusions
In summary, a series of CeO2/C AAOR electrocatalysts were designed and simply synthesized by the wet chemical precipitation of Ce(OH)3 and a subsequent heat treatment. Among all documented electrocatalysts, 2 wt% CeO2/C exhibits the highest activity with a peak current density of 13.1 mA cm−2, which is 1.7 times of that of carbon black (7.67 mA cm−2). According to our DFT calculations and XPS experiments, its remarkable activity may stem from its strong AA adsorption on the surface of the ceria and the easy migration of the proton of the hydroxyl group of AA to the bridging O sites of the ceria. After 4 h of an i-t test, 2 wt% CeO2/C retains 81.2% of its initial current density, which is much better than carbon black (66.9%). CeO2/C merely loses 27.1% of the -COOH and -C=O sites of the carbon support after an i-t test. In contrast, carbon black loses 48.8% of its -COOH and -C=O sites. CeO2 may capture electrons to protect the -COOH and -C=O sites from being reduced, thus enhancing durability. Finally, DAAFCs with a 1 mg cm−2 2 wt% CeO2/C anode show a maximum power density of 41.3 mW cm−2, which is 2.2 times that of the corresponding value in the literature. This study opens up opportunities for the design and synthesis of advanced non-noble metal electrocatalysts for AAORs and illuminates the nature of AAOR active sites for the first time.
Supplementary Materials
The following supporting information can be downloaded at: https://www.mdpi.com/article/10.3390/nano13192669/s1, Experimental: Electrochemical Measurements and Materials Characterizations; Figure S1: TGA curves of carbon black and CeO2/C with different CeO2 loadings; Figure S2: XRD patterns of carbon black and CeO2/C with different CeO2 loadings; Figure S3: Raman spectra of carbon black and CeO2/C with different CeO2 loadings; Figure S4: (a) N2 adsorption–desorption isotherms and (b) pore-size distributions of carbon black and 2 wt% CeO2/C. Inset: enlarged pore-size distributions; Figure S5: (a) CV curves of carbon black and CeO2/C with different CeO2 loadings collected in N2-saturated 1 mM AA + 0.5 M H2SO4 aq. Note: the loading of CeO2/C on RDE is 0.1 mg cm−2; (b) relationship between peak current density and CeO2/C with different CeO2 loadings on carbon; Figure S6: (a,b) HRTEM images of 2 wt% CeO2/C after 4 h i-t test; Table S1: ICP results of CeO2/C with different CeO2 loadings; Table S2: AAOR performance of carbon black and CeO2/C with different CeO2 loadings; Table S3: Ce content of CeO2/C with different CeO2 loadings according to XPS; Table S4: O-containing groups content based on fitted C1s XPS of carbon black before/after i-t test; Table S5: O-containing groups content based on fitted C1s XPS of 2 wt% CeO2/C before/after i-t test; Table S6: Calculated adsorption energies of AA (∆Gads) on graphene with different oxygen containing groups; Table S7: DAAFCs performance parameters [2,9,18,19,20,40,41,42].
Author Contributions
Conceptualization, C.Q. and Y.S.; methodology, Q.Z. and D.W.; validation, C.Q., R.G. and Y.G.; formal analysis, C.Q. and R.G.; investigation, C.Q., Q.Z., Y.G. and J.Q.; writing—original draft preparation, C.Q.; writing—review and editing, R.G., D.W. and Y.S.; funding acquisition, Y.S. All authors have read and agreed to the published version of the manuscript.
Funding
This work was partially supported by National Natural Science Foundation of China (Grant No. 22278057), Science and Technology Program of Liaoning Province (Grant No. 2022JH2/101300206), Talent Project of Revitalizing Liaoning (Grant No. XLYC2002067), and “Unveiling and Commanding” Key Technology Research and Development Program of Dalian (Grant No. 2021JB11GX005).
Data Availability Statement
Data can be made available on request.
Conflicts of Interest
The authors declare no conflict of interest.
References
- Fujiwara, N.; Yamazaki, S.-i.; Siroma, Z.; Ioroi, T.; Yasuda, K. l-Ascorbic acid as an alternative fuel for direct oxidation fuel cells. J. Power Sources 2007, 167, 32–38. [Google Scholar] [CrossRef]
- Mondal, S.K.; Raman, R.K.; Shukla, A.K.; Munichandraiah, N. Electrooxidation of ascorbic acid on polyaniline and its implications to fuel cells. J. Power Sources 2005, 145, 16–20. [Google Scholar] [CrossRef][Green Version]
- Chino, I.; Hendrix, K.; Keramati, A.; Muneeb, O.; Haan, J.L. A split pH direct liquid fuel cell powered by propanol or glycerol. Appl. Energy 2019, 251, 113323. [Google Scholar] [CrossRef]
- Hasan, M.M. Environment-Friendly Ascorbic Acid Fuel Cell. Electrochem 2023, 4, 31–41. [Google Scholar] [CrossRef]
- Do, U.P.; Seland, F.; Johannessen, E.A. A micro fuel cell for abiotical catalysis of glucose. J. Power Sources 2020, 478, 229032. [Google Scholar] [CrossRef]
- Liu, Y.; Feng, T.; Lu, S.; Wang, H.; Xiang, Y. A Direct Liquid Fuel Cell with High Power Density Using Reduced Phosphotungstic Acid as Redox Fuel. Energy Environ. Mater. 2021, 5, 1–7. [Google Scholar] [CrossRef]
- Chino, I.; Vega, L.; Keramati, A.; Hendrix, K.; Haan, J.L. A direct liquid fuel cell powered by 1,3- or 1,2-propanediol. Appl. Energy 2020, 262, 114564. [Google Scholar] [CrossRef]
- Shamraiz, U.; Ahmad, Z.; Raza, B.; Badshah, A.; Ullah, S.; Nadeem, M.A. CaO-Promoted Graphene-Supported Palladium Nanocrystals as a Universal Electrocatalyst for Direct Liquid Fuel Cells. ACS Appl. Mater. Interfaces 2020, 12, 4396–4404. [Google Scholar] [CrossRef]
- Fujiwara, N.; Yasuda, K.; Ioroi, T.; Siroma, Z.; Miyazaki, Y.; Kobayashi, T. Direct Polymer Electrolyte Fuel Cells Using L-Ascorbic Acid as a Fuel. Electrochem. Solid-State Lett. 2003, 6, A257. [Google Scholar] [CrossRef]
- Mogi, H.; Fukushi, Y.; Koide, S.; Sano, R.; Sasaki, T.; Nishioka, Y. A Flexible Ascorbic Acid Fuel Cell with a Microchannel Fabricated using MEMS Techniques. J. Phys. Conf. Ser. 2013, 476, 012065. [Google Scholar] [CrossRef]
- Qiu, C.; Chen, H.; Liu, H.; Zhai, Z.; Qin, J.; Lv, Y.; Gao, Z.; Song, Y. The hydrophilicity of carbon for the performance enhancement of direct ascorbic acid fuel cells. Int. J. Hydrogen Energy. 2018, 43, 21908–21917. [Google Scholar] [CrossRef]
- Muneeb, O.; Do, E.; Tran, T.; Boyd, D.; Huynh, M.; Ghosn, G.; Haan, J.L. A direct ascorbate fuel cell with an anion exchange membrane. J. Power Sources 2017, 351, 74–78. [Google Scholar] [CrossRef]
- Mandal, D.; Mondal, S.; Senapati, D.; Satpati, B.; Sangaranarayanan, M.V. Charge Density Modulated Shape-Dependent Electrocatalytic Activity of Gold Nanoparticles for the Oxidation of Ascorbic Acid. J. Phys. Chem. C 2015, 119, 23103–23112. [Google Scholar] [CrossRef]
- Kim, Y.E.; Kim, M.-Y.; Lee, J.K.; Uhm, S.; Seo, G.; Lee, J. Surface modifications of a carbon anode catalyst by control of functional groups for vitamin C fuel cells. Electrocatalysis 2011, 2, 200–206. [Google Scholar] [CrossRef]
- Ganesan, R.; Gedanken, A. Organic–inorganic hybrid materials based on polyaniline/TiO2 nanocomposites for ascorbic acid fuel cell systems. Nanotechnology 2008, 19, 435709. [Google Scholar] [CrossRef] [PubMed]
- Zhou, C.; Shi, Y.; Luo, J.; Zhang, L.; Xiao, D. Diameter-controlled synthesis of polyaniline microtubes and their electrocatalytic oxidation of ascorbic acid. J. Mater. Chem. B 2014, 2, 4122–4129. [Google Scholar] [CrossRef]
- Pan, B.; Zhao, W.; Zhang, X.; Li, J.; Xu, J.; Ma, J.; Liu, L.; Zhang, D.; Tong, Z. Research on the self-assembly of exfoliated perovskite nanosheets (LaNb2O7−) and cobalt porphyrin utilized for the electrocatalytic oxidation of ascorbic acid. RSC Adv. 2016, 6, 46388–46393. [Google Scholar] [CrossRef]
- Devendrachari, M.C.; Thimmappa, R.; Bhat, Z.M.; Shafi, S.P.; Nimbegondi Kotresh, H.M.; Kottaichamy, A.R.; Venugopala Reddy, K.R.; Thotiyl, M.O. A vitamin C fuel cell with a non-bonded cathodic interface. Sustain. Energy Fuels 2018, 2, 1813–1819. [Google Scholar] [CrossRef]
- Fujiwara, N.; Yamazaki, S.-I.; Siroma, Z.; Ioroi, T.; Yasuda, K. Direct oxidation of l-ascorbic acid on a carbon black electrode in acidic media and polymer electrolyte fuel cells. Electrochem. Commun. 2006, 8, 720–724. [Google Scholar] [CrossRef]
- Uhm, S.; Choi, J.; Chung, S.T.; Lee, J. Electrochemically oxidized carbon anode in direct l-ascorbic acid fuel cells. Electrochim. Acta 2007, 53, 1731–1736. [Google Scholar] [CrossRef]
- Qiu, C.; Wang, S.; Gao, R.; Qin, J.; Li, W.; Wang, X.; Zhai, Z.; Tian, D.; Song, Y. Low-temperature synthesis of PdO-CeO2/C toward efficient oxygen reduction reaction. Mater. Today Energy 2020, 18, 100557. [Google Scholar] [CrossRef]
- Lu, P.; Qiao, B.; Lu, N.; Hyun, D.C.; Wang, J.; Kim, M.J.; Liu, J.; Xia, Y. Photochemical Deposition of Highly Dispersed Pt Nanoparticles on Porous CeO2 Nanofibers for the Water-Gas Shift Reaction. Adv. Funct. Mater. 2015, 25, 4153–4162. [Google Scholar] [CrossRef]
- Salarizadeh, P.; Askari, M.B.; Mohammadi, M.; Hooshyari, K. Electrocatalytic performance of CeO2-decorated rGO as an anode electrocatalyst for the methanol oxidation reaction. J. Phys. Chem. Solids. 2020, 142, 109442. [Google Scholar] [CrossRef]
- Murphin Kumar, P.S.; Thiripuranthagan, S.; Imai, T.; Kumar, G.; Pugazhendhi, A.; Vijayan, S.R.; Esparza, R.; Abe, H.; Krishnan, S.K. Pt Nanoparticles Supported on Mesoporous CeO2 Nanostructures Obtained through Green Approach for Efficient Catalytic Performance toward Ethanol Electro-oxidation. ACS Sustain. Chem. Eng. 2017, 5, 11290–11299. [Google Scholar] [CrossRef]
- Zhang, L.; Ding, L.-X.; Luo, Y.; Zeng, Y.; Wang, S.; Wang, H. PdO/Pd-CeO2 hollow spheres with fresh Pd surface for enhancing formic acid oxidation. Chem. Eng. J. 2018, 347, 193–201. [Google Scholar] [CrossRef]
- Zhang, J.-H.; Zhu, T.; Liang, Y.-J.; Zhang, C.-J.; Shi, S.T.; Xu, C.W. CeO2 promoted Au/C catalyst for glycerol electro-oxidation in alkaline medium. J. Energy Inst. 2016, 89, 325–329. [Google Scholar] [CrossRef]
- Yousaf, A.B.; Imran, M.; Uwitonze, N.; Zeb, A.; Zaidi, S.J.; Ansari, T.M.; Yasmeen, G.; Manzoor, S. Enhanced Electrocatalytic Performance of Pt3Pd1 Alloys Supported on CeO2/C for Methanol Oxidation and Oxygen Reduction Reactions. J. Phys. Chem. C 2017, 121, 2069–2079. [Google Scholar] [CrossRef]
- Devlin, F.J.; Finley, J.W.; Stephens, P.J.; Frisch, M.J. Ab Initio Calculation of Vibrational Absorption and Circular Dichroism Spectra Using Density Functional Force Fields: A Comparison of Local, Nonlocal, and Hybrid Density Functionals. J. Phys. Chem. 1995, 99, 16883–16902. [Google Scholar] [CrossRef]
- Dolg, M.; Stoll, H.; Savin, A.; Preuss, H. Energy-adjusted pseudopotentials for the rare earth elements. Theor. Chim. Acta 1989, 75, 173–194. [Google Scholar] [CrossRef]
- Dolg, M.; Stoll, H.; Preuss, H. A combination of quasirelativistic pseudopotential and ligand field calculations for lanthanoid compounds. Theor. Chim. Acta 1993, 85, 441–450. [Google Scholar] [CrossRef]
- Petersson, G.A.; Al-Laham, M.A. A complete basis set model chemistry. II. Open-shell systems and the total energies of the first-row atoms. J. Chem. Phys. 1991, 94, 6081–6090. [Google Scholar] [CrossRef]
- Marenich, A.V.; Cramer, C.J.; Truhlar, D.G. Universal Solvation Model Based on Solute Electron Density and on a Continuum Model of the Solvent Defined by the Bulk Dielectric Constant and Atomic Surface Tensions. J. Phys. Chem. B 2009, 113, 6378–6396. [Google Scholar] [CrossRef]
- Grimme, S.; Antony, J.; Ehrlich, S.; Krieg, H. A consistent and accurate ab initio parametrization of density functional dispersion correction (DFT-D) for the 94 elements H-Pu. J. Chem. Phys. 2010, 132, 154104. [Google Scholar] [CrossRef]
- Tan, Q.; Du, C.; Sun, Y.; Yin, G.; Gao, Y. Pd-around-CeO2−xhybrid nanostructure catalyst: Three-phase-transfer synthesis, electrocatalytic properties and dual promoting mechanism. J. Mater. Chem. A 2014, 2, 1429–1435. [Google Scholar] [CrossRef]
- Wang, M.; Shen, M.; Jin, X.; Tian, J.; Li, M.; Zhou, Y.; Zhang, L.; Li, Y.; Shi, J. Oxygen Vacancy Generation and Stabilization in CeO2–x by Cu Introduction with Improved CO2 Photocatalytic Reduction Activity. ACS Catal. 2019, 9, 4573–4581. [Google Scholar] [CrossRef]
- Hao, C.; Tang, Y.-B.; Shi, W.-L.; Chen, F.-Y.; Guo, F. Facile solvothermal synthesis of a Z-Scheme 0D/3D CeO2/ZnIn2S4 heterojunction with enhanced photocatalytic performance under visible light irradiation. Chem. Eng. J. 2021, 409, 128168. [Google Scholar] [CrossRef]
- Li, J.; Gou, G.; Zhao, H.; Liu, C.; Li, N.; Li, L.; Tan, B.; Lai, B. Efficient peroxymonosulfate activation by CoFe2O4-CeO2 composite: Performance and catalytic mechanism. Chem. Eng. J. 2022, 435, 134840. [Google Scholar] [CrossRef]
- Xu, L.; Wang, J. Magnetic Nanoscaled Fe3O4/CeO2 Composite as an Efficient Fenton-Like Heterogeneous Catalyst for Degradation of 4-Chlorophenol. Environ. Sci. Technol. 2012, 46, 10145–10153. [Google Scholar] [CrossRef] [PubMed]
- Zhou, H.P.; Wu, H.S.; Shen, J.; Yin, A.X.; Yan, C.H. Thermally Stable Pt/CeO2 Hetero-Nanocomposites with High Catalytic Activity. J. Am. Chem. Soc. 2010, 132, 4998–4999. [Google Scholar] [CrossRef] [PubMed]
- Kaneto, K.; Nishikawa, M.; Uto, S. Characteristics of Ascorbic Acid Fuel Cells Using SWCNT and PEDOT*PSS Composite Anodes. Chem. Lett. 2019, 48, 1533–1536. [Google Scholar] [CrossRef]
- Choun, M.; Lee, H.J.; Lee, J. Positively charged carbon electrocatalyst for enhanced power performance of L-ascorbic acid fuel cells. J. Energy Chem. 2016, 25, 793–797. [Google Scholar] [CrossRef]
- Lin, W.L.; Li, N.X.; Hu, G.X.; Li, H. Hemin-intercalated layer-by-layer electropolymerized co-deposition of bisphenol A on carbon nanotubes for dual electrocatalysis towards ascorbate oxidation and oxygen reduction. Electrochim. Acta 2020, 340, 9. [Google Scholar] [CrossRef]
- Arbizzani, C.; Beninati, S.; Soavi, F.; Varzi, A.; Mastragostino, M. Supported PtRu on mesoporous carbons for direct methanol fuel cells. J. Power Sources 2008, 185, 615–620. [Google Scholar] [CrossRef]
- Guo, J.S.; Song, G.Q.; Sun, S.G.; Shi, S.Y.; Yang, W.Q.; Jing, Q.; Yan, Y.S.; Xin, Q. Polyol-synthesized PtRu/C and PtRu black for direct methanol fuel cells. J. Power Sources 2007, 168, 299–306. [Google Scholar] [CrossRef]
- Tian, M.; Shi, S.; Shen, Y.; Yin, H. PtRu alloy nanoparticles supported on nanoporous gold as an efficient anode catalyst for direct methanol fuel cell. Electrochim. Acta 2019, 293, 390–398. [Google Scholar] [CrossRef]
Disclaimer/Publisher’s Note: The statements, opinions and data contained in all publications are solely those of the individual author(s) and contributor(s) and not of MDPI and/or the editor(s). MDPI and/or the editor(s) disclaim responsibility for any injury to people or property resulting from any ideas, methods, instructions or products referred to in the content. |
© 2023 by the authors. Licensee MDPI, Basel, Switzerland. This article is an open access article distributed under the terms and conditions of the Creative Commons Attribution (CC BY) license (https://creativecommons.org/licenses/by/4.0/).