1. Introduction
With the development of science and technology, the demand for energy in modern society is increasing rapidly. However, the stock of coal, oil, and other resources on the earth we live on is limited. The development and utilization of a large amount of fossil energy has not only greatly reduced the inventory of non-renewable energy but has also worsened environmental problems and endangered the physical and mental health of human beings. Therefore, it is necessary to transform energy consumption patterns and develop clean energy. Developing green energy including solar energy [
1,
2], wind energy [
3,
4], water energy [
5], and hydrogen energy [
6,
7] is a reliable and alternative choice for dealing with the global energy crisis and environmental pollution. Hydrogen energy, which has a wide range of sources and applications, has a broader application prospect. Hydrogen energy is high-efficiency clean energy with high energy density, renewable energy, convenient storage and transportation, and no carbon dioxide emissions [
8,
9]. At present, the most widely used hydrogen production method is fossil fuels, such as coal, oil, and other hydrocarbon reforming hydrogen production [
10,
11,
12,
13]. However, hydrogen produced by these methods generally leads to the emission of carbon oxides, which is not environmentally friendly. In addition, there are biological [
14] and electrocatalytic [
15] methods for hydrogen production. However, the immature development of biological hydrogen production technology is greatly limited by its high cost and low hydrogen production efficiency, which makes it impractical to produce hydrogen on a large scale. Therefore, it is necessary to develop highly efficient and stable hydrogen production procedures and highly active catalysts.
Indoor air quality is currently a concern for human society. Formaldehyde, a universal but important air pollutant, exists in various indoor environments, including houses, offices, and industries. The emission sources of formaldehyde are diverse, and long-term exposure can cause serious health problems. Therefore, this molecule has become a primary pollutant that needs to be eliminated first. Some regulations are creating new challenges, and various effective removal techniques have been developed so far. Adsorption of formaldehyde on activated carbon [
16,
17] or other adsorbents such as zeolite materials [
18,
19] with large surface areas and multistage pore structures is also proposed as an efficient way of eliminating formaldehyde. However, formaldehyde cannot be permanently eliminated and must undergo subsequent secondary degradation. Complete catalytic oxidation of formaldehyde is an attractive alternative to other proposed procedures. However, one of the products of complete oxidation of formaldehyde is CO
2, which is generally deemed as the chief culprit of global warming. Therefore, the development of new catalysts exhibiting high formaldehyde-oxidation catalytic activity and preferably free of CO
2 generation is highly appreciated.
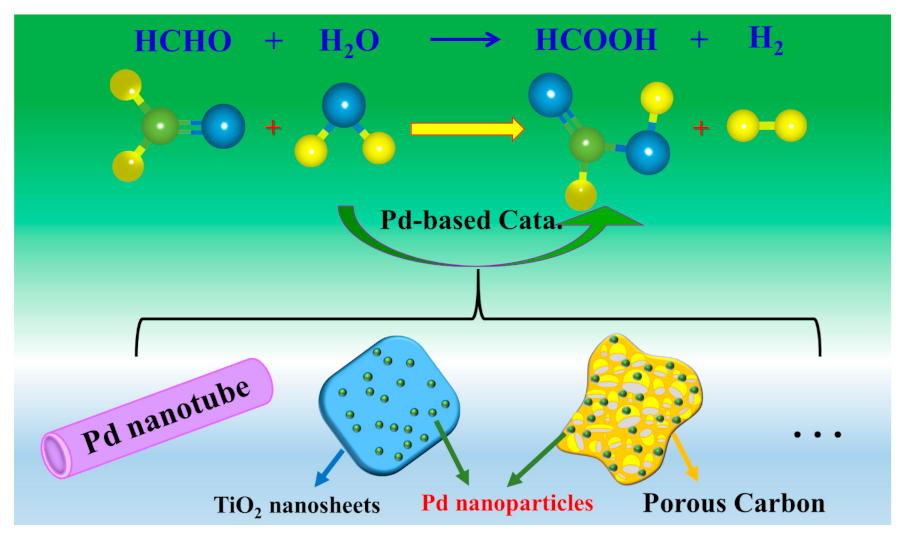
Earlier research on the Cannizzaro reaction indicated that formaldehyde was very likely to be an intermediate for the production of H
2 during the storage of alkaline nuclear waste [
20]. The experimental results suggested that one of the hydrogen atoms in hydrogen originated from formaldehyde and the other from water molecules. This typical process not only makes it possible to eliminate formaldehyde but also provides an alternative but effective way to produce hydrogen. However, this process requires a high concentration of alkaline medium (usually 18 M), and suffers from low H
2 production efficiency [
21]. Thereby, the harsh reaction conditions and low hydrogen production make its application impractical. A follow-up study by Hu et al. [
22] in 2014 showed that Pd nanotubes could serve as a highly efficient catalyst to inhibit the Cannizzaro reaction and facilitate hydrogen production from basic formaldehyde aqueous solution under room temperature. After optimizing the reaction conditions, the hydrogen production over as-prepared Pd nanotube could reach 170 mL g
−1min
−1 even under a lower alkaline concentration of 0.1 M. However, the high and fluctuating costs and the limited resources of noble metals limit their expensive use. Although pure Pd nanotubes [
22], Pd supported on TiO
2 (001) nanosheets [
23], 3D porous carbon [
24], and other supports [
25] have been proven effective for the oxidation of formaldehyde at low temperatures (as illustrated in
Figure 1), they usually require a large amount of noble metal loading, which greatly limits their further widespread applications. Therefore, the decrease of the noble-metals loading in an active component while maintaining their satisfactory catalytic activity is a key scientific issue.
The MAX phases are ternary transition metal carbide and/or nitride with a layered hexagonal crystal structure [
26,
27]. The unique structure endows them the dual properties of both metals and ceramics, that is, they are machinable and possess high electronic conductivities, are lightweight, and oxidation resistant [
28,
29]. Further studies by Ng et al. showed the potential of Ti
3AlC
2 as a catalyst in selective oxidation reactions, which was most likely derived from the non-stoichiometric oxide surface layer containing oxygen vacancies [
30].
To the best of our knowledge, no hydrogen production reactions from formaldehyde have been reported so far where Ti3AlC2 MAX phase was used as either a catalyst or support. More importantly, the fundamental chemical principles responsible for the supported Pd nanoparticle-mediated hydrogen production from a basic HCHO aqueous solution remain unclear. Herein, the use of Ti3AlC2 MAX phase as support for palladium nanoparticles was explored for the hydrogen generation from alkaline formaldehyde solution at room temperature. More specifically, the rates of hydrogen generation over Ti3AlC2/Pd with Pd loading of 3 wt% could be increased up to 291.6 mL min−1g−1, far exceeding that of its Pd nanoparticle counterpart. In addition, experimental parameters such as reaction temperature, NaOH concentrations, and formaldehyde concentration were systematically investigated to determine the effect on the hydrogen production rates. The prepared Ti3AlC2/Pd catalysts, as well as the catalytic formaldehyde oxidation process could act as a “two birds with one stone” effect, that is, they not only eliminate noxious formaldehyde but also generate clean hydrogen.
3. Results
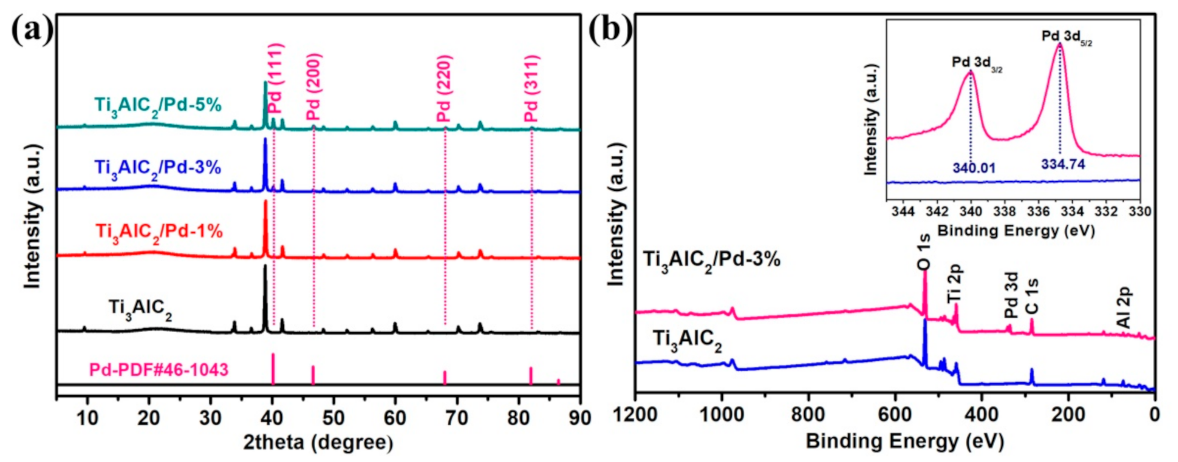
To confirm the composition of Ti
3AlC
2/Pd catalysts, XRD was performed, as shown in
Figure 2a. The characteristic diffractions of Ti
3AlC
2 appear at 2θ = 9.4°, 33.9° 38.8°, 41.6°, and 48.2°, corresponding to the (002), (101), (104), (105), and (107) planes of Ti
3AlC
2, respectively [
31]. For Ti
3AlC
2/Pd-1%, Ti
3AlC
2/Pd-3%, and Ti
3AlC
2/Pd-5% catalyst, the 2θ peaks at 40.2°, 46.7°, 67.9°, and 82.1° can be assigned to the (111), (200), (220), and (311) crystal planes of metallic Pd (JCPDS NO. 46-1043), respectively. These XRD results confirm that we have successfully synthesized Ti
3AlC
2/Pd composites catalysts. XPS characterization was further conducted to provide the chemical composition of prepared catalysts, and the corresponding result is shown in
Figure 2b. As for the pure Ti
3AlC
2, all the peaks of Ti, C, Al, and O elements (in which the O element comes from the adsorbed oxygen species) can be detected in the survey XPS spectra. In contrast, in addition to the elements of Ti, C, Al, and O, the XPS peak of Pd species also appears for the Ti
3AlC
2/Pd-3% sample, further indicating that Pd is successfully loaded on the Ti
3AlC
2. Moreover, further observation by the high-resolution XPS spectra of Pd 3d (inset of
Figure 2b) exhibits two peaks at 340.01 eV and 334.74 eV, which can be assigned to Pd 3d
3/2 and Pd 3d
5/2 of metallic Pd, respectively. The high-resolution XPS spectra of Ti 2p, C 1s, Al 2p, and Pd 3d are also provided, as shown in
Figure S1.
Figure S1a presents the Ti 2p XPS spectra of Ti
3AlC
2/Pd-1%, Ti
3AlC
2/Pd-3%, Ti
3AlC
2/Pd-5%, and Ti
3AlC
2/Pd. All the samples can be fitted with two categories of asymmetric Gaussian-Lorentzian curves representing the Ti 2p
3/2 (~454.18 eV) and Ti 2p
1/2 (~460.58 eV) spin-orbit of Ti-C component and Ti 2p
3/2 (~458.64 eV) and Ti 2p
1/2 (~464.47 eV) from TiO
2 impurities [
32,
33].
Figure S1b presents the C 1s XPS spectra of Ti
3AlC
2/Pd-1%, Ti
3AlC
2/Pd-3%, Ti
3AlC
2/Pd-5%, and Ti
3AlC
2. The peaks at 284.78 eV are from C-based impurities, while the peaks at 281.28 eV and 288.83 eV are the Ti-C components and contamination of COO groups [
34,
35]. As for Al 2p XPS, both the metallic Al and the Al
2O
3 compounds are observed, as illustrated in
Figure S1c. Specifically, the peaks at ~71.8 eV are the metallic Al components, while the peaks at ~74.1 eV are from Al
2O
3 impurities.
Figure S1d shows the XPS Pd 3d spectra of as-prepared catalysts. Two asymmetric peaks at ~340.02 and ~334.74 eV binding energy are observed for Ti
3AlC
2/Pd-1%, Ti
3AlC
2/Pd-3%, and Ti
3AlC
2/Pd-5%, which correspond, respectively, to Pd
0 3d
3/2 and Pd
0 3d
5/2 [
24,
36]. The N
2 adsorption/desorption isotherm curves of Ti
3AlC
2, Ti
3AlC
2/Pd-1%, Ti
3AlC
2/Pd-3%, and Ti
3AlC
2/Pd-5% exhibit typical type-IV isotherm with a H4 hysteresis loop (
Figure S2a). According to the Brunauer–Emmett–Teller (BET) method, the BET specific surface area (S
BET) is 1.3, 4.8, 2.6, and 5.7 m
2 g
−1 for Ti
3AlC
2, Ti
3AlC
2/Pd-1%, Ti
3AlC
2/Pd-3%, and Ti
3AlC
2/Pd-5%, respectively. These minor differences of S
BET might attribute to the local micro-nano structure differences of the samples or the instrument error.
Figure S2b exhibits the pore size distributions of as-obtained samples derived from the Barrett–Joyner–Halenda (BJH) method. All the samples presented mostly 2–10 nm pores, which indicates that these samples feature both the microporous and mesoporous structures. To overview the textural characteristics, the summary of surface areas (S
BET), pore volume (V
p), and average pore diameter (D
p) are given, as shown in
Table S1. Moreover, the total Pd contents determined by inductively coupled plasma mass spectrometry (ICP-MS) are also obtained, as shown in
Table S2. The actual loading of Pd for Ti
3AlC
2/Pd-1%, Ti
3AlC
2/Pd-3%, and Ti
3AlC
2/Pd-5% is 0.85 wt%, 2.80 wt%, and 4.88 wt%, which is almost consistent with the theoretical value of 1 wt%, 3 wt%, and 5 wt%, respectively.
The morphology of Ti
3AlC
2, Ti
3AlC
2/Pd-1%, Ti
3AlC
2/Pd-3%, and Ti
3AlC
2/Pd-5% samples were investigated by SEM, as shown in
Figure S3. It is important to note that the deposition of Pd here does not modify the Ti
3AlC
2 MAX phase structure in any way. As shown in
Figure S3a,b, Ti
3AlC
2 MAX phase exhibits a typical three-dimensional and layered microstructure with irregular edges. The 3D nanostructured morphology possesses a large surface-to-volume ratio, which provides more reactive sites to participate in the catalytic process. After loading with Pd nanoparticle, the morphology of Ti
3AlC
2 is well retained, as shown in
Figure S3c–h. Similar morphologies and structures, viz. thin sheets of Ti
3AlC
2, are observed for Ti
3AlC
2/Pd-1% (
Figure S3c,d), Ti
3AlC
2/Pd-3% (
Figure S3e,f), and Ti
3AlC
2/Pd-5% (
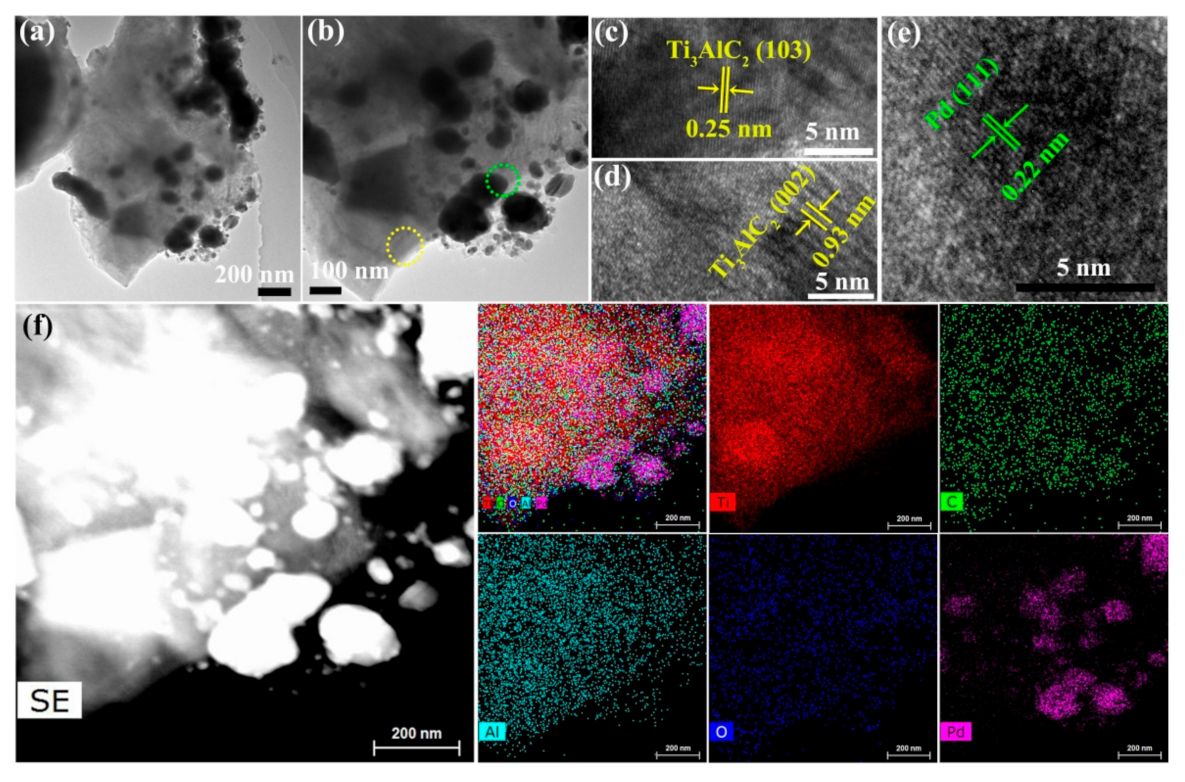
Figure S3g,h). The structure and morphology of Ti
3AlC
2/Pd-3% samples are further investigated by TEM, as shown in
Figure 3. As shown in
Figure 3a,b, Ti
3AlC
2/Pd-3% exhibits predominantly accordion-like and multilayer morphology, which is typical morphology of bulk Ti
3AlC
2 MAX phase. Moreover, some fragments of Pd nanoparticles with an average particle size of 50–180 nm are evenly distributed and embedded in the Ti
3AlC
2 matrix. High-resolution TEM (HRTEM) characterization was further carried out to get more structural information on Ti
3AlC
2/Pd. Clear lattice fringes with a pitch of 0.25 nm and 0.93 nm are observed, which is ascribed to the (103) and (002) plane of Ti
3AlC
2, respectively (
Figure 3c,d). On closer inspection of
Figure 3e, the interplanar distance of the wrapped nanoparticles is about 0.22 nm, which corresponds to the (111) plane of metallic palladium. EDX elemental mapping of Ti, C, Al, O, and Pd elements over Ti
3AlC
2/Pd-3%, shown in
Figure 3f, further validates the successful Pd load on the Ti
3AlC
2 support. The above results indicate that Pd nanoparticles have been successfully loaded on the Ti
3AlC
2 support.
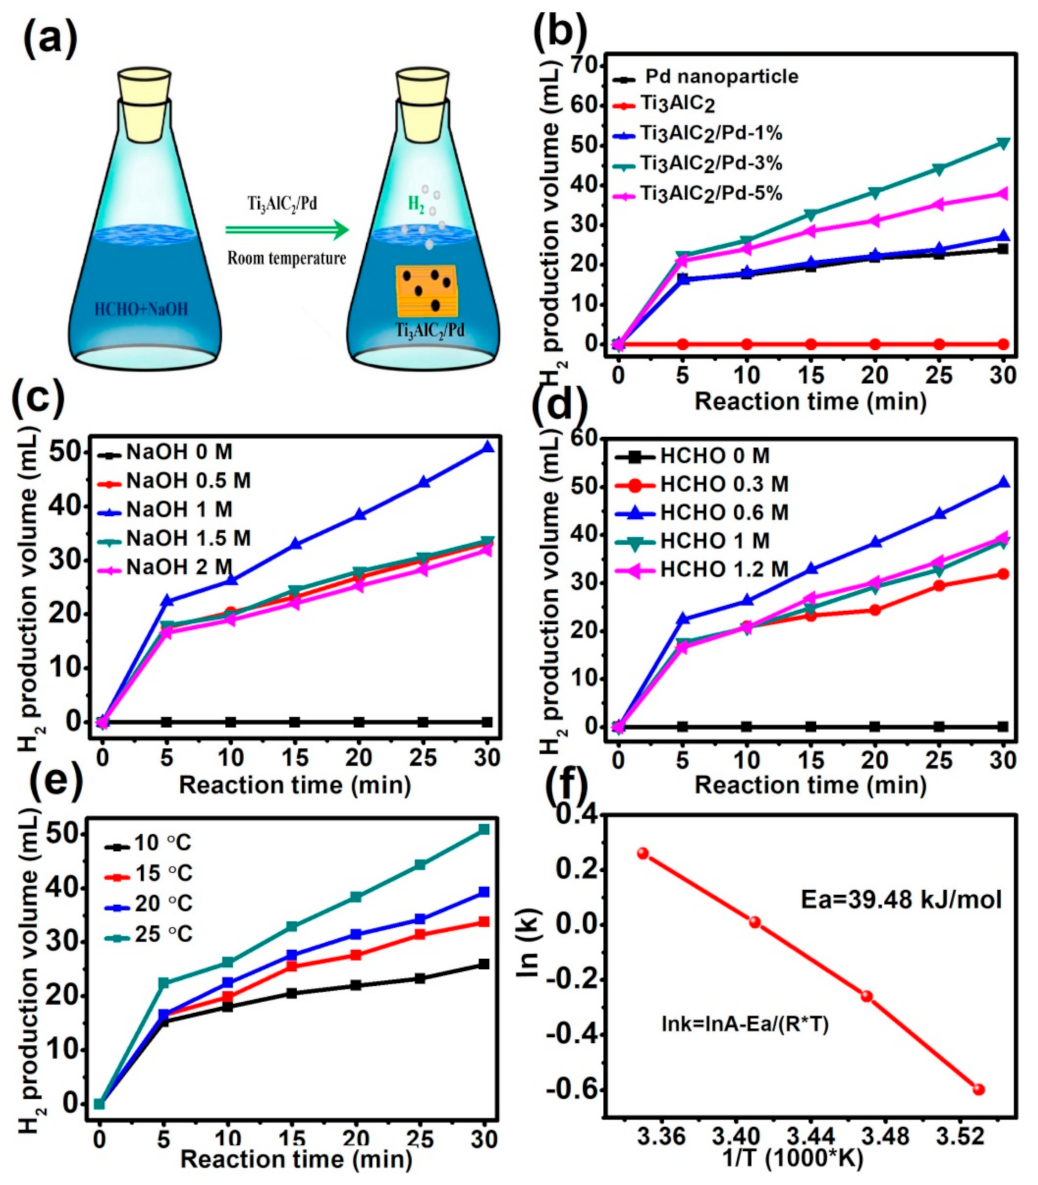
In addition, the hydrogen production behavior of as-prepared Ti
3AlC
2/Pd was examined in alkaline formaldehyde solution at room temperature, and the reaction process scheme is illustrated in
Figure 4a. As shown in
Figure 4b, no hydrogen is detected for pure Ti
3AlC
2 support, indicating that Ti
3AlC
2 is only used as supported material rather than a reactive catalyst for catalyzing formaldehyde to produce hydrogen. By contrast, when Ti
3AlC
2/Pd catalysts are introduced into the reaction system, the hydrogen production is triggered immediately without any induction period (after adding the catalyst, the hydrogen was quickly overflowed, as can be clearly observed in the Video S1 in Supporting Information). Compared with Ti
3AlC
2/Pd-1% and Ti
3AlC
2/Pd-5% catalysts, Ti
3AlC
2/Pd-3% achieves the maximum hydrogen production after 30 min of reaction and is far higher than that of its Pd nanoparticle counterpart (typical TEM image and Pd size distribution histogram is shown in
Figure S4a,b). After reaction for 30 min, 23.9, 30.1, 38.2, and 50.8 mL of hydrogen are produced over Pd nanoparticles, Ti
3AlC
2/Pd-1%, Ti
3AlC
2/Pd-5%, and Ti
3AlC
2/Pd-3%, respectively. The above results show that the greater the loaded mass of Pd supported on the Ti
3AlC
2/Pd does not mean a better hydrogen production performance. That is, only the catalyst with optimal Pd loading contents can exhibit the most excellent hydrogen production. On the one hand, excessive Pd nanoparticles might agglomerate heavily and lose active sites for hydrogen production, which hinders and reduces the utilization efficiency of surface Pd atoms. In addition, under our current experimental conditions, no carbon monoxide, carbon dioxide, or other gaseous products have been detected so far in all these catalytic processes.
To optimize the reaction conditions and obtain the maximum hydrogen production, the effects of NaOH concentration, HCHO concentration, and reaction temperature on the hydrogen production performance are systematically modulated and compared. As shown in
Figure 4c, no hydrogen can be detected in the absence of NaOH. In contrast, quantitative hydrogen would be generated immediately when a certain concentration of NaOH is added to the reaction system. This indicates that alkaline conditions are indispensable for the catalytic hydrogen production process. In detail, as the NaOH concentration increases from 0.5 to 1.0 mol L
−1, the hydrogen production during 30 min increases from 30.1 mL to 51.2 mL. However, further increased NaOH concentration to 1.5 mol L
−1 and 2 mol L
−1 leads to a gradually decreased hydrogen production of 33.5 and 31.7 mL, respectively. It was reported that when allowed to react with excess base, there was a competitive reaction of hydrogen production-Cannizzaro reaction (formaldehyde generates the Cannizzaro intermediate and subsequently forms methanol and formate) [
20,
37]. The Cannizzaro reaction may consume some of the formaldehyde molecules, blocking hydrogen production.
Figure 4d shows the effect of HCHO concentration on the catalytic generation of H
2 at 1 M NaOH. When the concentration of HCHO increases from 0.3 M to 0.6 M, the hydrogen production increases from 31.9 to 50.8 mL. However, the hydrogen production decreases upon increasing HCHO concentration to 1 M and 1.2 M. This can be well explained by the fact that when the concentration of formaldehyde is too high, the Cannizzaro reaction would occur simultaneously. Some of the formaldehyde molecules are transformed into methanol and formic acid. Therefore, these results clearly show that, to achieve a high hydrogen production rate, the concentration of HCHO and NaOH should be strictly controlled and at the optimal concentration.
The effect of the reaction temperature in the range of 10 °C to 25 °C on the rate of H
2 production is also investigated, as shown in
Figure 4e. It can be found that the hydrogen production rate increases gradually upon increasing reaction temperature. To be more specific, when the temperature increases from 10 °C to 25 °C, the hydrogen production after reaction of 30 min increases rapidly from 25.9 to 33.7, 39.2, and 50.8 mL, demonstrating that increasing the reaction temperature could promote the hydrogen production reaction. In addition, it should be noted that the initial H
2 production rate after a reaction of 5 min reaches the highest. This result indicates that the rate of hydrogen production can be controlled by modulating the concentration of reactant formaldehyde. At the beginning of the reaction, the concentration of formaldehyde is the highest, and the reactions rate is the fastest. As the reaction time increases, the fewer reactants (that is, the lower concentration of formaldehyde), the lower the H
2 production rate. More specifically, the rates of H
2 generation at initial 5 min increase rapidly from 191.7 to 290.9 mL·min
−1g
−1 when the reaction temperature is increased from 10 to 25 °C, indicating that higher reaction temperature is in favor for the hydrogen production rection. Moreover, it shows that the amount of hydrogen produced is linearly dependent on the reaction time from 5–30 min at each reaction temperature, which means that such a hydrogen production reaction can be treated as a zero-order reaction. Thus, to fully understand the underlying principles of hydrogen production enhancement of Ti
3AlC
2/Pd-3% catalyst, the rate constant (lnk) is plotted as a function of reaction temperature (T), as is shown in
Figure 4f. Accordingly, the reaction rate formula can be expressed as follows:
where k is the rate constant, A is the pre-exponential factor, Ea is the apparent activation energy, R is the gas constant, and T is the reaction temperature. According to the slope of
Figure 3f, the activation energy of Ti
3AlC
2/Pd-3% catalyzed hydrogen production of formaldehyde is determined to be 39.48 kJ mol
−1, which is considerably lower than 65 kJ mol
−1 for hydrogen production without catalyst [
38]. The results show that Ti
3AlC
2/Pd-3% catalyst reduces the activation energy of hydrogen production from alkaline solutions of formaldehyde. To sum up, the compound Ti
3AlC
2/Pd-3% catalyst can effectively catalyze formaldehyde aqueous solution to produce hydrogen at room temperature.
In order to verify the synergistic effect between the Pd nanoparticles and the Ti
3AlC
2 support on the hydrogen production performance from formaldehyde, we provide the morphology and hydrogen production performance of the uncalcined Ti
3AlC
2/Pd-3% sample (denoted as Ti
3AlC
2/Pd-3%-uc). As shown in
Figure S5, Ti
3AlC
2/Pd-3%-uc exhibits a densely layer-stacked structure with micrometer size. As shown in
Figure S6, only the characteristic XRD peaks of Ti
3AlC
2 phase can be found in Ti
3AlC
2/Pd-3%-uc, which may be due to its low Pd loading (3 wt%) and small Pd size and better Pd dispersion. Moreover, hydrogen production over Ti
3AlC
2/Pd-3%-uc is measured, as shown in
Figure S7. The Ti
3AlC
2/Pd-3%-uc sample produces only 32.8 mL of hydrogen within 30 min, which is slightly higher than that of its pure Pd nanoparticle counterpart. In contrast, the calcined sample of Ti
3AlC
2/Pd-3% can generate 52.9 mL of hydrogen under the same reaction conditions, which is nearly 1.61 times that of the Ti
3AlC
2/Pd-3%-uc. Based on the results, we speculate that the calcination may improve the interaction between Pd and Ti
3AlC
2 support, and the strong metal-support interaction (SMSI) is possibly beneficial to boost mass transport processes at the interface and enhance the catalytic performance. Although the metal-support interaction is enhanced after calcination, compared to the uncalcined sample (TEM image of
Figure S8 shows that the average size of Pd nanoparticles for Ti
3AlC
2/Pd-3%-uc is 20–30 nm), the Pd nanoparticles loaded on Ti
3AlC
2 support are obviously agglomerated and the particle size becomes larger, which is not conducive to the full utilization of the Pd active material. Therefore, further reducing the size of Pd nanoparticles, enhancing the metal-support interaction and ultimately improving the hydrogen production rate from alkaline formaldehyde solution are indispensable in the future research.
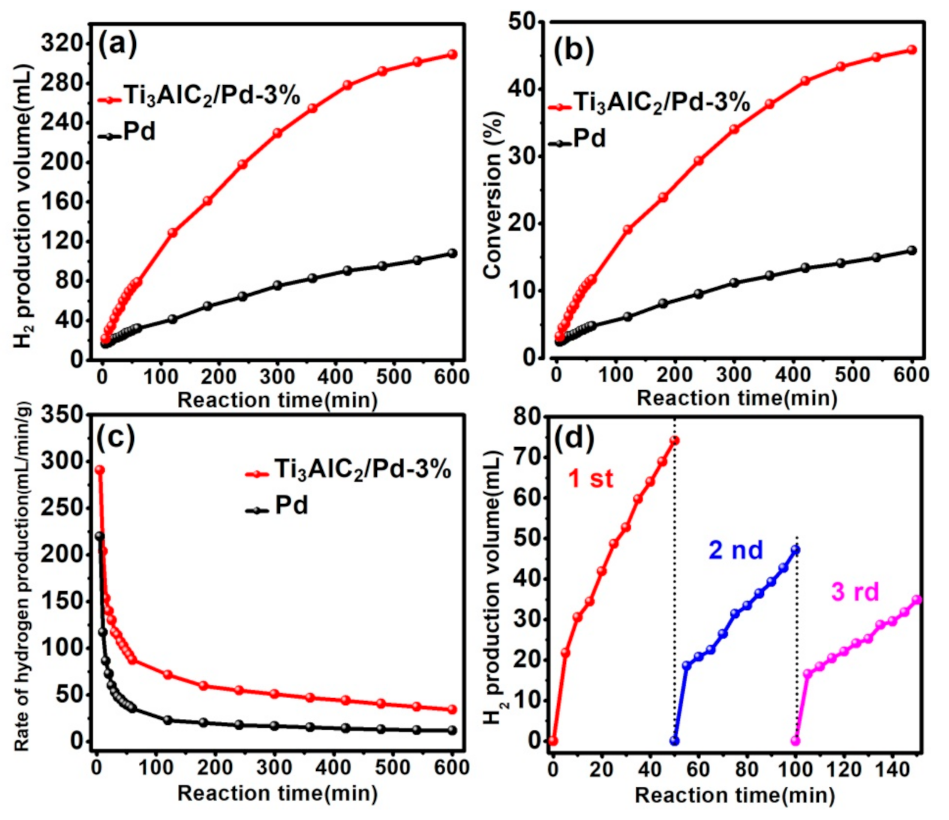
To meet the needs of practical application, the catalyst with long-term stability and excellent recycling performance are highly expected. Thereby, the hydrogen production over Ti
3AlC
2/Pd-3% and Pd nanoparticles catalysts react in a prolonged 10 h is compared, as shown in
Figure 5a. Generally, Ti
3AlC
2/Pd-3% catalyst possesses excellent hydrogen production performance with the reaction time extending, obtaining 318.9 mL of H
2 after reaction for 10 h. In contrast, the yield of H
2 over the Pd nanoparticles catalyst after 10 h is only 103.5 mL. Moreover, the HCHO conversion over Ti
3AlC
2/Pd-3% after reaction for 6 h is also established, as shown in
Figure 5b. We observe that Ti
3AlC
2/Pd-3% catalyst shows higher HCHO conversion (47.8%) at room temperature (25 °C) compared to that of Pd nanoparticles catalyst (15.2%). The rate of hydrogen production over 6 h is also calculated, as shown in
Figure 5c. The initial hydrogen production rate for Ti
3AlC
2/Pd-3% and Pd nanoparticle catalyst is 291.6 and 218.8 mL·min
−1g
−1. After reaction for 50 min, the hydrogen production rate for Ti
3AlC
2/Pd-3% is 103.7 mL·min
−1g
−1, which is 2.92 times that of its pure Pd nanoparticle counterpart (35.5 mL·min
−1g
−1). To check the recyclability of catalyst (Ti
3AlC
2/Pd-3%, herein, the 3 wt% of Pd content was not determined after the three reaction cycles), the solid catalyst is filtered off, washed thoroughly with deionized water and dried at ambient temperature. The Ti
3AlC
2/Pd-3% catalyst is reused up to evaluate the hydrogen production during three successive runs. Unfortunately, as exhibited in
Figure 5d, the as-prepared Ti
3AlC
2/Pd-3% exhibits poor hydrogen production recyclability, which may be associated with weak metal-support interaction that promotes the leaching of active species during the catalysis reaction. Thus, the structural and morphological features of Ti
3AlC
2/Pd-3% after three cycles are examined. XRD patterns (
Figure S9) of reused Ti
3AlC
2/Pd-3% exhibit the characteristic diffraction peaks of both Ti
3AlC
2 and Pd species. However, the morphological features of Ti
3AlC
2/Pd-3% have changed somewhat. As revealed by the TEM image in
Figure S10, the palladium nanoparticles are no longer uniformly distributed on the Ti
3AlC
2/Pd-3%, and there is obvious palladium nanoparticles agglomeration. The bad recyclability of hydrogen production is thus most probably caused by the relatively weak metal-support interaction resulted from larger Pd nanoparticles and heavy agglomeration, which is often invoked to be critical in the catalytic reaction. As for the improvement in the chemoselectivity, the possible explanations of both theoretically and experimentally by other studies are as follows: (i) Pd transforms into a more stable adsorption structure through electronic effects, and the adsorbed molecules interact with the metal surface in a complex manner, which leads to changes in the H
2 activation mechanism [
39]. (ii) Through geometric effects, the in situ reduction of Pd with larger size and agglomeration decreases the number of adjacent adsorption sites [
40]. Reducing the size of Pd nanoparticles (to prepare Pd single atoms or clusters) and enhancing the metal-support interaction (optimizing the preparation method of the catalyst, regulating the micro-nano structure of the support) are feasible approaches to address the weak cycling performance, which need to be strengthened for future work. However, more work and evidence should be given to better understand what is occurring as a function of the time of cycling in our system.
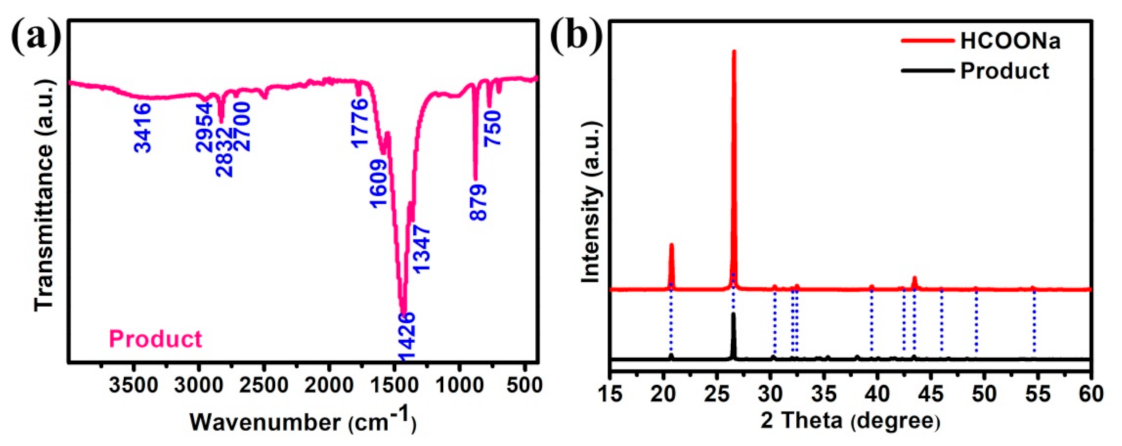
Except for the hydrogen detected in the gas phase, the intermediates that existed in the aqueous solution after formaldehyde oxidation catalyzed by Ti
3AlC
2/Pd-3% have also been evaluated using fourier transform infrared spectroscopy (FTIR) to investigate the reaction mechanism. As shown in
Figure 6a, three bands at 2700, 2832, and 2954 cm
−1 are typically characteristic of formate species, corresponding to the C-H stretching vibration, ν(C-H), symmetric and asymmetric stretching vibrational modes of the OCO moiety (i.e., ν
s(OCO) and ν
as(OCO), respectively) [
41]. The bands at 1609 cm
−1 and 1347 cm
−1 are characteristic modes of monodentate species, which corresponding to the ν
as(OCO) and ν
s(OCO) [
42]. Molecularly adsorbed HCHO molecules have also been detected, with characteristic IR bands of the ν(CO) mode at 1776 cm
−1 [
43,
44]. Moreover, the O-H stretching vibration ν(OH) in formate species with the wide and strong bands is observed at 1426 cm
−1. The two bands at 879 and 750 cm
−1 are characteristics of C-O bending vibration (δ(C-O)). Based on the FTIR results, it is concluded that the additional main products in the aqueous solution of formaldehyde catalyzed by Ti
3AlC
2/Pd-3% are formate, that is, sodium formate. In addition, the obtained products are further analyzed by XRD (
Figure 6b), and the main diffraction peaks can be well assigned to and matched with pure HCOONa, which is well in accordance with the FTIR results and reported literature [
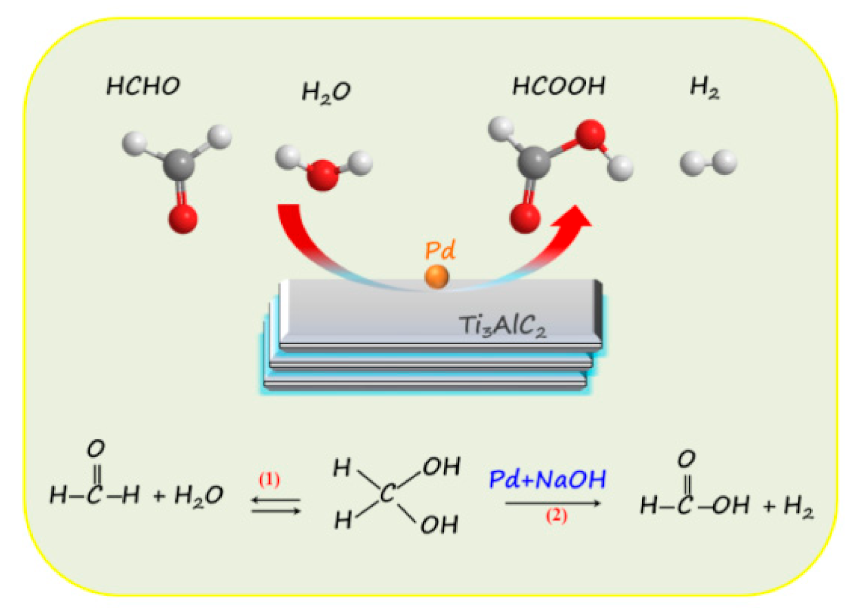
22]. Based on these results, we propose a possible reaction pathway for the formation of H
2 from catalyzing oxidation of formaldehyde, as shown in
Scheme 1. In this reaction system preceded at room temperature and at low concentrations of formaldehyde, one molar of formaldehyde and one molar H
2O is catalyzed by the Ti
3AlC
2/Pd to generate one molar of HCOOH and one molar of H
2 in alkaline solution. More specifically, formaldehyde in water can be almost completely hydrated to form methylene glycol (in Equation (1) of
Scheme 1) [
20,
37]. Subsequently, under alkaline conditions, methylene glycol catalyzed by Pd nanoparticles produces hydrogen and formic acid. However, the source of the hydrogen atoms of H
2 produced by this reaction is not yet fully understood. Early results suggested that one hydrogen atom originates from formaldehyde and the other from water molecular in the formation of H
2 [
20]. For the by-products of formic acid and sodium formate produced in this experiment, no strategies have been proposed so far to deal with them. The removal of formic acid or sodium formate produced in this experiment in an efficient and inexpensive way is still an open topic that needs to be strengthened for future work.


