
Effect of Aluminum Doping Ratios on the Properties of Aluminum-Doped Zinc Oxide Films Deposited by Mist Chemical Vapor Deposition Method Applying for Photocatalysis


Abstract
:1. Introduction
2. Experiments
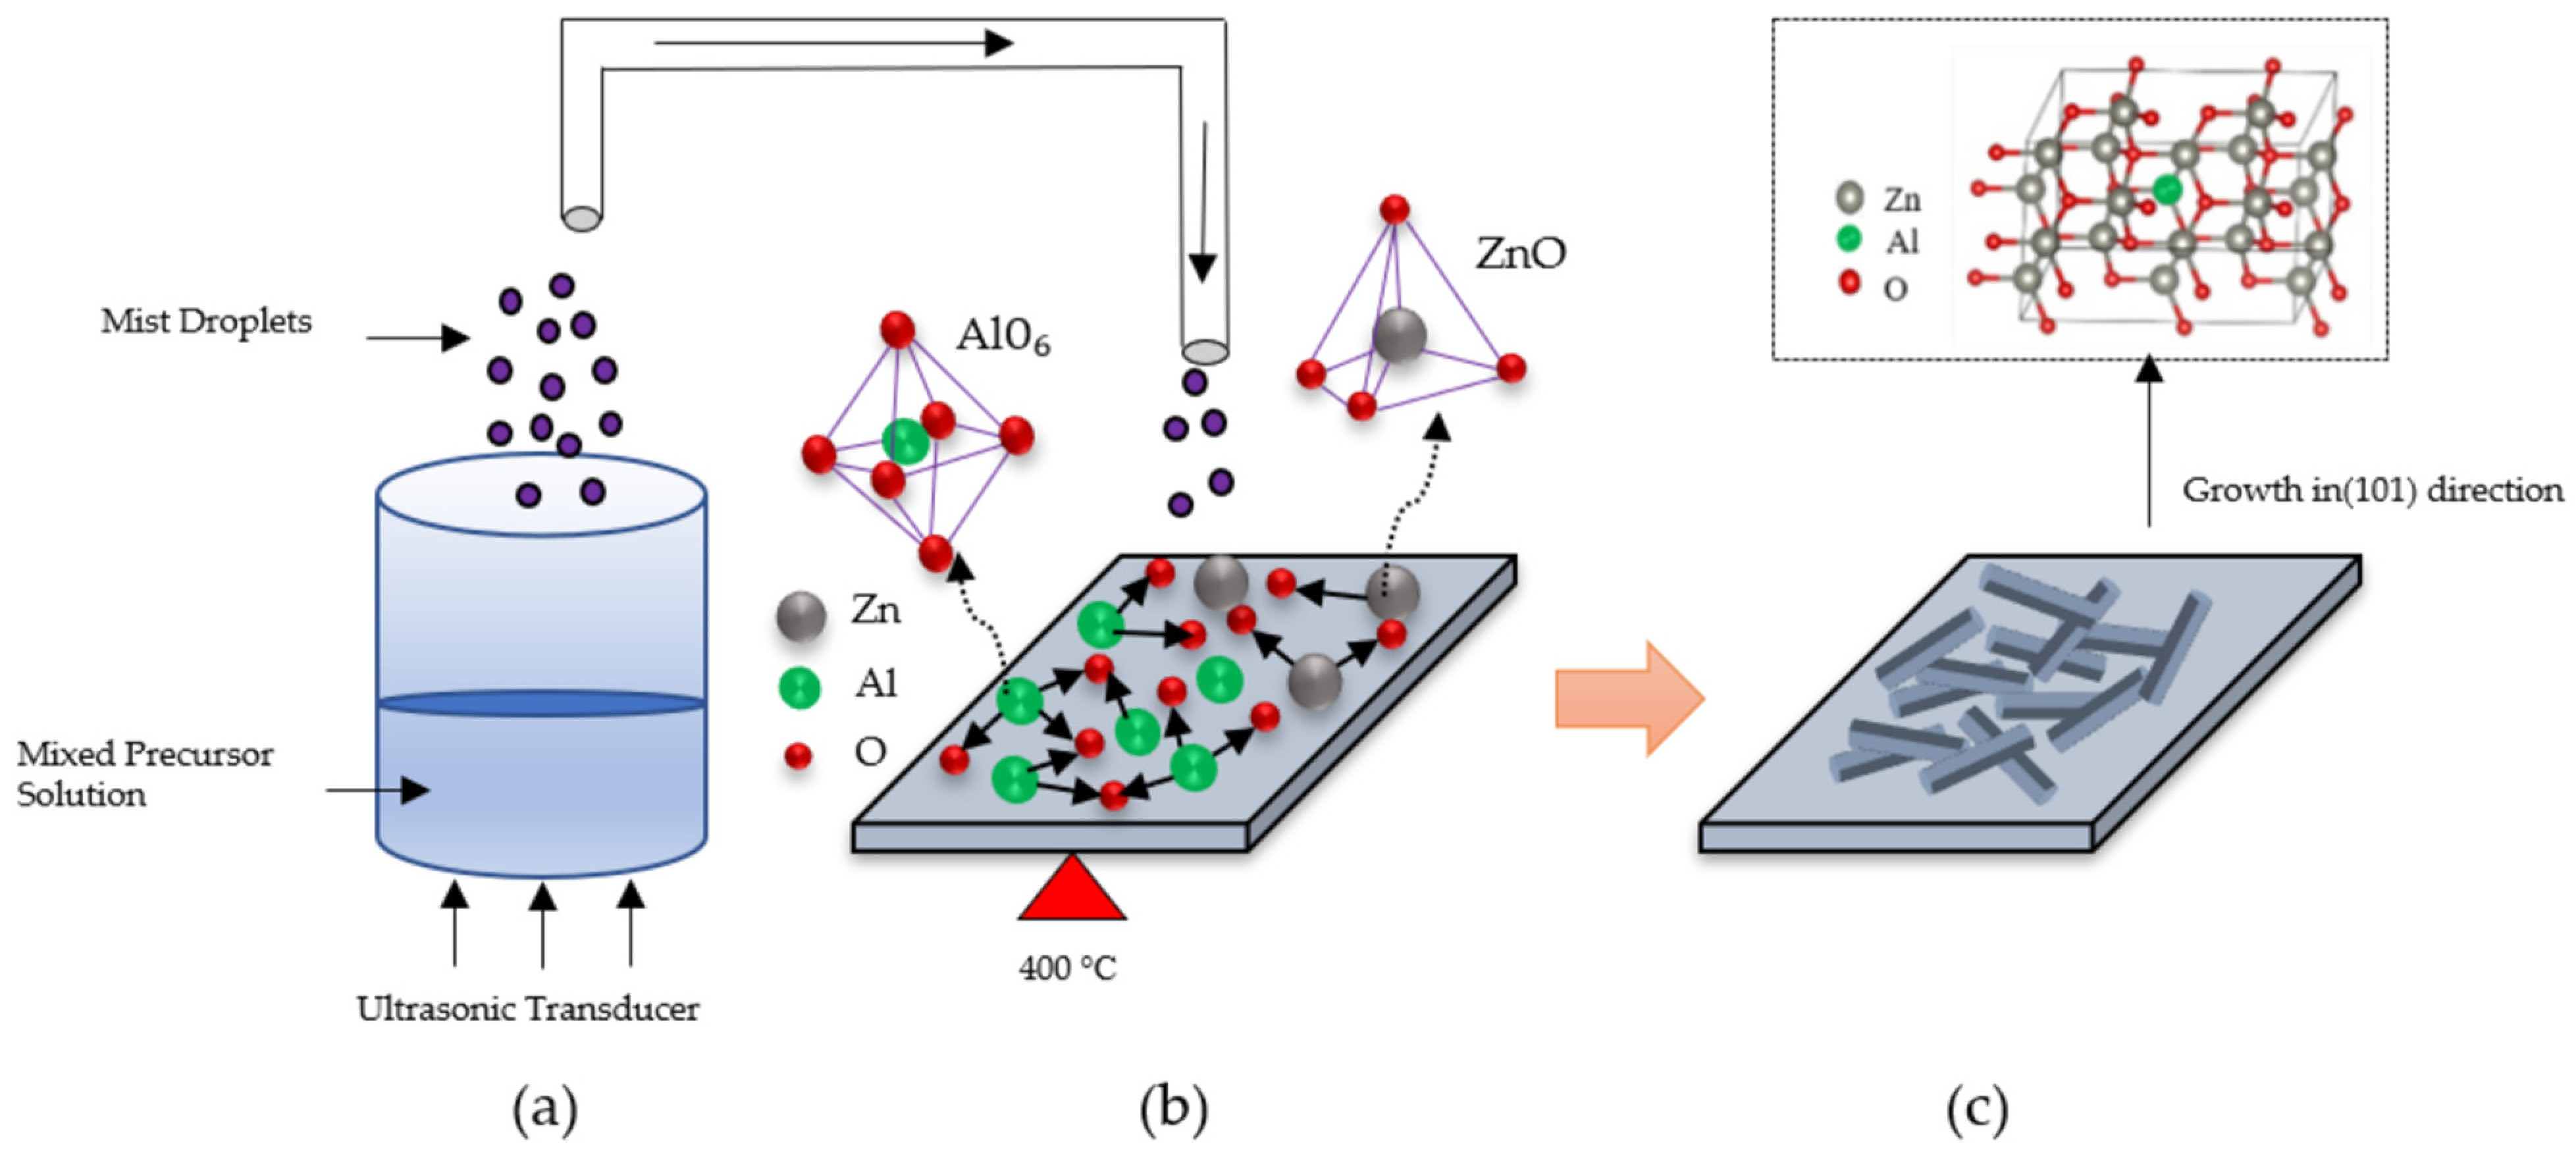
2.1. Deposition of AZO Films
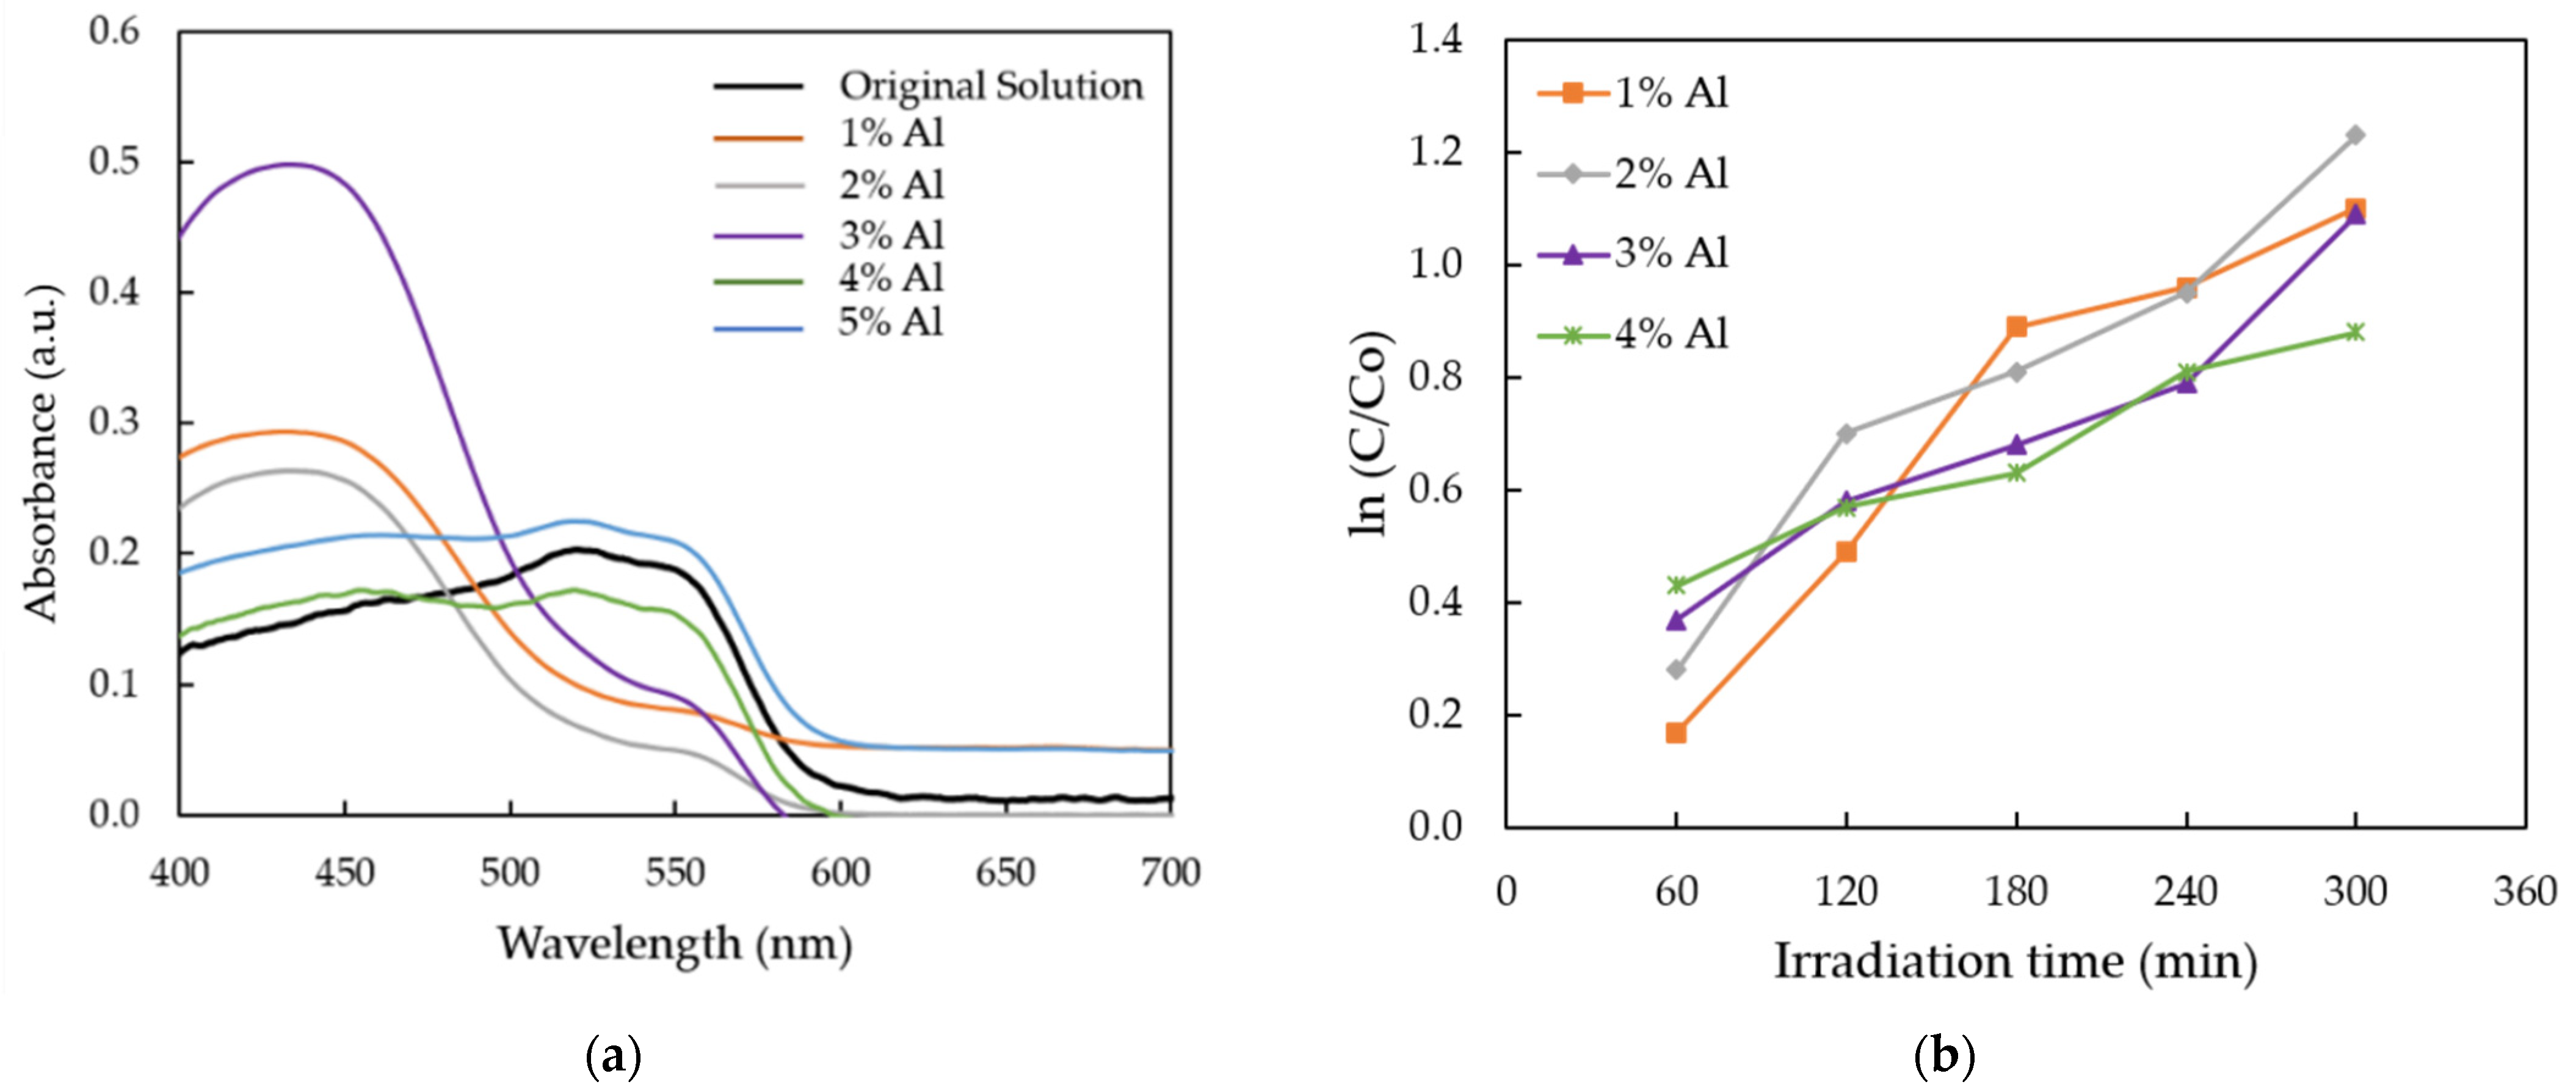
2.2. Photodegradation Process
2.3. Characterization
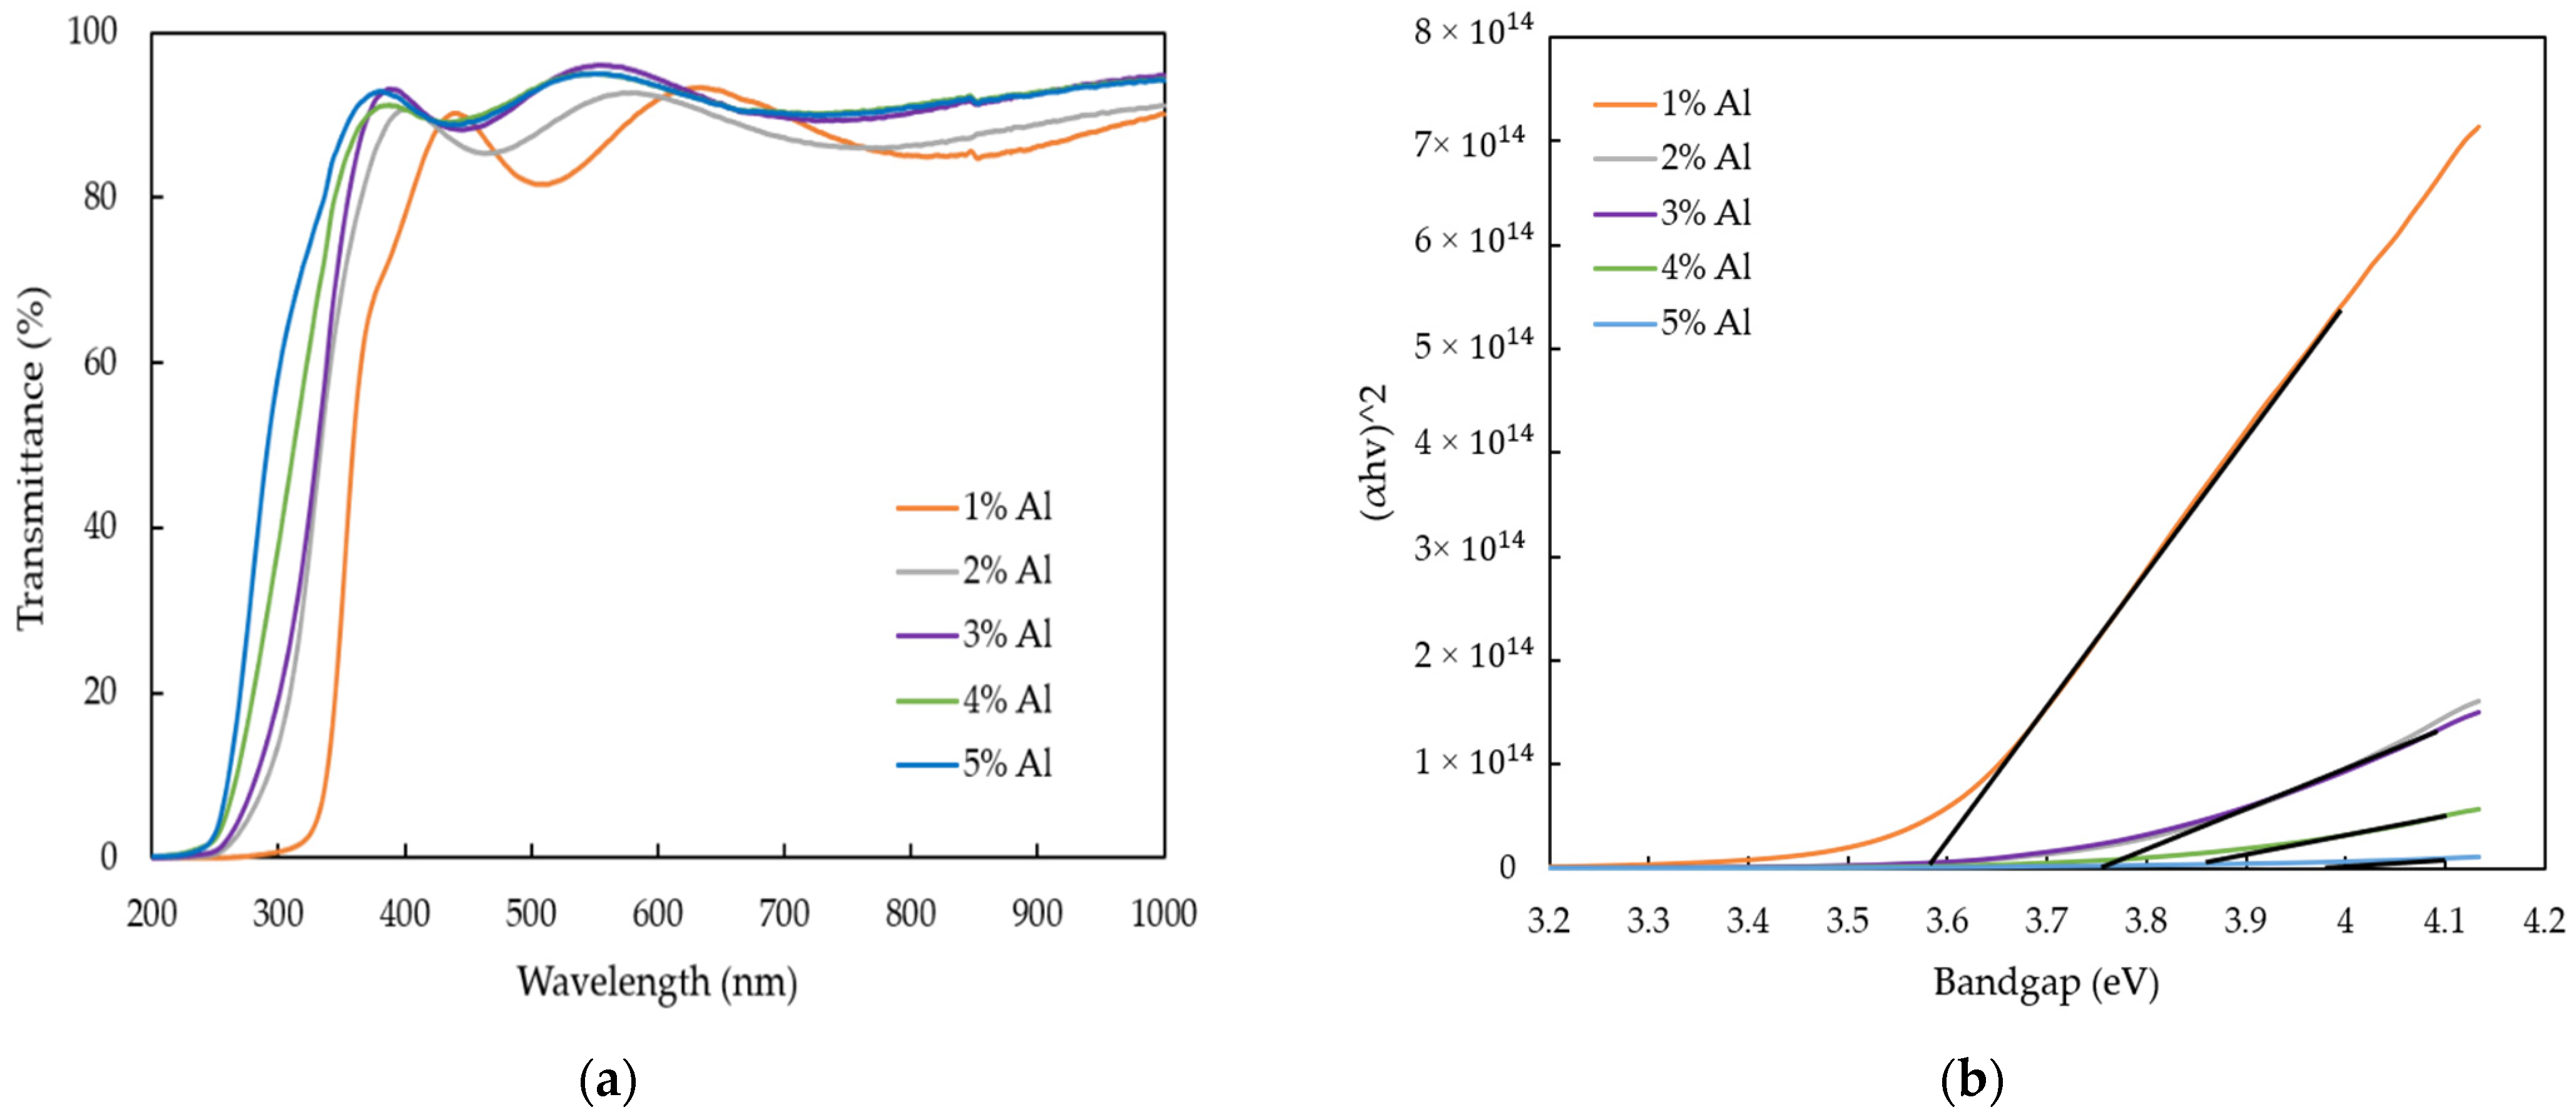
3. Results and Discussion
4. Conclusions
Author Contributions
Funding
Institutional Review Board Statement
Informed Consent Statement
Data Availability Statement
Conflicts of Interest
References
- Hashimoto, K.; Irie, H.; Fujishima, A. TiO2 photocatalysis: A historical overview and future prospects. Jpn. J. Appl. Phys. 2005, 44, 8269–8285. [Google Scholar] [CrossRef]
- Ibhadon, A.O.; Fitzpatrick, P. Heterogeneous photocatalysis: Recent advances and applications. Catalysts 2013, 3, 189–218. [Google Scholar] [CrossRef] [Green Version]
- Teoh, W.Y.; Scott, J.A.; Amal, R. Progress in heterogenous photocatalysis: From classical radical chemistry to engineering nanomaterials and solar reactors. J. Phys. Chem. Lett. 2012, 3, 629–639. [Google Scholar] [CrossRef]
- Bhatkhande, D.S.; Pangarkar, V.G.; Beenackers, A.A.C.M. Photocatalytic degradation for environmental applications—A review. J. Chem. Technol. Biotechnol. 2001, 77, 102–116. [Google Scholar] [CrossRef]
- Minero, C.; Pelizzatti, E.; Sega, M.; Friberg, S.E.; Sjoblom, J. The role of humid substances in photocatalytic degradation of water contaminants. J. Dispers. Sci. Technol. 1999, 20, 643–661. [Google Scholar] [CrossRef]
- Pirkanniemi, K.; Sillanpa, M. Heterogeneous water phase catalysis as an environmental application: A review. Chemosphere 2002, 48, 1047–1060. [Google Scholar] [CrossRef]
- Maeda, K.; Domen, K. Photocatalytic water splitting: Recent progress and future challenges. J. Phys. Chem. Lett. 2010, 1, 2655–2661. [Google Scholar] [CrossRef]
- Chen, D.; Ray, A.K. Removal of toxic metal ions from wastewater by semiconductor photocatalysis. Chem. Eng. Sci. 2001, 56, 1561–1570. [Google Scholar] [CrossRef]
- Mills, A.; Lehunte, S.L. An overview of semiconductor photocatalysis. J. Photochem. Photobiol. A Chem. 1997, 108, 1–35. [Google Scholar] [CrossRef]
- Gerischer, H. Electrochemical behavior of semiconductors under illumination. J. Electrochem. Soc. 1966, 113, 1174–1182. [Google Scholar] [CrossRef]
- Mills, A.; O’Rourke, C.; Moore, K. Powder semiconductor photocatalysis in aqueous solution: An overview of kinetics-based reaction mechanisms. J. Photochem. Photobiol. A 2015, 310, 66–105. [Google Scholar] [CrossRef]
- Kanemoto, M.; Shiragami, T.; Pac, C.; Yanagida, S. Semiconductor photocatalysis. 13. Effective photoreduction of carbon dioxide catalyzed by ZnS quantum crystallites with low density of surface defects. J. Phys. Chem. 1992, 96, 3521–3526. [Google Scholar] [CrossRef]
- Li, X.; Wen, J.; Low, J.; Fang, Y.; Yu, J. Design and fabrication of semiconductor photocatalyst for photocatalytic reduction of CO2 to solar fuel. Sci. China Mater. 2014, 57, 70–100. [Google Scholar] [CrossRef] [Green Version]
- Franco, P.; Sacco, O.; De Marco, I.; Vaiano, V. Zinc oxide nanoparticles obtained by supercritical antisolvent precipitation for the photocatalytic degradation of crystal violet dye. Catalysts 2019, 9, 346. [Google Scholar] [CrossRef] [Green Version]
- Vanheusden, K.; Warren, W.L.; Seager, C.H.; Tallant, D.R.; Voigt, J.A.; Gnade, B.E. Mechanisms behind green photoluminescence in ZnO phosphor powders. J. Appl. Phys. 1996, 79, 7983–7990. [Google Scholar] [CrossRef]
- Baratto, C.; Comini, E.; Ferroni, M.; Faglia, G.; Sberveglieri, G. Plasma-induced enhancement of UV photoluminescence in ZnO nanowires. CrystEngComm 2013, 15, 7981–7986. [Google Scholar] [CrossRef]
- Seo, Y.S.; Oh, S.G. Controlling the recombination of electron-hole pairs by changing the shape of ZnO nanorods via sol-gel method using water and their enhanced photocatalytic properties. Korean J. Chem. Eng. 2019, 36, 2118–2124. [Google Scholar] [CrossRef]
- Gaspar, D.; Pereira, L.; Gehrke, K.; Galler, B.; Fortunato, E.; Martins, R. High mobility hydrogenated zinc oxide thin films. Sol. Energy Mater. Sol. Cells 2017, 163, 255–262. [Google Scholar] [CrossRef]
- Meyer, B.K.; Alves, H.; Hofmann, D.M.; Kriegseis, W.; Forster, D.; Bertram, F.; Christen, J.; Hoffmann, A.; Straßburg, M.; Dworzak, M. Bound exciton and donor–acceptor pair recombinations in ZnO. Phys. Status Solidi (b) 2004, 241, 231–260. [Google Scholar] [CrossRef]
- Mukhopadhyay, S.; Das, P.P.; Maity, S.; Ghosh, P.; Devi, P.S. Solution grown ZnO rods: Synthesis, characterization and defect mediated photocatalytic activity. Appl. Catal. B Environ. 2015, 165, 128–138. [Google Scholar] [CrossRef]
- He, J.; Zhang, Y.; Guo, Y.; Rhodes, G.; Yeom, J.; Li, H.; Zhang, W. Photocatalytic degradation of cephalexin by ZnO nanowires under simulated sunlight: Kinetics, influencing factors, and mechanisms. Environ. Int. 2019, 132, 105105. [Google Scholar] [CrossRef]
- Ong, C.B.; Ng, L.Y.; Mohammad, A.W. A review of ZnO nanoparticles as solar photocatalysts: Synthesis, mechanisms and applications. Renew. Sustain. Energy Rev. 2018, 81, 536–551. [Google Scholar] [CrossRef]
- Luevano-Hipolito, E.; Martinez-de la Cruz, A.; Cuellar, E.L. Performance of ZnO synthesized by sol-gel as photocatalyst in the photooxidation reaction of NO. Environ. Sci. Pollut. Res. 2016, 24, 6361–6371. [Google Scholar] [CrossRef] [PubMed]
- Ebrahimi, R.; Hossienzadeh, K.; Maleki, A.; Ghanbari, R.; Rezaee, R.; Safari, M.; Shahmoradi, B.; Daraei, H.; Jafari, A.; Yetilmezsoy, K.; et al. Effects of doping zinc oxide nanoparticles with transition metals (Ag, Cu, Mn) on photocatalytic degradation of Direct Blue 15 dye under UV and visible light irradiation. J. Environ. Health Sci. Eng. 2019, 17, 479–492. [Google Scholar] [CrossRef] [PubMed]
- Yu, F.; Wang, B.; Hu, H.; Li, H.; Song, T.; Xu, B.; He, L.; Duan, H.; Wang, S. The photocatalytic properties of Al-doped ZnO nanotubes decorated with Cu2O nanoparticles. Phys. Status Solidi (a) 2019, 216, 1900386. [Google Scholar] [CrossRef]
- Ahammed, N.; Hassan, M.S.; Hassan, M. Effects of aluminum (Al) incorporation on structural, optical and thermal properties of ZnO nanoparticles. Mater. Sci. 2018, 36, 419–426. [Google Scholar] [CrossRef] [Green Version]
- Mahdavi, R.; Talesh, S.S.A. Sol-gel synthesis, structural and enhanced photocatalytic performance of Al doped ZnO nanoparticles. Adv. Powder Technol. 2017, 28, 1418–1425. [Google Scholar] [CrossRef]
- Lai, F.I.; Yang, J.F.; Hsu, Y.C.; Kuo, S.Y. Location-optoelectronic property correlation in ZnO: Al thin film by RF magnetron sputtering and its photovoltaic application. Materials 2021, 14, 6313. [Google Scholar] [CrossRef]
- Tang, P.; Li, B.; Feng, L. The optical and electrical properties of ZnO: Al thin films deposited at low temperatures by RF magnetron sputtering. Ceram. Int. 2018, 44, 4154–4157. [Google Scholar] [CrossRef]
- Jeong, J.-K.; Yun, H.-J.; Yang, S.-D.; Eom, K.-Y.; Chea, S.-W.; Park, J.-H.; Lee, H.-D.; Lee, G.-W. Investigation of atomic-layerdeposited Al-doped ZnO film for AZO/ZnO double-stacked active layer thin-film transistor application. Thin Solid Film. 2017, 638, 89–95. [Google Scholar] [CrossRef]
- Kaneva, N.; Stambolova, I.; Blaskov, V.; Dimitriev, Y.; Bojinova, A.; Dushkin, C. A comparative study on the photocatalytic efficiency of ZnO thin films prepared by spray pyrolysis and sol–gel method. Surf. Coat. Technol. 2011, 207, 5–10. [Google Scholar] [CrossRef]
- Wang, Y.; Zhang, X.; Bai, L.; Huang, Q.; Wei, C.; Zhao, Y. Effective light trapping in thin film silicon solar cells from textured Al doped ZnO substrates with broad surface feature distributions. Appl. Phys. Lett. 2012, 100, 263508. [Google Scholar] [CrossRef]
- Jeong, S.H.; Park, G.C.; Choi, J.H.; Lee, C.M.; Lee, S.M.; Seo, T.Y.; Choi, D.H.; Jung, S.B.; Lim, J.H.; Joo, J. Effect of Al incorporation on morphology and electrical conductivity of ZnO nanorods prepared using hydrothermal method. J. Nanosci. Nanotechnol. 2016, 16, 11272–11276. [Google Scholar] [CrossRef]
- Rutthongjan, P.; Liu, L.; Nishi, M.; Sakamoto, M.; Sato, S.; Pradeep, E.K.C.; Dang, G.T.; Kawaharamura, T. Composition control of Zn1−xMgxO thin films grown using mist chemical vapor deposition. J. Appl. Phys. 2019, 58, 035503–035512. [Google Scholar] [CrossRef]
- Liu, L.; Suwa, Y.; Sato, S.; Nakasone, Y.; Nishi, M.; Dang, G.T.; Pradeep, E.K.C.; Kawaharamura, T. Study on fabrication of conductive antimony doped tin oxide thin films (SnOx:Sb) by 3rd generation mist chemical vapor deposition. Jpn. J. Appl. Phys. 2019, 58, 025502–025509. [Google Scholar] [CrossRef]
- Kawaharamura, T. Physics on development of open-air atmospheric pressure thin film fabrication technique using mist droplets: Control of precursor flow. Jpn. J. Appl. Phys. 2014, 53, 05FF08. [Google Scholar] [CrossRef]
- Li, X.; Li, C.; Kawaharamura, T.; Wang, D.; Nitta, N.; Furuta, M.; Furuta, H.; Hatta, A. Fabrication of zinc oxide nanostructures by mist chemical vapor deposition. Trans. Mater. Res. Soc. Jpn. 2014, 39, 161–164. [Google Scholar] [CrossRef] [Green Version]
- Zhang, Q.; Li, C. Pure anatase phase titanium dioxide films prepared by mist chemical vapor deposition. Nanomaterials 2018, 8, 827. [Google Scholar] [CrossRef] [PubMed] [Green Version]
- Zhang, Q.; Li, C. Effect of substrates on structural properties of pure anatase phase titanium dioxide thin films prepared by mist chemical vapor deposition. ECS J. Solid State Sci. Technol. 2018, 7, P654–P659. [Google Scholar] [CrossRef]
- Rao, T.P.; Santhoshkumar, M.C. Highly oriented (1 0 0) ZnO thin films by spray pyrolysis. Appl. Surf. Sci. 2009, 255, 7212–7221. [Google Scholar]
- Patterson, A.L. The Scherrer Formula for X-Ray Particle Size Determination. Phys. Rev. 1939, 56, 978–982. [Google Scholar] [CrossRef]
- Kawaharamura, T.; Uchida, T.; Sanada, M.; Furuta, M. Growth and electrical properties of AlOx grown by mist chemical vapor deposition. AIP Adv. 2013, 3, 032135–032145. [Google Scholar]
- Ramya, M.; Nideep, T.K.; Nampoori, V.P.N.; Kailasnath, M. Solvent assisted evolution and growth mechanism of zero to three dimensional ZnO nanostructures for dye sensitized solar cell applications. Sci. Rep. 2021, 11, 6159–6173. [Google Scholar] [CrossRef] [PubMed]
- Tauc, J. Optical properties and electronic structure of amorphous Ge and Si. Mater. Res. Bull. 1968, 3, 37–46. [Google Scholar] [CrossRef]
- Langmuir, I. The constitution and fundamental properties of solids and liquids. Part I. Solids. J. Am. Chem. Soc. 1916, 38, 2221–2295. [Google Scholar] [CrossRef] [Green Version]
- Kim, S.B.; Hong, S.C. Kinetic study for photocatalytic degradation of volatile organic compounds in air using thin film TiO2 photocatalyst. Appl. Catal. B Environ. 2002, 35, 305–315. [Google Scholar] [CrossRef]
- Loghambal, S.; Catherine, A.J.A.; Subash, S.V. Analysis of langmuir-hinshelwood kinetics model for photocatalytic degradation of aqueous direct blue 71 through analytical expression. Int. J. Math. Appl. 2018, 6, 903–913. [Google Scholar]
- Golshan, M.; Zare, M.; Goudarzi, G.; Abtahi, M.; Babaei, A.A. Fe3O4@hap-enhanced photocatalytic degradation of acid red 73 in aqueous suspension: Optimization, kinetic, and mechanism studies. Mater. Res. Bull. 2017, 91, 59–67. [Google Scholar] [CrossRef]


| Deposition Parameter | Condition |
|---|---|
| Solute | Zinc acetate, Aluminum acetylacetonate |
| Solvent | Methanol, H2O |
| Concentration (mol/L) | 0.04 |
| Al doping ratio (wt %) | 1, 2, 3, 4, 5 |
| Deposition temperature (°C) | 400 |
| Carrier gas, flow rate (L/min) | 2.5 |
| Dilution gas, flow rate (L/min) | 4.5 |
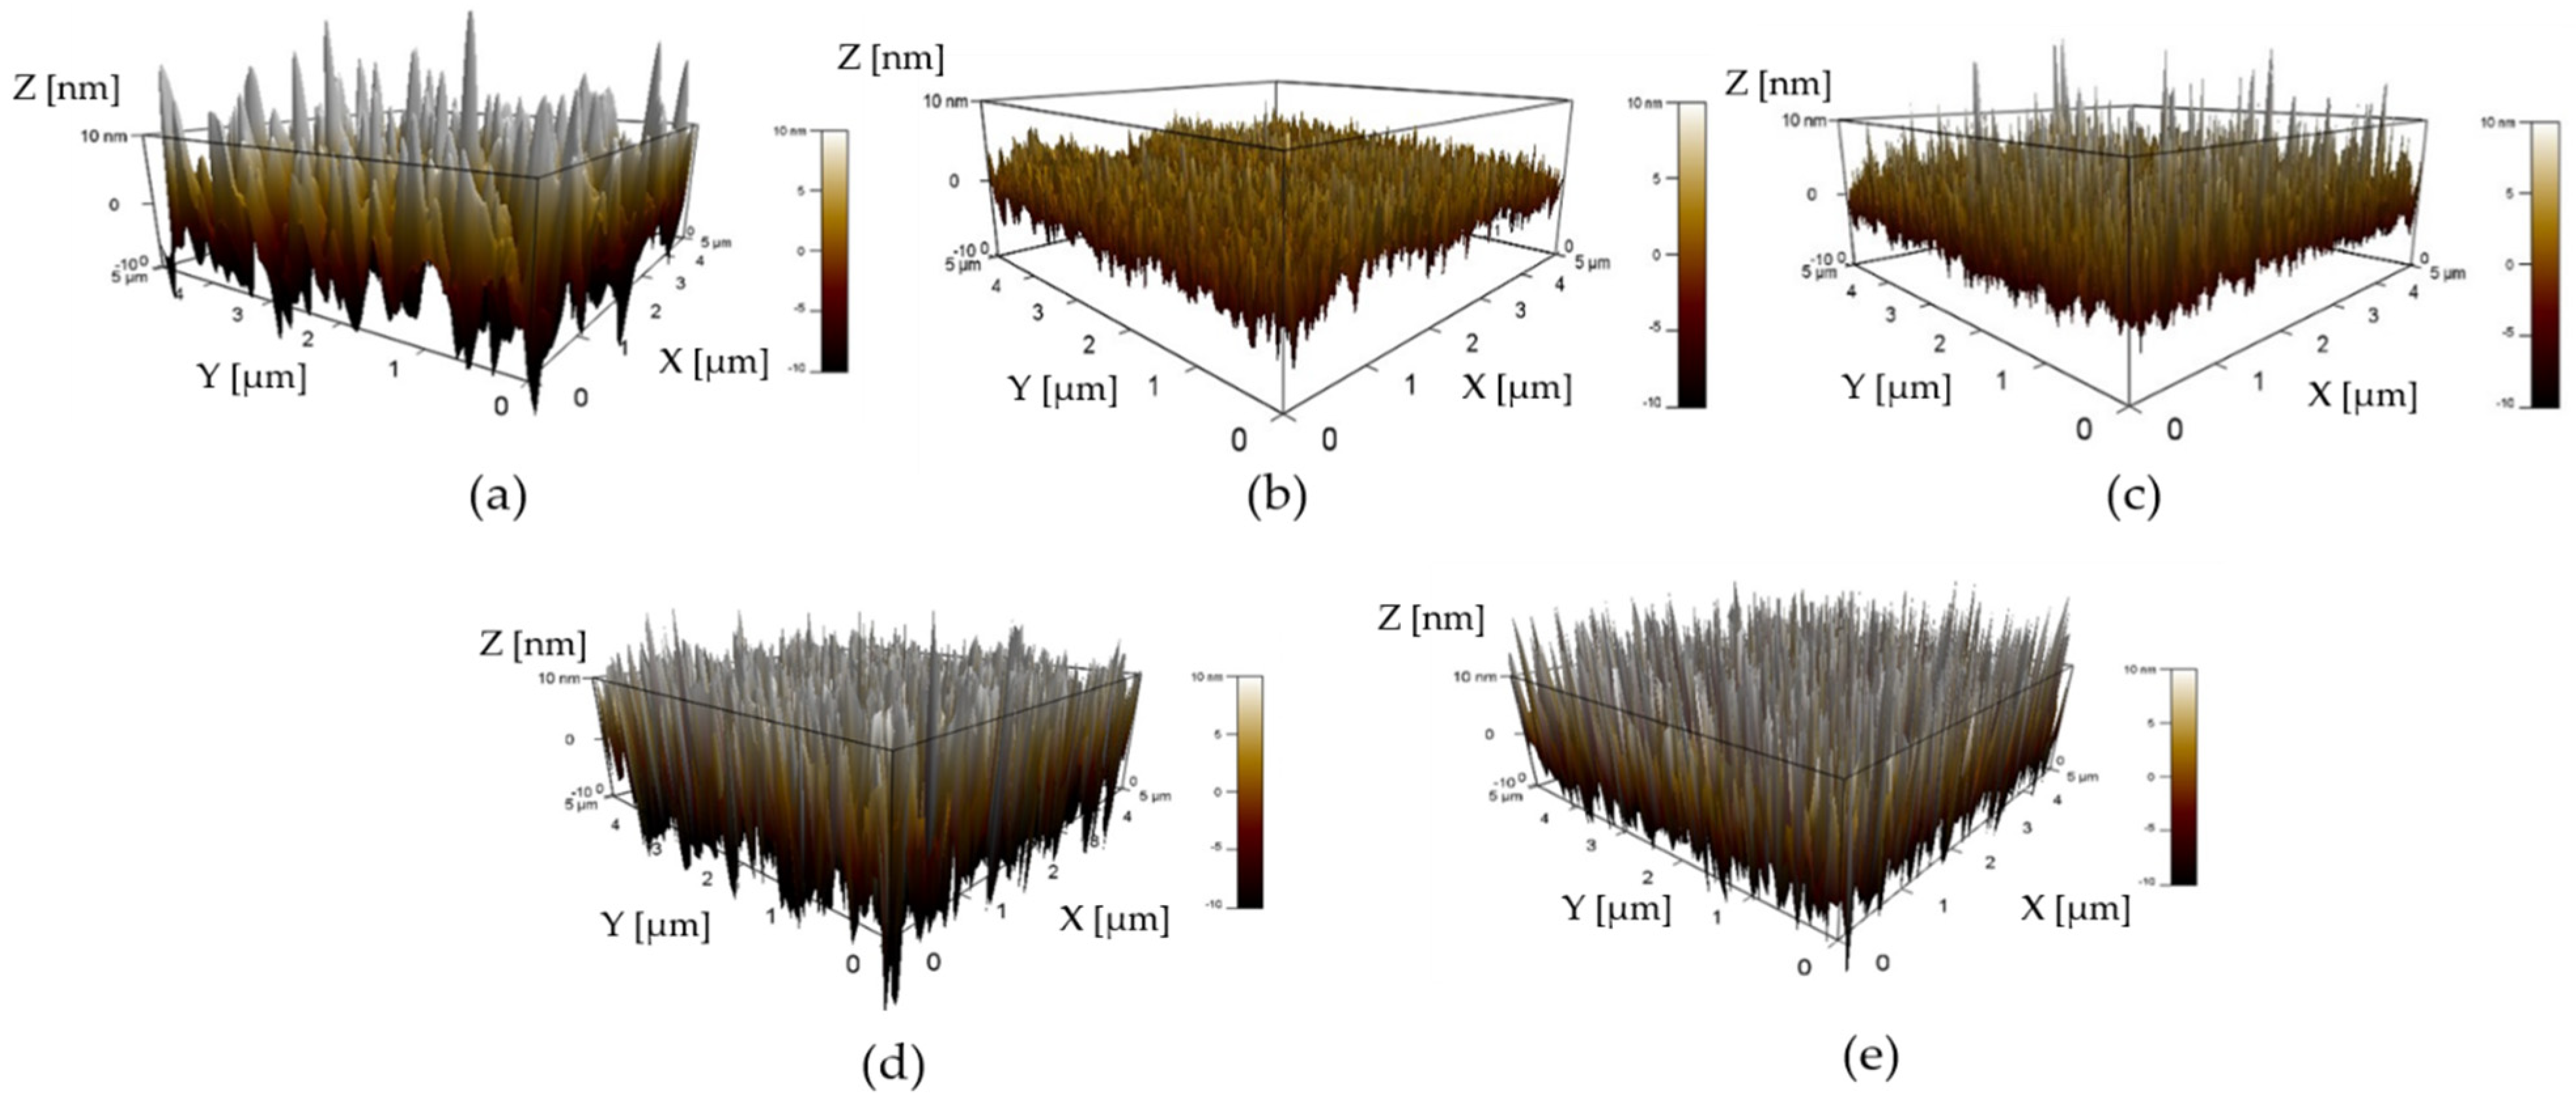
| Al Doping Ratio (wt %) | RMS Roughness (nm) |
|---|---|
| 1 | 6.4 |
| 2 | 3.7 |
| 3 | 4.6 |
| 4 | 8.8 |
| 5 | 9.7 |
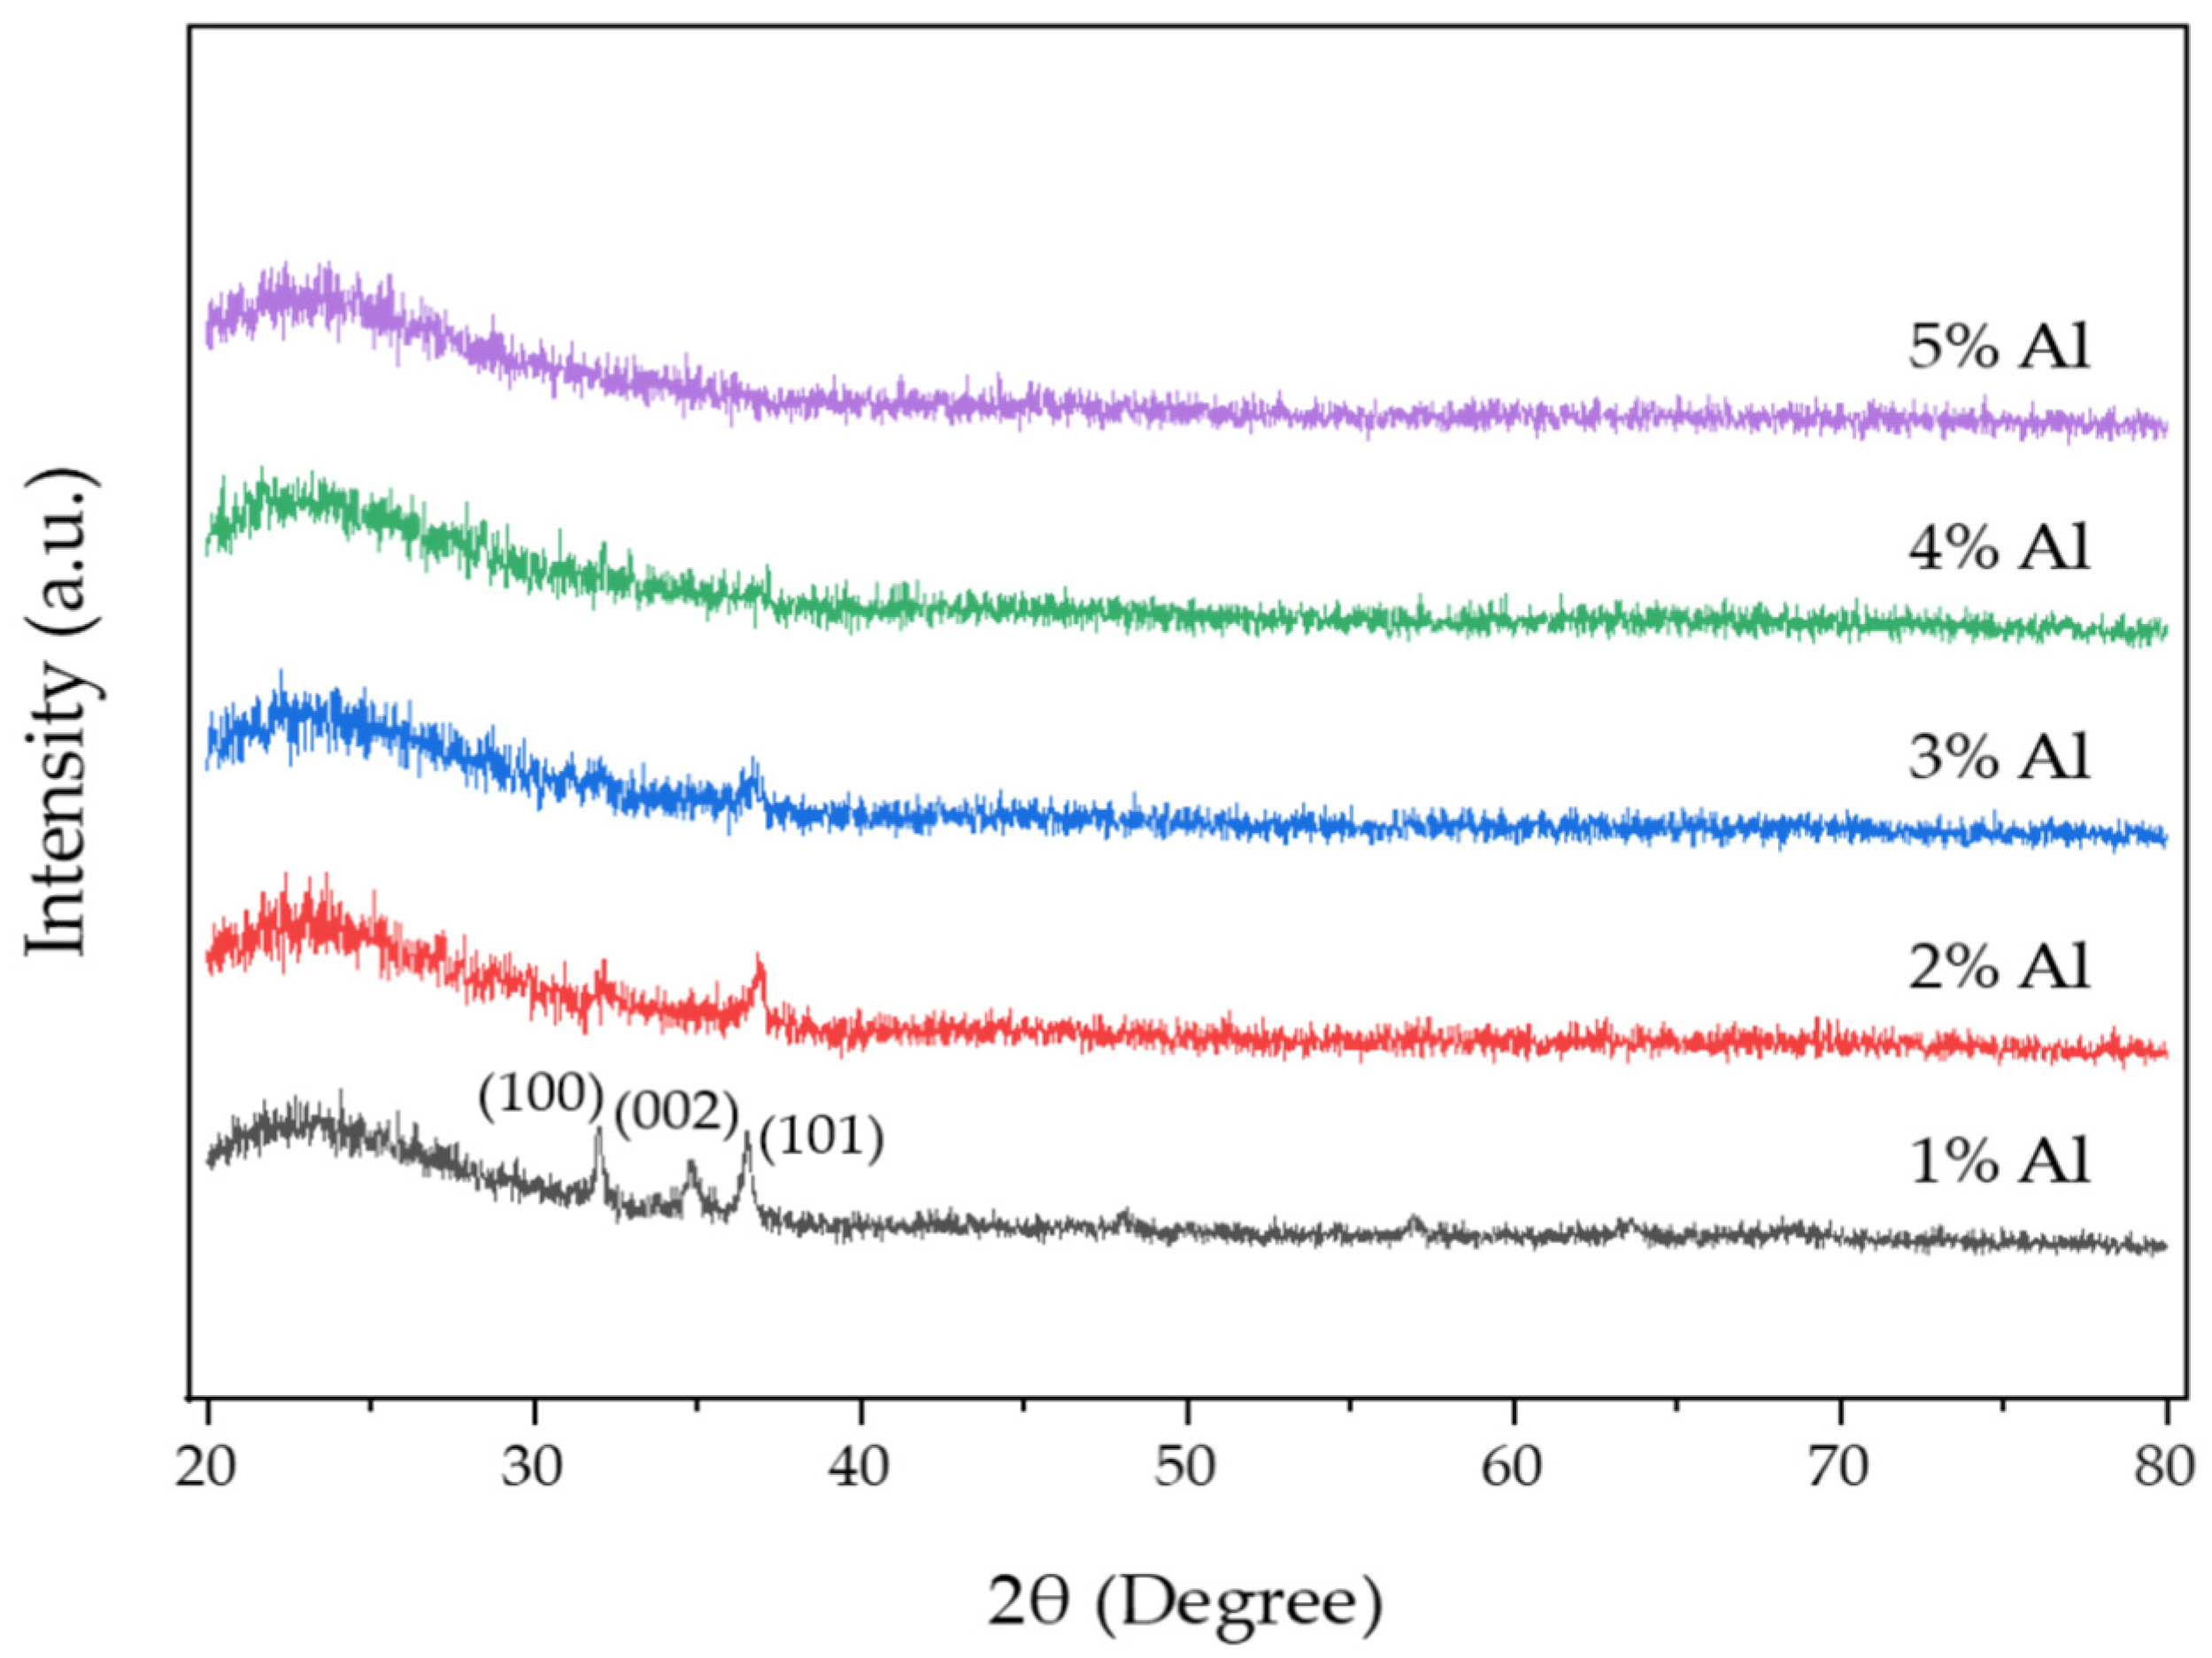
| Al Doping Ratio (wt %) | TC (100) | TC (002) | TC (101) |
|---|---|---|---|
| 1 | 2.785 | 1.542 | 3 |
| 2 | 0.126 | - | 0.732 |
| 3 | 0.117 | - | 0.654 |
Publisher’s Note: MDPI stays neutral with regard to jurisdictional claims in published maps and institutional affiliations. |
© 2022 by the authors. Licensee MDPI, Basel, Switzerland. This article is an open access article distributed under the terms and conditions of the Creative Commons Attribution (CC BY) license (https://creativecommons.org/licenses/by/4.0/).
Share and Cite
Wai, H.S.; Li, C. Effect of Aluminum Doping Ratios on the Properties of Aluminum-Doped Zinc Oxide Films Deposited by Mist Chemical Vapor Deposition Method Applying for Photocatalysis. Nanomaterials 2022, 12, 195. https://doi.org/10.3390/nano12020195
Wai HS, Li C. Effect of Aluminum Doping Ratios on the Properties of Aluminum-Doped Zinc Oxide Films Deposited by Mist Chemical Vapor Deposition Method Applying for Photocatalysis. Nanomaterials. 2022; 12(2):195. https://doi.org/10.3390/nano12020195
Chicago/Turabian StyleWai, Htet Su, and Chaoyang Li. 2022. "Effect of Aluminum Doping Ratios on the Properties of Aluminum-Doped Zinc Oxide Films Deposited by Mist Chemical Vapor Deposition Method Applying for Photocatalysis" Nanomaterials 12, no. 2: 195. https://doi.org/10.3390/nano12020195
APA StyleWai, H. S., & Li, C. (2022). Effect of Aluminum Doping Ratios on the Properties of Aluminum-Doped Zinc Oxide Films Deposited by Mist Chemical Vapor Deposition Method Applying for Photocatalysis. Nanomaterials, 12(2), 195. https://doi.org/10.3390/nano12020195