Abstract
Aliovalent-doped metal oxide nanocrystals exhibiting localized surface plasmons (LSPRs) are applied in systems that require reflection/scattering/absorption in infrared and optical transparency in visible. Indium tin oxide (ITO) is currently leading the field, but indium resources are known to be very restricted. Antimony-doped tin oxide (ATO) is a cheap candidate to substitute the ITO, but it exhibits less advantageous electronic properties and limited control of the LSPRs. To date, LSPR tuning in ATO NCs has been achieved electrochemically and by aliovalent doping, with a significant decrease in doping efficiency with an increasing doping level. Here, we synthesize plasmonic ATO nanocrystals (NCs) via a solvothermal route and demonstrate ligand exchange to tune the LSPR energies. Attachment of ligands acting as Lewis acids and bases results in LSPR peak shifts with a doping efficiency overcoming those by aliovalent doping. Thus, this strategy is of potential interest for plasmon implementations, which are of potential interest for infrared upconversion, smart glazing, heat absorbers, or thermal barriers.
1. Introduction
For many decades, localized surface plasmon resonances (LSPRs) were predominantly attributed to metal nanoparticles (NPs), wherein the free electron concentration is high enough to resonantly interact with electromagnetic radiation in visible and UV [1]. Nanocrystals (NCs) fabricated from more recently invented degenerate semiconductors widen the plasmon oscillations’ frequency range to extend into the near- and mid-infrared region [2,3], meeting demands in biology, medicine, electronics, and renewable energy. Among semiconductor LSPR materials, transparent conducting oxides (TCOs) are used in energy applications, i.e., as hydrogen evolution catalysts, solar cell sensitizers, in batteries, and supercapacitors, [4,5]. Those TCO NCs can be classified into two categories, depending on the strategies of how to provide high carrier concentrations, namely by self- and by aliovalent doping. The former exploits oxygen vacancies for doping. These materials are characterized by a lack of NCs’ stability in ambient conditions and by limited plasmon tuning ranges. The latter requires more complicated chemistry, but overcomes the self-doped NCs in their prolonged resistance against oxidation and more precise plasmon control. To date, the most well-known aliovalent-doped indium tin oxide (ITO) plasmonic NCs are widely used in commercial applications where low electrical resistivity and high absorbance of ‘waste’ IR energy are required, e.g., UV/Vis transparent glazing thermal heaters and deicers [6] and smart windows [7]. ITO plasmonic NCs are vital in solar energy harvesting, effectively utilizing two portions of solar spectra energies beyond visible (c.a. 1400–1800 and 2000–2500 nm). In hybrid devices, the coincidence of those bands with NCs’ LSPR contributes to the overall device efficiency by sub-bandgap absorbance in photovoltaic thermal module concentrators [8]. Extrinsically doped LSPR TCO materials [9] are more advantageous than self-doped plasmonic semiconductors [10] owing to their thermal stability up to boiling points of specific thermal fluids (c.a. 250 °C). The strong electric field enhancement in the proximity of LSPR NCs stimulates two-photon absorption processes in coupled dye molecules [11]. The two-photon absorption would be facilitated by fine tuning strategies for the near-infrared LSPRs—as the plasmonic absorbance or scattering peak has to match the double wavelength of the dye transition. The major drawback of ITO materials is the scarcity of indium, generally comparable to that of noble metals, but with much fewer recycling and recovery techniques available to date [12]. Recently invented fluoride and indium co-doped cadmium oxide [13] LSPR NCs are less indium consuming, but will presumably fail in meeting the RoHS requirements because even the current exceptions for cadmium (e.g., solar PV modules) are questionable to be renewed. Owing to the cheapness, facile processes of syntheses, and plasmonic properties closely matching the ITO materials, antimony-doped tin oxide (ATO) is a perfect substitute for the applications described above [14,15,16]. Despite belonging to an ultra-wide bandgap semiconductor class, tin dioxide (TO) possesses good thermal conductivity and carriers’ mobility; the aliovalent and self-doping of TO offers the opportunity for efficient carrier concentration control [17]. The Haase group introduced plasmonic ATO NCs [18] in 1999. The three-stage procedure of the ATO NCs’ preparation includes room-temperature synthesis of low-degree crystalline templates, their subsequent purification, and aqua/solvothermal crystallization of fine NCs. Those findings were widened by Weller et al. [19,20,21], introducing several competing strategies to control the plasmon peak wavelengths, i.e., by changing the free carrier concentration in ATO NCs. In more detail, the ATO LSPRs were affected by (i) the antimony doping level; (ii) oxidation/reduction of Sb ions, i.e., by balancing the acceptor/donor () ratio; (iii) by size-control of NCs, i.e., surface/bulk atoms ratio in the NCs indirectly determining the depletion layer thickness; and (iv) additional doping of ATO by oxygen vacancies. The synergy of these four processes allows to tune LSPR pre and during the synthetic procedures, but limits the post-synthetic plasmon control to NC aging effects. Here, we demonstrate the fine-tuning of the LSPR via the choice of ligands in ATO NC solids at the pre- or post-deposition stages, wherein the typical tuning strategy of screening the appropriate dielectric constant of the surrounding medium is generally restricted. We fabricate ATO NCs by the facile solvothermal route; provide their month-scale colloidal stability in polar and nonpolar solvents; and finely tune their LSPRs in spin-casted NC films, enabling the future replacement of their expensive and/or toxic active infrared counterparts.
2. Materials and Methods
2.1. Chemicals
Metallic granular tin (Sn, 99.5+%), antimony (III) oxide (Sb2O3, 99%), N-methylformamide (HCONHCH3, 99%), antimony(III) chloride (SbCl3, ≥99.0%), antimony(III) bromide (SbBr3, 99.99%), antimony(III) iodide (SbI3, 98%), zinc chloride (ZnCl2, ≥98%), iron(II) chloride (FeCl2, 98%), methylammonium bromide (CH6BrN, ≥99%, anhydrous), lead(II) bromide (PbBr2, 99.999%), cobalt(II) chloride (CoCl2, ≥98.0%), phosphotungstic acid hydrate (H3[P(W3O10)4]·xH2O (HPW), reagent grade), phosphomolybdic acid hydrate (H3[P(Mo3O10)4]·xH2O (HPMO), ACS reagent), indium triiodide (InI3, anhydrous, 99.998%), 4-(Hydroxymethyl)benzoic acid (HOCH2C6H4CO2H, 99%, BNZ), nitrosyl tetrafluoroborate (NOBF4, 95%), and 1,2-ethanedithiol (HSCH2CH2SH, ≥98.0% (GC)) were received from Sigma-Aldrich (Merck KGaA, Darmstadt, Germany). Oleylamine (OA, CH3(CH2)7CH = CH(CH2)8NH2, 80–90% of C18 chains) was bought from Acros Organics (Fisher Scientific GmbH, Schwerte, Germany). Absolute ethanol (ACS grade), nitric acid (ACS grade), n-hexane, tetrachlorethylene (TCE), and toluene were supplied by Merck (Merck KGaA, Darmstadt, Germany, Alfa Aesar, (Thermo Fisher (Kandel) GmbH, Kandel, Germany) and VWR Chemicals, (VWR International GmbH, Darmstadt, Germany) respectively.
2.2. Syntheses
The synthesis of SbxSnO2 nanocrystals was performed by slightly modifying the procedure proposed by the Gao group [22]. Briefly, metallic tin (0.375 g, 3 mmol) and a required amount of Sb2O3 (0, 0.075, 0.15, 0.3 mmol; for x = 0 (ATO0); 0.05 (ATO5), 0.1 (ATO10), and 0.2 (ATO20), respectively) were mixed with 9 mL of deionized water, then concentrated nitric acid (5.5 mL) was added dropwise. The mixture was stirred at room temperature until the dissolution of solid precursors appeared (it required c.a. 1–3 h). Afterward, the yellow-colored solution was transferred into a 25 mL Teflon-lined steel autoclave, sealed, and heated at 180 °C for 15 h. The obtained blue (white for the undoped tin oxide) precipitates were separated by centrifugation (10 min at 6000 rpm) and washed twice with deionized water, pure ethanol, and toluene each. At this point, c.a. 200 μL of oleylamine (OA) was added dropwise; a gentle shaking instantly removes the NC solution’s turbidity and makes it optically clear (Video S1). One can observe that, without the help of amines, the NCs precipitate within minutes. The following NC washing by ethanol, centrifugation, and redispersion was repeated at least three times to remove the excess of OA. Finally, the NCs were redissolved in 5 mL of toluene, hexane, or tetrachlorethylene and filtered through a 0.1 µm PTFE filter.
2.3. Ligand Exchange Procedure
The biphasic ligand exchange was a minorly adjusted procedure from [23]. Briefly, 150 µmol of inorganic salts or short organic molecules and 100 mg/mL ATO NC solution were used to obtain concentrated solutions of plasmonic NCs. To the 1 mL solution of inorganic salts in NMF (or DMF for NOBF4), 1 mL hexane solution of ATO NCs was added, and the mixture was stirred vigorously for 12 h. Note that the ligand exchange occurs almost instantaneously (for SbCl3 within 3 min), but the solutions were left to stir overnight to ensure that the ligand exchange occurs entirely. After that, 1 mL of hexane was added, followed by the subsequent addition of 3 mL of acetone (in the case of NOBF4 in toluene), then the reaction mixture was centrifuged for 10 min at 6000 rpm. Washing was performed three times to ensure the complete removal of organic ligands. Finally, SbxSnO2 was redispersed in a proper polar solvent (NMF or DMF) with 100 mg/mL concentration. Those solutions are stable for at least one week without observable agglomeration of NCs.
The post-deposition ligand exchange procedure from oleylamine to EDT (1,2-Ethanedithiol) followed by a subsequent oleylamine removal from NC films based on ATO nanocrystals was performed similarly to the procedure reported in [7].
2.4. Characterization
XRD patterns were recorded in the 2Θ range 20–70° with a step size of 0.01° from precipitated and vacuum-dried NC powders (c.a. 500 mg) on a Malvern Pananlytical (Kassel, Germany) diffractometer of an Empyrean Series equipped with copper anode operating at 40 kV acceleration voltage and 30 mA current. The obtained data were processed using the JCPDS record #41-1445 for undoped cassiterite tin oxide lattice as a starting iteration.
UV/Vis/NIR absorbance was measured by a LAMBDA 950 spectrometer (Perkin Elmer, Rodgau, Germany) with a PbS IR detector operating from 900 up to 3300 nm. For the measurements, we used diluted (c.a. 5 mg/ mL) NC tetrachlorethylene solutions (in a 10 mm light pass quartz cuvette) and NC films, spin-casted from concentrated (c.a. 100 mg/mL) NC solutions. The procedure was as follows: 125 μm thick glass microscope covers were sequentially washed in an ultrasonic bath by distilled water, acetone, and isopropanol at 60 °C for 10 min. The NC films were triple spin-casted (Ossila spin caster) at 1000 rpm for 30 s. Each casting was followed by 10 min annealing at 110 °C to dense the NCs. For transmission (TEM), scanning electron microscopy (SEM), as well as energy-dispersive X-ray spectroscopy (EDX), we used JEM-1400 Plus and a JEOL JSM7610 instrument (both from JEOL Germany GmbH, Freising, Germany), respectively. Samples for TEM and SEM (EDS) measurements were prepared by drop-casting of diluted NC solution (c.a. 10 mg/mL) on carbon-coated copper grids and silicon wafers, respectively. Differential thermal analysis was performed on a TG 209F1 Libra thermobalance (NETZSCH-Gerätebau GmbH, Selb, Germany). Dynamic light scattering was recorded for NC solutions in PSC115 and ZEN1002 cuvettes using Nano series ZetaSizer from Malvern Pananlytical (Kassel, Germany). X-ray photoelectron spectroscopy (XPS) was performed on drop-casted and dried NC films on Au-coated glass slides with a Theta Probe system from ThermoFisher Scientific, Dreieich, Germany, equipped with a monochromated Al Kα X-ray source (1486,7 eV) and a dual flood gun, which provides low kinetic energy electrons and Ar-ions for efficient charge compensation of the sample surface. The pass energy of the hemispherical analyzer in the constant analyzer energy mode was set to 50 eV for the XPS high-resolution (HR) scans and the energy step size was set to 0.05 eV. An X-ray spot size of 400 µm on the sample surface was chosen for the measurements. Charge referencing of the spectra was obtained by adjusting the contribution of adventitious carbon in the C 1s photoelectron peak to 285 eV. System operation, data evaluation, and peak fitting were performed with the Avantage software package, provided by the manufacturer.
3. Results and Discussion
3.1. ATO Nanocrystals Exhibiting Localized Surface Plasmon Resonances
The synthesis of ATO nanocrystals starts with the complete dissolution of metallic tin in a mixture of nitric acid and water (Equation (1)), with unreacted antimony (III) oxide at room temperature. No color change or dissolution of the antimony oxide is observed owing to the insufficient reaction temperature required to oxidize Sb3+ to Sb5+ [24].
4 Sn+10 HNO3(dilute) → 4 Sn(NO3)2 + NH4NO3 + 3 H2O
2 Sn(NO3)2) → 2SnO + 4NO2 + O2
2 SnO + O2 → 2SnO2
Sb2O3 + 4 HNO3 → Sb2O5 + 4 NO2 + 2 H2O
Once the reaction mixture is loaded into an autoclave and the required reaction temperature of 180 °C is reached, tin nitrate (Sn(NO3)2) is thermally decomposed (Equation (2)) and subsequently oxidized to SnO2 in a closed system [25]. At the same time, antimony oxide (Sb2O3) reacts at room temperature with nitric acid as a hard oxidizer and gives antimony (V) oxide, Sb2O5 (Equation (4)) [26].
The used solvothermal synthesis of the ATO provides stable colloidal NC solutions with various colors between white and dark blue, dependent on the Sb doping concentration (Figure 1a). The doped (20% antimony) sample’s dimensions were first checked by dynamic light scattering (DLS, Figure S1), providing that the scattering objects have hydrodynamic diameters ranging from 8 to about 40 nm, with the maximum of their size distribution at 11.5 nm. The NC diameter is smaller than that because the aggregation of NCs and the OA ligand shell contribute to their hydrodynamic dimensions. To obtain more precise information, TEM was performed, revealing that the NCs exhibit somewhat irregular shapes (Figure 1b); however, with relatively narrow size distributions (Figure 1c). For instance, the NCs from a batch with a nominal Sb concentration of 20% exhibit a mean size of 5.3 ± 1.3 nm, as manually evaluated from the transmission electron microscopic images. As also found previously [16], the NC size slightly increased for batches with a lower antimony content, and their size distribution became broader (up to 7.1 ± 1.6 nm for undoped SnO2 NCs) (Figure 1c).
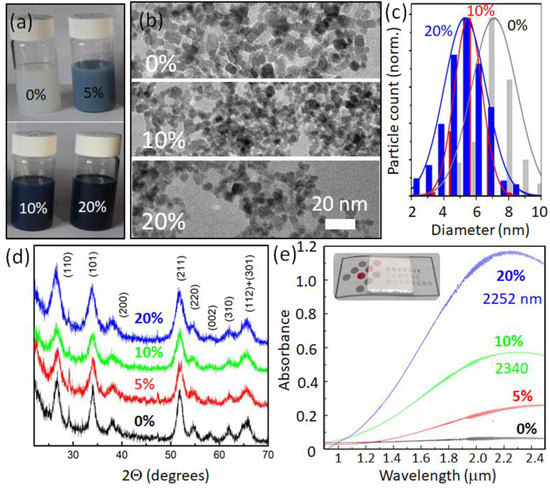
Figure 1.
Synthesized ATO nanocrystals. (a) Photo of the colloidal solutions of OA capped NCs for various doping concentrations given in atomic per cents (100 mg/mL in toluene). (b) TEM images, (c) size distribution histograms, (d) XRD patterns of ATO NCs with various nominal Sb concentrations, and (e) infrared absorbance of ATO NC films (a typical film on a glass substrate is shown in the inset). Next to the nominal doping concentrations, the LSPR resonance wavelengths are provided for the 20% and 10% curves.
The elemental compositions of the NCs were evaluated by EDX analysis within several areas of drop-casted ATO (TO) layers prepared on Si substrates (Table S1). All EDX-spectra provide slightly higher Sb/Sn ratios than used in the syntheses. Over-stoichiometric oxygen can be explained by the storage and deposition of the NCs in ambient conditions; the ligand shell also provides traces of carbon and nitrogen.
According to the international center of diffraction data, the NCs’ crystalline structure was proven to be the cassiterite modification of tin oxide (JCPDS 41-1445). The observed diffraction reflexes (Figure 1d) perfectly match the specific dhkl distances for the orthorhombic SnO2 crystal structure (with a = 0.4725 nm and c = 0.3242 nm for the undoped sample). The lattice parameters are only slightly altered for higher tin oxide doping by Sb to a = 0.4717 and c = 0.3231 nm for 20% Sb concentration. Such an almost neglectable dependence of lattice parameters versus the quantity of inserted antimony can be explained, as the host Sn4+ ions are substituted simultaneously by both larger (Sb3+) and smaller (Sb5+) ions [15,27], so that the averaged lattice constant remains almost unchanged. The Sherrer method for the widened XRD peaks (Figure 1d) revealed that crystallite’s mean sizes varied almost linearly from 8.9 nm for undoped SnO2 NCs down to 6.3 nm for Sb0.2SnO2. Those values are close to what we measured from the TEM images.
The localized surface plasmon resonances in extrinsically doped transparent conducting oxide NCs are primarily tunable by the dopant concentration. Thus, we have inspected the series of ATO NC materials synthesized with the different antimony/tin precursors molar ratios. All synthesized NCs (except the undoped tin oxide NCs) are characterized by strong IR absorption, starting at longer wavelengths than that of the absorption edge owing to the bandgap (Figure S2). The NC solution coloration is gradually changed from opal white to several shadows of blue (Figure 1a). Infrared optical absorption reveals the electronic parameters for such heavily doped NCs. The optical absorbance spectra were collected on spin-casted NC films deposited on glass slides and heat-treated to dense NCs (inset in Figure 1e). For the ATO sample with 20% Sb, an explicit resonance peak is observed at a wavelength of 2252 nm (Figure 1e). The peak of the ATO sample with 10% Sb is slightly shifted to the red (to ~2340 nm), in agreement with the observations reported in [28]. Note that increasing the antimony precursor concentration to higher molar rations than 20% (25% and 30%) results in a redshift of the localized surface plasmon resonance, up to 2450 nm (Figure S3). This is attributed to an increased compensation between p- and n-type doping, by an increase in the doping ratio, resulting in a decrease in the overall electron concentration. Antimony guest ions substitute tin in the host lattice in different oxidation states by surface Sb3+ and Sb5+ [16; 27]. As discussed above, higher doping results in smaller NCs, and thus in a higher surface/volume atom ratio, also changing the dopant ratio. The deposition of the NCs on the substrate alters the infrared absorbance properties only slightly, indicating that the dielectric permittivity of the material surrounding the localized surface plasmon hardly changes. This might result from a surface depletion layer surrounding the plasmon confined in the core of the NCs, as described by the Milliron group for highly doped ITO NCs in [29]. This outer depletion layer makes the localized plasmon resonance much less sensitive to the dielectric permittivity of the NCs’ environment. Thus, there is only a small overall redshift of the localized surface plasmon resonance peak after deposition compared with the corresponding resonance in solution (Figure S3). The localized surface plasmon resonance tuning by doping with Sb is limited because of the compensation effect and a surface depletion layer formation. The maximum achieved doping concentration can be determined from the peak position ωsp and full width at half maximum γ of the resonance from the NCs, doped by 20% of Sb, via [30].
Here, εm is the dielectric permittivity of the plasmon confining medium, which is assumed to be the ATO depletion layer, providing a value of 3.9 [21], and the effective mass of electrons (meff) in ATO is calculated in [31]. The estimated free carrier density of 6.7 × 1020 cm−3 corresponds to 53 electrons per nanocrystals, assuming uniform doping of the SnO2. This means that a bit less than 1/5 of the Sb ions incorporated into the tin oxide lattice (about 270 per NC) contributed effectively to free and uncompensated electrons in the conduction band. This ratio decreases compared with NCs, doped by 10% of Sb (51 free electrons and c.a. 135 Sb ions per NC). Thus, with the tuning of free carriers by increasing antimony concentrations (from 10 up to 20%), only one out of the additional (c.a. 68) Sb ions remains uncompensated and contributes to the overall free carrier growth. For the lower doping of 5% of Sb, the localized surface plasmon resonance shifts further into the infrared (Figure 1e) owing to a lower carrier concentration, similar to [32].
3.2. Tuning the Localized Surface Plasmon Resonance by Ligand Exchange
Besides increasing the carrier concentration in the bulk of the material by substitutional atoms such as the Sb replacing the Sn, in NCs, the carrier concentrations can also be altered by deposition of charges on the NCs’ surface; for instance, via attachment of appropriate ligands [3,33]. While there are many possible molecules stabilizing ATO in polar solvents [15,16], here, we are restricted to rather “short” species, having the potential to allow electrical transport in NC films. Thanks to their success in quantum dot optoelectronic devices, we have chosen to test several metal-halides (antimony (III) halides SbX3, with X = Cl, Br, I; indium (III) iodide InI3; transition-metal-dichlorides MCl2, with M = Zn, Fe, Co), two acid hydrates (phosphotungstic acid hydrate HPW and phosphomolybdic acid hydrate HPMO), and a (4-(Hydroxymethyl)benzoic acid BNZ). Furthermore, we have tested boron tetrafluoride BF4 and 1,2-ethanedithiol EDT, because these ligands have been used to make LSPR NC electrodes in electrochromic windows and field effect transistors [7,34]. The EDT ligands were exchanged after deposition of the NCs on the glass substrates, whereas all others were exchanged in solution. With these small ligands, ATO NCs with an Sb concentration of 20% could be dispersed in polar solvents (Figure 2a), such as DMF and NMF. The short ligands significantly alter the localized surface plasmon resonance peak (Figure 2b). For several ligands, it becomes reduced in intensity and red-shifted in wavelengths (i.e., HPW, HPMO, BNZ, BF4) with respect to the resonance observed after heat treating a film of NCs with OA ligands. The observed redshifts with respect to OA capped NCs with the LSPR at 2252 nm (Figure 2) originate from interactions between Lewis-acid ligands and NCs. Such oxidizing ligands withdraw electrons from the NCs, decreasing the NCs’ free carrier concentrations and lowering their colloidal stability [35].
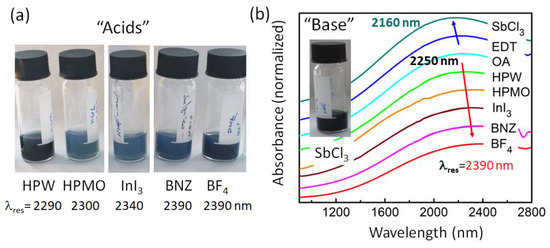
Figure 2.
ATO NCs with an Sb doping concentration of 20% after ligand exchange to electron withdrawing (“acids”) and electron donating (“bases”) small ligands. (a) Photo of the colloidal solutions after exchanging OA ligands by the ligands indicated below the photos. Given are also the measured resonance wavelengths of the LSPRs. (b) Infrared absorbance spectra of NCs’ films with various ligand species on a normalized scale. For clarity, the origins of each spectra are shifted in the y-direction. The inset shows a photo of NCs covered by SbCl3 as a ligand.
Some ligands change the color of the colloidal solution more drastically than HPW, HPMO, BNZ, or BF4, from bluish (ZnCl2) into dark green-black (FeCl2) or blue-black (CoCl2) (Figure 3a). After film deposition, however, their LSPRs exhibit roughly the same amounts of red shifts as those exhibited by the other Lewis acid ligands (Figure 3b), suggesting that electrons have been withdrawn from NCs as effectively as by the conventional oxidizing ligand BF4 [36]. The stronger coloration of the colloidal solutions might be caused by some residuals of the metal-chloride salts used for ligand exchange, being colored themselves.
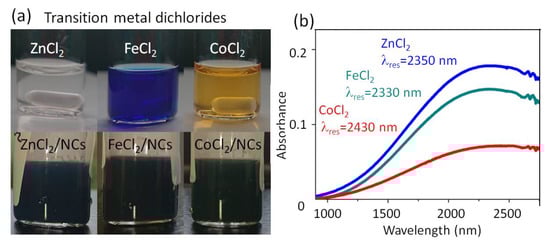
Figure 3.
ATO NCs with a Sb doping concentration of 20% after ligand exchange to transition metal dichloride ligands. (a) Photo of ZnCl2, FeCl2, and CoCl2 dissolved in NMF (upper row) and of the NCs after completed ligand exchange (lower row). (b) Infrared absorbance spectra of NCs’ films with various ligand species, also providing the LSPR wavelengths.
In contrast to the ligands discussed above, the ethanedithiol ligands represent a weak Lewis base, and the treated NC film exhibits a minimal blue shift of the localized surface plasmon resonance (Figure 2b) regarding the OA capped NCs. This effect is even more pronounced for antimony-halides (SbX3, X = I, Br, Cl), resulting in a larger blueshift of the LSPR of up to 100 nm and an enhancement of the plasmon intensity (Figure 2b and Figure S4). Similar blueshifts of LSPRs have also been obtained in ATO NCs, initially doped by 10% antimony. These blue shifts are enabled because, in trivalent antimony halides, two outer s and one p electron of Sb are bonded by three halide anions so that two unpaired p-electrons remain, which can be provided to the NCs, where they might also increase the free carrier concentration. Using the chemical geometry optimization builder Avogadro [37], the possible NC–ligand interactions resulting in electron donation are sketched in Figure 4a.
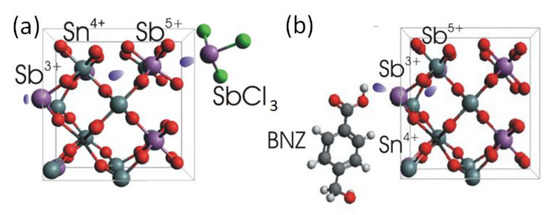
Figure 4.
Sketches of the charge transfer via typical donating and accepting ligands attached to the ATO NC surfaces: optimized geometry of (a) SbCl3 and (b) BNZ ligands in the stick-ball model and tentative electron density transfers.
The Sb3+ ions of the antimony trichloride ligands donate their lone p-electron pair when attaching to the NCs’ surface (Figure 4a). When attached at the surface, a charge transfer transition between Sb3+ and Sb5+ may occur [18], accommodating additional electrons within the NC. The other ligand providing a blue-shifting of the localized plasmon resonance, namely EDT, behaves similarly to long-chain thiols reported in [38]. The thiol molecule donates the sulfur lone electron pair to the lattice cation, thus increasing the NCs’ electron density. A sketch of the opposite situation, where the ligand exchange results in a redshift of the localized surface plasmon resonance by decreasing the electron density in the NCs, is shown in Figure 4b. The red-shifting ligands are conventional Bronsted–Lowry or Lewis acid-type of molecules (simply called “acids” in Figure 2). Acidic ligands coordinated by polarized hydroxyl groups bind to the electron enriched and undercoordinated Sb3+ ions on the NCs’ surface, similarly as described in [38]. The depleted hydrogens are attracted and trap the lone electrons of the Sb3+, initiating an Sb5+→Sb3+ transition (Figure 4b) to rebalance the NCs’ charge neutrality, thus decreasing the overall NCs’ electron concentration. In the proton-free Lewis acid ligands, e.g., in InI3, the electron-depleted indiums are in their highest possible oxidized form (likewise for the other metals in halides, Figure 3 and Figure S4), thus also accepting electrons from an NC. This is similar to the case of LSPRs in ITO NCs when the surface is functionalized by the tungsten (VI) complexes [34], also resulting in a redshift of plasmon transitions. When comparing the donation abilities of different antimony halides (Figure S4), the smaller chemical potential of reducing ligands causes less electron density to be transferred to the NCs [35]. Considering that chemical potential is the negative value of the molar Gibbes free energy reported in [39] for SbCl3: ΔfG0 = −323 kJ/mol, SbBr3: ΔfG0 = −259 kJ/mol, and SbI3: ΔfG0 = c.a.−100 kJ/mol, explains the higher reducing ability of antimony chloride than bromide and iodide. In other words, the chlorine ions electrostatically repulse the lone electron pair of antimony more than bromine and iodine. In fact, for the SbCl3 ligands, we found the highest blue shift of the LSPR among all tested ligands, which is thus an extreme case. The ligand exchange procedure to SbCl3 neither changed the NCs’ dimensions (Figure 5a–d), nor caused a shift in the diffraction reflexes, nor widened them (Figure 5e). Thus, surface antimony from ligands provides additional charges without incorporating into the NCs’ bulk, and does not forms an epitaxial shell of thicknesses to be detected by XRD. As stated already above, the charge transfer from the ligands to the NCs operates not only for the 20% doped samples, but also for those with a lower Sb concentration (Figure 5f).
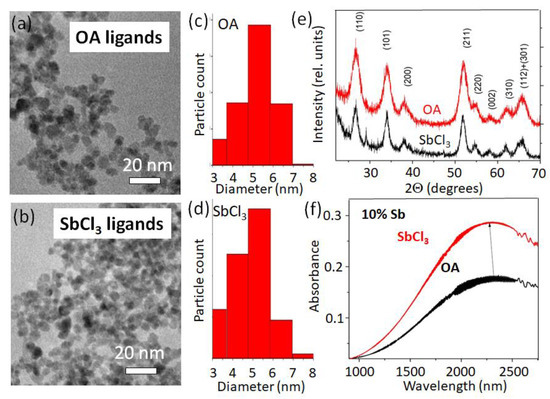
Figure 5.
ATO NCs upon ligand exchange to SbCl3. (a,b) TEM images of 20% doped ATO NCs before and after ligand exchange with (c,d) their corresponding size distributions and (e) X-ray diffraction spectra. (f) LSPR shift of ATO NCs with a 10% doping concentration upon ligand exchange.
To judge the efficiency of the charge transfer doping from the ligands towards the NCs, the number of attached ligands have to be quantified. For that purpose, TGA measurements were performed and analyzed (Figure S5). In detail, the grafting density, i.e., the number of molecules on the particle surface, was calculated as follows:
where wt stands for the percentage of mass loss, NA (6.022 × 10²³ mol−1) for the Avogadro constant, MW for the molecular weight of the surfactant, and SSA for the specific surface area in nm2/g of nanoparticles. The SSA was determined under the assumption of spherical particles with an average diameter of 5.3 ± 1.3 nm (measured by TEM) and a density of 6.8 g/cm3. The numbers in Table 1 suggest that the quantity of SbCl3 ligands is ~80% of that of the initial OA ligands.

Table 1.
Ligand attachment and its effect on carrier concentration.
By evaluating the carrier concentrations from the measured plasmon peak energies, the observed blue shifts result clearly from doping via charge transfer from the ligands to the NCs. The comparison of the number of SbCl3 ligands attached with the increase in carriers per nanocrystal evidences that a relatively high portion of them contributed to the electron donation to the ATO NC free carriers. Indeed, the overall number of carriers per NC increased by up to six excess electrons during ligand exchange from OA to SbCl3. This well correlates with the data from [36], wherein the LSPR NCs of comparable mean sizes underwent ligand exchanges from long OA to short inorganic ligands of an oxidizing/reducing nature. Thus, the doping efficiency of surface antimony chloride is about 3.5%. The rest of the ligands are probably required to maintain the colloidal stability of the NC solutions, which would not be the case if a substantially higher number of ligands would take part in the electron transfer to the NCs [33]. The doping efficiency of 3.5% from the antimony ligands is considerably lower than the averaged doping efficiency obtained by aliovalent doping. However, as discussed above, increasing the Sb concentration by aliovalent doping to >20% results in an effective decrease in the electron concentration owing to compensation effects, thus the doping efficiency becomes a negative value. Doping by ligands representing Lewis bases is apparently not restricted as much as by dopant compensation, and allows an increase in electron concentration further than that by aliovalent doping.
Finally, we want to mention that doping of tin oxide by Sb ions is strongly correlated to the difference between Sb5+ and Sb3+. Within bulk, Sb3+ represents an acceptor occupied by an electron from the valence band and Sb5+ represents an ionized donor. Thus, quantifying Sb3+ to Sb5+ ratios or better differences should correlate to the observed carrier concentration. Attaching SbCl3 ligands complicates this evaluation because, in this case, Sb3+ is present at the surface if no charge transfer occurred to the NCs. By XPS, different spectra are thus obtained for the NCs before and after ligand exchange (Figure S6), which basically confirms the results from the EDS (Table S1) and evidences the successful ligand exchange by quantifying the increase in the Sb concentration after ligand exchange. Unfortunately, however, in the XPS spectra, the spin-orbit split part of the core Sb level, namely the peak resulting from Sb 3d5/2, overlaps with the O 1s peak, hampering any quantification of oxygen atoms bound to Sb3+ or Sb5+ [16,40]. There is also a less intense peak originating from the Sb 3d3/2 spin state (Figure S7), which exhibits an asymmetric shape for the ATO NCs with a concentration of 20%, similar to that in [15,16]. The lower energy band is frequently correlated to Sb3+ and the one at a higher energy to Sb5+, irrespective of their accurate peak energies. However, in a recent publication of C. Liu et al. [41], an alternative assignment is presented. From a comparison of the principal peak with the known binding energies measured in Sb2O5, Sb2O4, and Sb2O3, it is concluded that this peak has to be ascribed to a mixed Sb3+/Sb5+ valency and the side peak at a higher energy is due to a disordered many-body-effect screening mechanism [42,43]. Such a many body-effect can also be the free electrons in the conduction band, causing the plasmon resonance, which is directly observed here in the infrared transmittance.
4. Conclusions
The solvothermal synthesis of ATO provides nanocrystals with nm sizes, exhibiting LSPRs in the infrared, dependent on the doping level. By post-synthetic ligand exchange, not only colloidal stability is achieved, but also tuning of the LSPR energy. Dependent on the chosen type here, the ligand exchange is demonstrated to provide electron transfer, to and from the nanocrystals, resulting in red and blue shifts of the LSPR. The ligand exchange not only allows the fine-tuning of the LSPR energy, but also to obtain doping levels that are not accessible by aliovalent doping of the nanocrystal inorganic core materials. In that respect, the ligand exchange is a powerful tool for LSPR shifting and carrier concentration tuning. The tuning and doping presented here for ATO is certainly not restricted to this particular metal oxide, but will also be adaptable for other nanocrystal species, especially plasmonic ones. Plasmonic tuning, as demonstrated here, could find numerous applications in infrared optical devices, as developed in innovative glazing technologies, for harvesting wasted parts of the solar’s infrared spectrum in energy conversion devices, or applied in infrared driven therapeutics, at least when performed in the medical infrared windows of the light spectrum for which tissues are transparent.
Supplementary Materials
The following supporting information can be downloaded at https://www.mdpi.com/article/10.3390/nano12193469/s1, Figure S1: Hydrodynamic diameter; Figure S2: ATO in the visible; Figure S3: From solution to film; Figure S4: Antimony-halide ligands; Figure S5: Ligand amounts; Figure S6: SbCl3 ligand attachment; Figure S7: SbI and Sb II in XPS; Table S1: Composition.; Video S1: Ligand attachment.
Author Contributions
Conceptualization, W.H. and O.B.; Methodology, C.J.B. and V.W.; Validation, D.S.; Formal Analysis, O.B., O.M., A.B., and D.S.; Investigation, by O.B., O.M., A.B., V.R., H.A.A., N.L., M.S.H., C.J.B., A.E., O.Y., M.Y., and D.S.; Resources, C.J.B. and V.W.; Data Curation, O.B. and O.M.; Writing—Original Draft Preparation, O.B.; Writing—Review and Editing, W.H.; Visualization, W.H., O.M., and O.B.; Supervision, W.H., M.H., C.J.B., and V.W., Project Administration, W.H.; Funding Acquisition, W.H. and O.B. All authors have read and agreed to the published version of the manuscript.
Funding
O.B. acknowledges Deutscher akademischer Austauschdienst DAAD’s for the support in the Short Research Stays for University Academics and Scientists framework, 2021 (ref. No. 57552334). Parts of this work have been performed at the Energy Campus Nürnberg, which is supported from the State of Bavaria via a project for “Smart and electrochromic Windows”. H.A.A. was funded by a full scholarship from the ministry of Higher Education of the Arab Republic of Egypt. M.Y. acknowledges funding from the European Research Counsil (ERC) under the European Union’s Horizon 2020 research and innovation programme (grant agreement No. 852751).
Institutional Review Board Statement
Not applicable.
Informed Consent Statement
Not applicable.
Data Availability Statement
After acceptance of the manuscript, the data will be made available for open access via the OPUS FAU depository of our university.
Conflicts of Interest
The authors declare no conflict of interest.
References
- Jain, P.K.; Huang, X.; El–Sayed, I.H.; El–Sayed, M.A. Noble metals on the nanoscale: Optical and photothermal properties and some applications in imaging, sensing, biology, and medicine. Acc. Chem. Res. 2008, 41, 1578–1586. [Google Scholar] [CrossRef] [PubMed]
- Agrawal, A.; Johns, R.W.; Milliron, D.J. Control of localized surface plasmon resonances in metal oxide nanocrystals. Annu. Rev. Mater. Res. 2017, 47, 1–31. [Google Scholar] [CrossRef]
- Kriegel, I.; Scotognella, F.; Manna, L. Plasmonic doped semiconductor nanocrystals: Properties, fabrication, application and perspectives. Phys. Rep. 2017, 674, 1–52. [Google Scholar] [CrossRef]
- Bhattacharya, C.; Saji, S.E.; Mohan, A.; Madav, V.; Jia, G.; Yin, Z. Sustainable nanoplasmon-enhanced photoredox reactions: Synthesis, characterization, and applications. Adv. Energy Mater. 2020, 10, 2002402. [Google Scholar] [CrossRef]
- Balitskii, O.A. Recent energy targeted applications of localized surface plasmon resonance semiconductor nanocrystals: A mini-review. Mater. Today Energy 2021, 20, 100629. [Google Scholar] [CrossRef]
- Papanastasiou, D.T.; Schultheiss, A.; Muñoz-Rojas, D.; Celle, C.; Carella, A.; Simonato, J.-P.; Bellet, D. Transparent heaters: A review. Adv. Funct. Mater. 2020, 30, 1910225. [Google Scholar] [CrossRef]
- Mashkov, O.; Körfer, J.; Eigen, A.; Yousefi-Amin, A.-A.; Killilea, N.; Barabash, A.; Sytnyk, M.; Khansur, N.; Halik, M.; Webber, K.G.; et al. Effect of ligand treatment on the tuning of infrared plasmonic indium tin oxide nanocrystal electrochromic devices. Adv. Eng. Mater. 2020, 22, 2000112. [Google Scholar] [CrossRef]
- Tunkara, E.; DeJarnette, D.; Muni, M.; Otanicar, T.; Roberts, K.P. Optical properties of colloidal indium tin oxide suspended in a thermal fluid. J. Phys. Chem. C 2018, 122, 5639–5646. [Google Scholar] [CrossRef]
- Tunkara, E.; DeJarnette, D.; Saunders, A.E.; Baldwin, M.; Otanicar, T.; Roberts, K.P. Indium tin oxide and gold nanoparticle solar filters for concentrating photovoltaic thermal systems. Appl. Energy 2019, 252, 113459. [Google Scholar] [CrossRef]
- An, W.; Wu, J.; Zhu, T.; Zhu, Q. Experimental investigation of a concentrating PV/T collector with Cu9S5 nanofluid spectral splitting filter. Appl. Energy 2016, 184, 197–206. [Google Scholar] [CrossRef]
- Furube, A.; Yoshinaga, T.; Kanehara, M.; Eguchi, M.; Teranishi, T. Electric-field enhancement inducing near-infrared two-photon absorption in an indium–tin oxide nanoparticle film. Angew. Chem. Int. Ed. 2012, 51, 2640–2642. [Google Scholar] [CrossRef]
- Thiébaud, E.; Hilty, L.M.; Schluep, M.; Böni, M.H.W.; Faulstich, M. Where do our resources go? Indium, neodymium, and gold flows connected to the use of electronic equipment in Switzerland. Sustainability 2018, 10, 2658. [Google Scholar] [CrossRef]
- Giannuzzi, R.; De Donato, F.; De Trizio, L.; Monteduro, A.G.; Maruccio, G.; Scarfiello, R.; Qualtieri, A.; Manna, L. Tunable near-infrared localized surface plasmon resonance of F, In–codoped CdO nanocrystals. ACS Appl. Mater. Interfaces 2019, 11, 39921–39929. [Google Scholar] [CrossRef] [PubMed]
- da Silva, R.O.; Conti, T.G.; de Moura, A.F.; Stroppa, D.G.; Freitas, L.C.G.; Ribeiro, C.; Camargo, E.R.; Longo, E.; Leite, E.R. Antimony-doped tin oxide nanocrystals: Synthesis and solubility behavior in organic solvents. ChemPhysChem 2009, 10, 841–846. [Google Scholar] [CrossRef]
- Yu, N.; Peng, C.; Wang, Z.; Liu, Z.; Zhu, B.; Yi, Z.; Zhu, M.; Liu, X.; Chen, Z. Dopant-dependent crystallization and photothermal effect of Sb-doped SnO2 nanoparticles as stable theranostic nanoagents for tumor ablation. Nanoscale 2018, 10, 2542–2554. [Google Scholar] [CrossRef] [PubMed]
- Chen, Z.; Xie, Q.; Ding, J.; Yang, Z.; Zhang, W.; Cheng, H. Instant postsynthesis aqueous dispersion of Sb-Doped SnO2 nanocrystals: The synergy between small-molecule amine and Sb dopant ratio. ACS Appl. Mater. Interfaces 2020, 12, 29937–29945. [Google Scholar] [CrossRef]
- Wong, M.H.; Bierwagen, O.; Kaplar, R.J.; Umezawa, H. Ultrawide-bandgap semiconductors: An overview. J. Mater. Res. 2021, 36, 4601–4615. [Google Scholar] [CrossRef]
- Nütz, T.; zum Felde, U.; Haase, M. Wet-chemical synthesis of doped nanoparticles: Blue-colored colloids of n-doped SnO2:Sb. J. Chem. Phys. 1999, 110, 12142. [Google Scholar] [CrossRef]
- Felde, U.Z.; Haase, M.; Weller, H. Electrochromism of highly doped nanocrystalline SnO2:Sb. J. Phys. Chem. B 2000, 104, 9388–9395. [Google Scholar] [CrossRef]
- Rockenberger, J.; Felde, U.Z.; Tischer, M.; Tröger, L.; Haase, M.; Weller, H. Near edge X-ray absorption fine structure measurements (XANES) and extended x-ray absorption fine structure measurements (EXAFS) of the valence state and coordination of antimony in doped nanocrystalline SnO2. J. Chem. Phys. 2000, 112, 4296–4304. [Google Scholar] [CrossRef]
- McGinley, C.; Borchert, H.; Pflughoefft, M.; Al Moussalami, S.; de Castro, A.R.B.; Haase, M.; Weller, H.; Möller, T. Dopant atom distribution and spatial confinement of conduction electrons in Sb-doped SnO2 nanoparticles. Phys. Rev. B 2001, 64, 245312. [Google Scholar] [CrossRef]
- Zhang, J.; Gao, L. Synthesis and characterization of antimony-doped tin oxide (ATO) nanoparticles by a new hydrothermal method. Mater. Chem. Phys. 2004, 87, 10–13. [Google Scholar] [CrossRef]
- Dirin, D.N.; Dreyfuss, S.; Bodnarchuk, M.I.; Nedelcu, G.; Papagiorgis, P.; Itskos, G.; Kovalenko, M.V. Lead halide perovskites and other metal halide complexes as inorganic capping ligands for colloidal nanocrystals. J. Am. Chem. Soc. 2014, 136, 6550–6553. [Google Scholar] [CrossRef] [PubMed]
- Rich, R. Inorganic Reactions In Water; Springer: Berlin-Heidelberg, Germany, 2007; pp. 363–407. [Google Scholar]
- Greenwood, N.N.; Ernshow, A. Chapter 10 Germanium, Tin and Lead. In Chemistry Of The Elements, 2nd ed.; Butterworth-Heinemann: Oxford, UK, 1997; pp. 367–405. [Google Scholar]
- Greenwood, N.N.; Ernshow, A. Chapter 13 Arsenic, Antimony and Bismuth. In Chemistry Of The Elements, 2nd ed.; Butterworth-Heinemann: Oxford, UK, 1997; pp. 547–599. [Google Scholar]
- Jeong, S.M.; Ahn, J.; Choi, Y.K.; Lim, T.; Seo, K.; Hong, T.; Choi, G.H.; Kim, H.; Lee, B.W.; Park, S.Y.; et al. Development of a wearable infrared shield based on a polyurethane–antimony tin oxide composite fiber. NPG Asia Mater. 2020, 12, 32. [Google Scholar] [CrossRef]
- Xu, J.M.; Li, L.; Wang, S.; Ding, H.L.; Zhang, Y.X.; Li, G.H. Influence of Sb doping on the structural and optical properties of tin oxide nanocrystals. CrystEngComm 2013, 15, 3296–3300. [Google Scholar] [CrossRef]
- Zandi, O.; Agrawal, A.; Shearer, A.B.; Reimnitz, L.C.; Dahlman, C.J.; Staller, C.M.; Milliron, D.J. Impacts of surface depletion on the plasmonic properties of doped semiconductor nanocrystals. Nat. Mater. 2018, 17, 710–717. [Google Scholar] [CrossRef] [PubMed]
- Luther, J.M.; Jain, P.K.; Ewers, T.; Alivisatos, A.P. Localized surface plasmon resonances arising from free carriers in doped quantum dots. Nat. Mater. 2011, 10, 361–366. [Google Scholar] [CrossRef]
- Feneberg, M.; Lidig, C.; Lange, K.; White, M.E.; Tsai, M.Y.; Speck, J.S.; Bierwagen, O.; Goldhahn, R. Anisotropy of the electron effective mass in rutile SnO2 determined by infrared ellipsometry. Phys. Status Solidi A 2014, 211, 82–86. [Google Scholar] [CrossRef]
- Chen, Q.; Thimsen, E. Highly conductive Sb–SnO2nanocrystals synthesized by dual nonthermal plasmas. ACS Appl. Mater. Interfaces 2020, 12, 25168–25177. [Google Scholar] [CrossRef] [PubMed]
- Agrawal, A.; Cho, S.H.; Zandi, O.; Ghosh, S.; Johns, R.W.; Milliron, D.J. Localized surface plasmon resonance in semiconductor nanocrystals. Chem. Rev. 2018, 118, 3121–3207. [Google Scholar] [CrossRef] [PubMed]
- Qu, J.; Livache, C.; Martinez, B.; Gréboval, C.; Chu, A.; Meriggio, E.; Ramade, J.; Cruguel, H.; Xu, X.Z.; Proust, A.; et al. Transport in ITO nanocrystals with short- to long-wave infrared absorption for heavy-metal-free infrared photodetection. ACS Appl. Nano Mater. 2019, 2, 1621–1630. [Google Scholar] [CrossRef]
- Tandon, B.; Shubert-Zuleta, S.A.; Milliron, D.J. Investigating the role of surface depletion in governing electron-transfer events in colloidal plasmonic nanocrystals. Chem. Mater. 2022, 34, 777–788. [Google Scholar] [CrossRef]
- Palomaki, P.K.B.; Miller, E.M.; Neale, N.R. Control of plasmonic and interband transitions in colloidal indium nitride nanocrystals. J. Am. Chem. Soc. 2013, 135, 14142–14150. [Google Scholar] [CrossRef] [PubMed]
- Hanwell, M.D.; Curtis, D.E.; Lonie, D.C.; Vandermeersch, T.; Zurek, E.; Hutchison, G.R. Avogadro: An advanced semantic chemical editor, visualization, and analysis platform. J. Cheminform. 2012, 4, 17. [Google Scholar] [CrossRef]
- Balitskii, O.A.; Sytnyk, M.; Stangl, J.; Primetzhofer, D.; Groiss, H.; Heiss, W. Tuning the localized surface plasmon resonance in Cu2–xSe nanocrystals by postsynthetic ligand exchange. ACS Appl. Mater. Interfaces 2014, 6, 17770–17775. [Google Scholar] [CrossRef]
- Wagman, D.D.; Evans, W.H.; Parker, V.B.; Schumm, R.H.; Halow, I.; Bailey, S.M.; Churney, K.L.; Nuttall, R.L. The NBS tables of chemical thermodynamic properties. Selected values for inorganic and C1 and C2 organic substances in SI units. J. Phys. Chem. Ref. Data 1982, 11, 2. [Google Scholar]
- Lv, Z.; Li, J.; Yang, F.; Cao, K.; Bao, Q.; Sun, Y.; Yuan, J. Antimony-doped tin oxide nanocrystals for enhanced photothermal theragnosis therapy of cancers. Front. Bioeng. Biotechn. 2020, 8, 673. [Google Scholar] [CrossRef]
- Liu, C.; Félix, R.; Forberich, K.; Du, X.; Heumüller, T.; Matt, G.J.; Gu, E.; Wortmann, J.; Zhao, Y.; Cao, Y.; et al. Utilizing the unique charge extraction properties of antimony tin oxide nanoparticles for efficient and stable organic photovoltaics. Nano Energy 2021, 89, 106373. [Google Scholar] [CrossRef]
- Egdell, R.G.; Walker, T.J.; Beamson, G. The screening response of a dilute electron gas in core level photoemission from Sb-doped SnO2. J. Electron Spectrosc. Relat. Phenom. 2003, 128, 59–66. [Google Scholar] [CrossRef]
- Cox, P.A.; Egdell, R.G.; Harding, C.; Patterson, W.R.; Tavener, P.J. Surface properties of antimony doped tin (IV) oxide: A study by electron spectroscopy. Surf. Sci. 1982, 123, 179–203. [Google Scholar] [CrossRef]
Publisher’s Note: MDPI stays neutral with regard to jurisdictional claims in published maps and institutional affiliations. |
© 2022 by the authors. Licensee MDPI, Basel, Switzerland. This article is an open access article distributed under the terms and conditions of the Creative Commons Attribution (CC BY) license (https://creativecommons.org/licenses/by/4.0/).